

A 48-Channel High-Resolution Ultrasound Beamforming System for Ultrasound Endoscopy Applications


Abstract
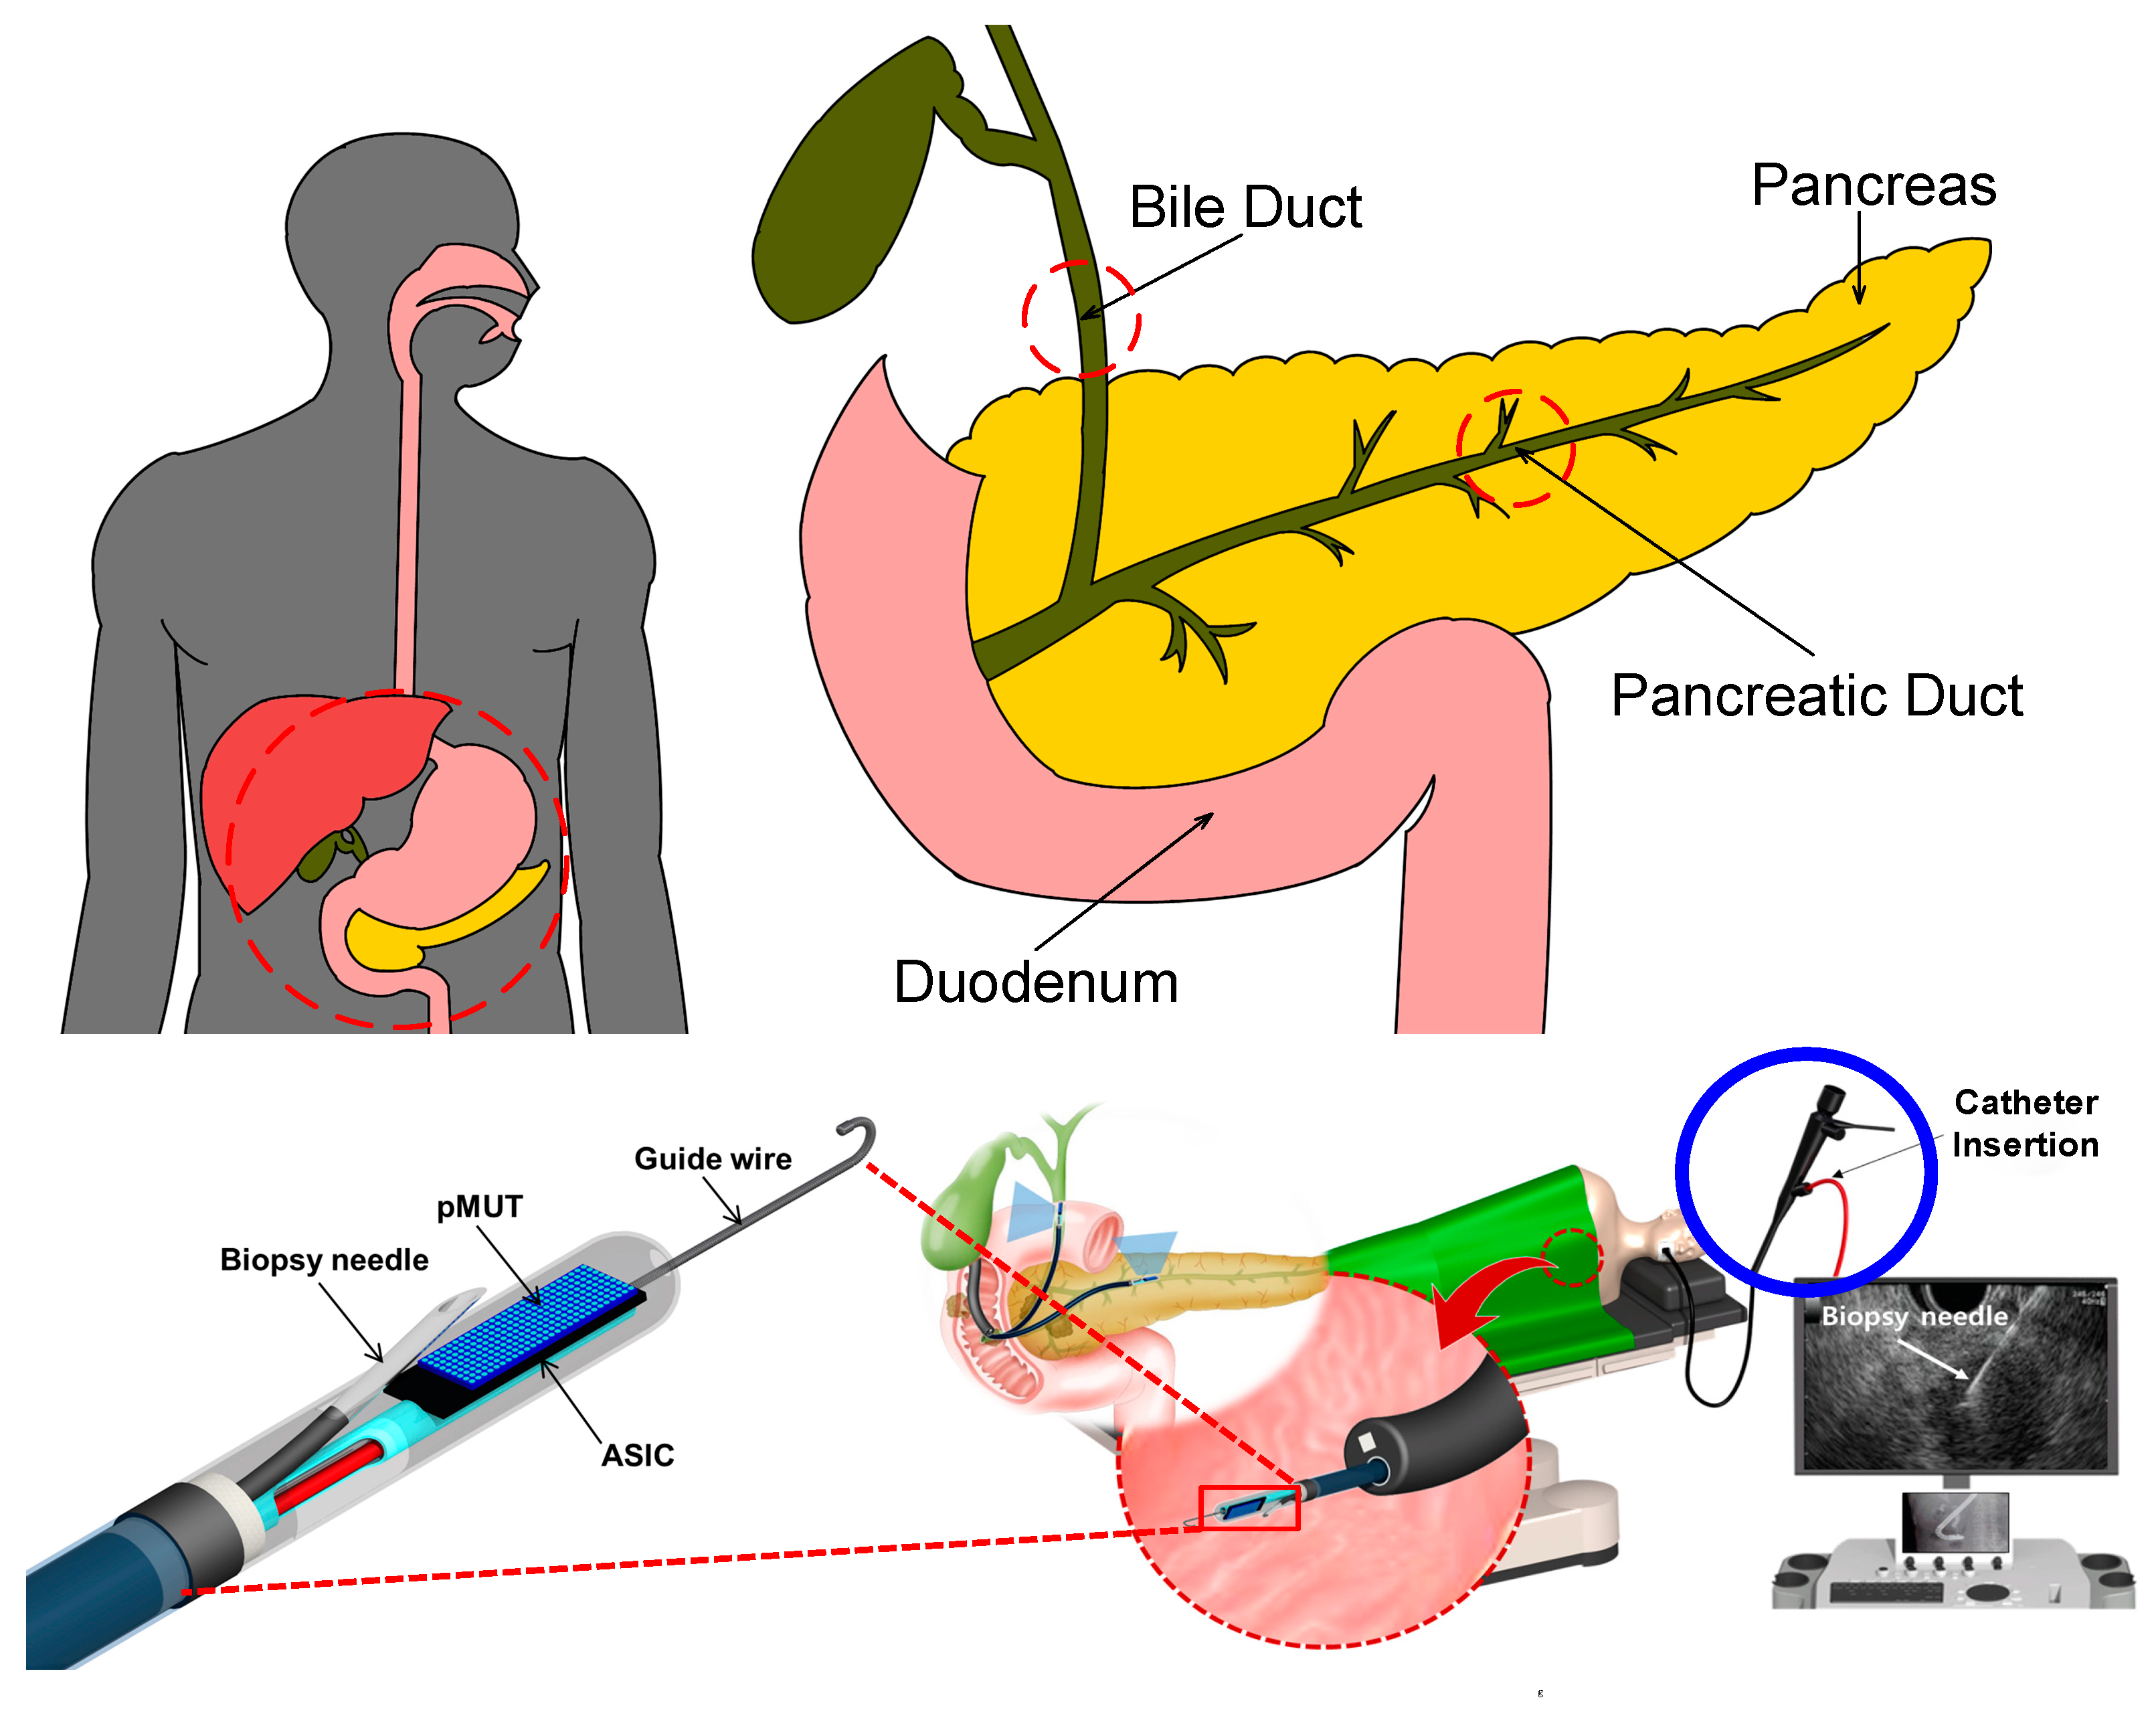
1. Introduction
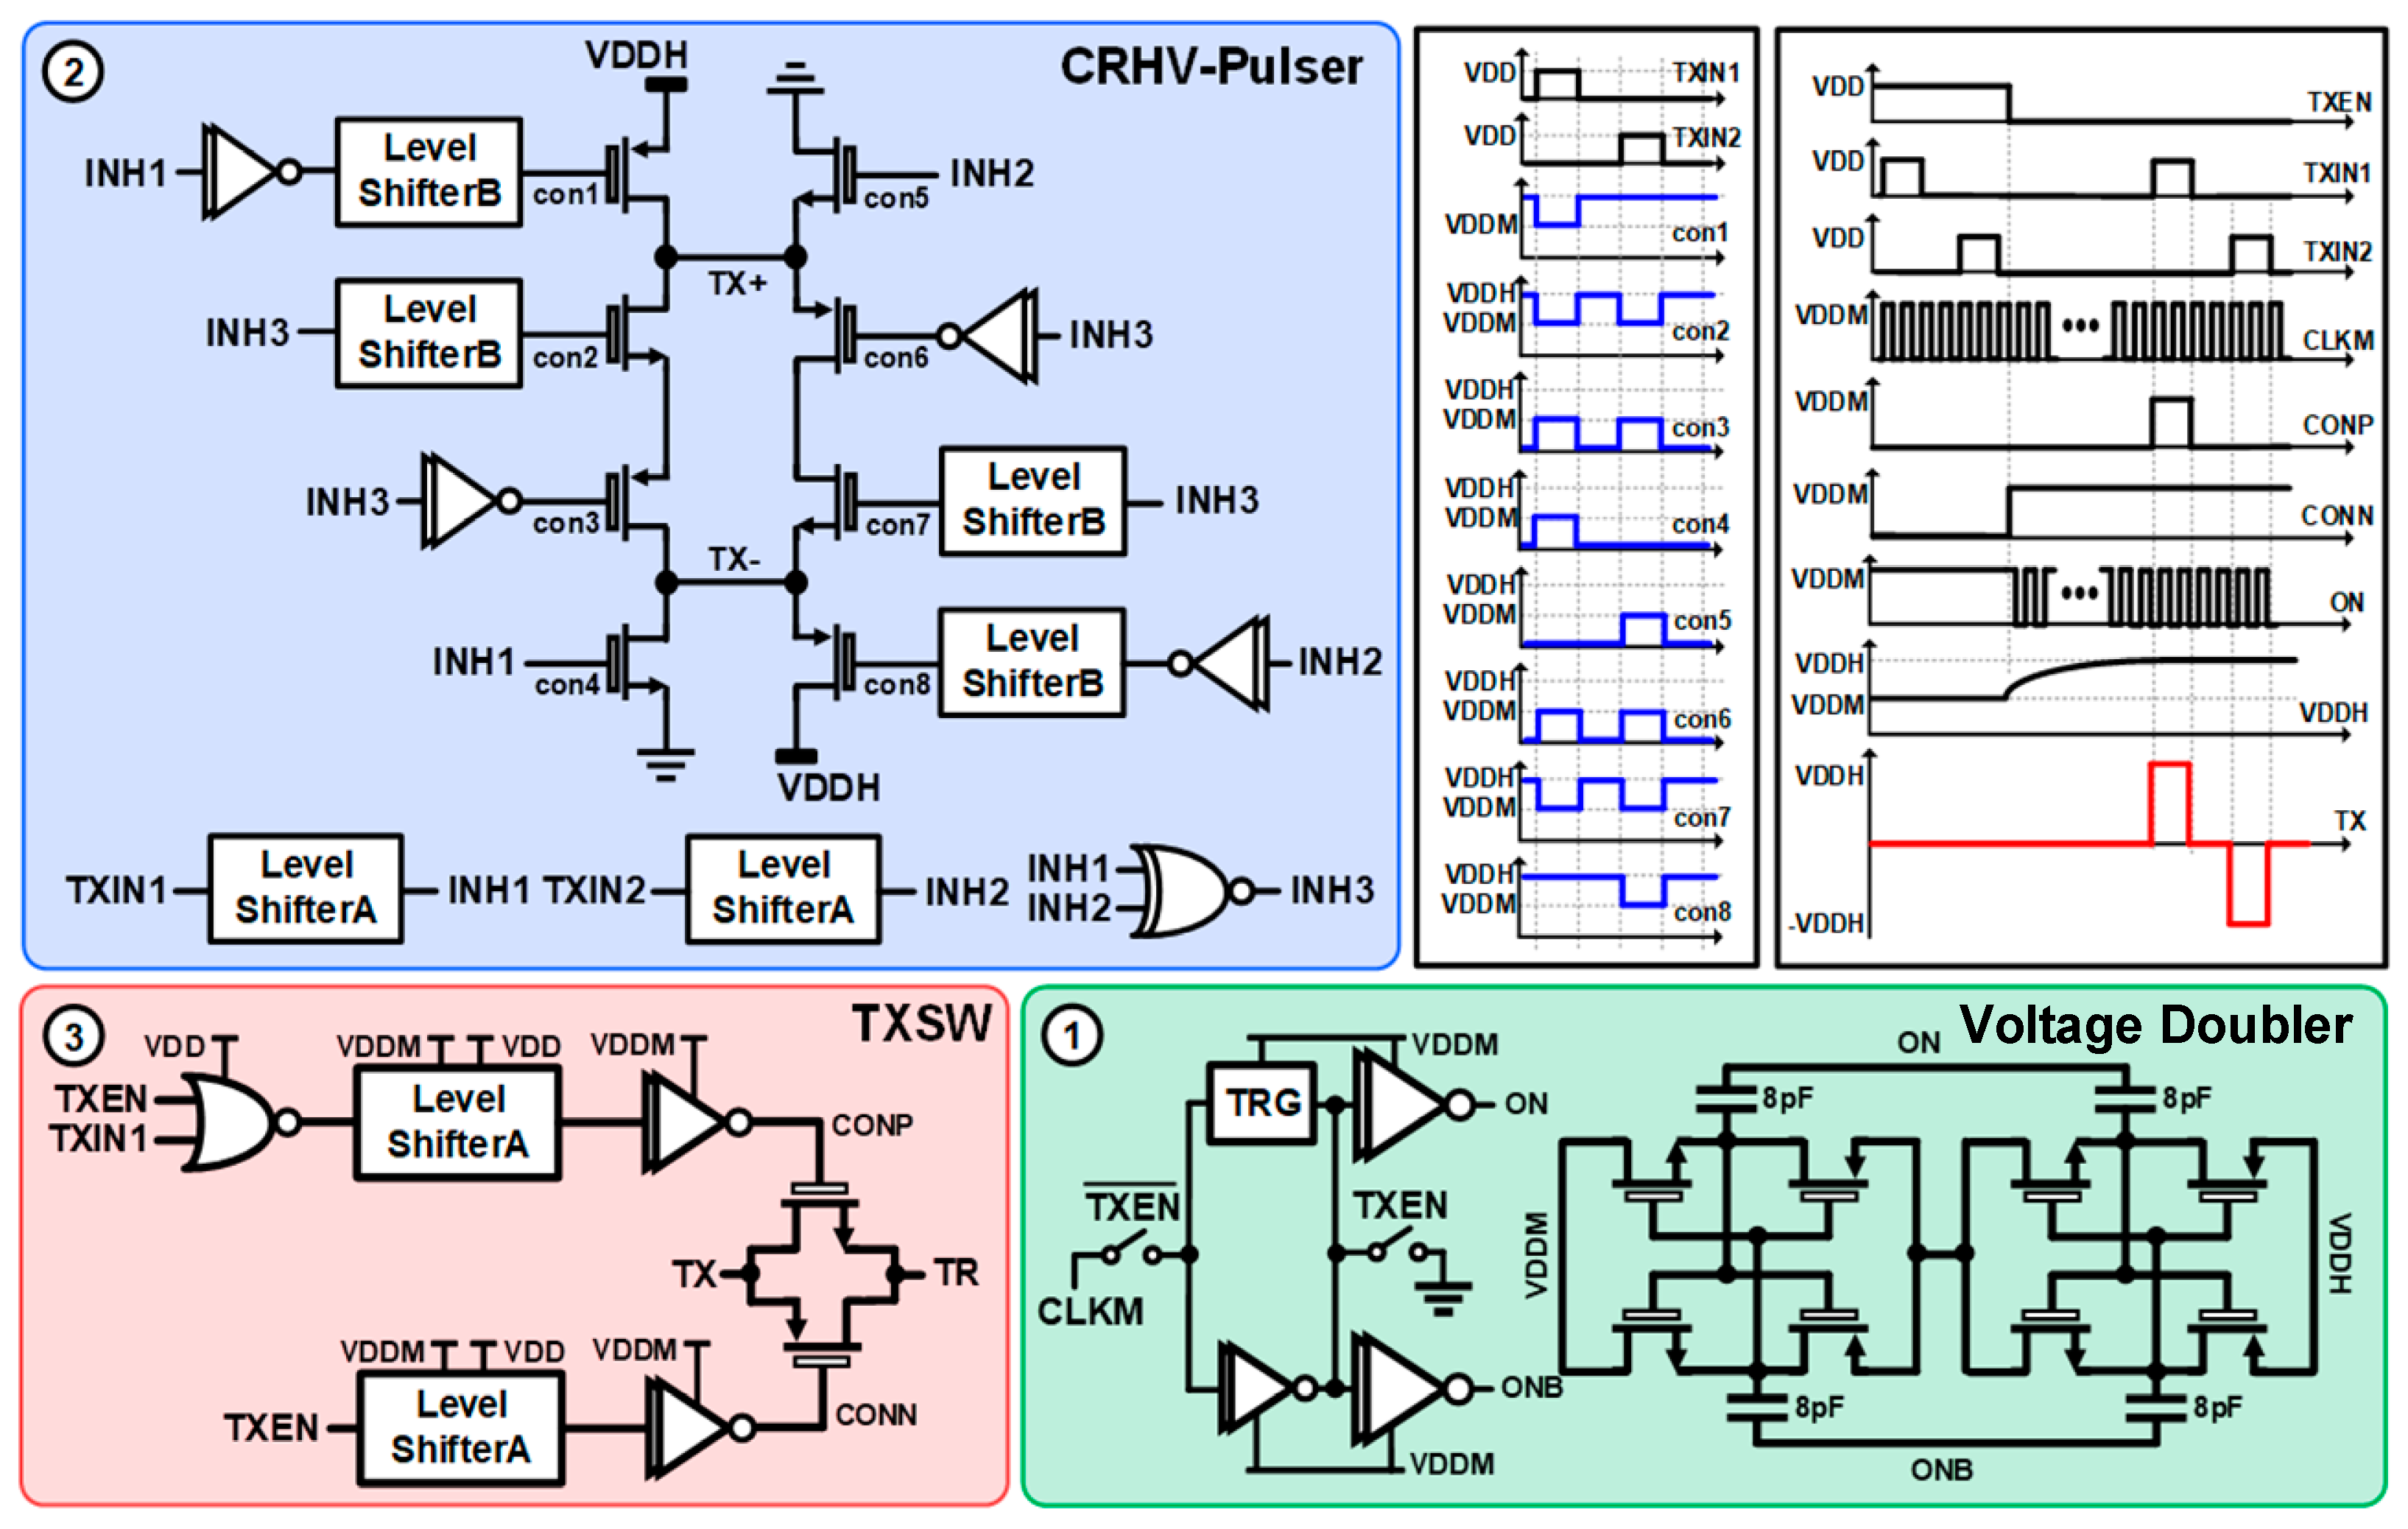
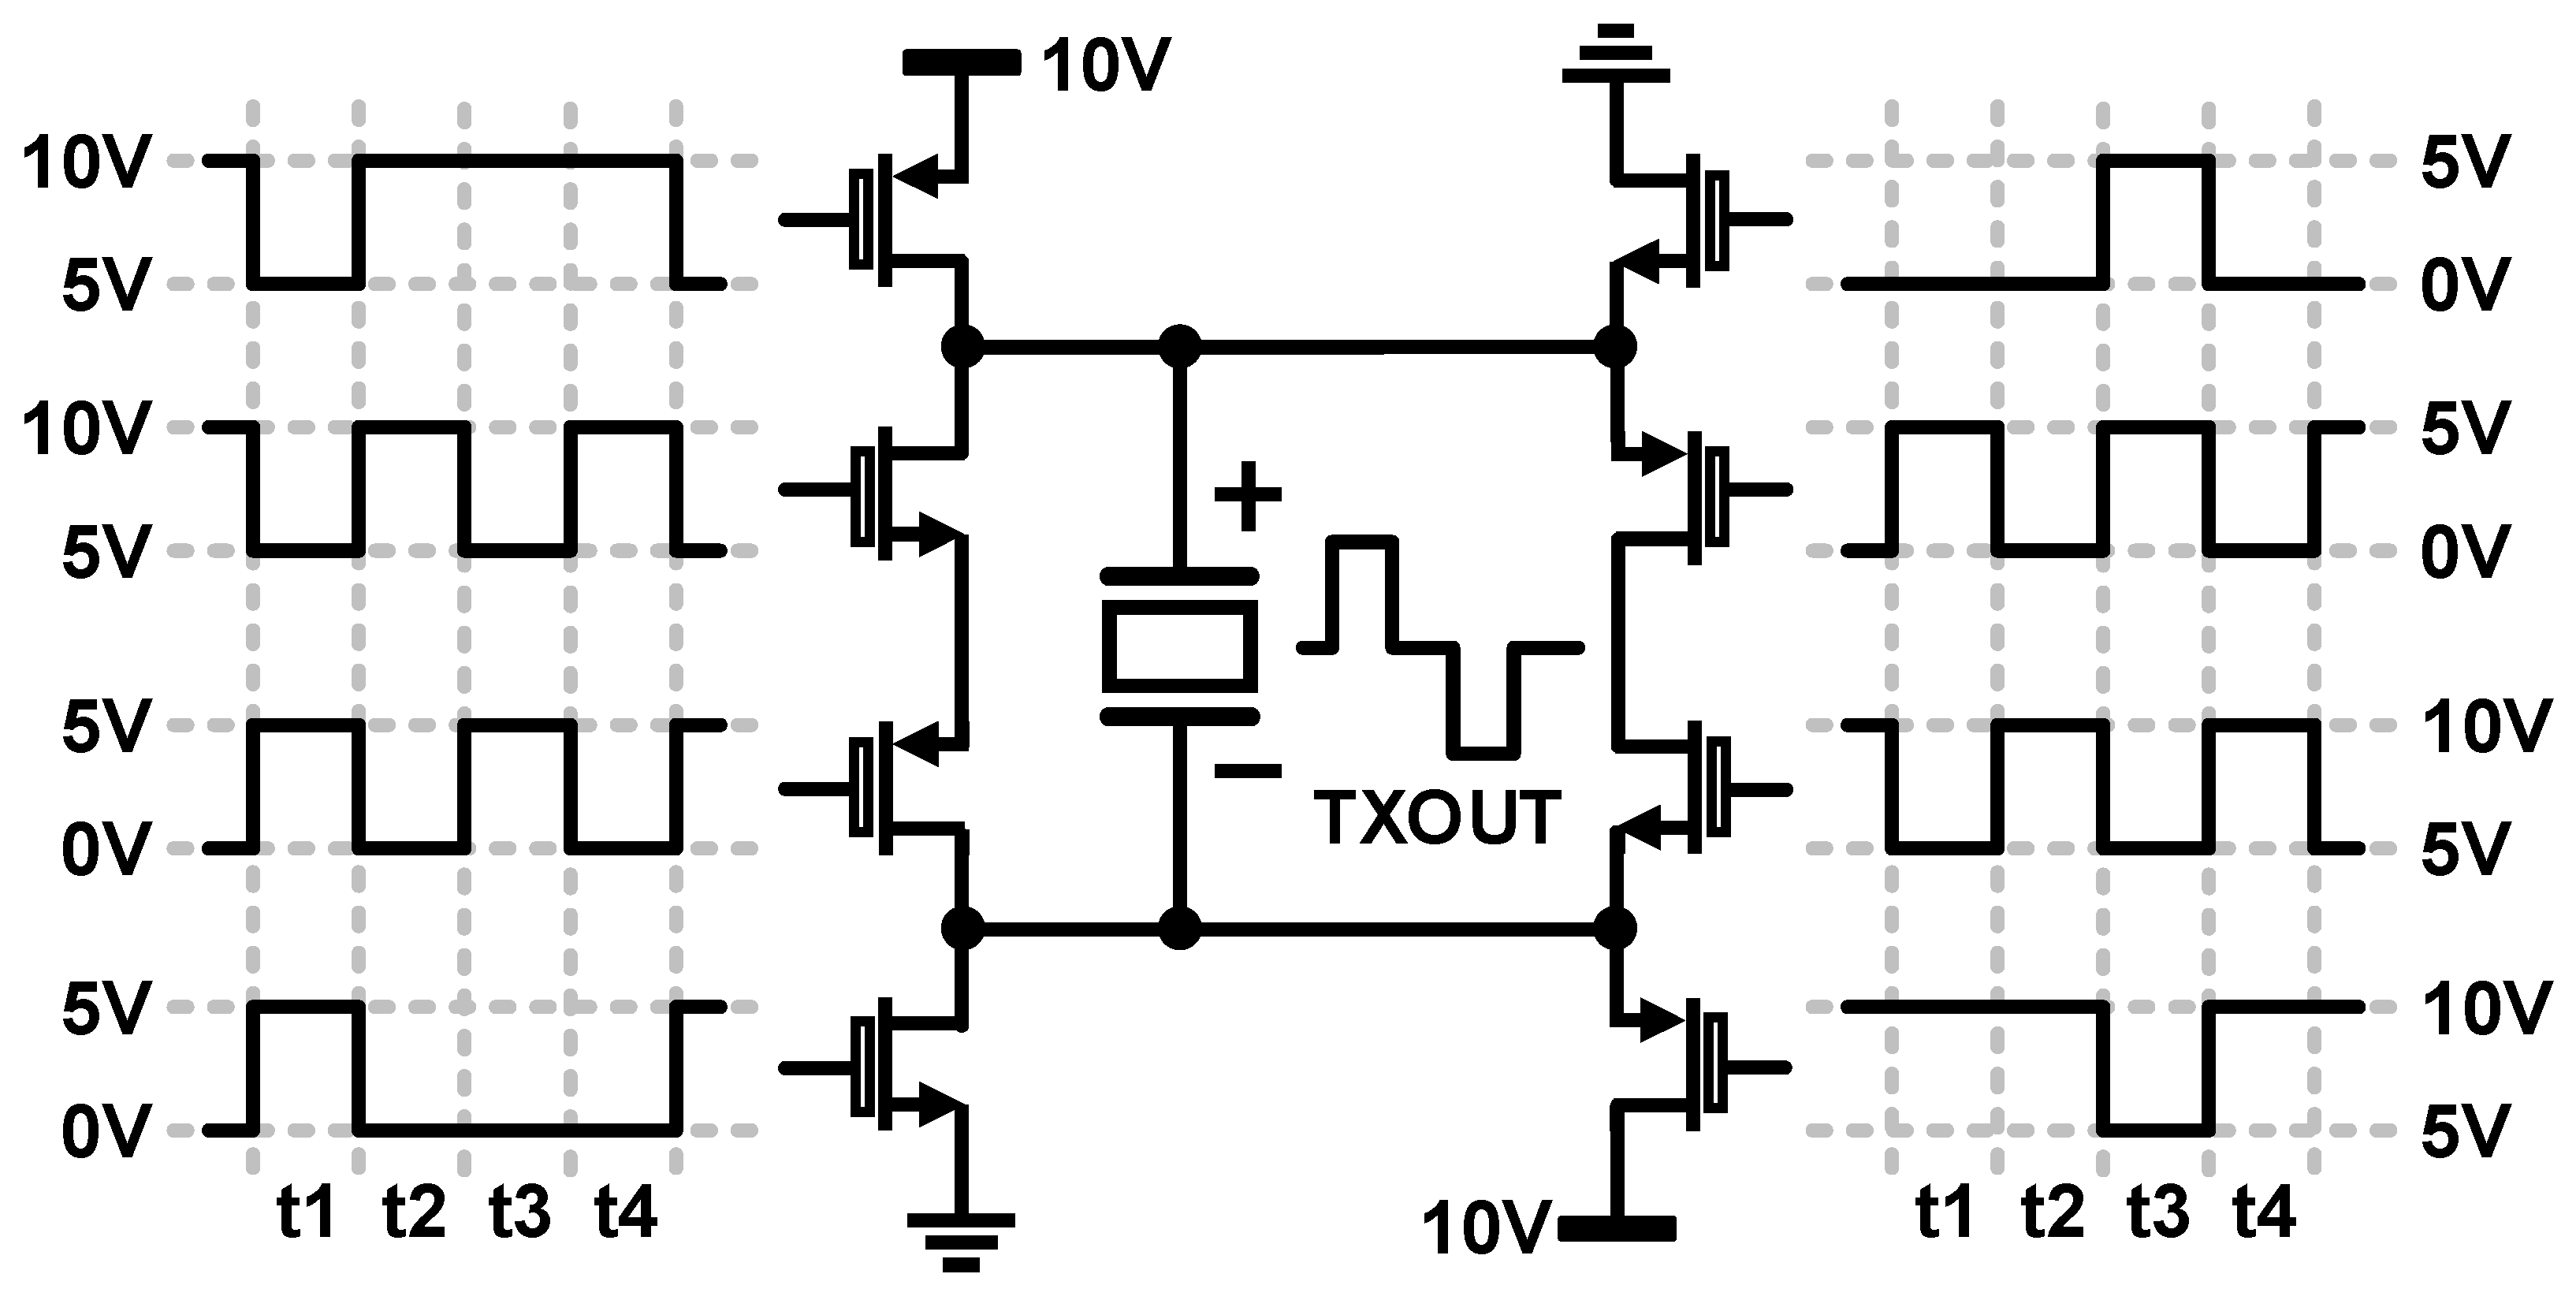
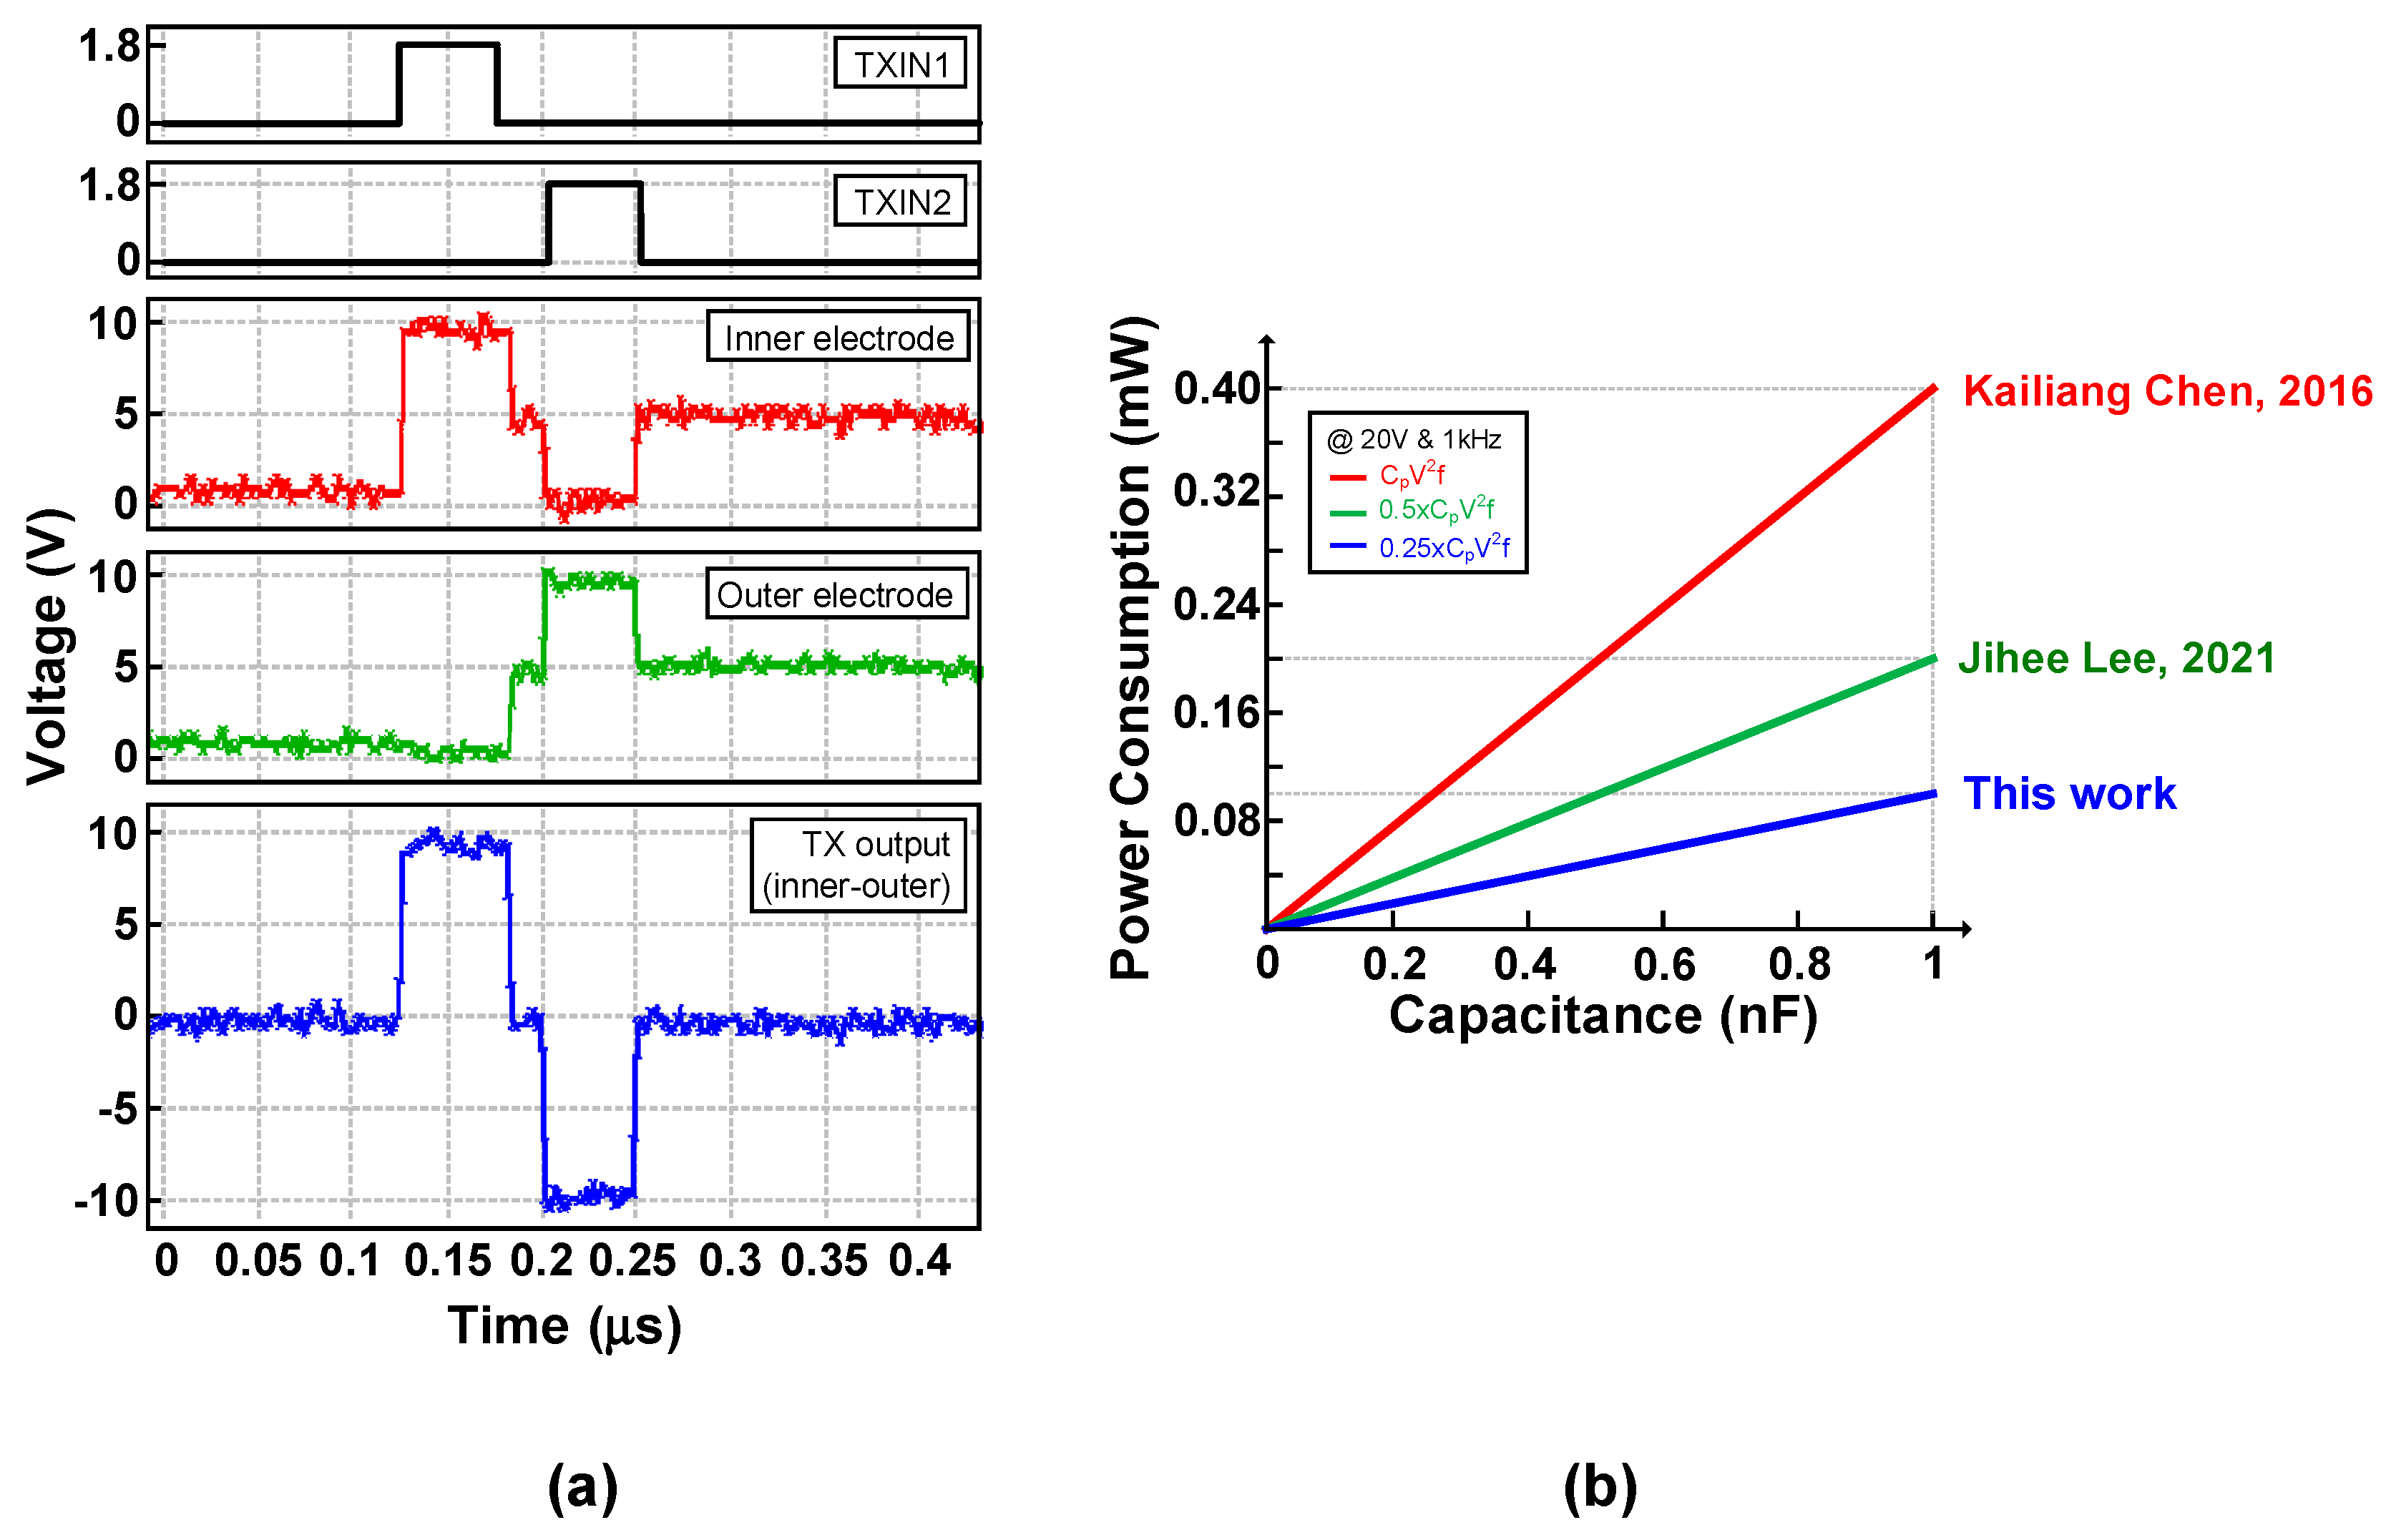
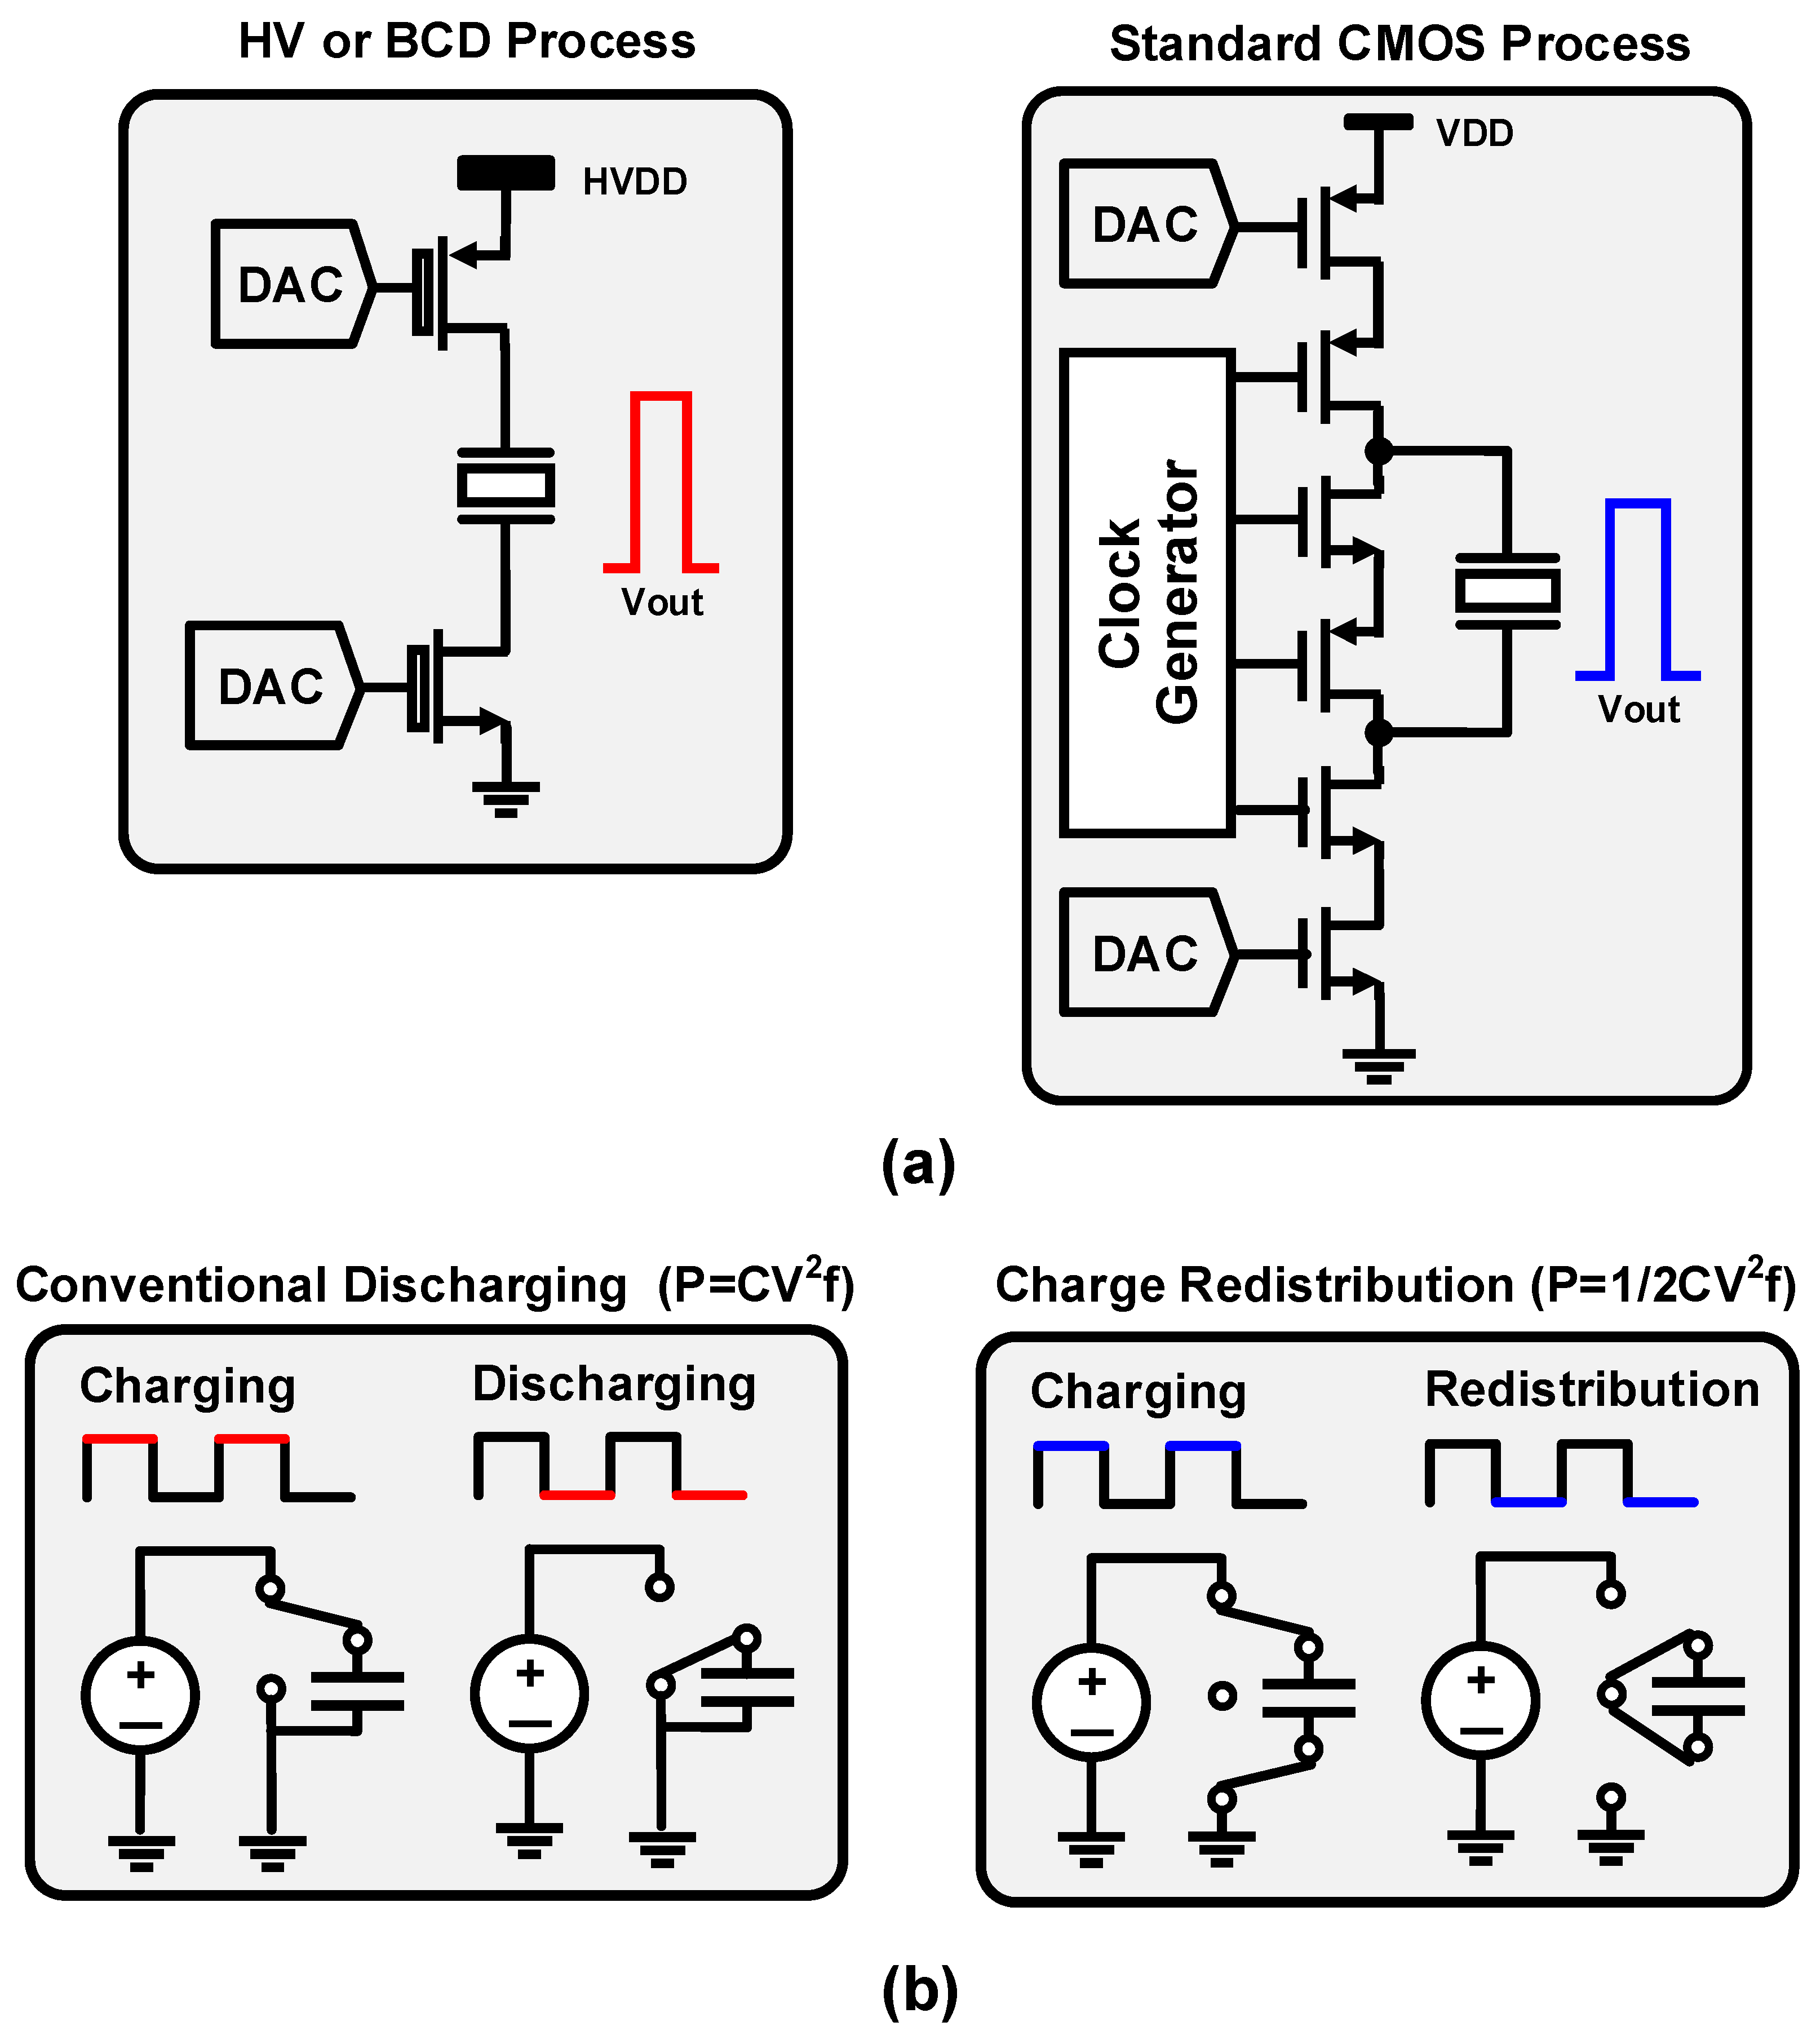
- A three-level biphasic charge redistribution HV (CRHV) TX pulser uses a standard CMOS process to increase the power efficiency.
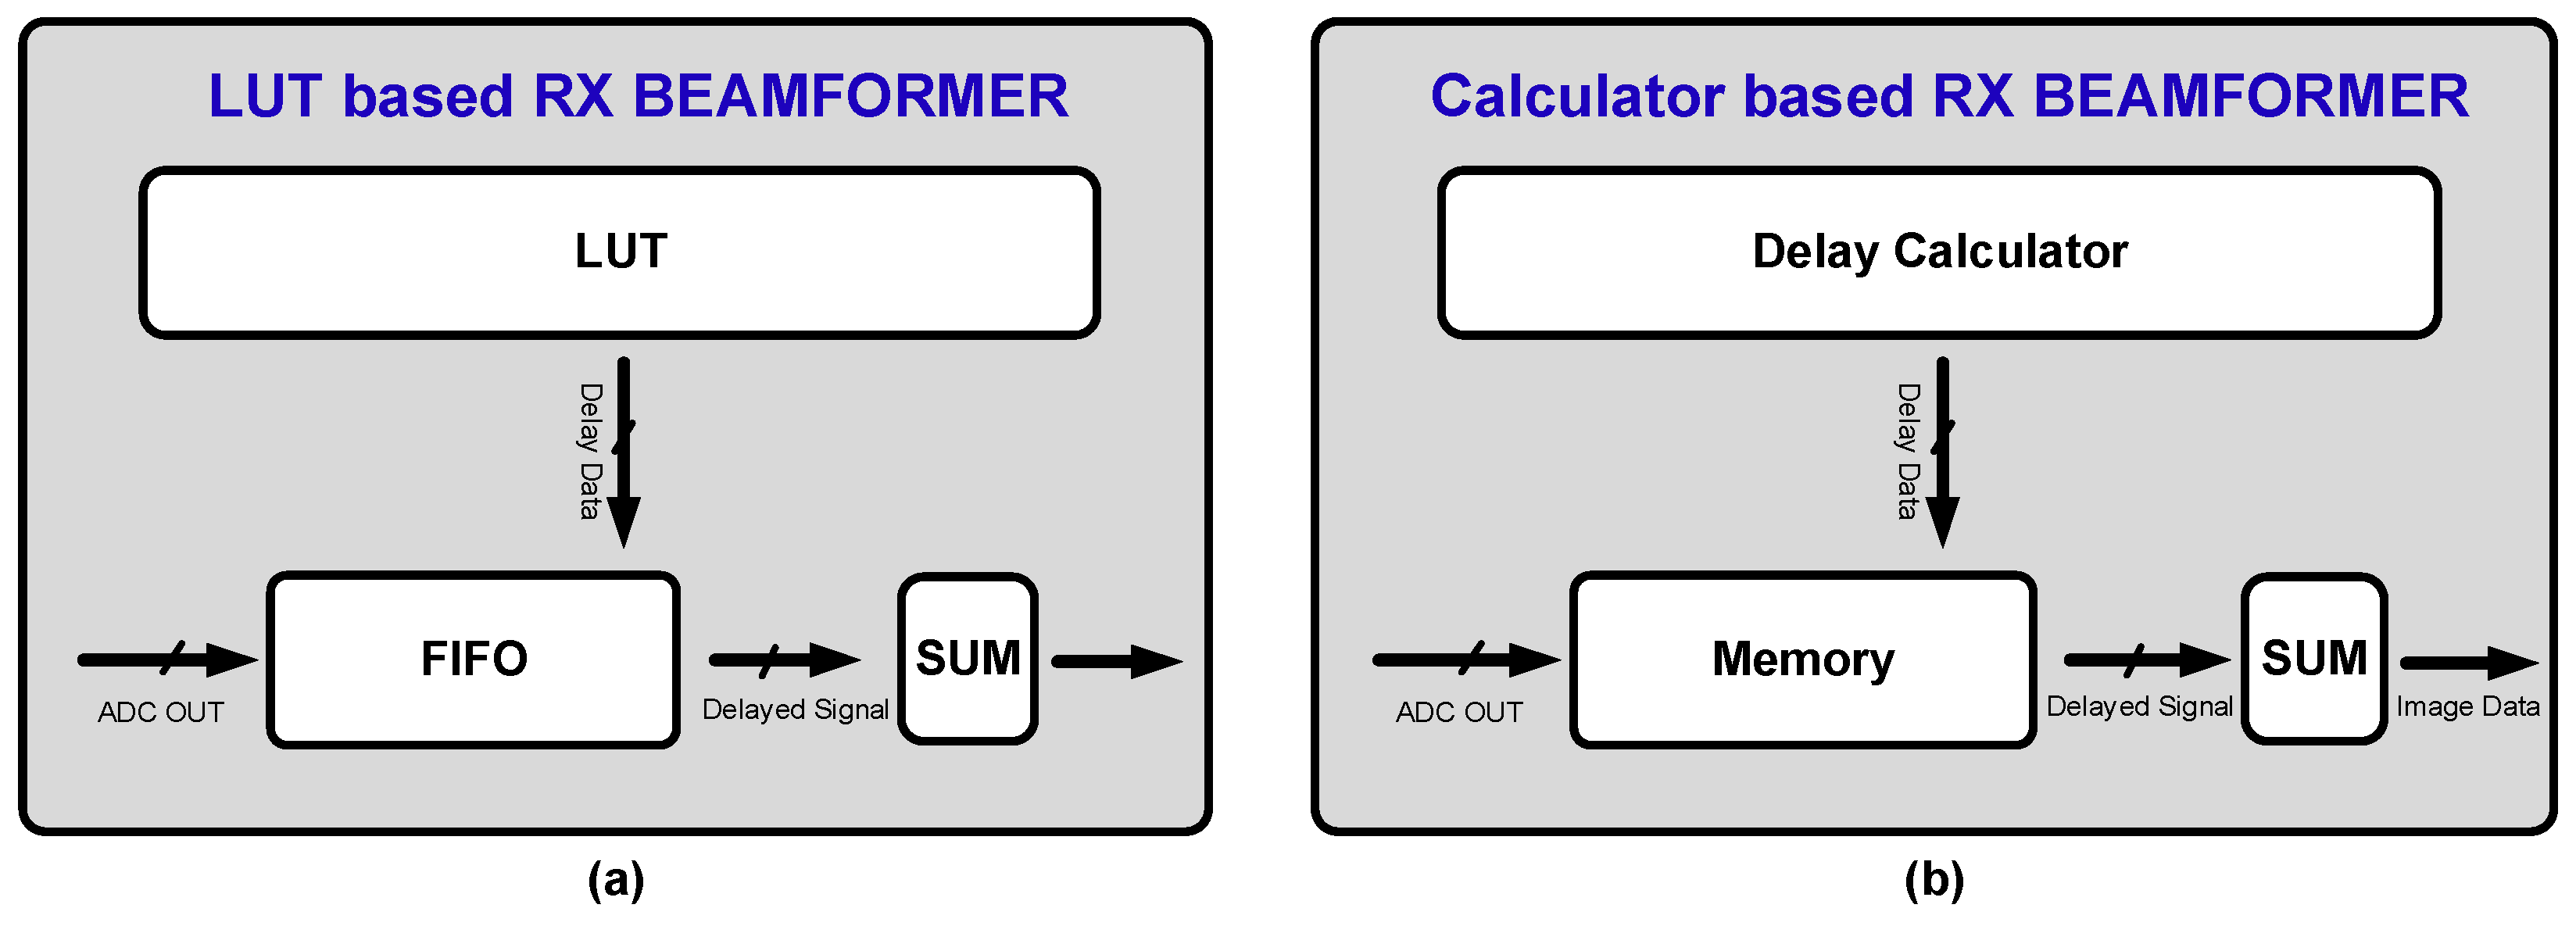
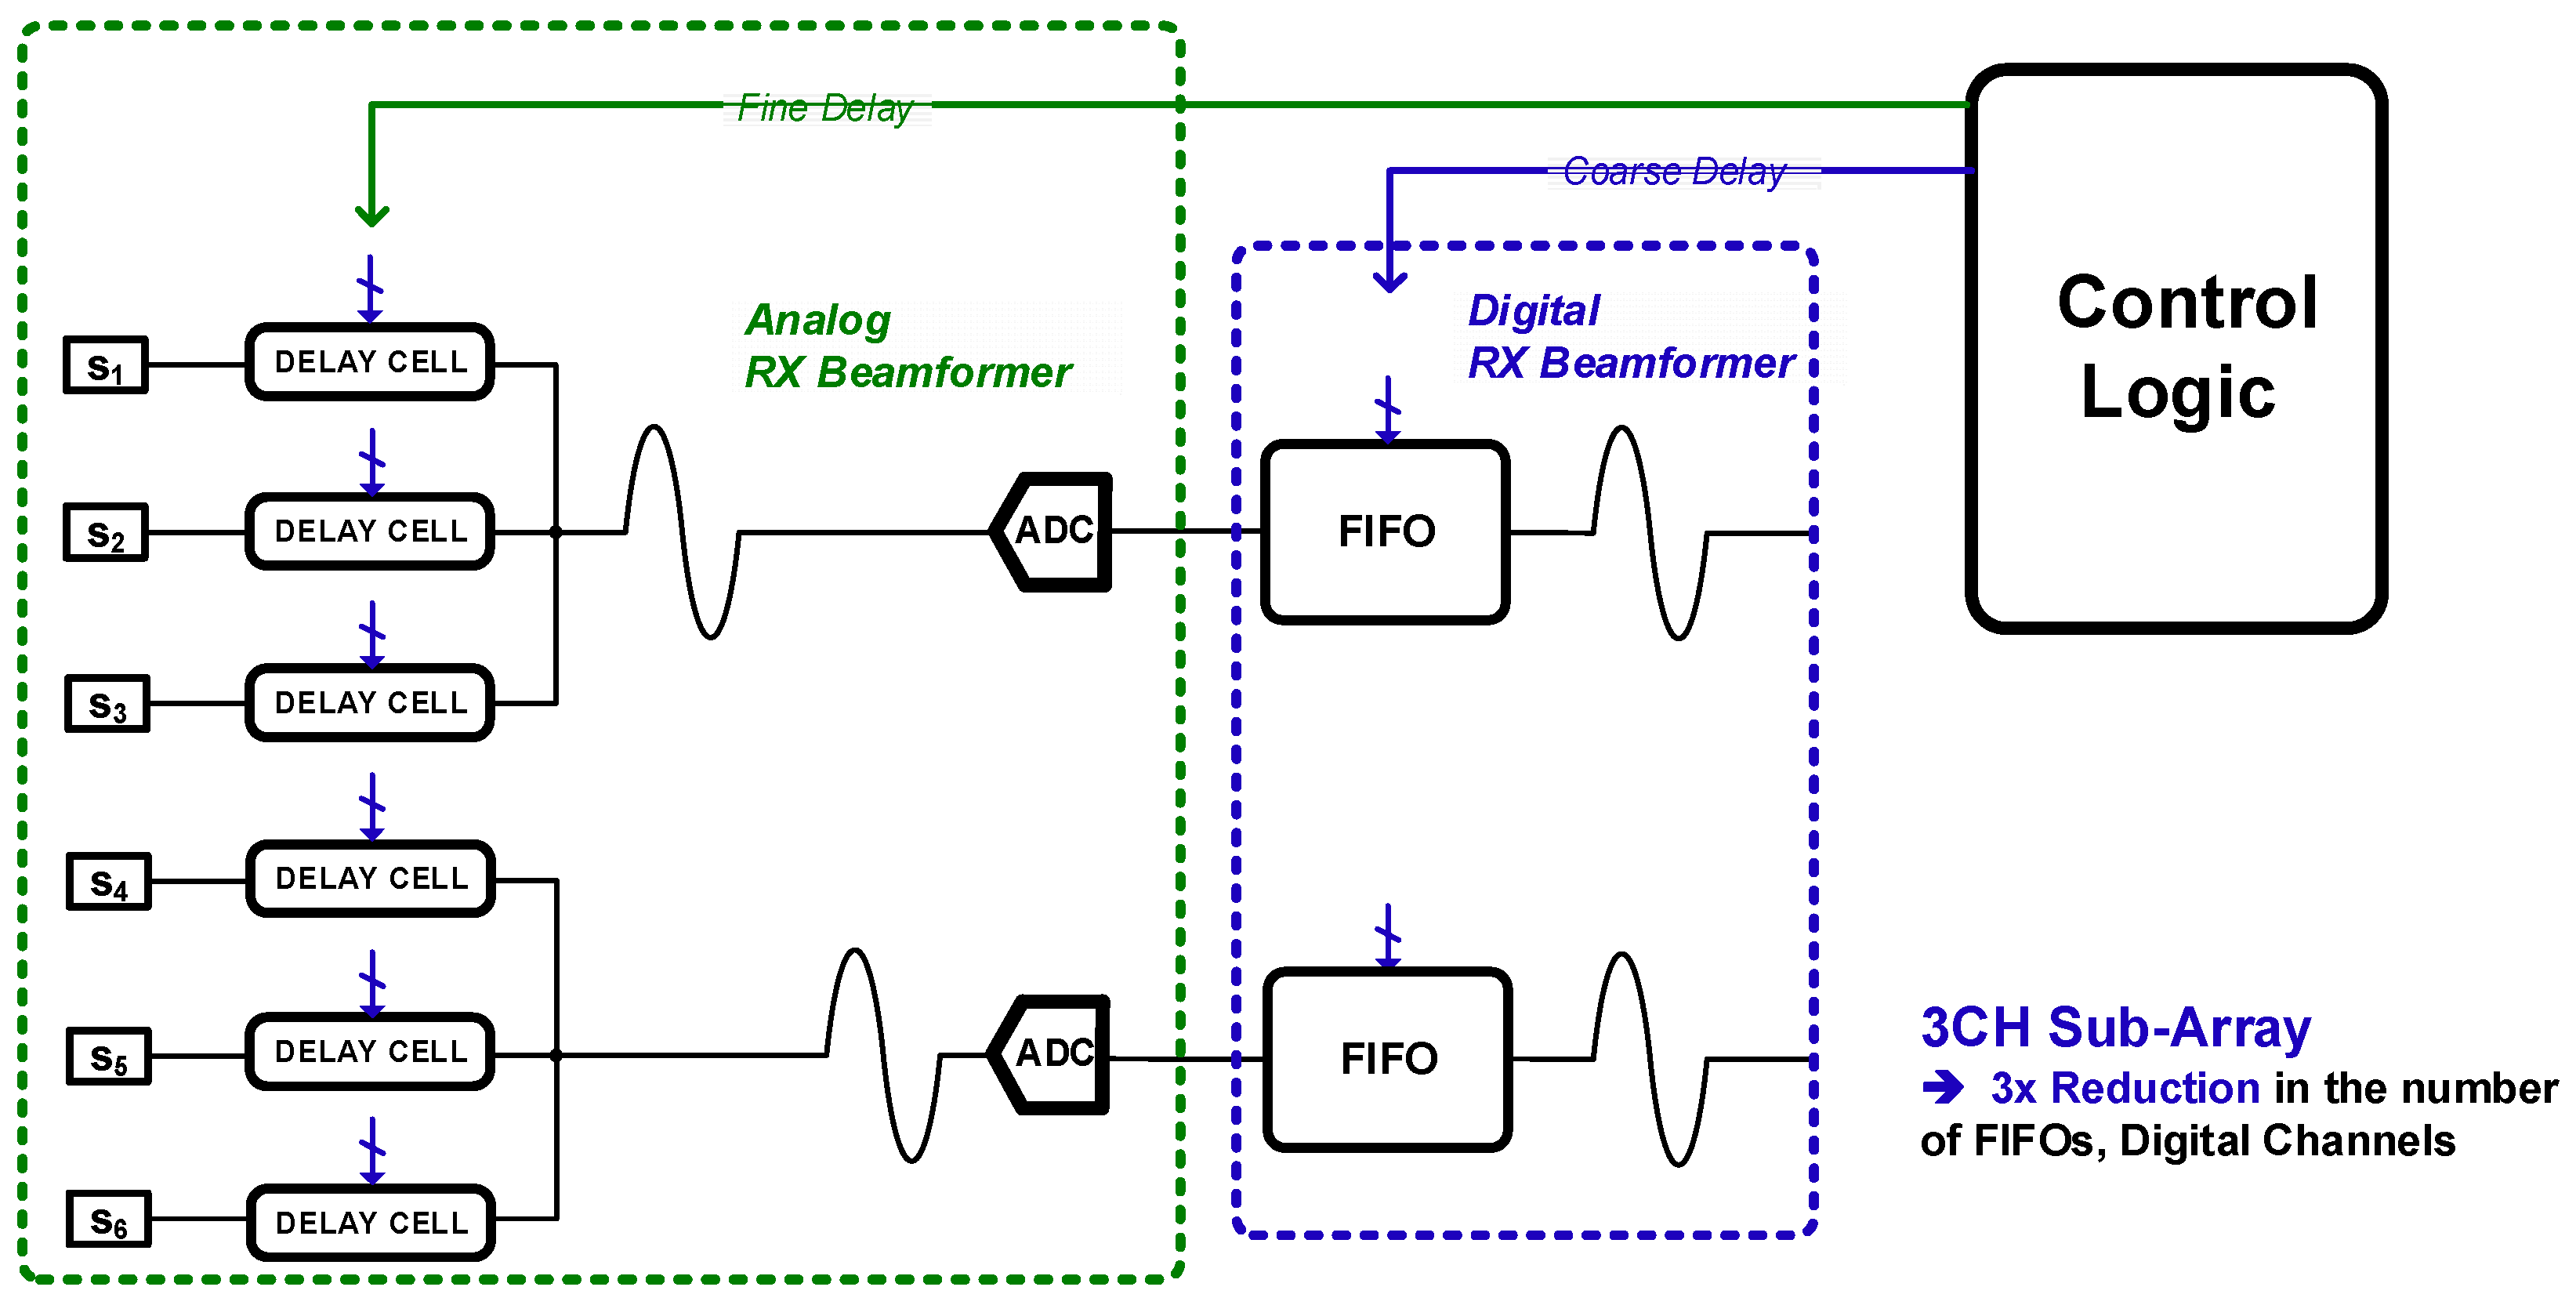
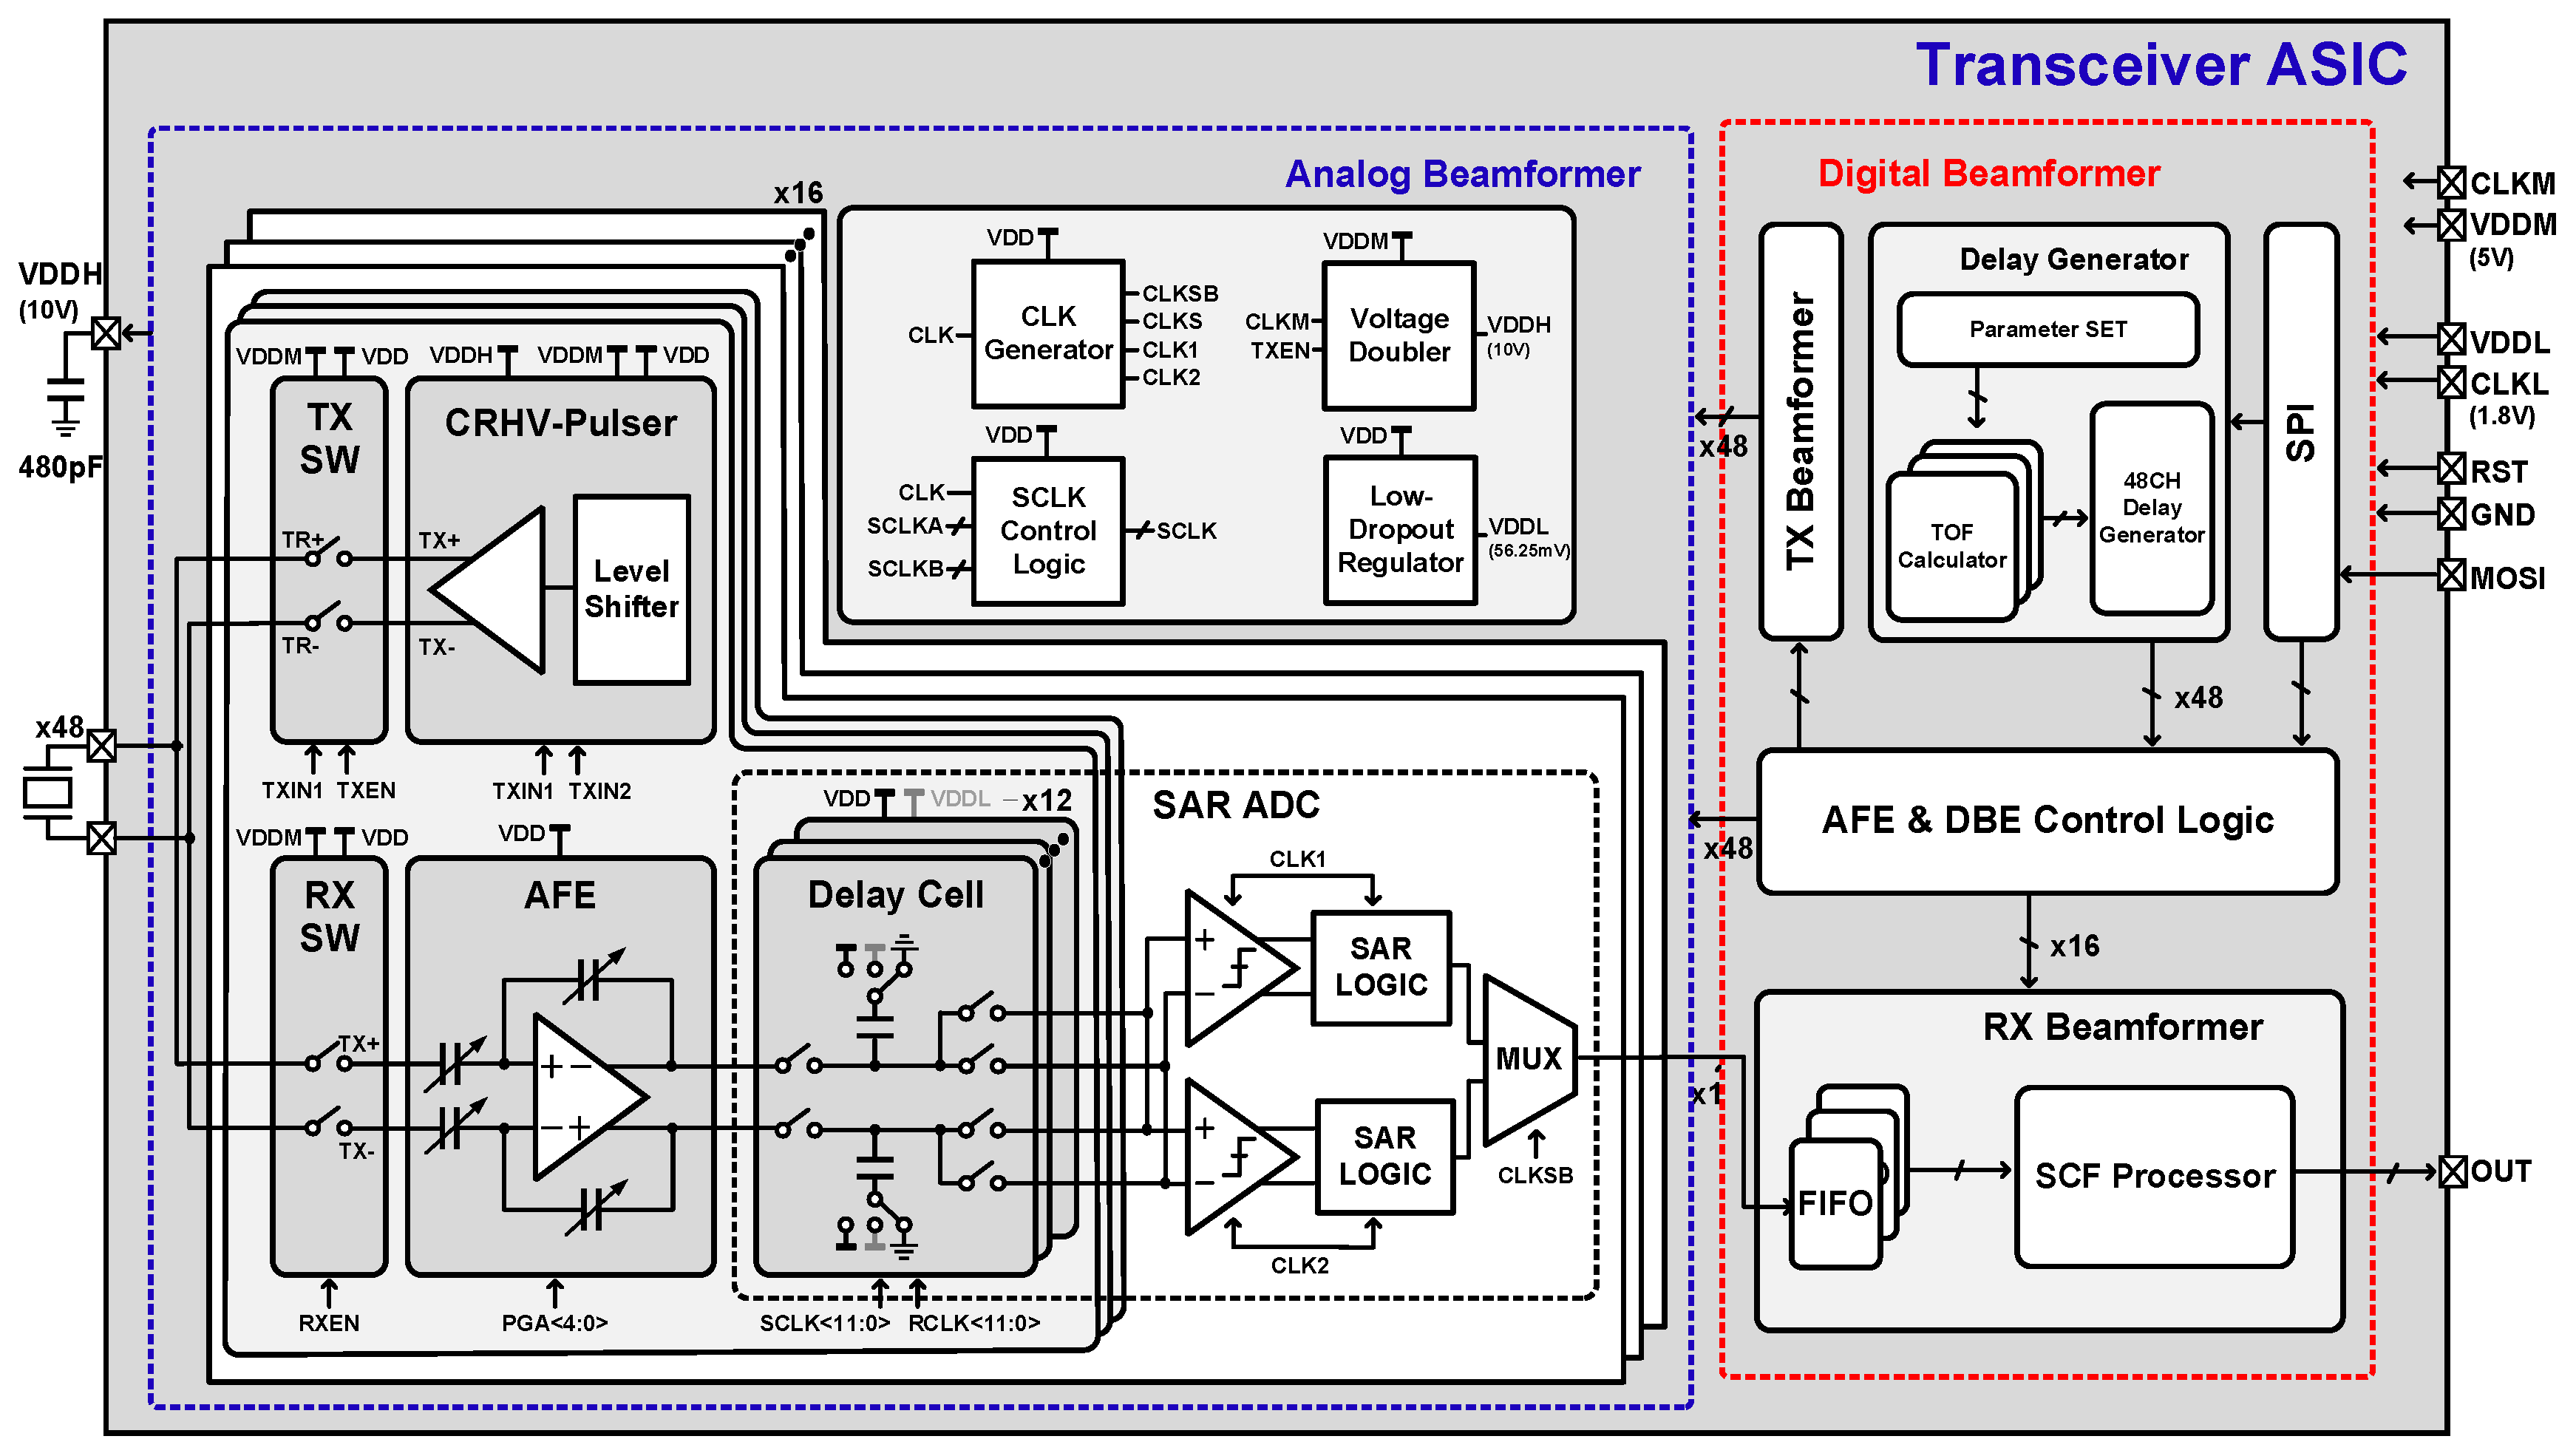
- A hybrid beamforming architecture with an analog subarray beamformer and a calculator-based digital beamformer that uses FIFO instead of memory to achieve a low-area system.
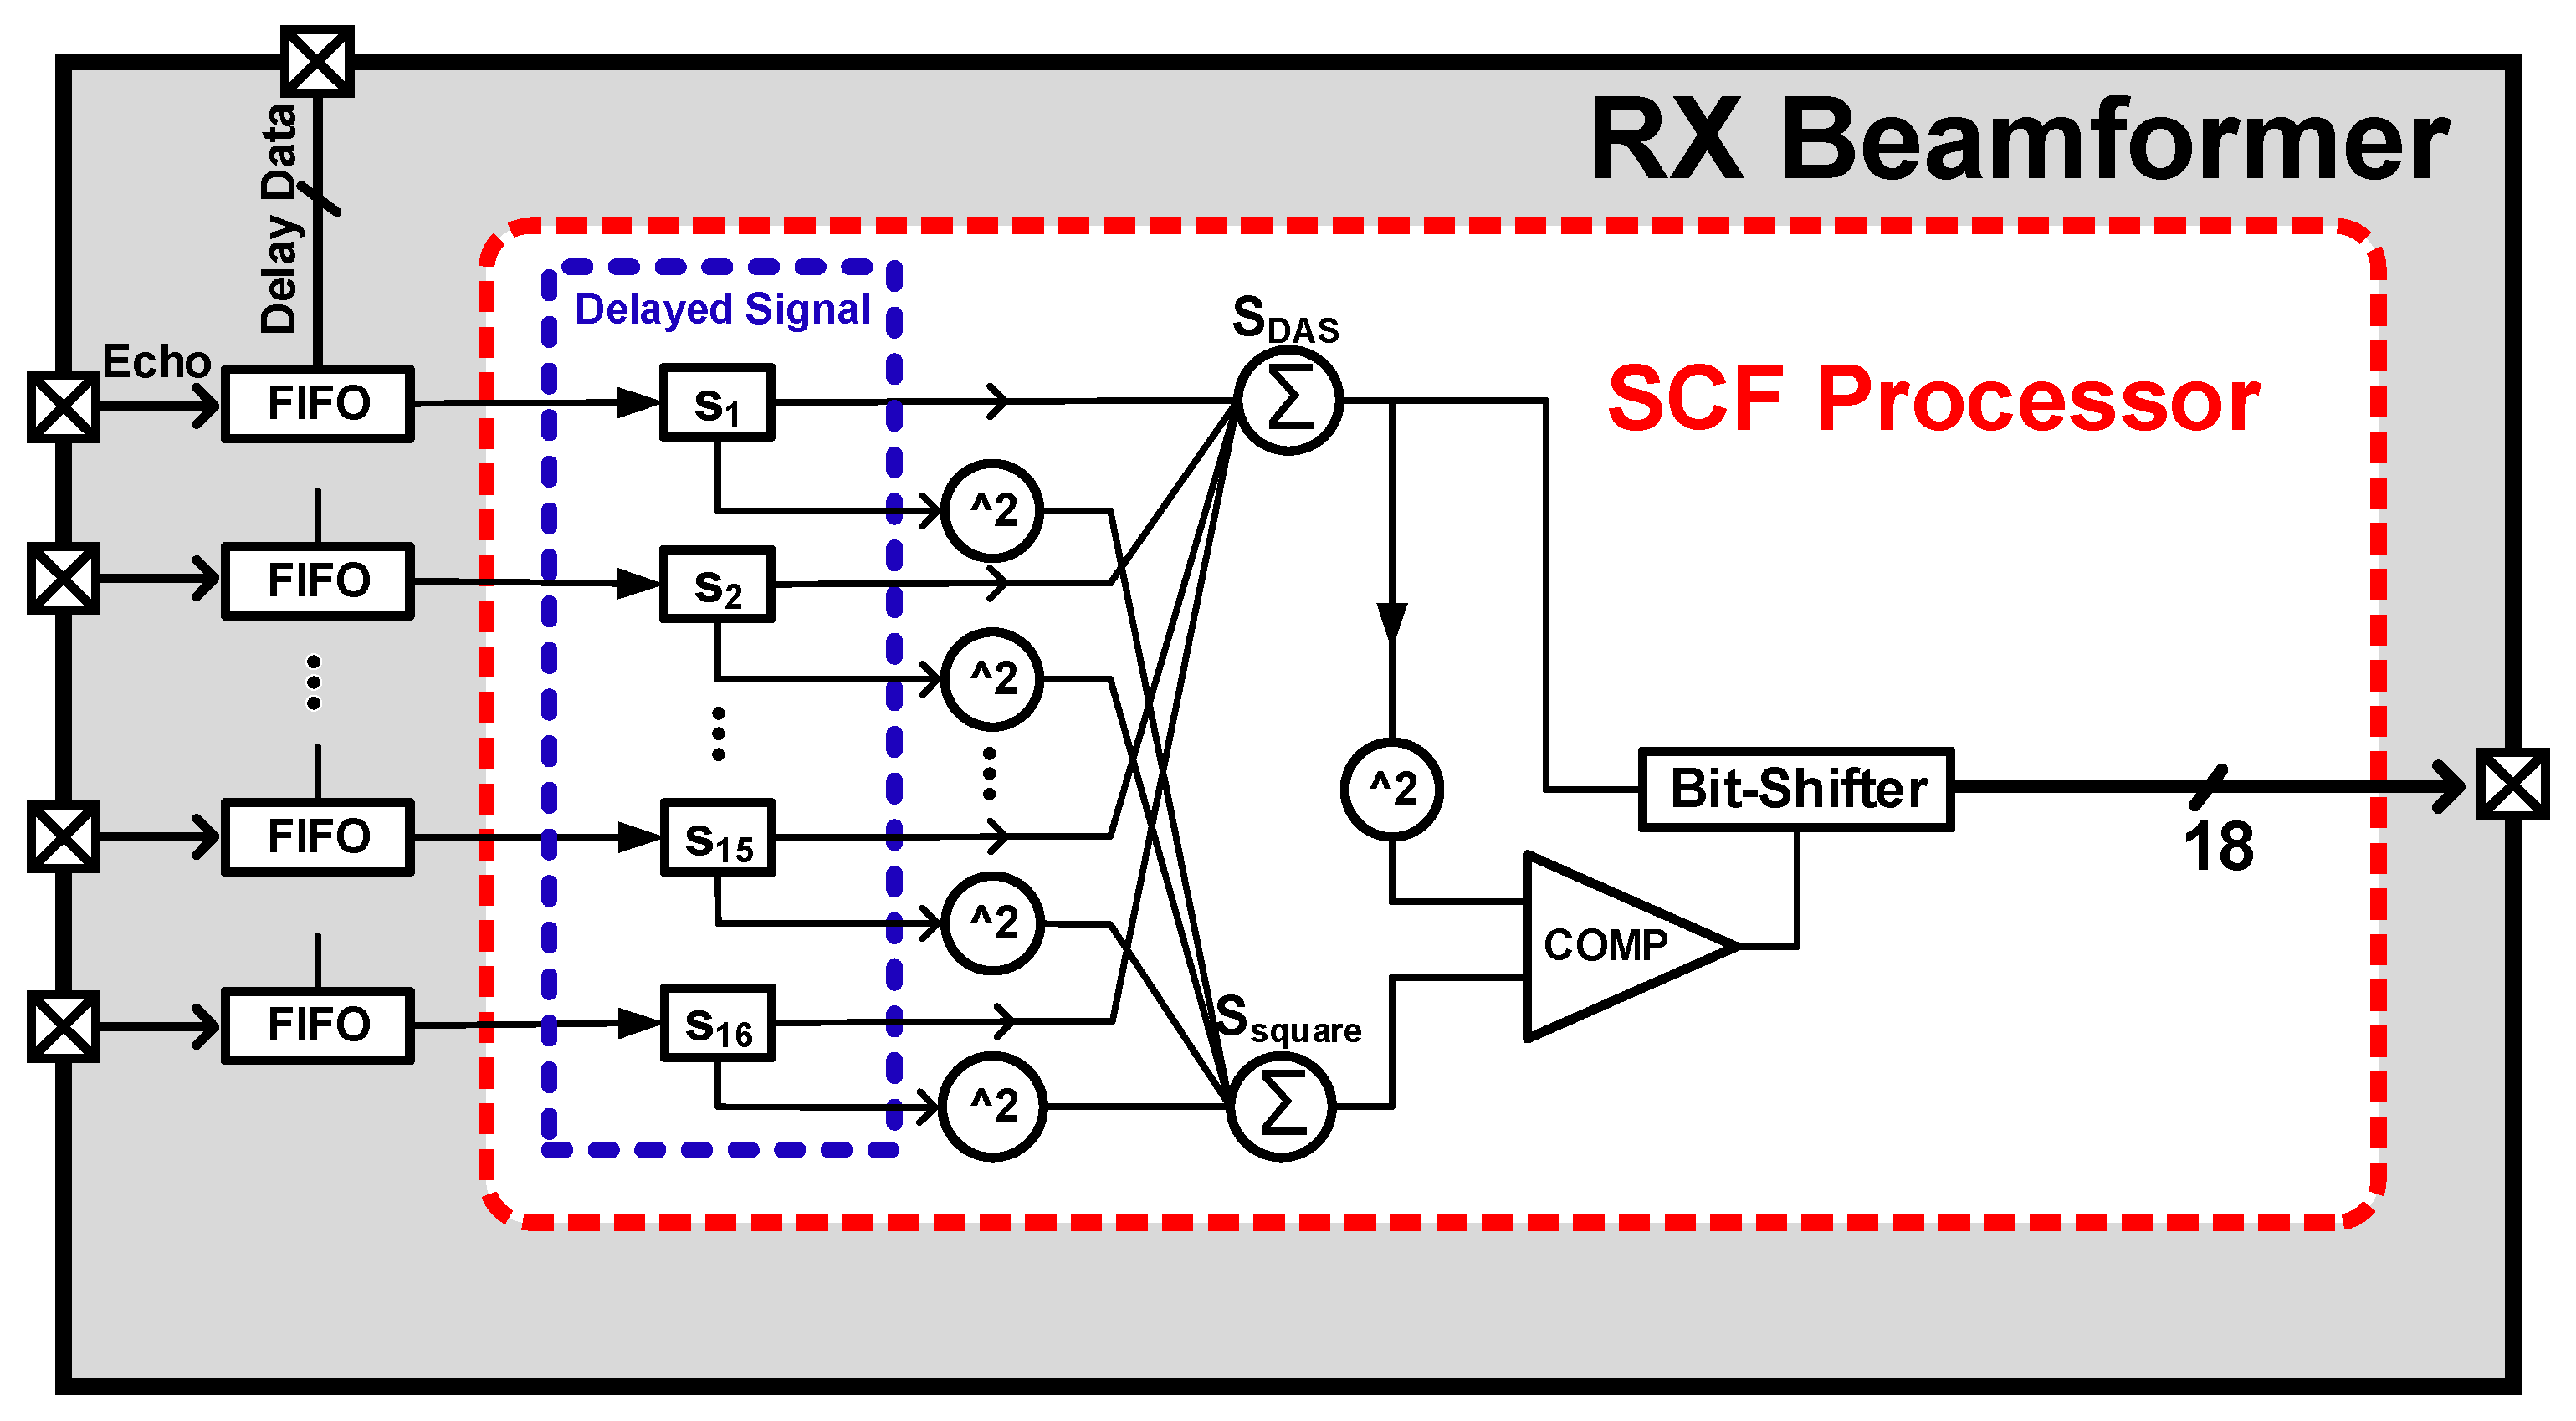
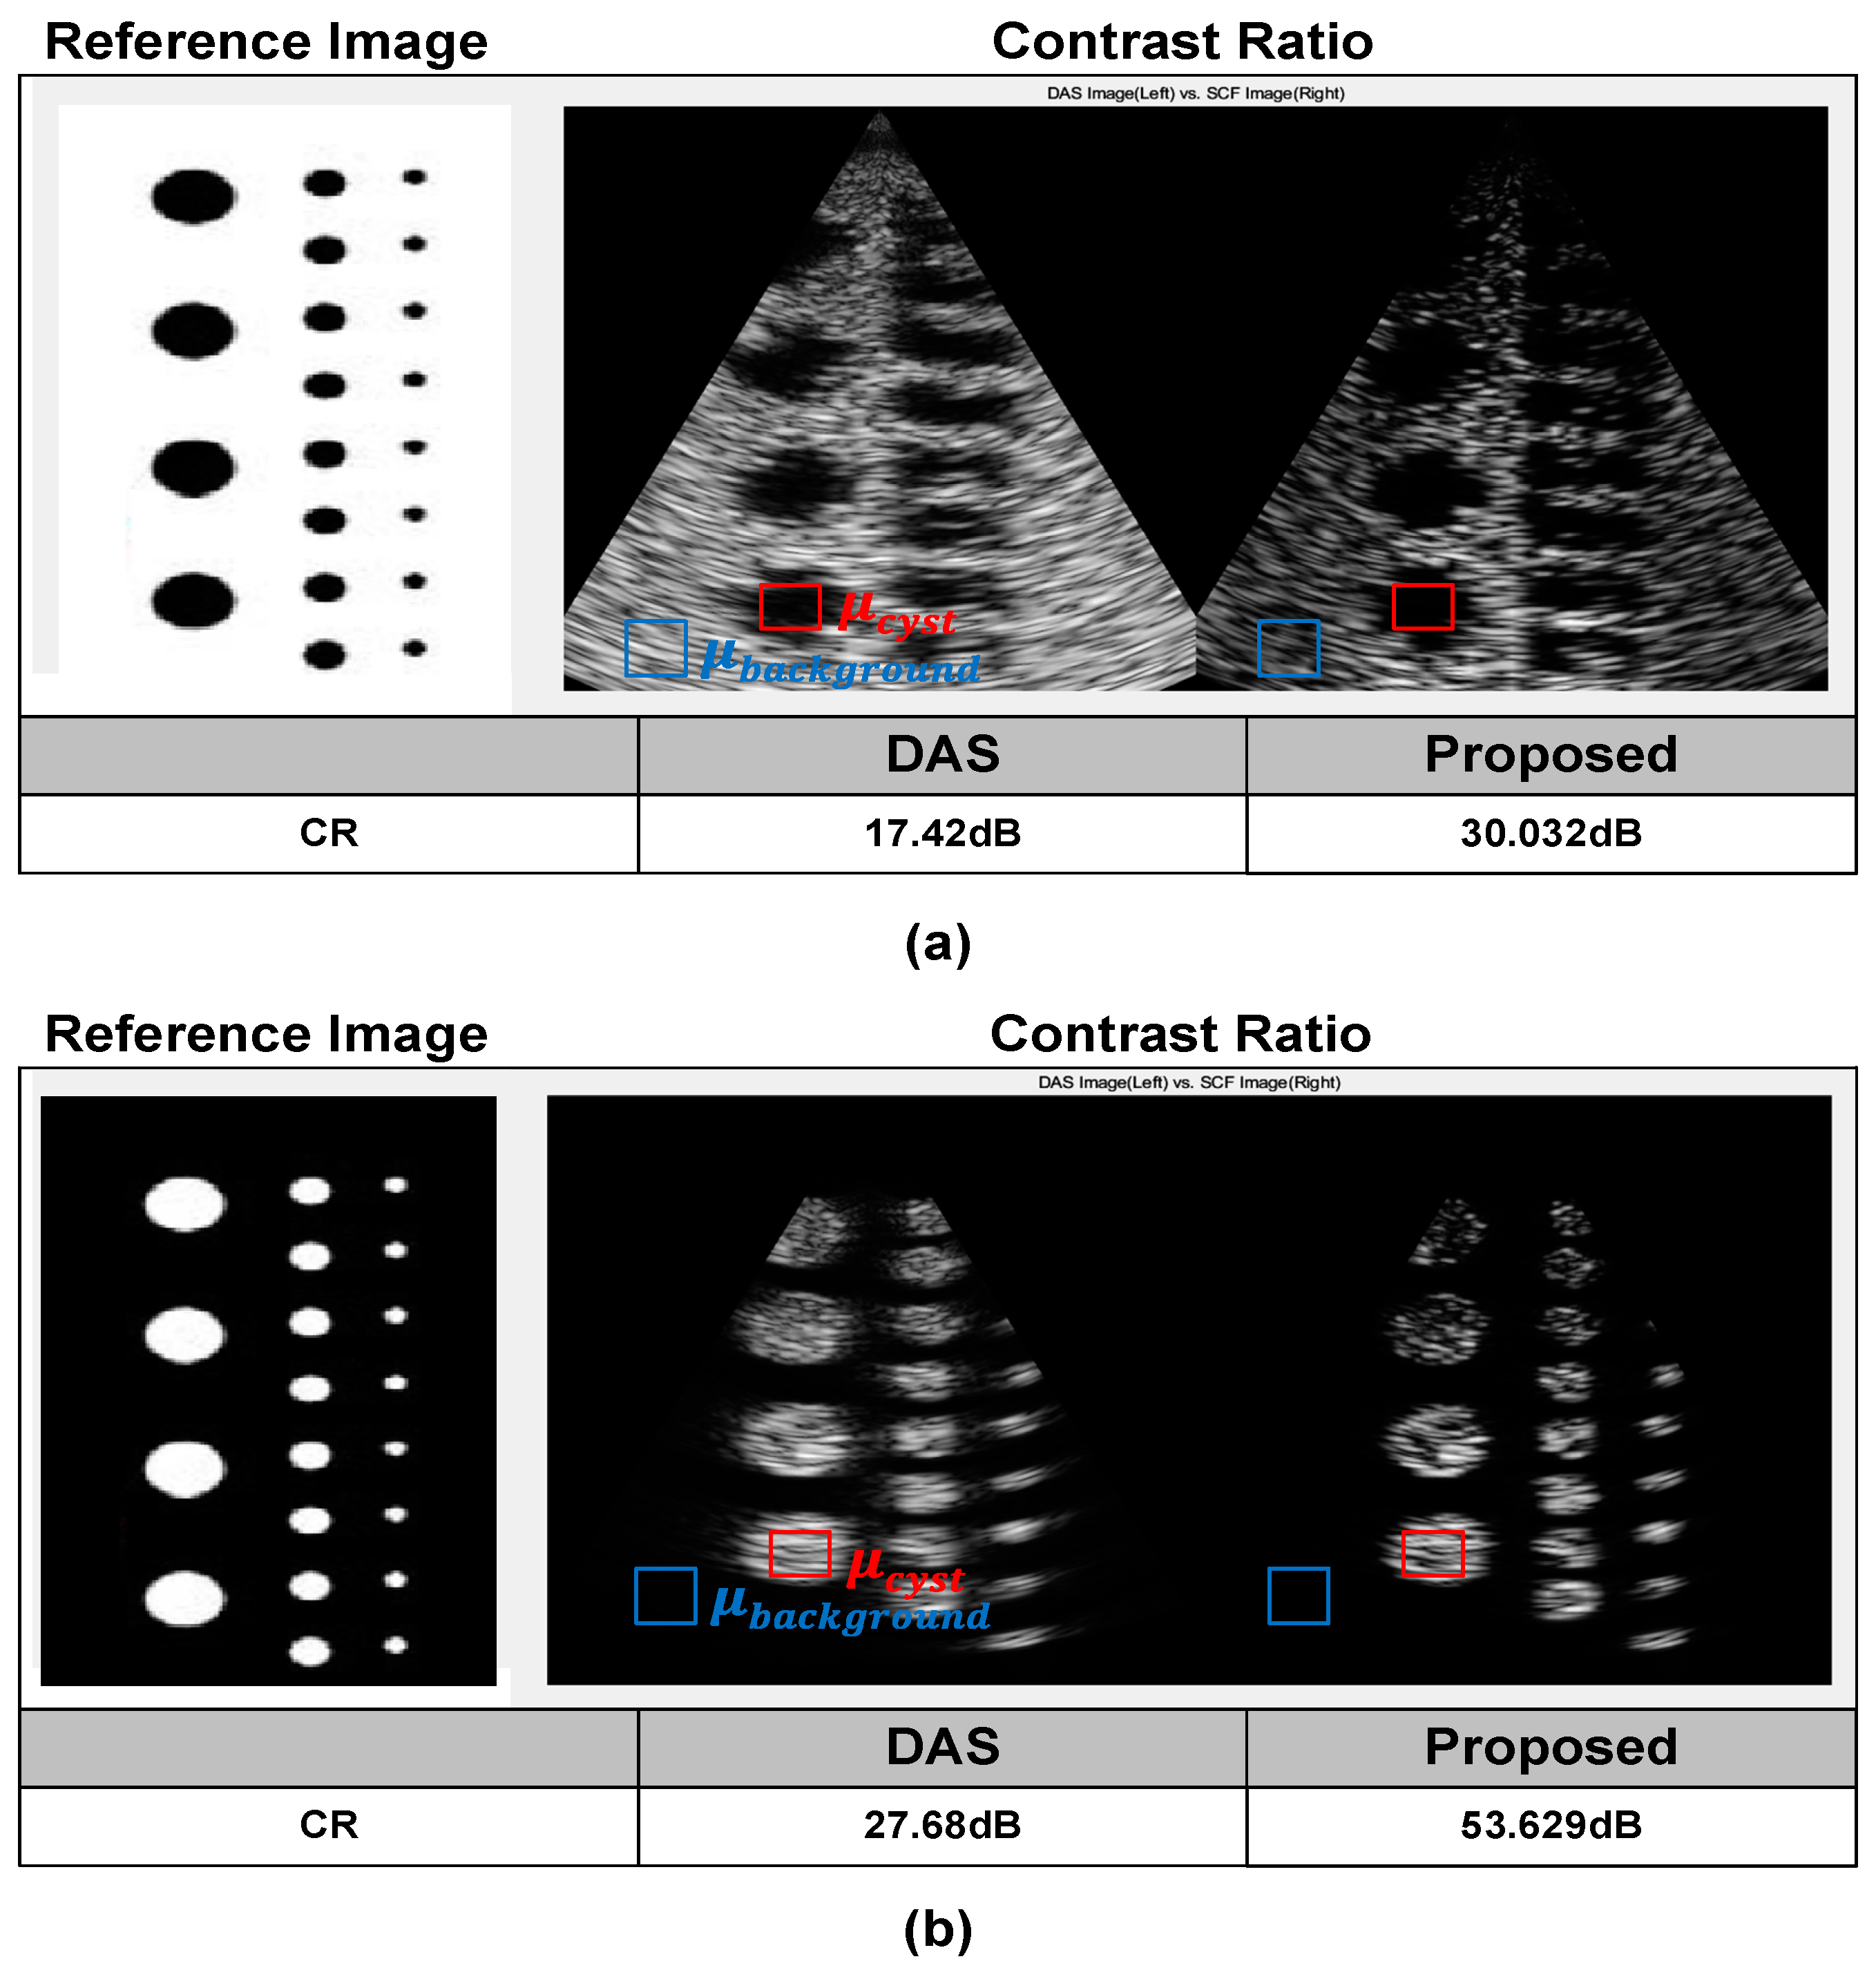
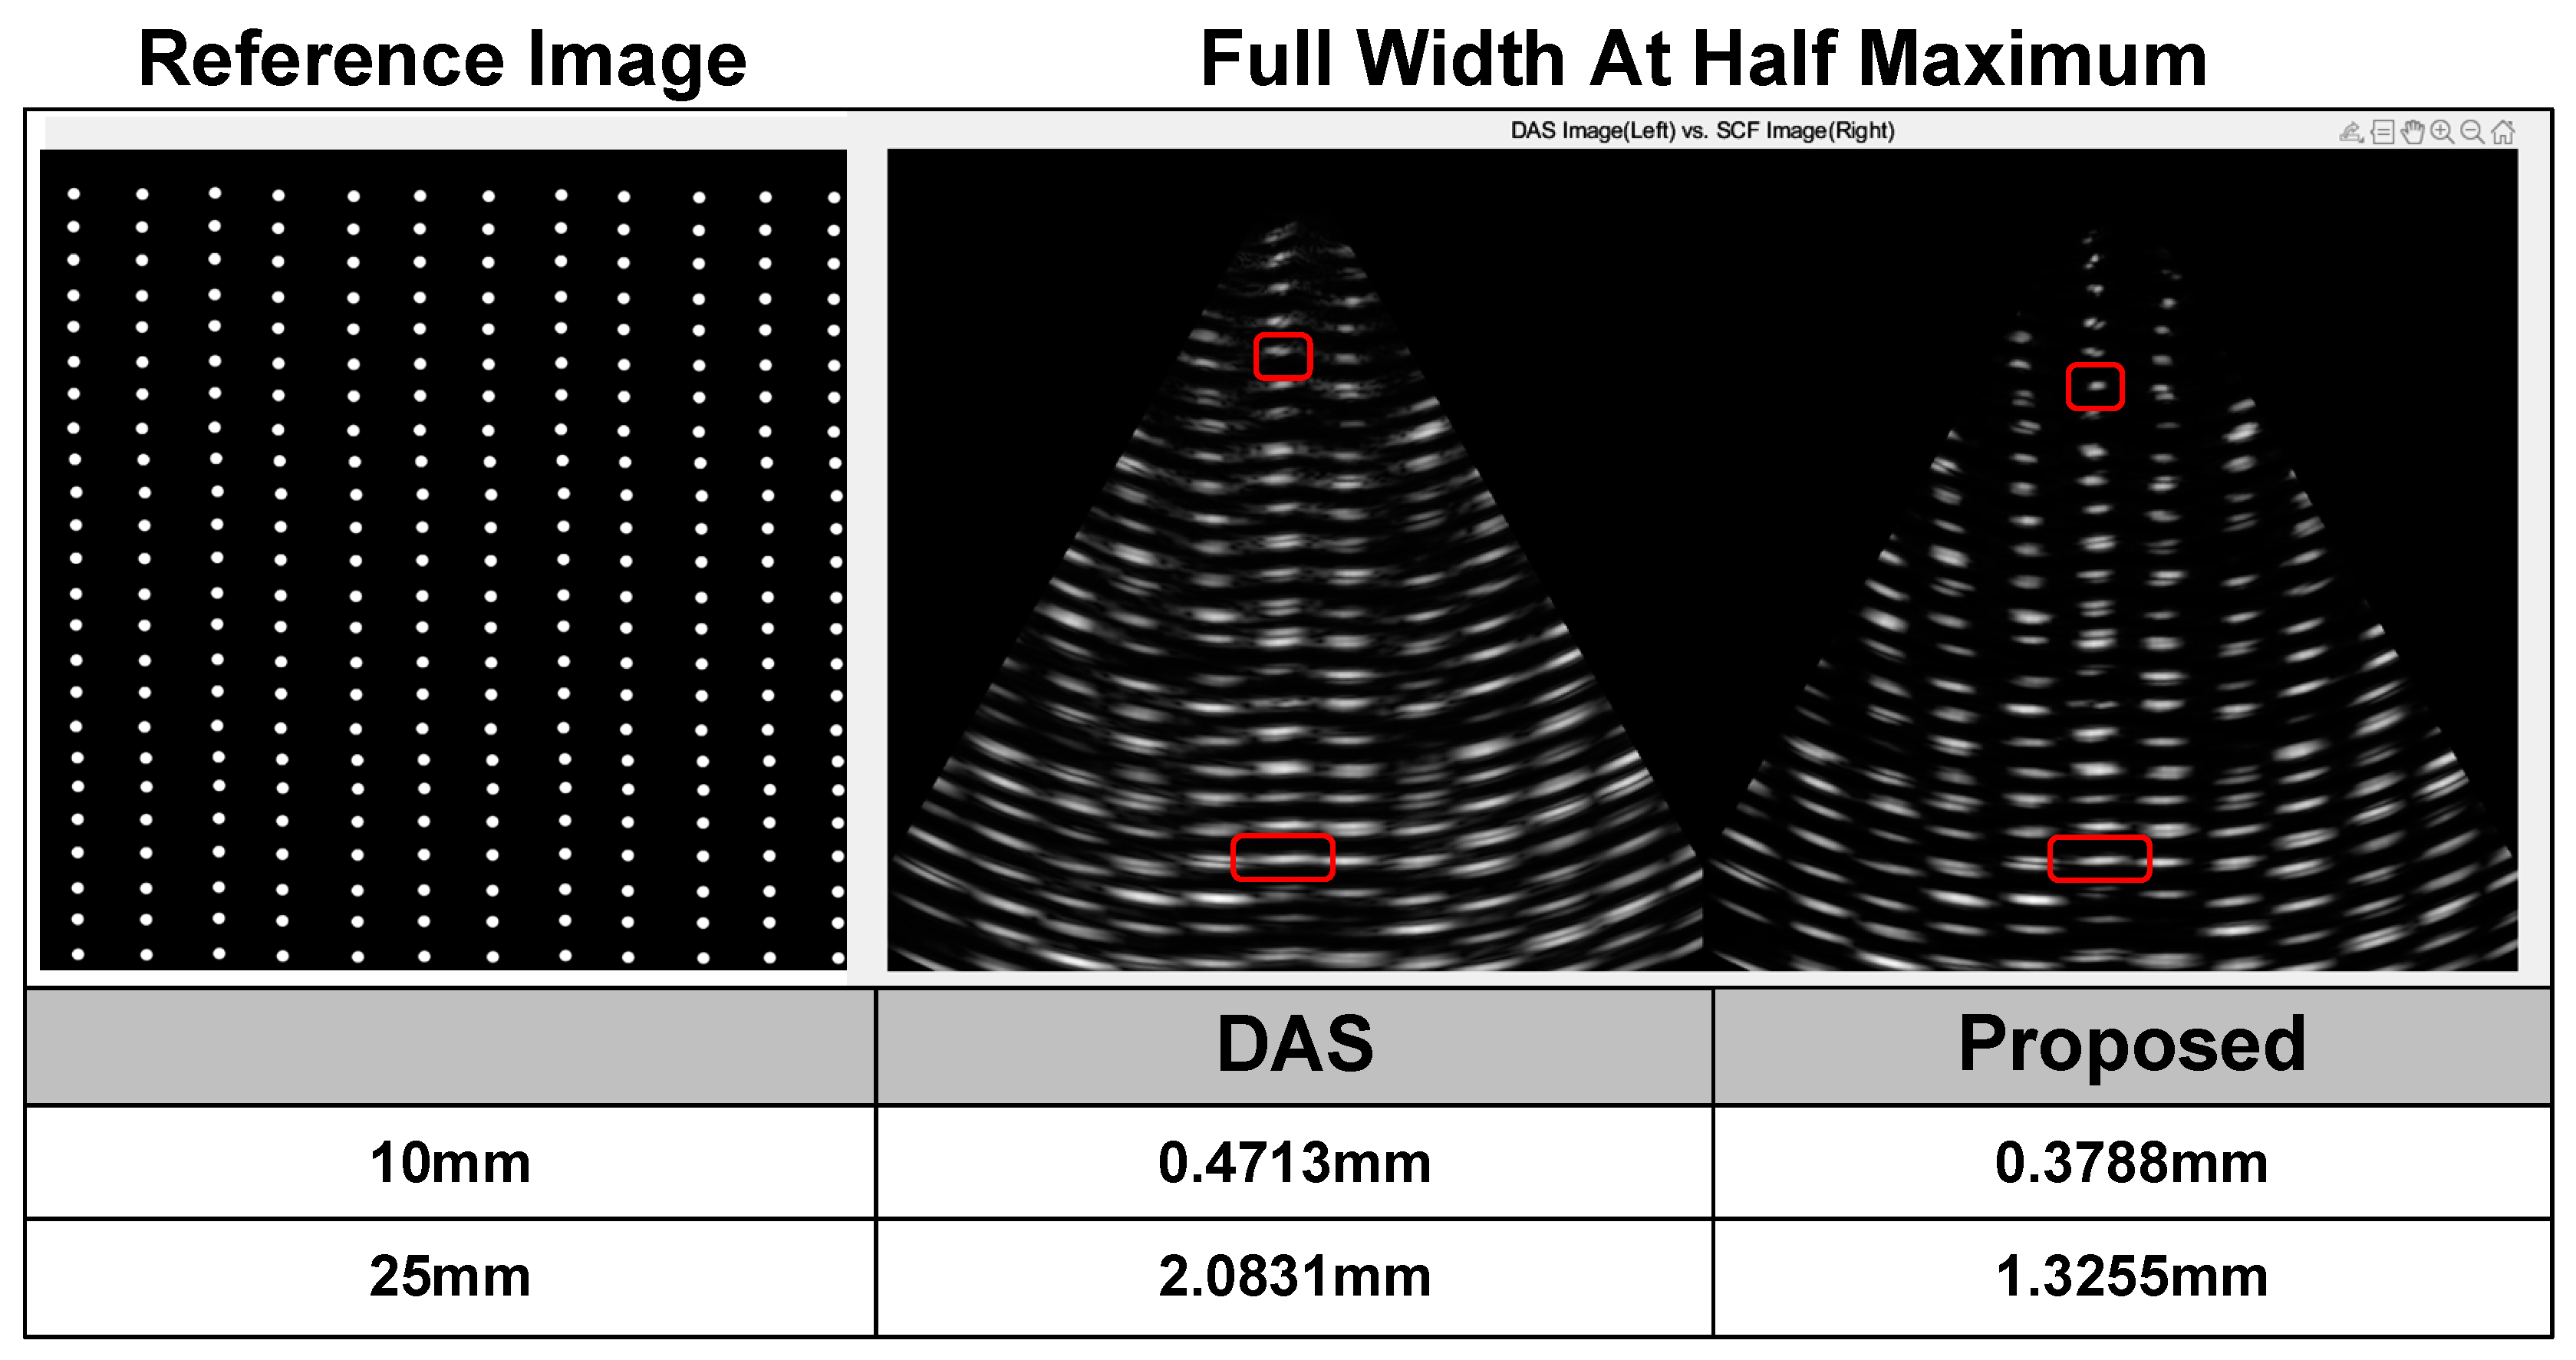
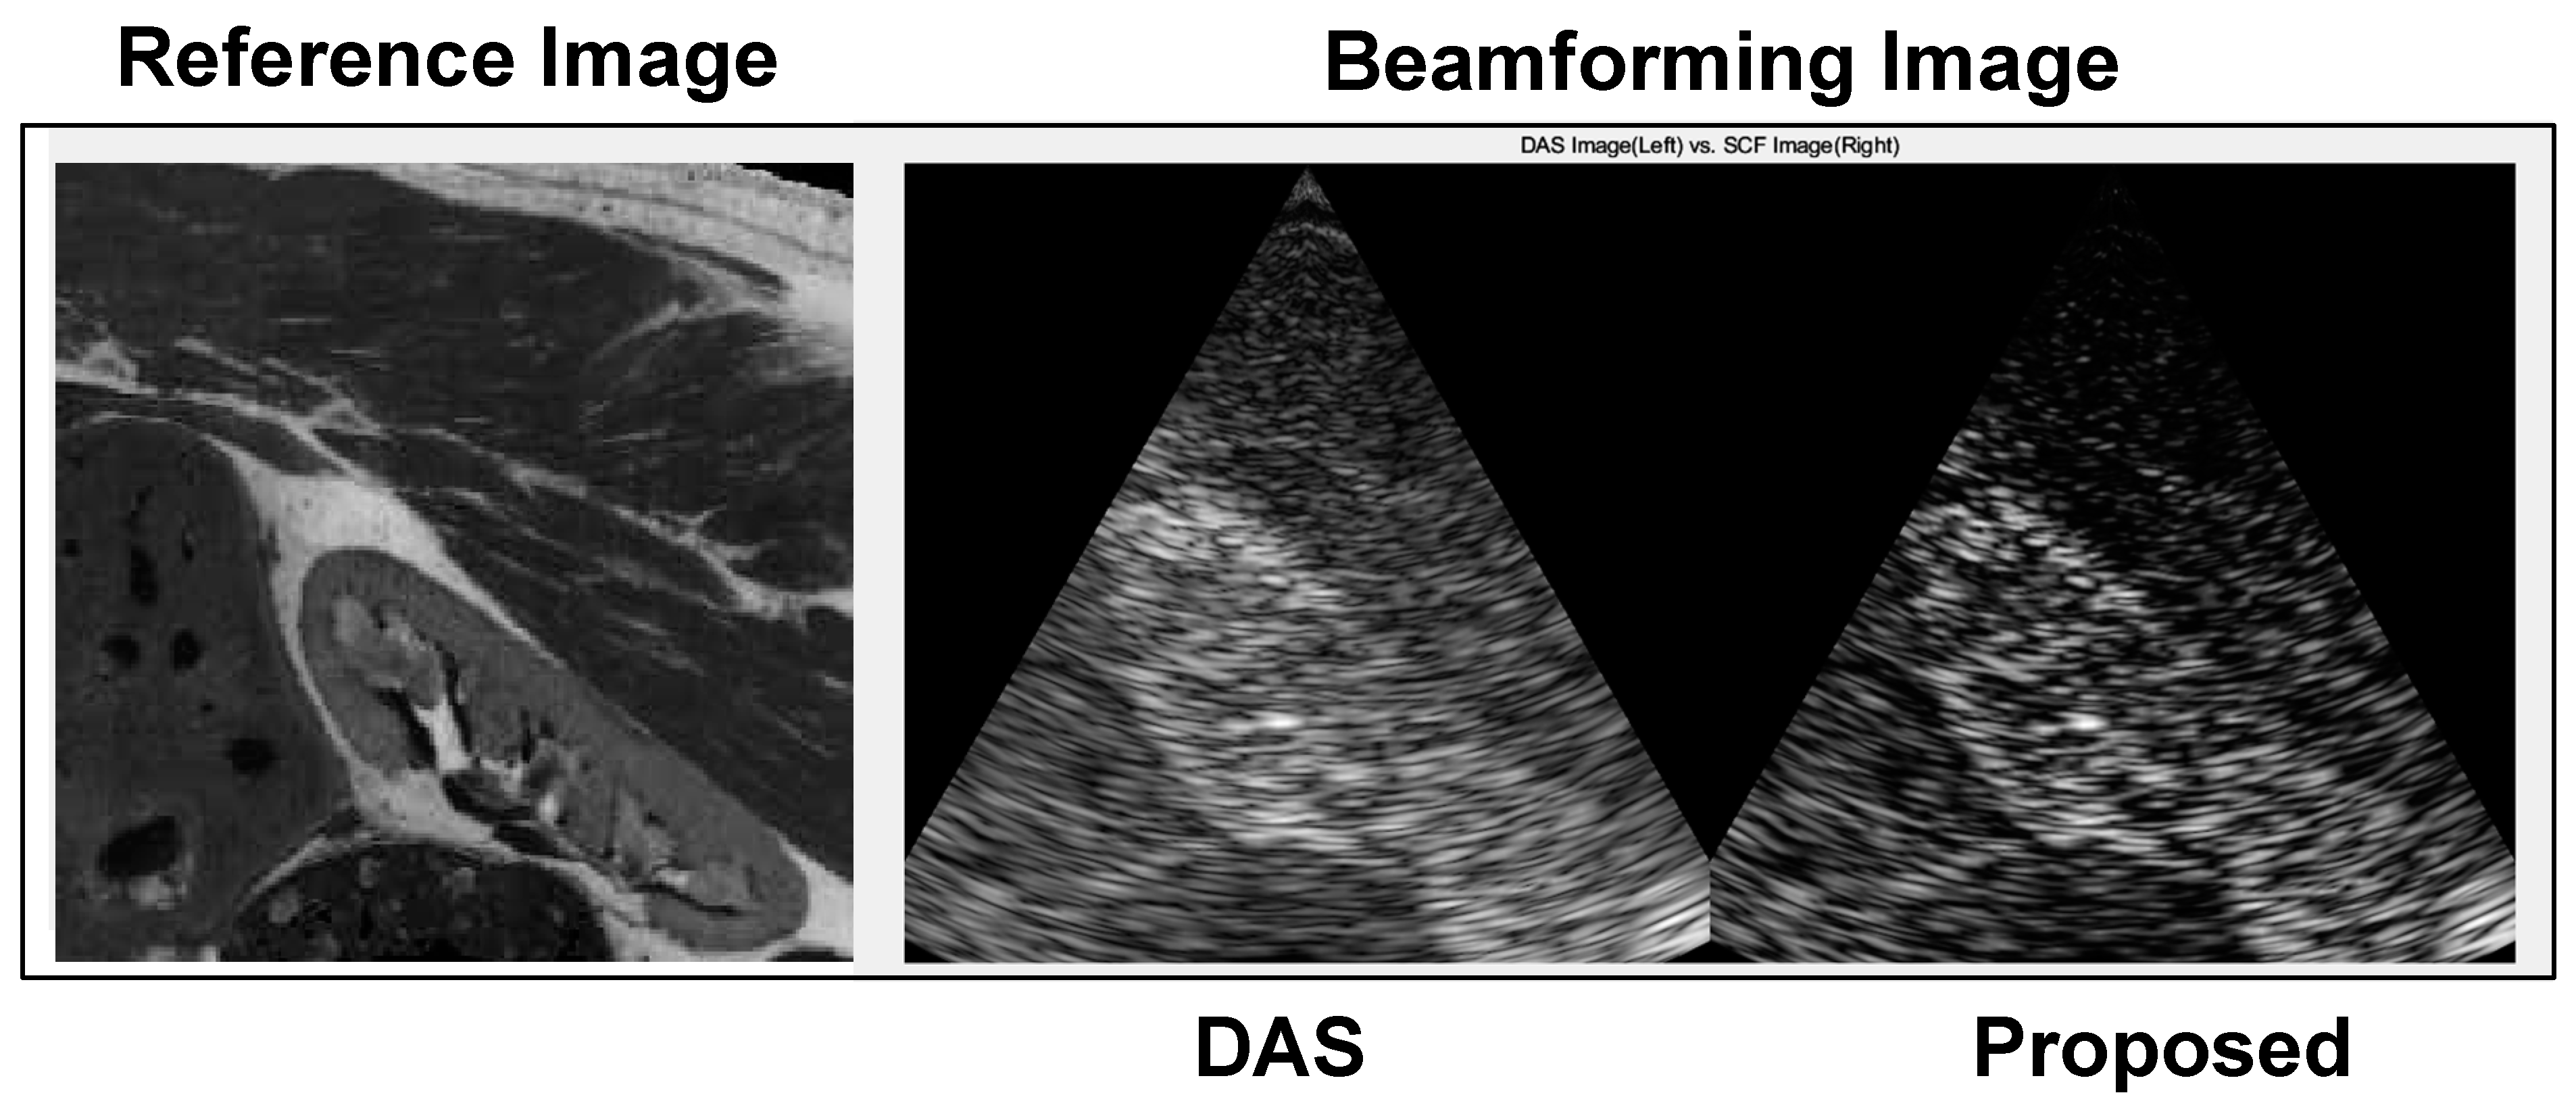
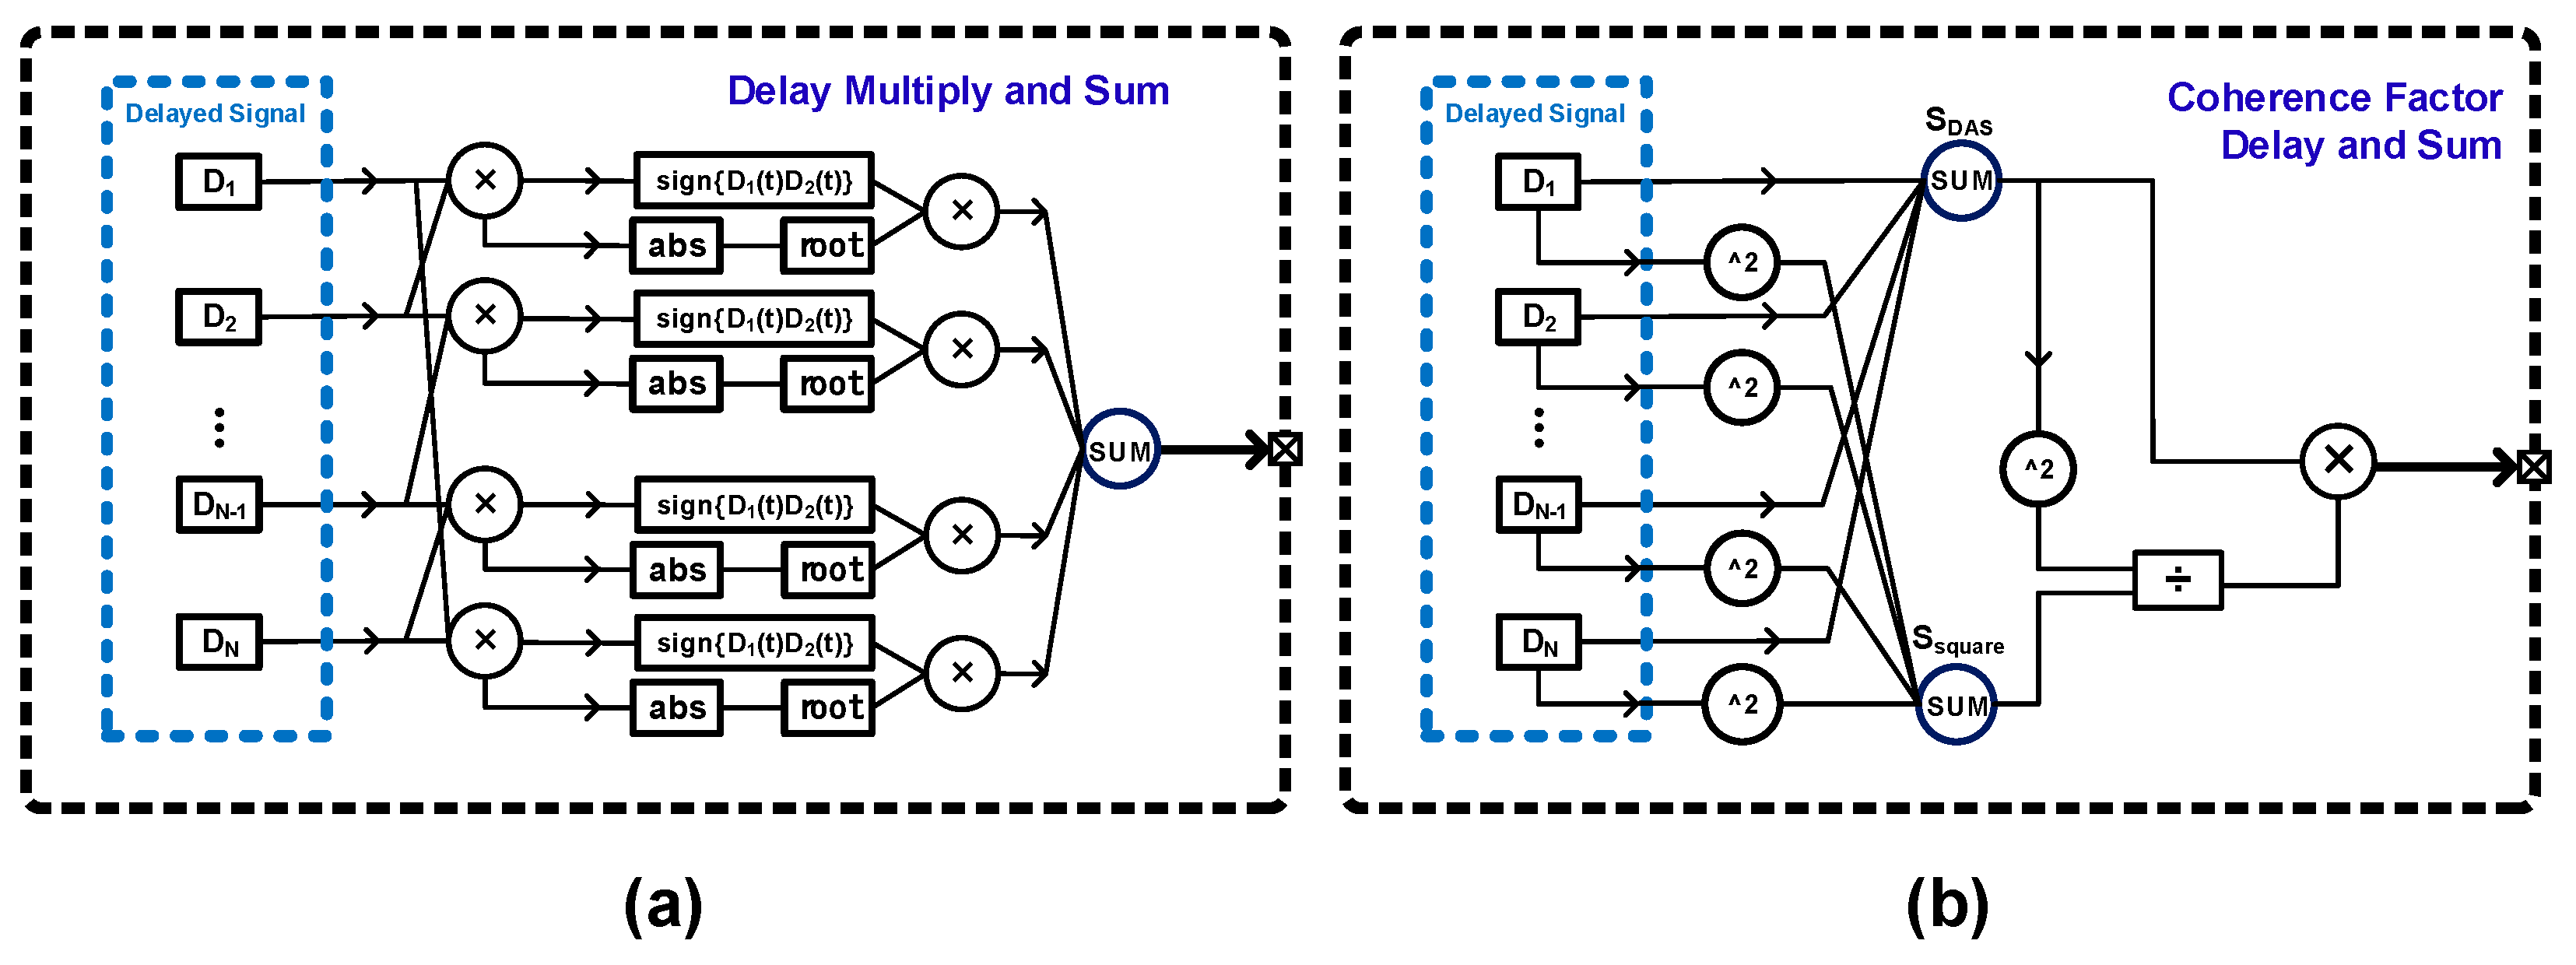
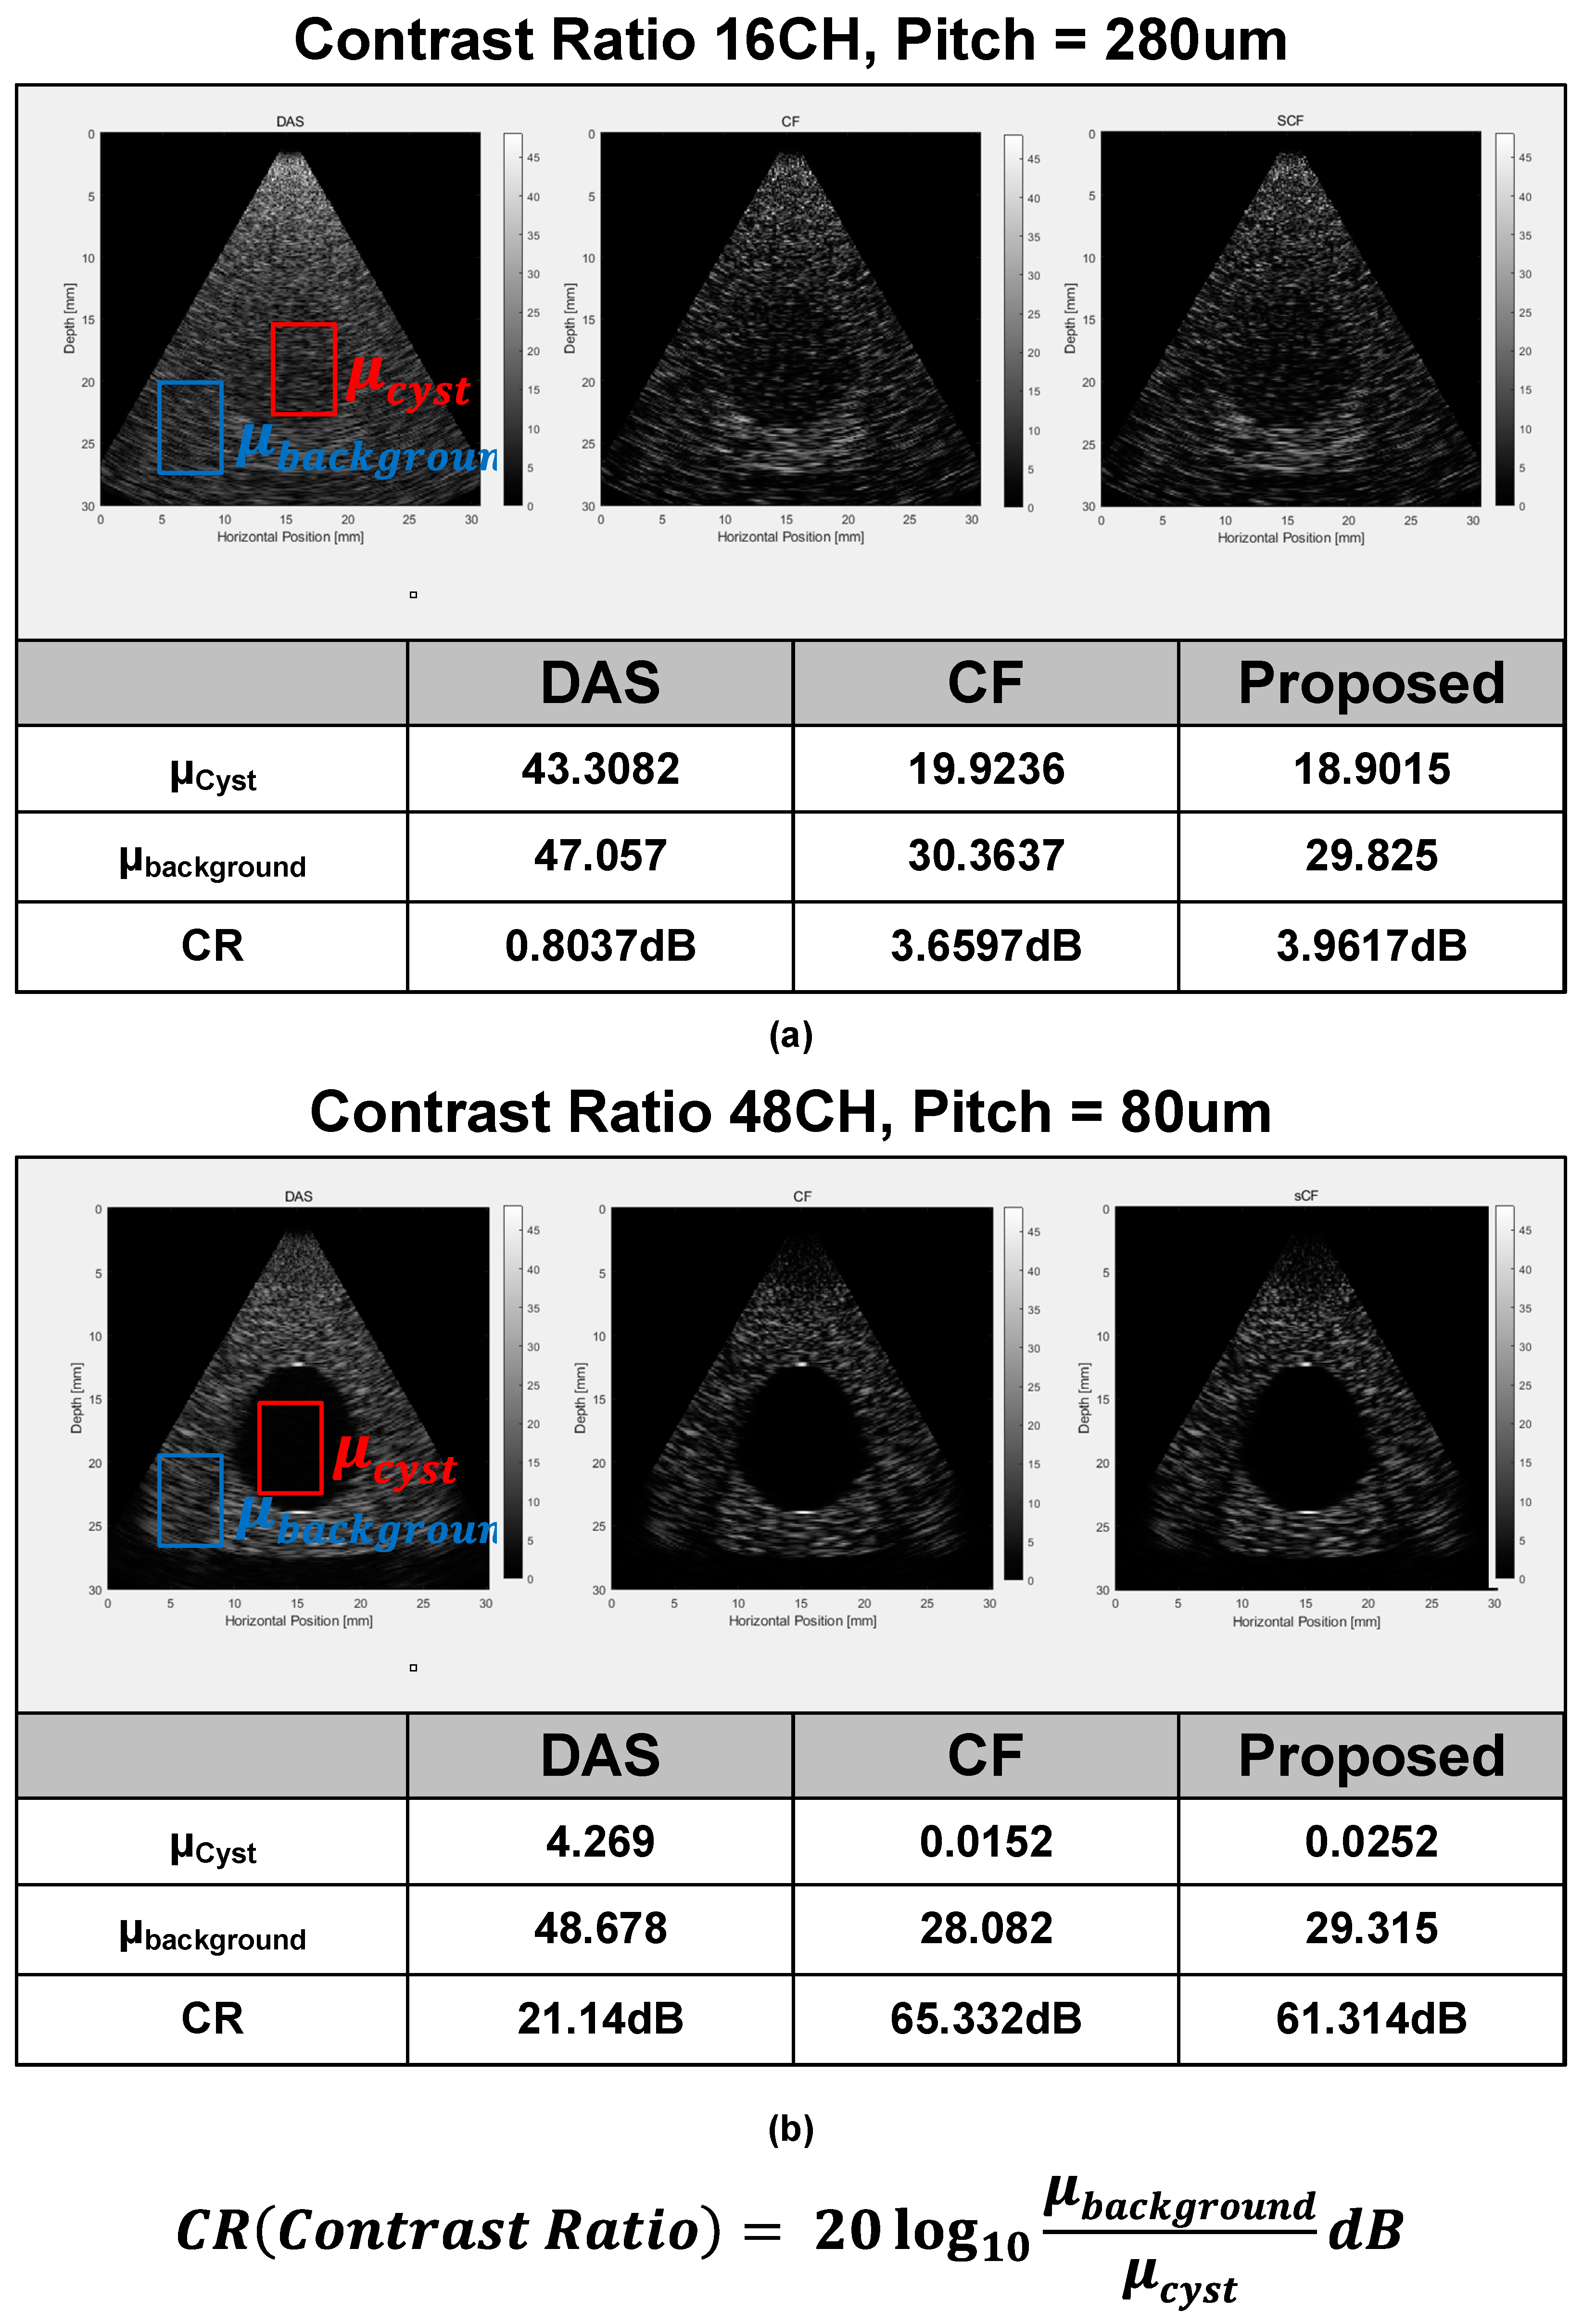
- A hardware-efficient Shift Coherence Factor (SCF) beamforming algorithm that produces high-resolution images.
2. System Features
3. Beamformer Implementation
3.1. CRHV TX Pulser
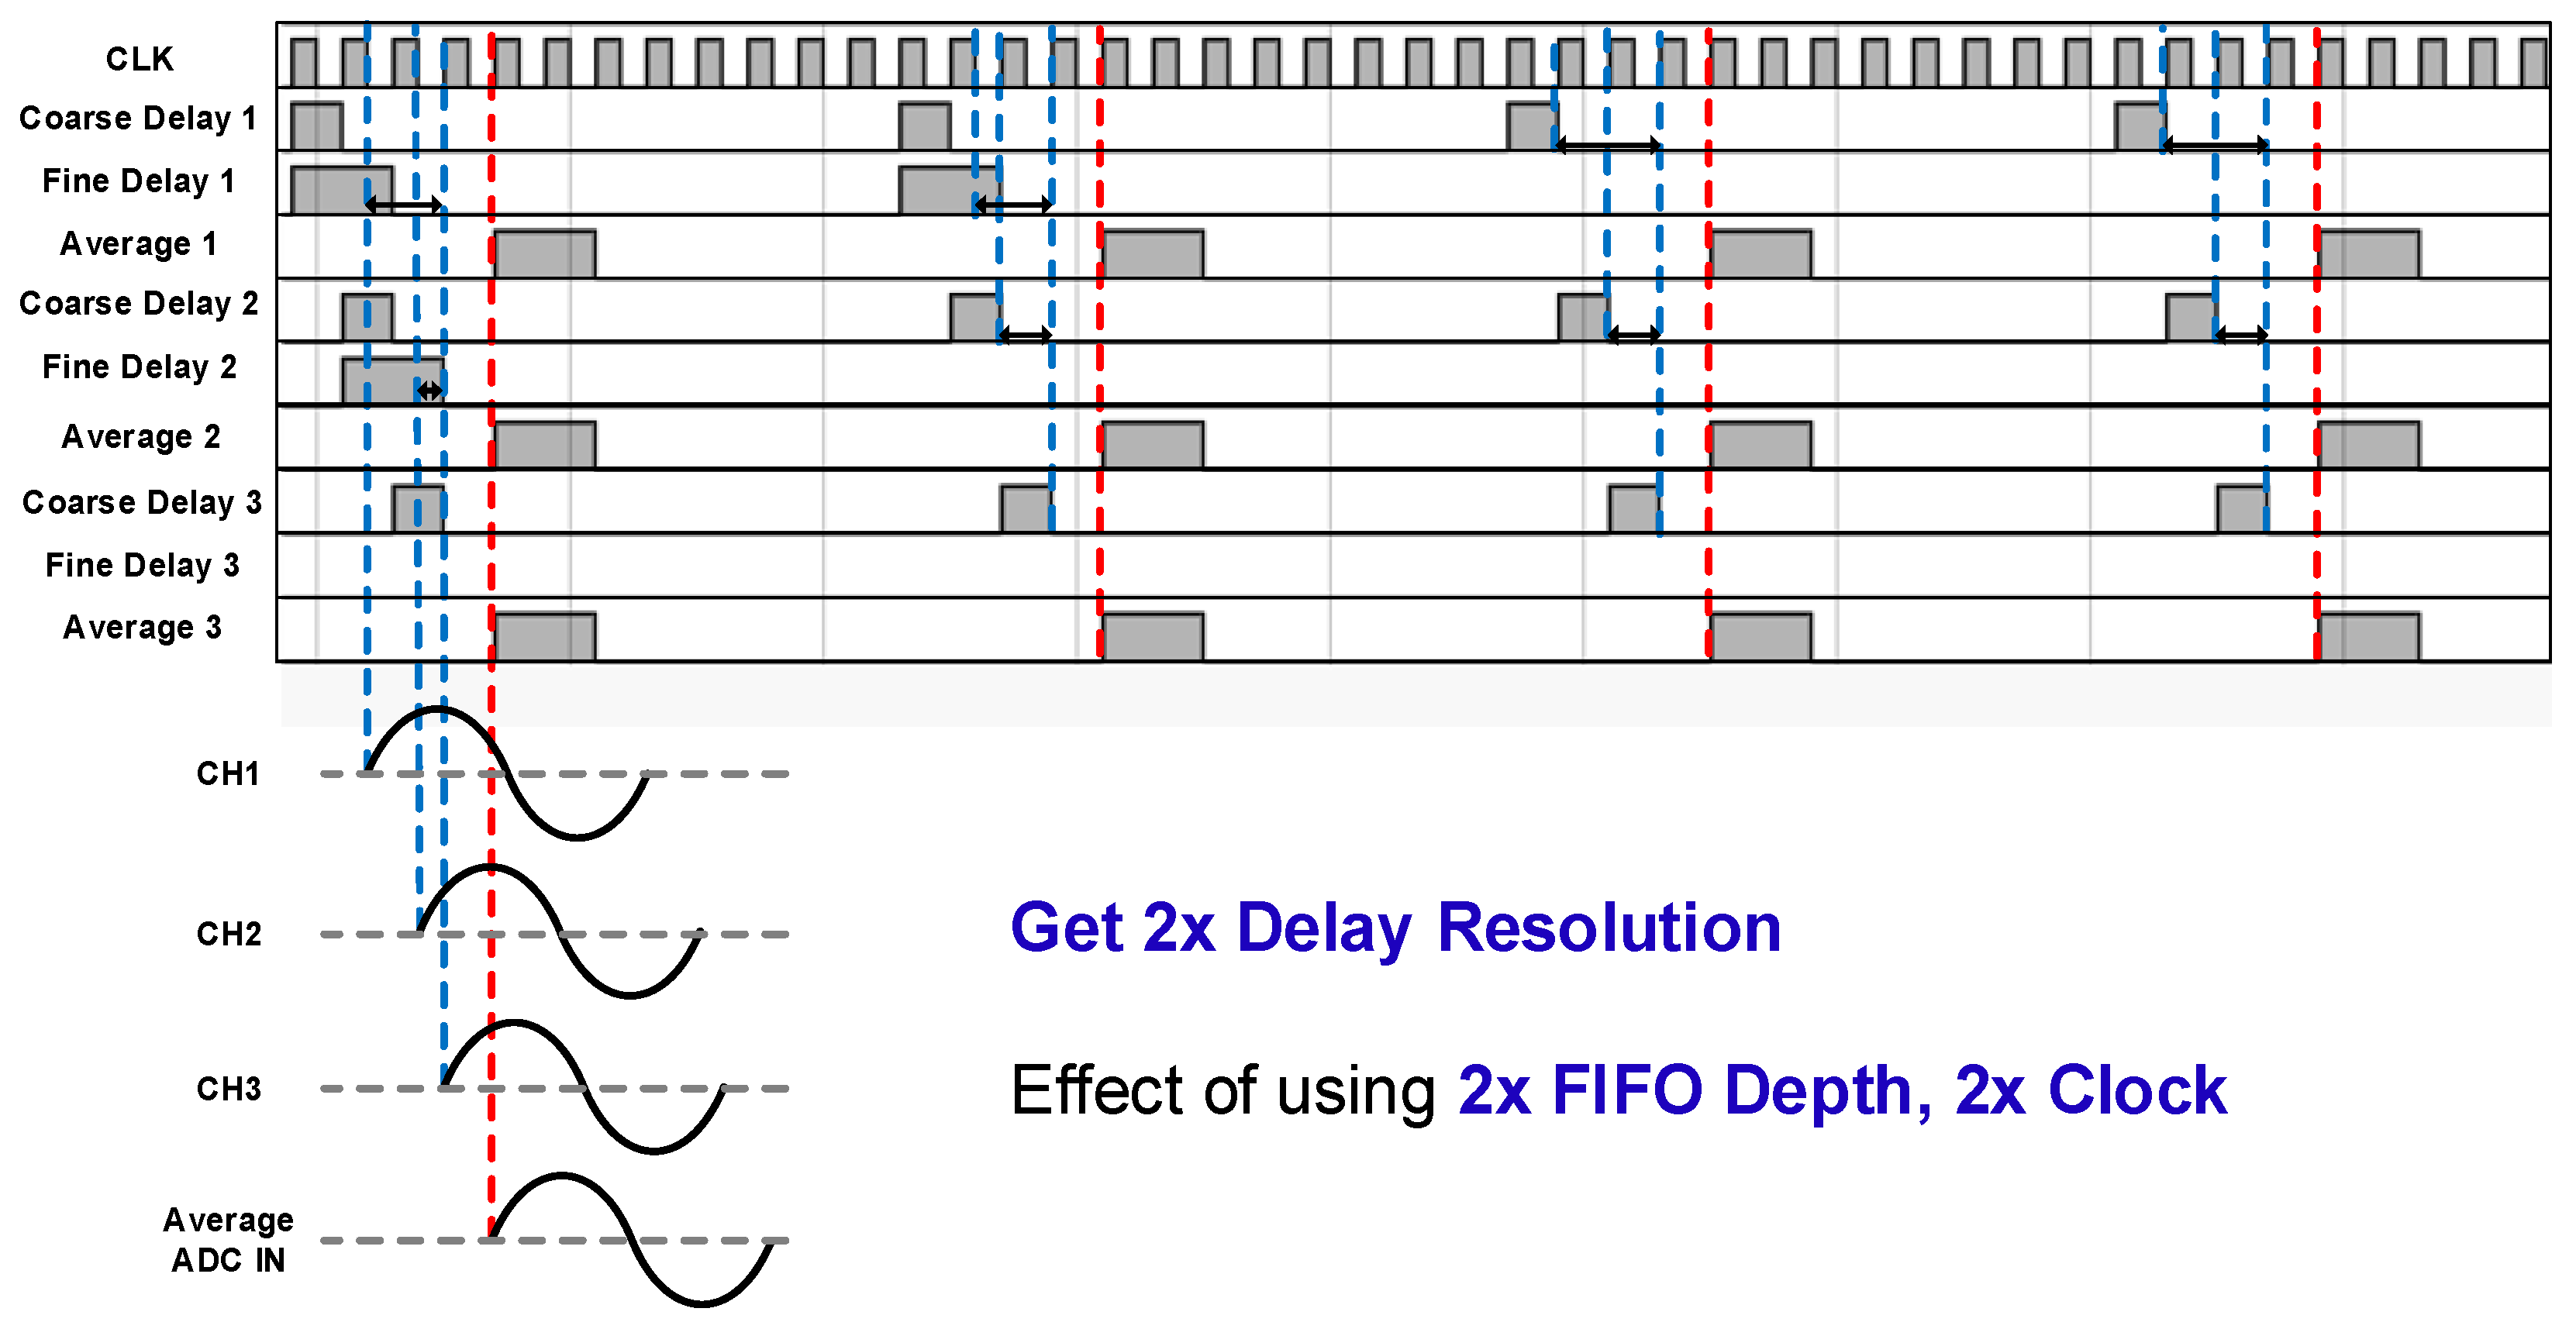
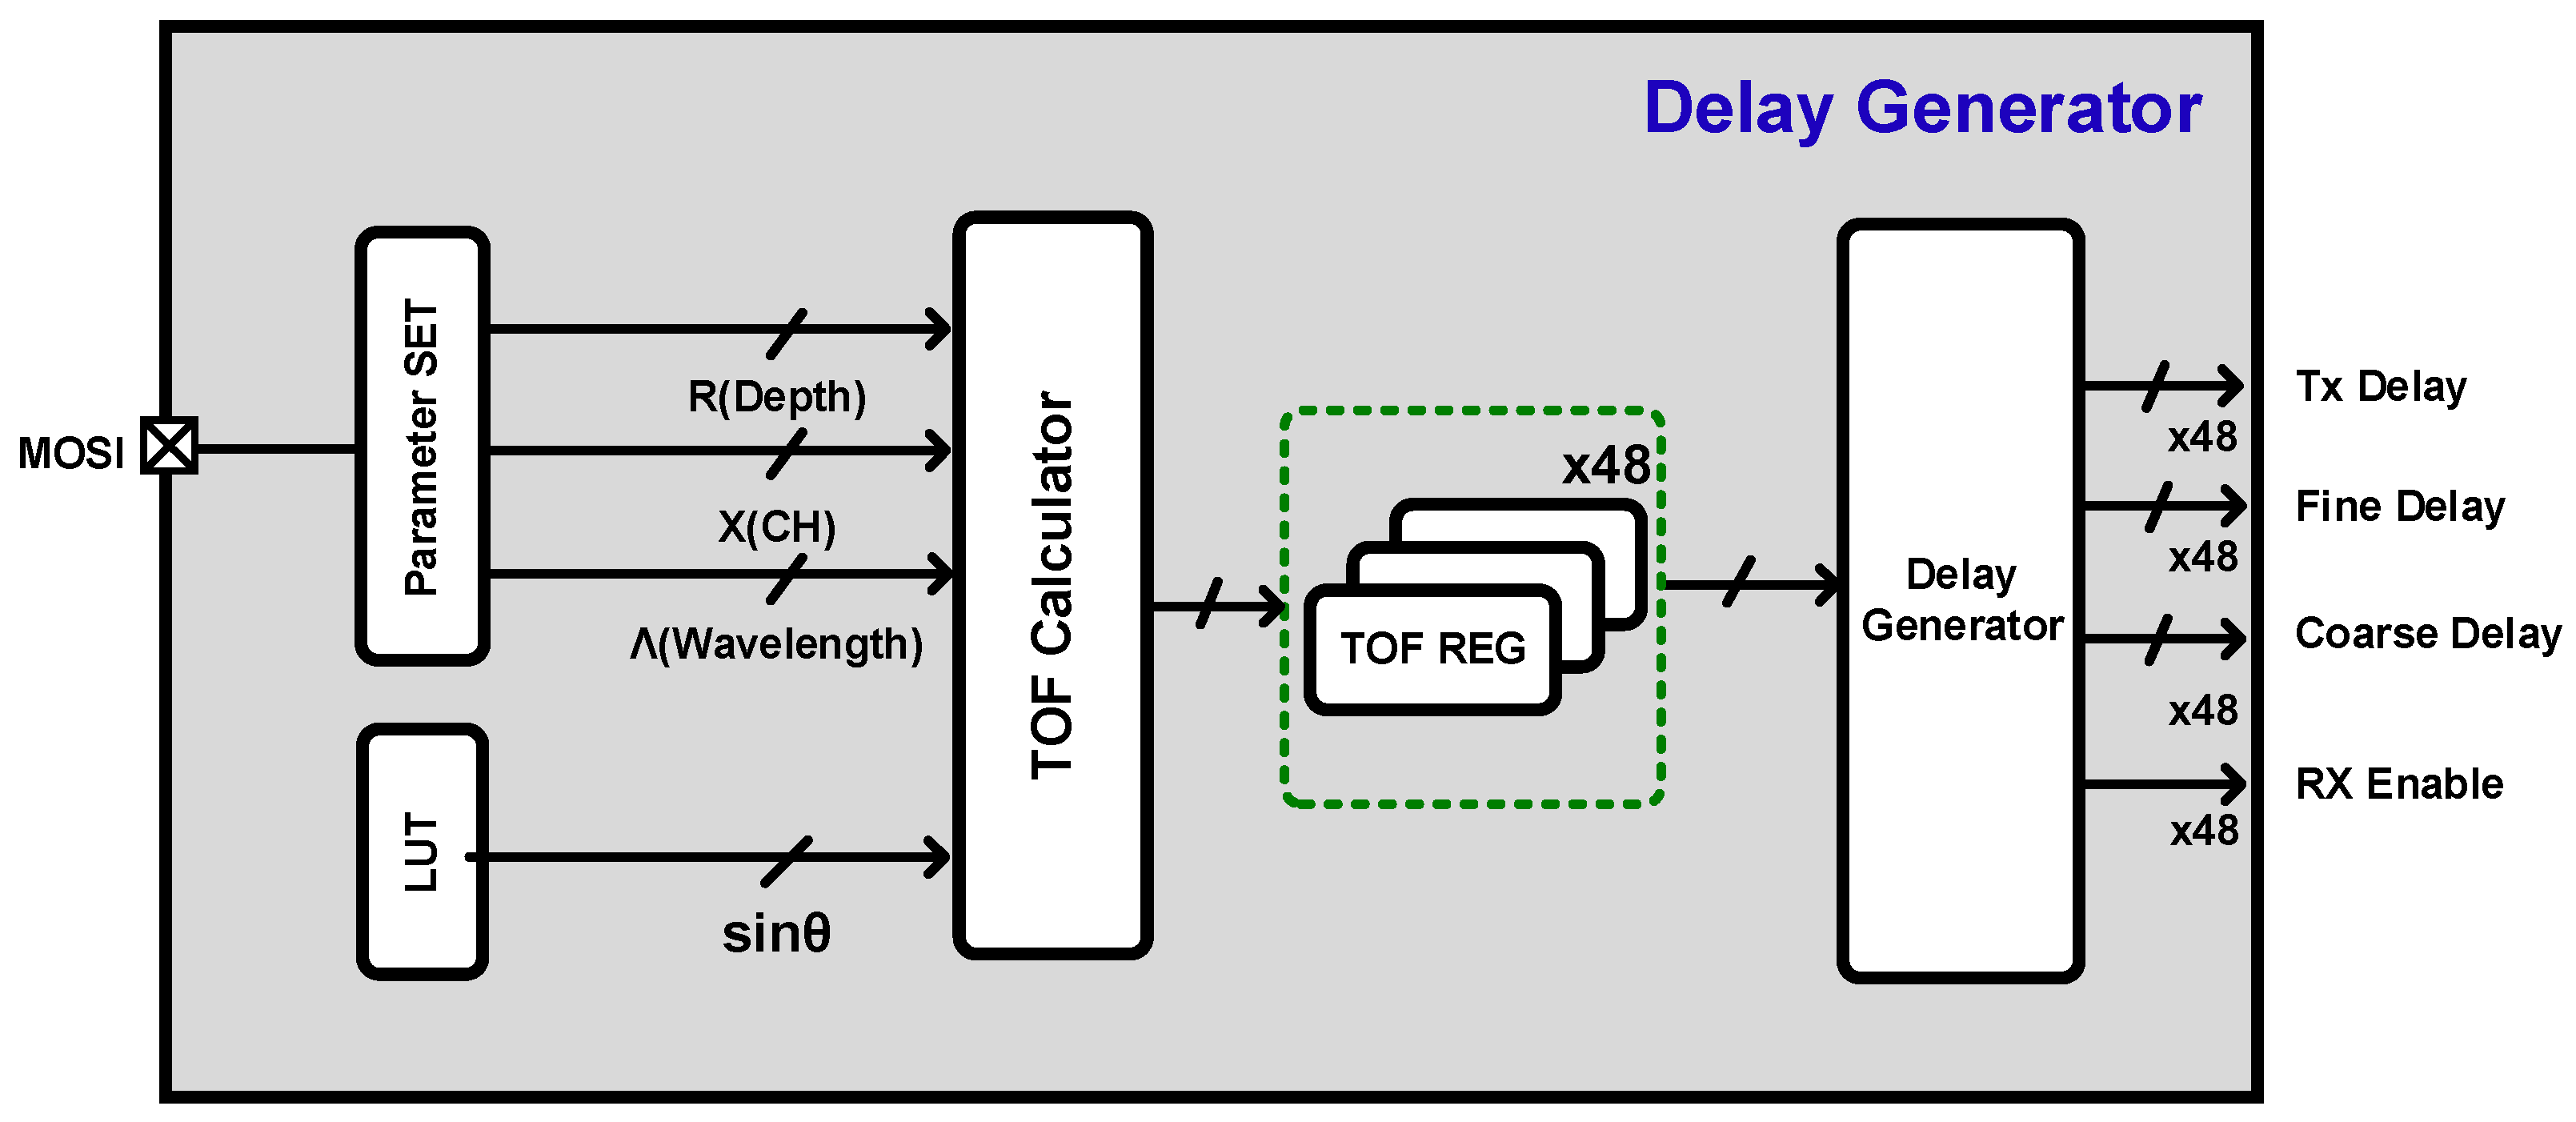
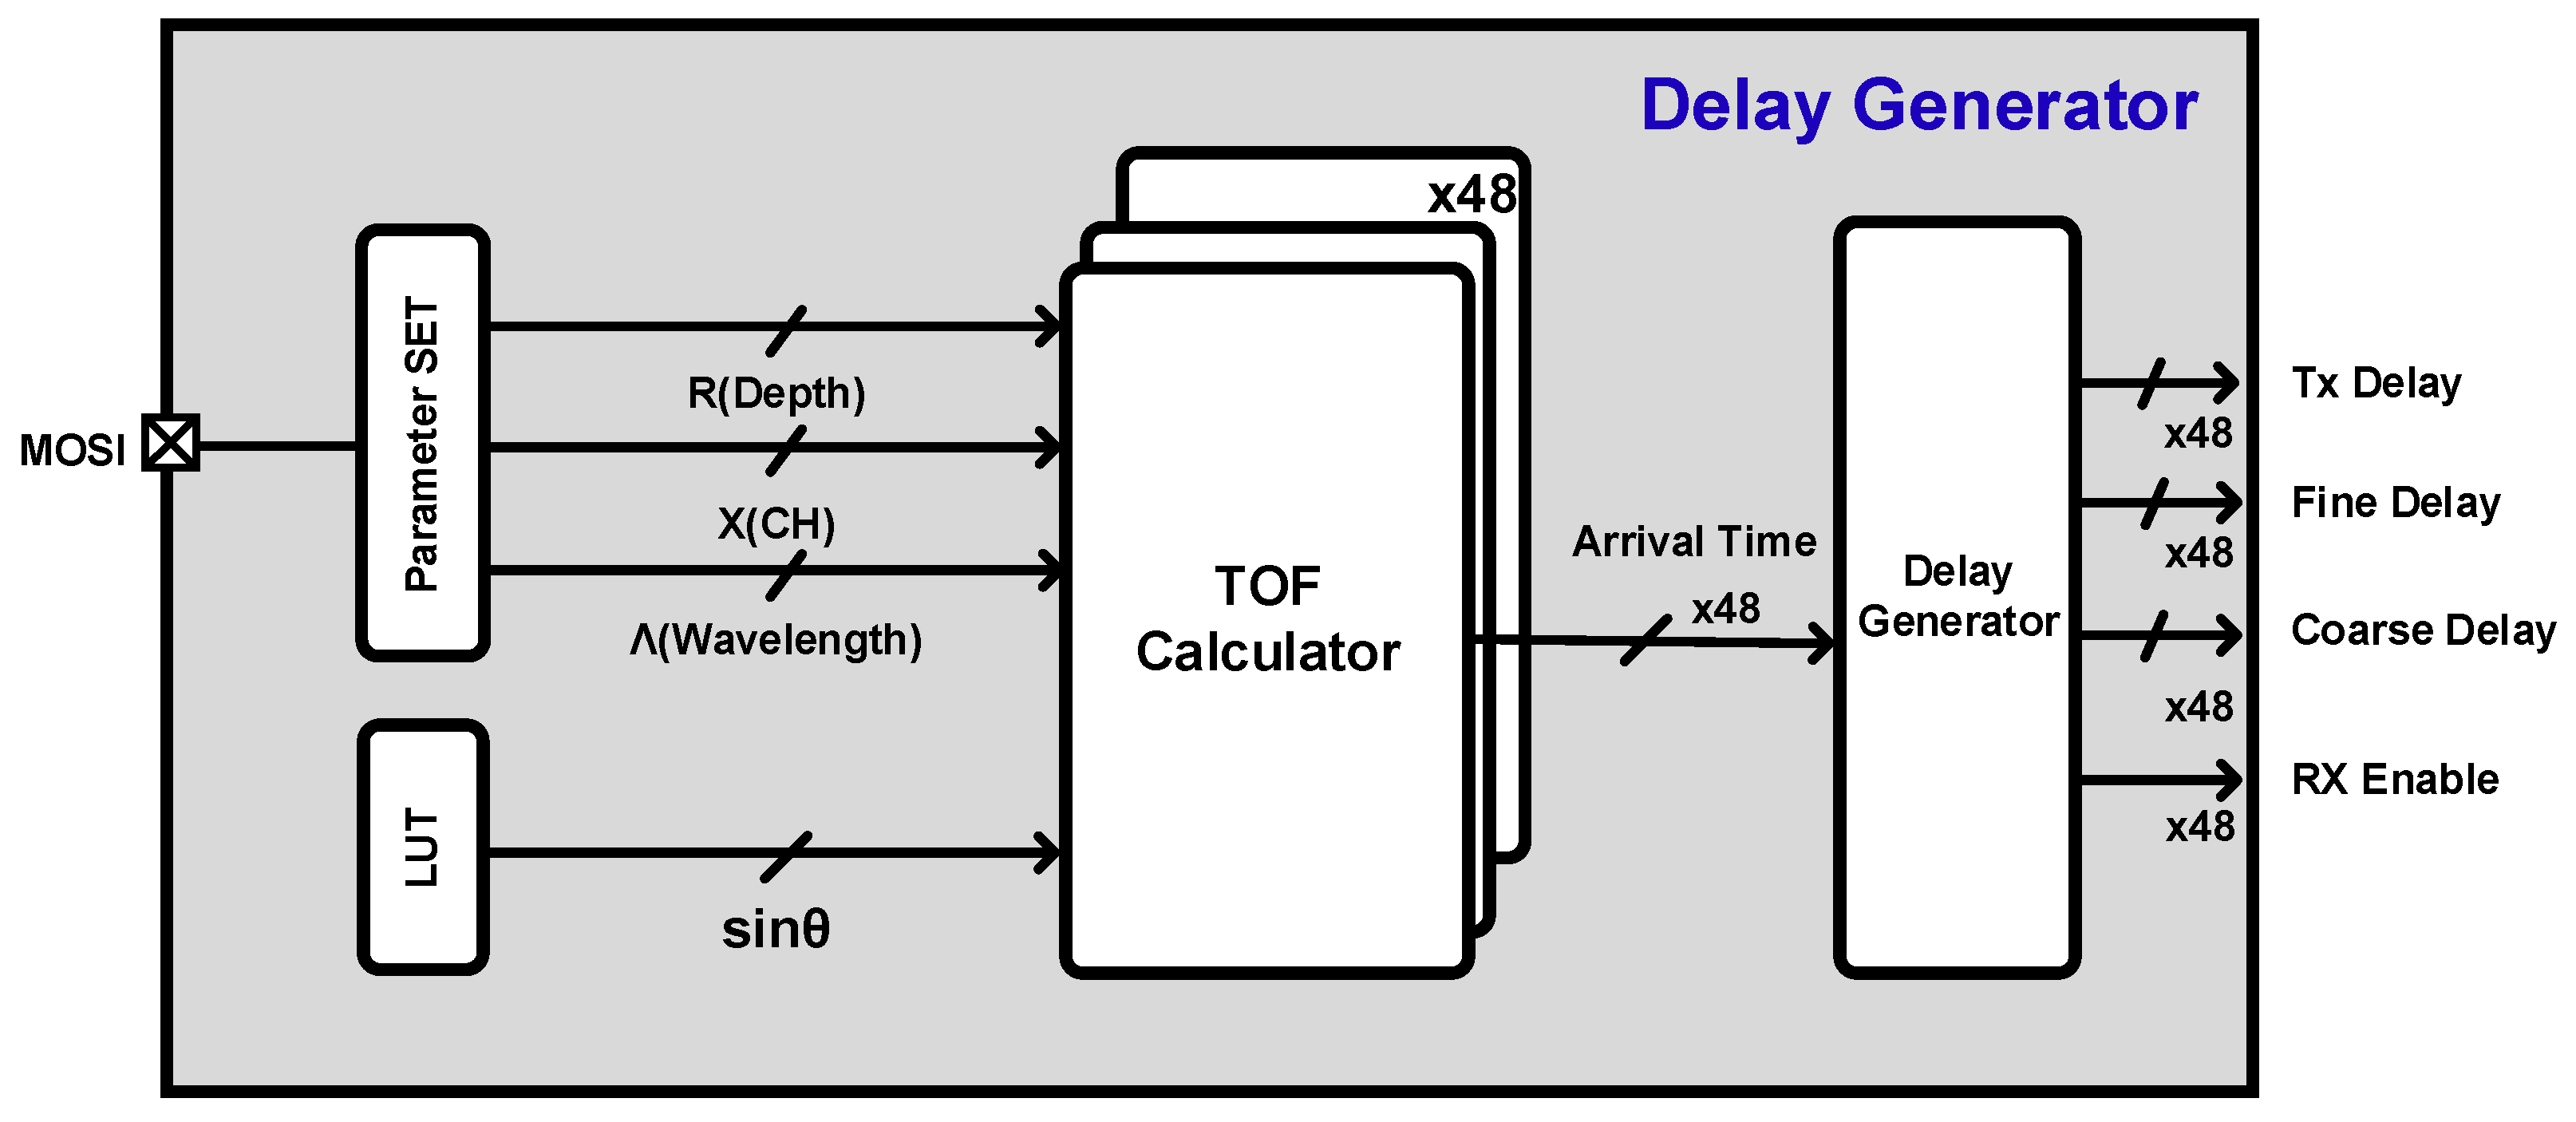
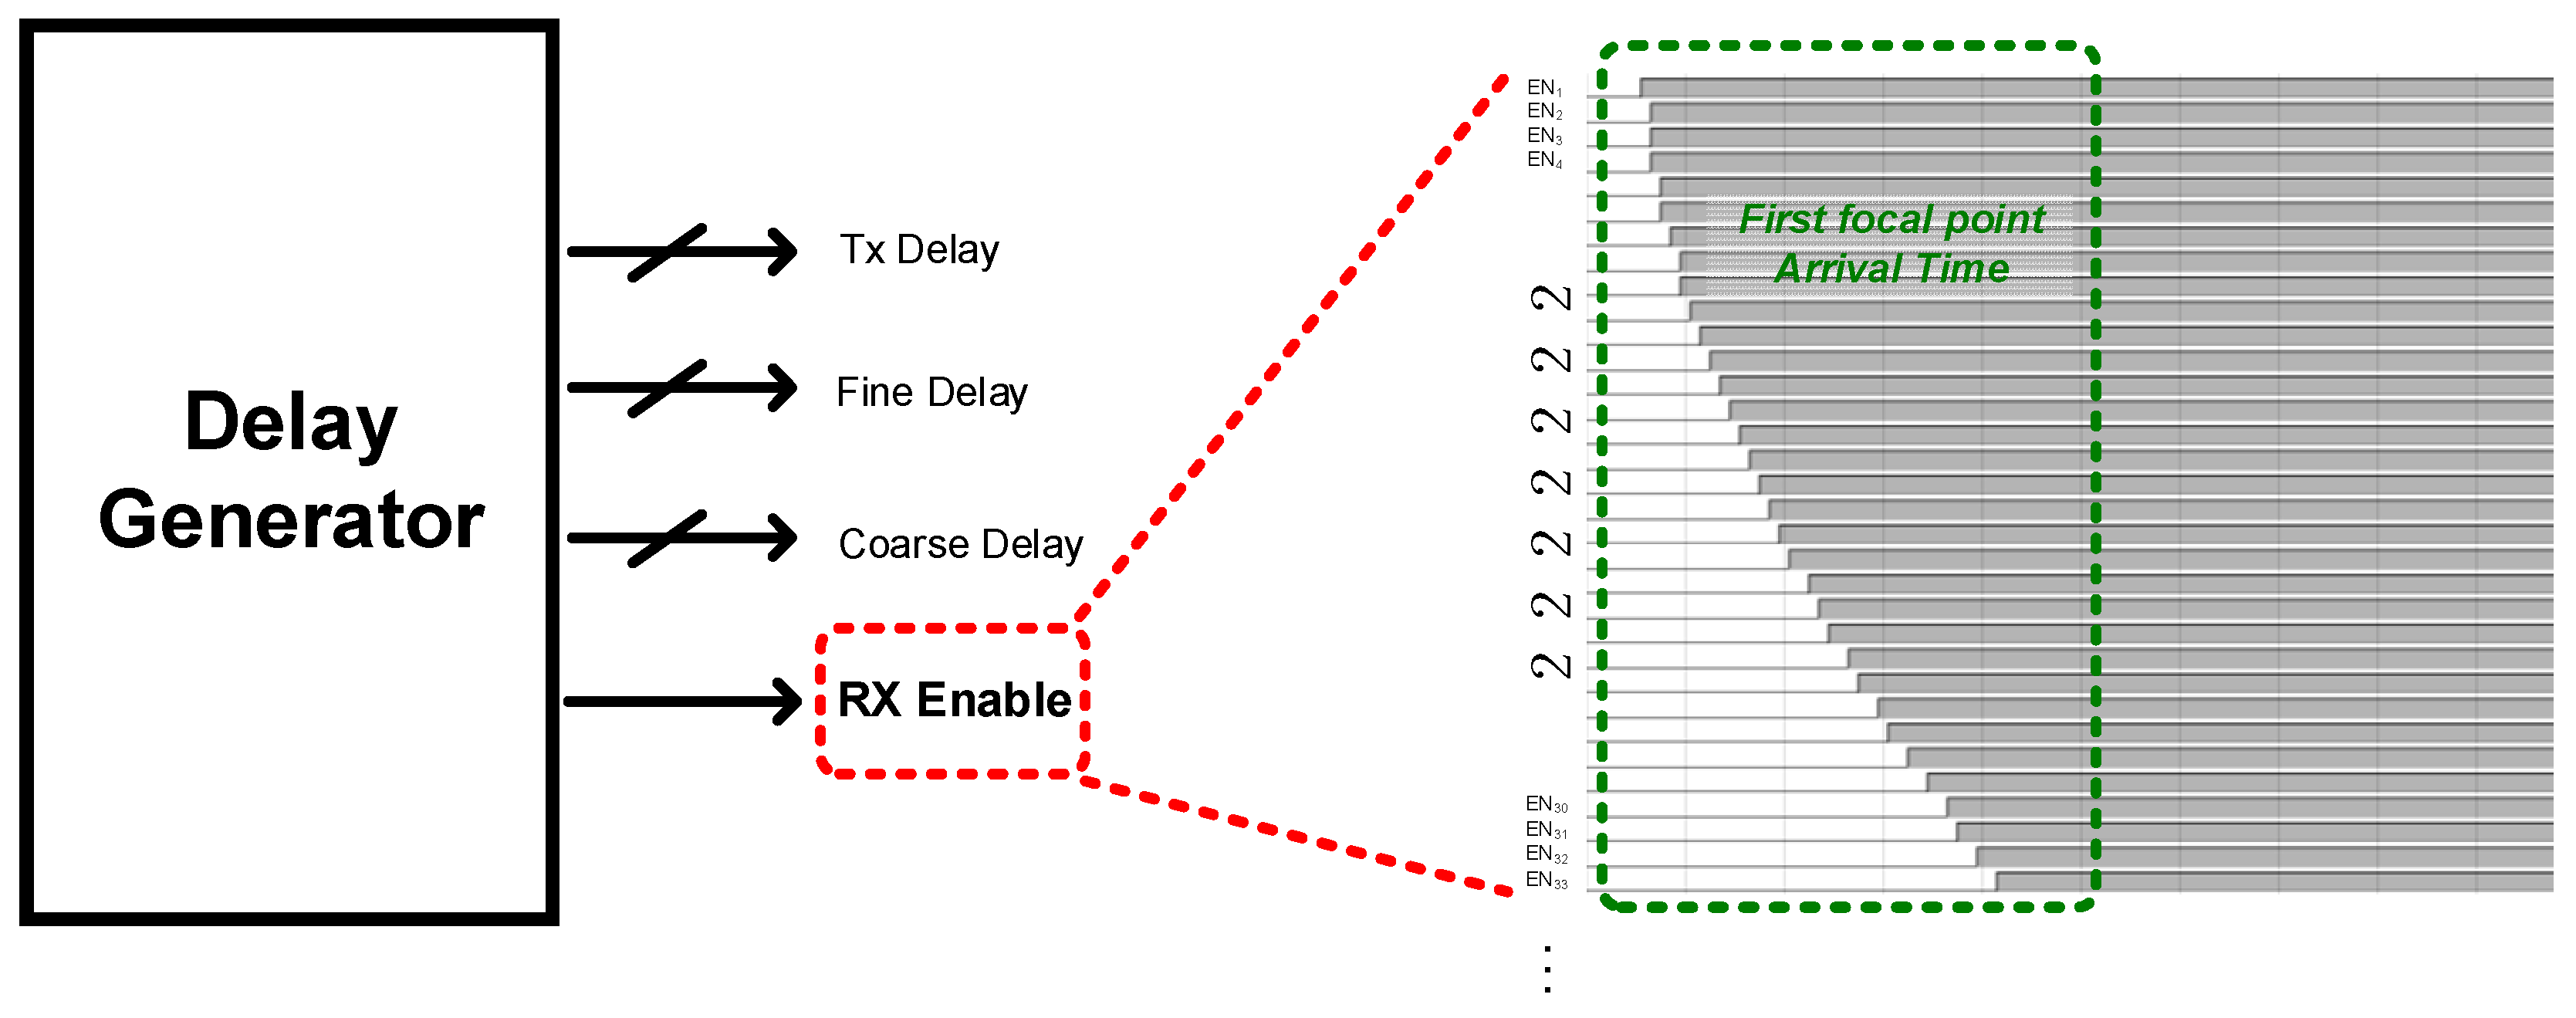
3.2. Delay Generator
3.3. Hybrid Subarray Beamforming Architecture
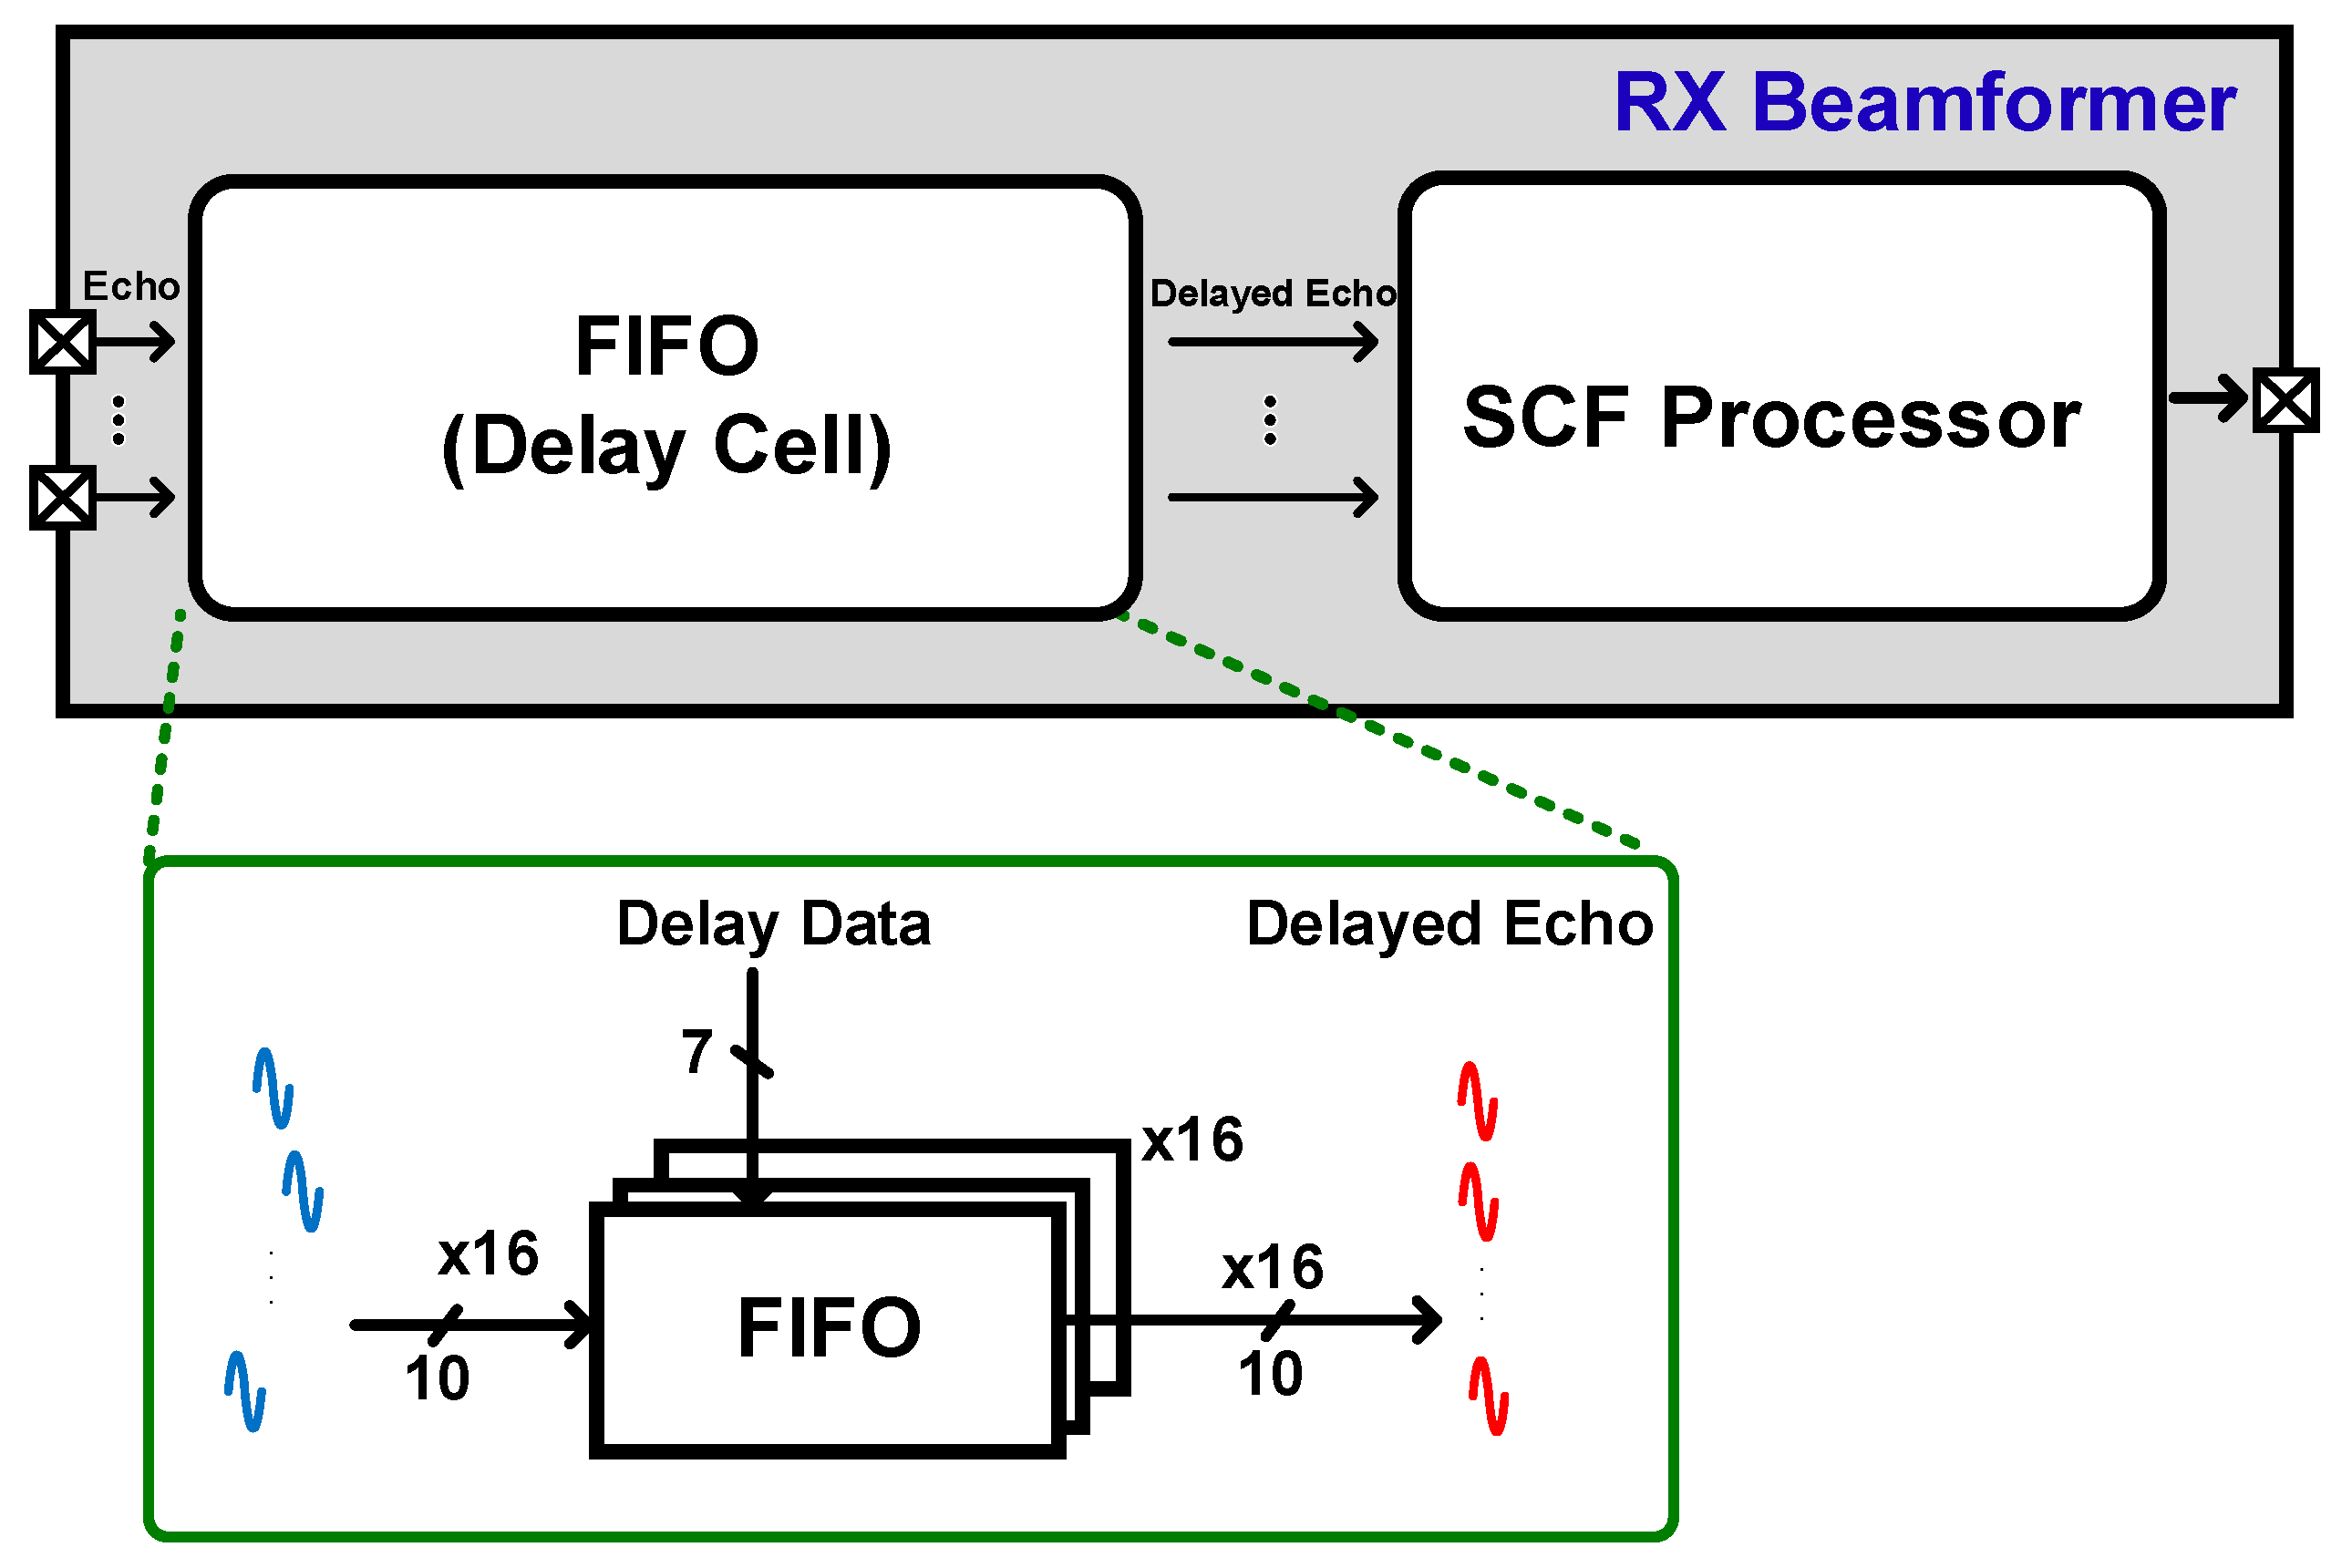
3.4. Digital RX Beamformer
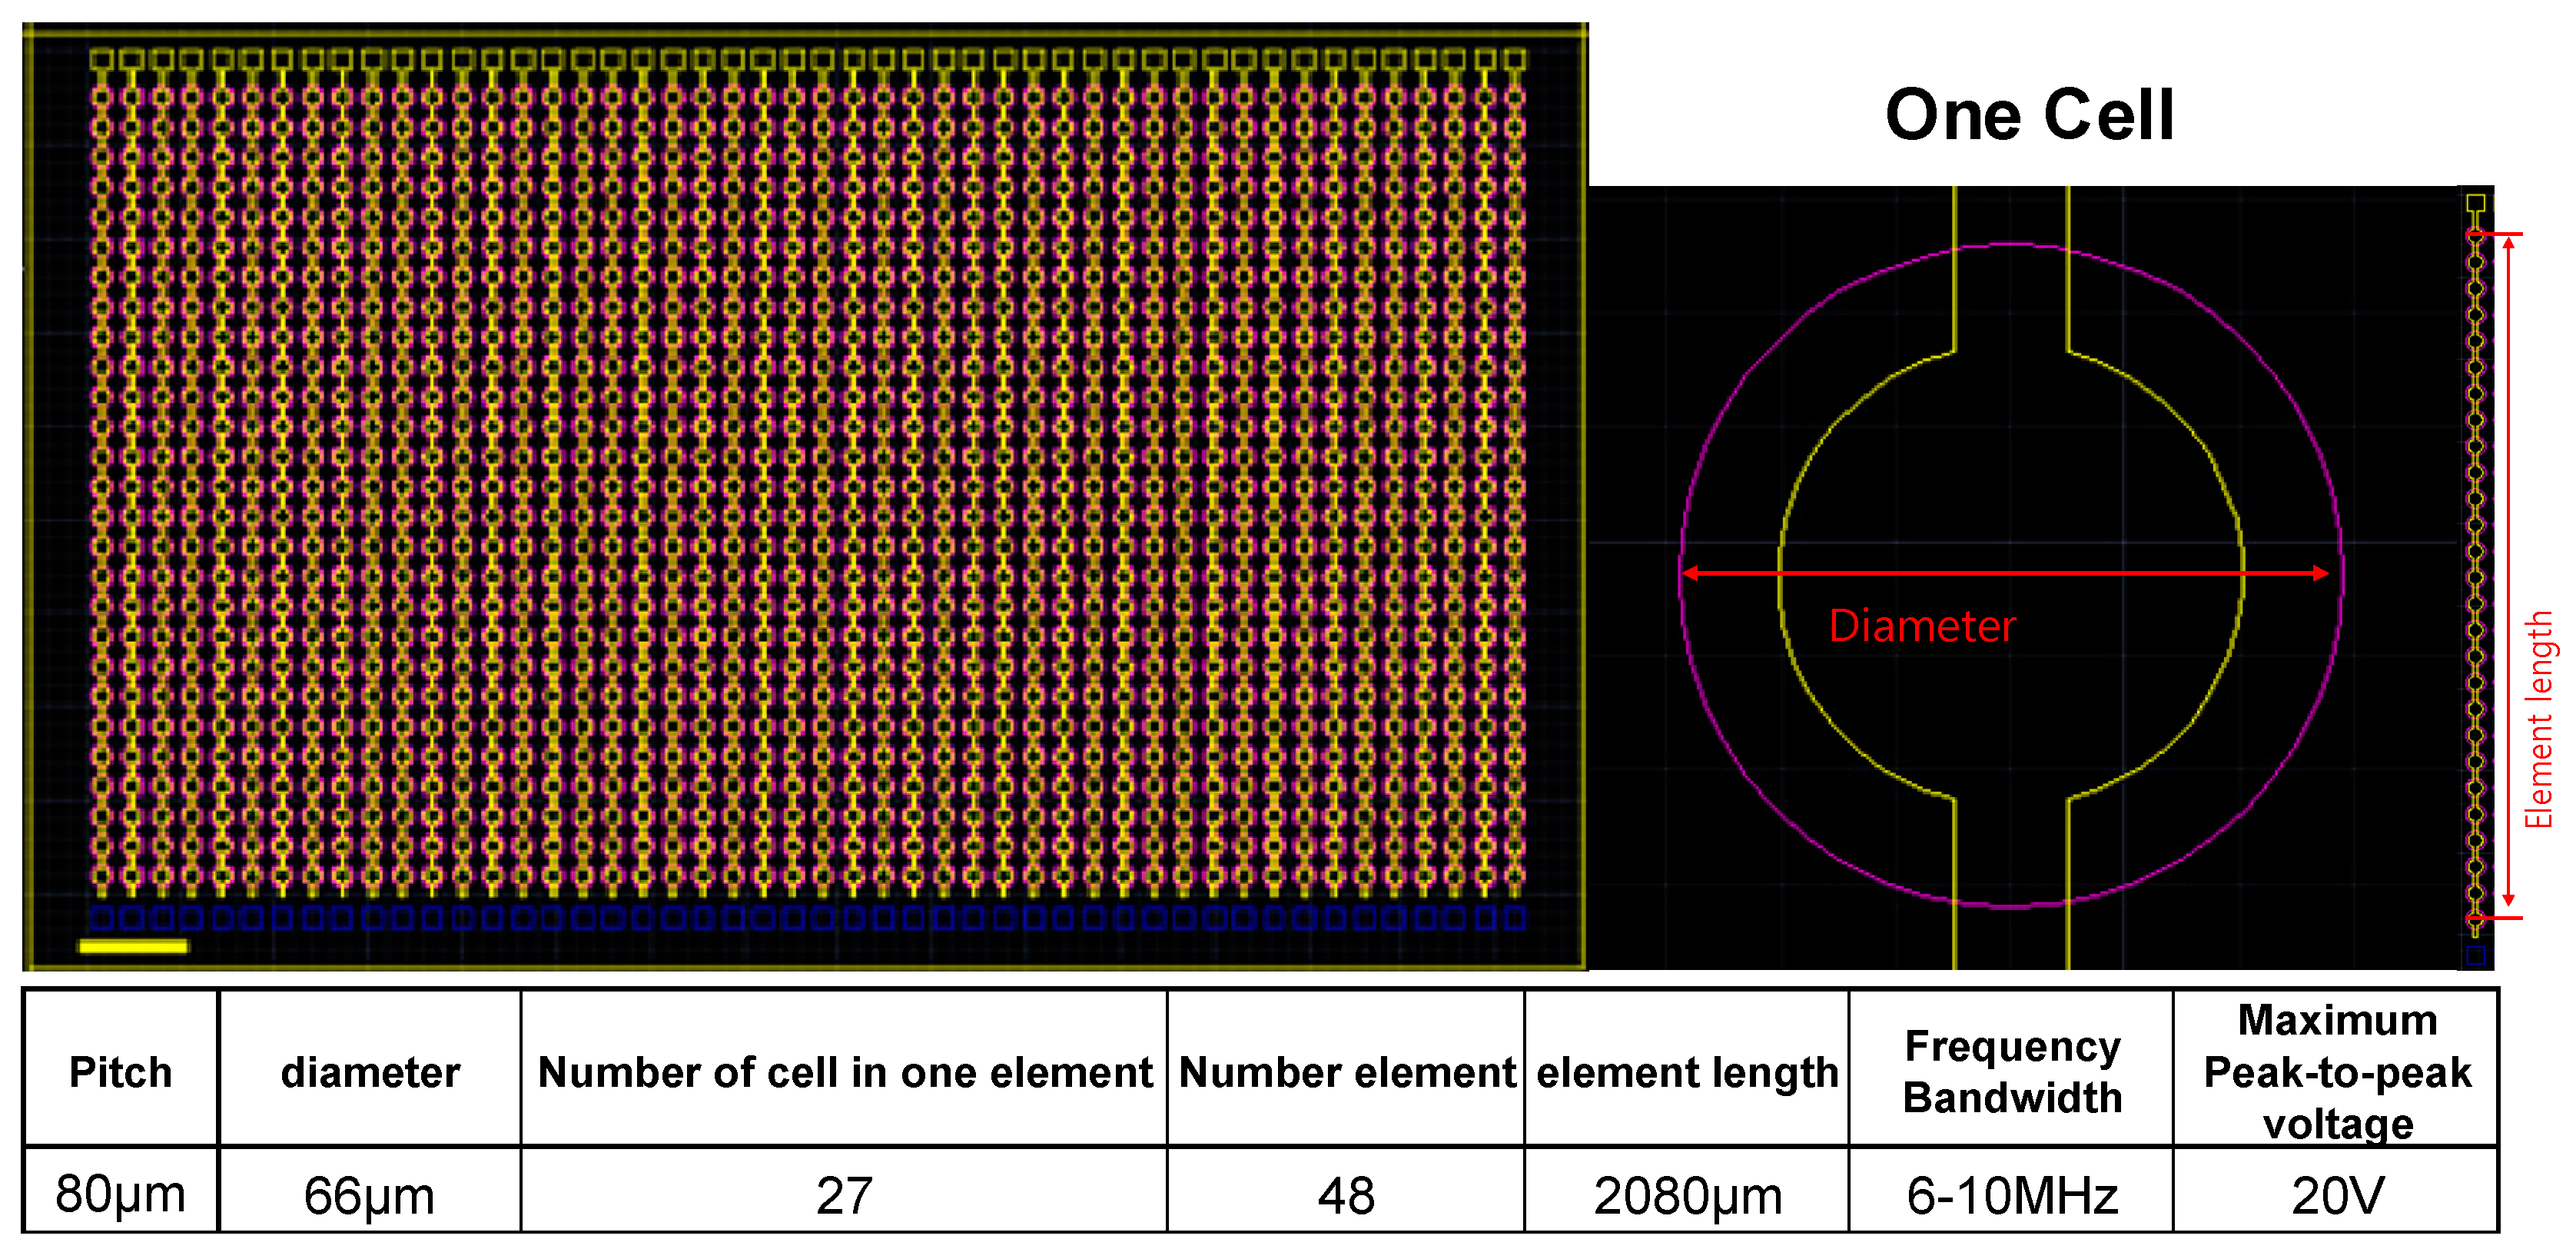
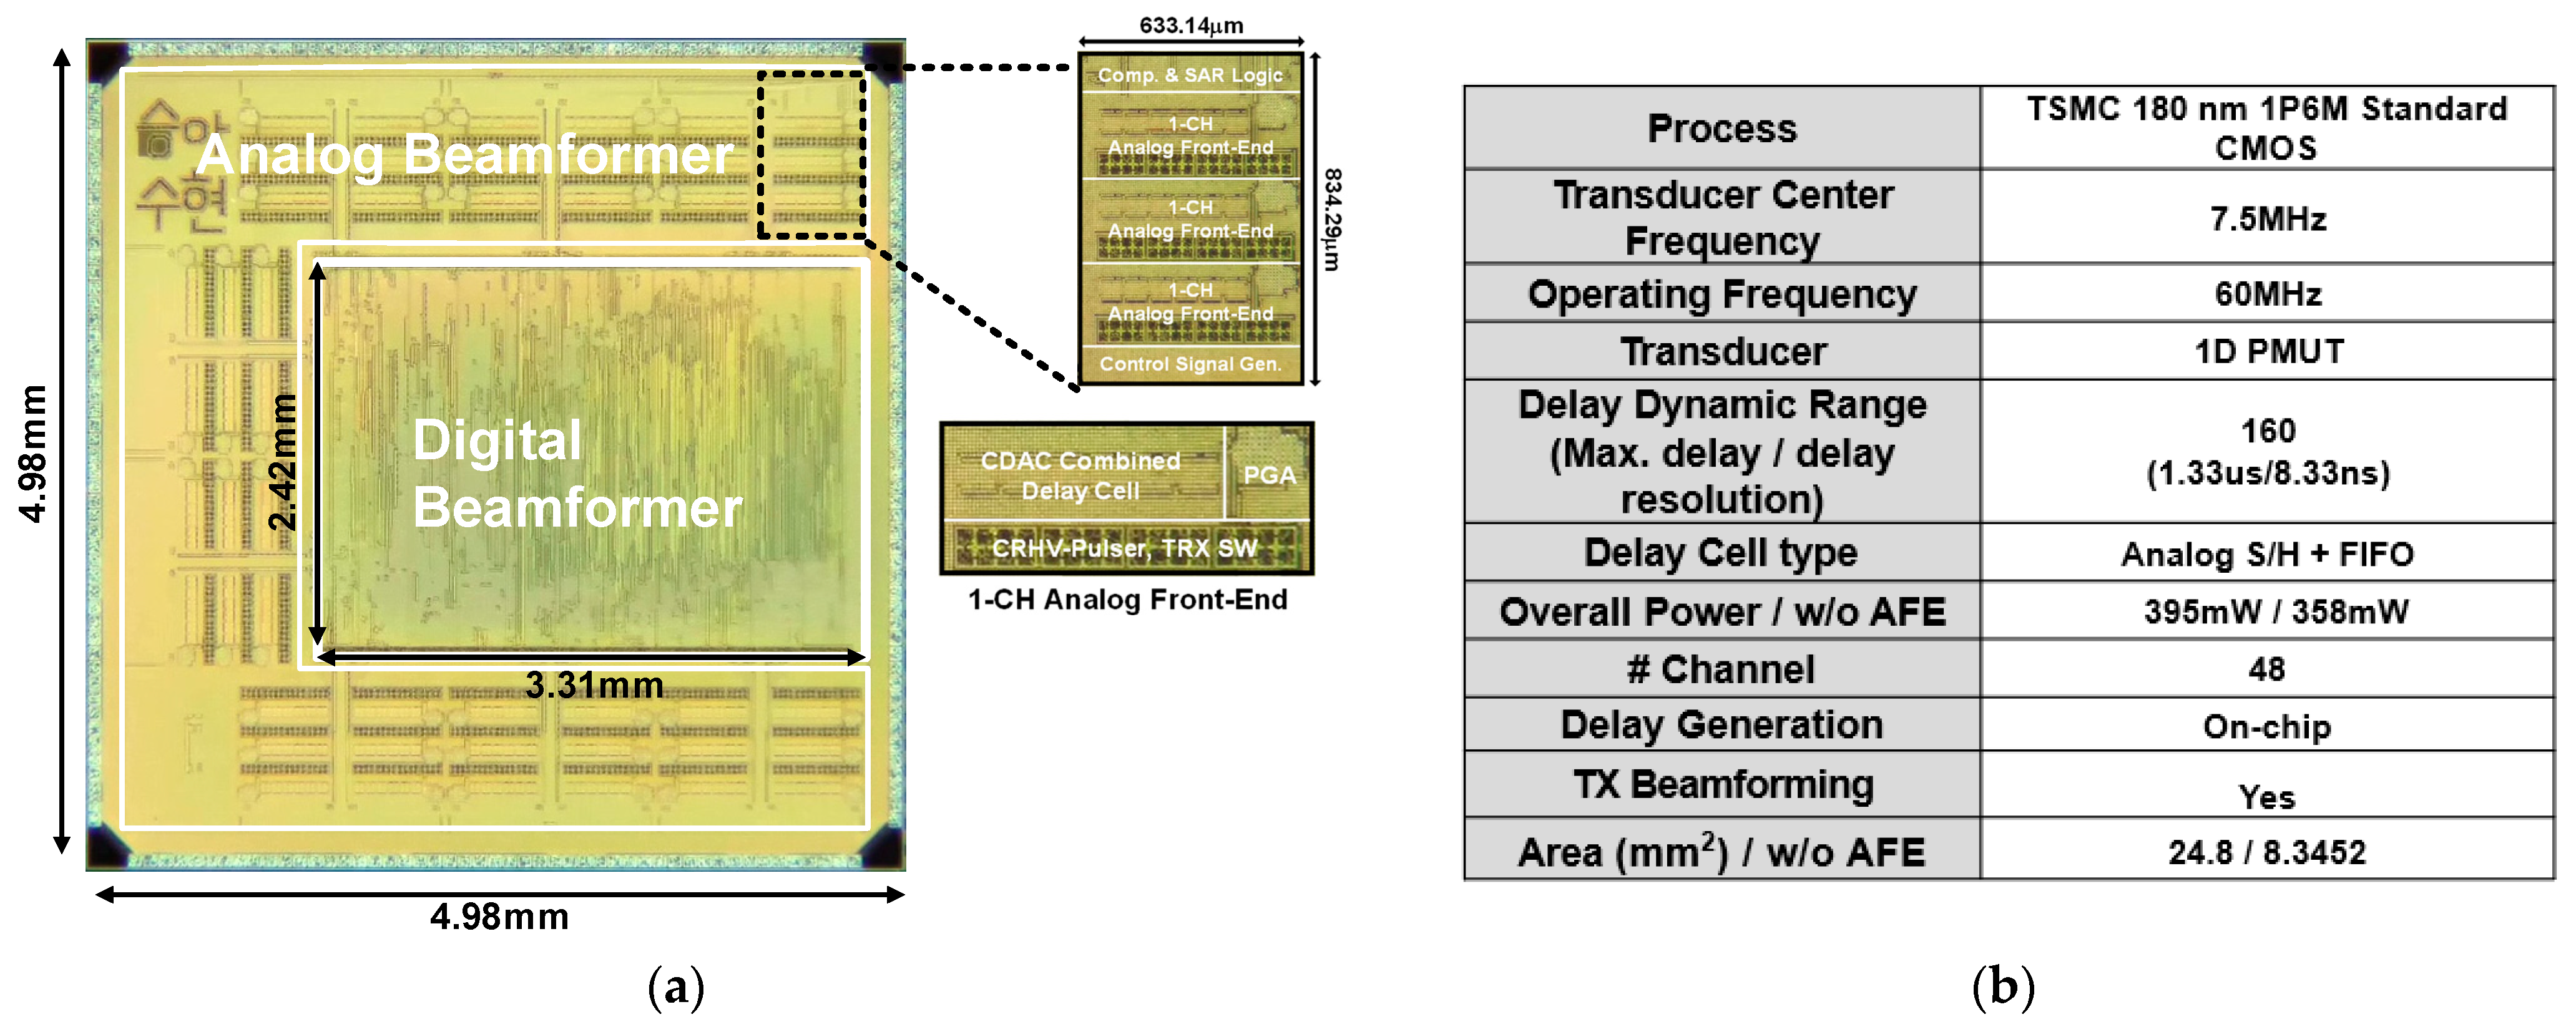
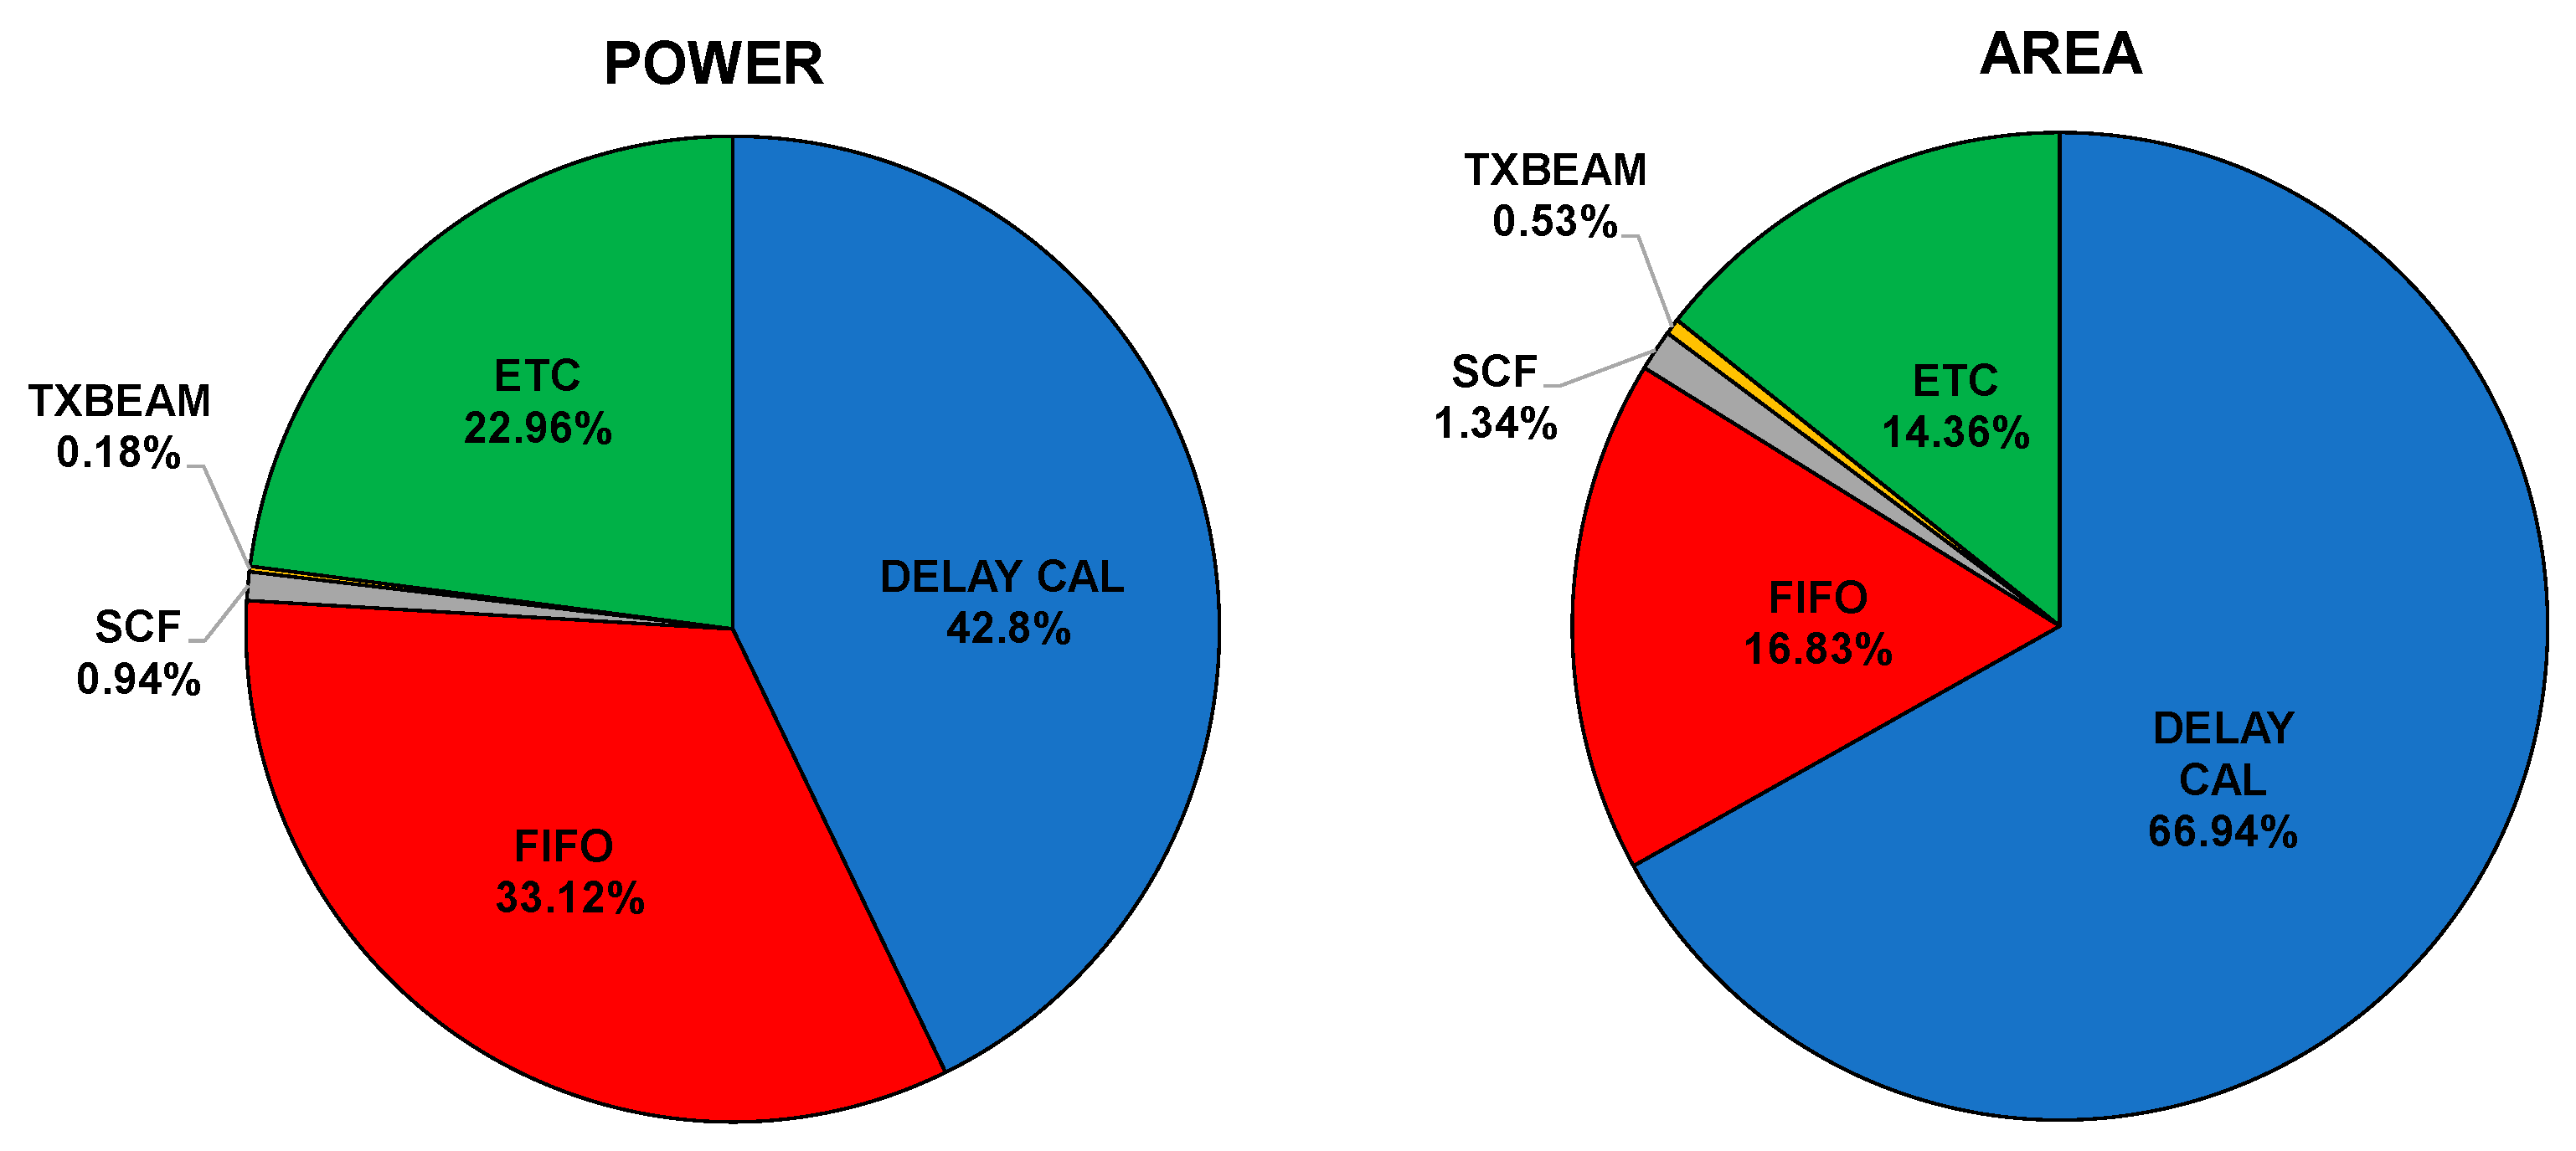
4. Implementation Results
5. Discussion with Further Work
6. Conclusions
Author Contributions
Funding
Data Availability Statement
Conflicts of Interest
References
- National Cancer Information Center. Available online: https://www.cancer.go.kr/ (accessed on 25 January 2024).
- Zhong, L.; Yao, Q.-Y.; Li, L.; Xu, J.-R. Imaging diagnosis of pancreato-biliary diseases: A control study. World J. Gastroenterol. 2003, 9, 2824–2827. [Google Scholar] [CrossRef] [PubMed]
- National Cancer Institute. Available online: https://www.cancer.gov/about-cancer/diagnosis-staging/diagnosis (accessed on 25 January 2024).
- Catherine, F.; Vozzo, D.O.; Madhusudhan, R.; Sanaka, M.D. Endoscopic Management of Pancreaticobiliary Disease. Surg. Clin. N. Am. 2020, 100, 1151–1168. [Google Scholar] [CrossRef]
- Sautto, M.; Leone, D.; Savoia, A.; Ghisu, D.; Quaglia, F.; Caliano, G.; Mazzanti, A. A CMUT transceiver front-end with 100-V TX driver and 1-mW low-noise capacitive feedback RX amplifier in BCD-SOI technology. In Proceedings of the ESSCIRC 2014—40th European Solid State Circuits Conference (ESSCIRC), Venice, Italy, 22–26 September 2014. [Google Scholar] [CrossRef]
- Tan, M.; Kang, E.; An, J.S.; Chang, Z.Y.; Vince, P.; Sénégond, N.; Pertijs, M.A. An Integrated Programmable High-Voltage Bipolar Pulser with Embedded Transmit/Receive Switch for Miniature Ultrasound Probes. IEEE Solid-State Circuits Lett. 2019, 2, 79–82. [Google Scholar] [CrossRef]
- Chen, K.; Lee, H.-S.; Sodini, C.G. A Column-Row-Parallel ASIC Architecture for 3-D Portable Medical Ultrasonic Imaging. IEEE J. Solid-State Circuits 2016, 51, 738–751. [Google Scholar] [CrossRef]
- Lee, J.; Lee, K.R.; Eovino, B.E.; Park, J.H.; Liang, L.Y.; Lin, L.; Yoo, H.J.; Yoo, J. A 36-Channel Auto-Calibrated Front-End ASIC for a pMUT-Based Miniaturized 3-D Ultrasound System. IEEE J. Solid-State Circuits 2021, 56, 1910–1923. [Google Scholar] [CrossRef]
- Um, J.-Y.; Kim, Y.-J.; Cho, S.-E.; Chae, M.-K.; Song, J.; Kim, B.; Lee, S.; Bang, J.; Kim, Y.; Cho, K.; et al. An Analog-Digital Hybrid RX Beamformer Chip with Non-Uniform Sampling for Ultrasound Medical Imaging with 2D CMUT Array. IEEE Trans. Biomed. Circuits Syst. 2014, 8, 799–809. [Google Scholar] [CrossRef] [PubMed]
- Kim, Y.-J.; Cho, S.-E.; Um, J.-Y.; Chae, M.-K.; Bang, J.; Song, J.; Jeon, T.; Kim, B.; Sim, J.-Y.; Park, H.-J. A Single-Chip 64-Channel Ultrasound RX-Beamformer Including Analog Front-End and an LUT for Non-Uniform ADC-Sample-Clock Generation. IEEE Trans. Biomed. Circuits Syst. 2017, 11, 87–97. [Google Scholar] [CrossRef] [PubMed]
- Hu, C.-H.; Xu, X.-C.; Cannata, J.; Yen, J.; Shung, K. Development of a real-time, high-frequency ultrasound digital beamformer for high-frequency linear array transducers. IEEE Trans. Ultrason. Ferroelectr. Freq. Control 2006, 53, 317–323. [Google Scholar] [CrossRef] [PubMed]
- Almekkawy, M.; Xu, J.; Chirala, M. An optimized ultrasound digital beamformer with dynamic forcusing implemented on FPGA. In Proceedings of the 2014 36th Annual International Conference of the IEEE Engineering in Medicine and Biology Society, Chicago, IL, USA, 26–30 August 2014; pp. 3296–3299. [Google Scholar] [CrossRef]
- Um, J.-Y.; Kim, Y.-J.; Cho, S.-E.; Chae, M.-K.; Kim, B.; Sim, J.-Y.; Park, H.-J. A Single-Chip 32-Channel Analog Beamformer with 4-ns Delay Resolution and 768-ns Maximum Delay Range for Ultrasound Medical Imaging with a Linear Array Transducer. IEEE Trans. Biomed. Circuits Syst. 2015, 9, 138–151. [Google Scholar] [CrossRef] [PubMed]
- Wu, L.; Guo, J.; Jiang, R.; Peng, Y.; Wu, H.; Li, J.; Luo, Y.; Lin, L.; Yoo, J. An Ultrasound Imaging System with On-Chip Per-Voxel RX Beamfocusing for Real-Time Drone Applications. IEEE J. Solid-State Circuits 2022, 57, 3186–3199. [Google Scholar] [CrossRef]
- Ibrahim, A.; Zhang, S.; Angiolini, F.; Arditi, M.; Kimura, S.; Goto, S.; Thiran, J.-P.; De Micheli, G. Towards Ultrasound Everywhere: A Portable 3D Digital Back-End Capable of Zone and Compound Imaging. IEEE Trans. Biomed. Circuits Syst. 2018, 12, 968–981. [Google Scholar] [CrossRef] [PubMed]
- Kang, J.; Kim, P.; Yoon, C.; Yoo, Y.; Song, T.-K. Efficient Parallel-Beamforming Based on Shared FIFO for Ultra-Compact Ultrasound Imaging Systems. IEEE Access 2020, 8, 80490–80501. [Google Scholar] [CrossRef]
- Agarwal, M.; Tomar, A.; Kumar, N. An IEEE single-precision arithmetic based beamformer architecture for phased array ultrasound imaging system. Eng. Sci. Technol. Int. J. 2021, 24, 1080–1089. [Google Scholar] [CrossRef]
- Arena, P.; Basile, A.; Bucolo, M.; Fortuna, L. Image processing for medical diagnosis using CNN. Nucl. Instrum. Methods Phys. Res. Sect. A Accel. Spectrometers Detect. Assoc. Equip. 2003, 497, 174–178. [Google Scholar] [CrossRef]
- Lu, J.Y.; Zou, H.; Greenleaf, J.F. Biomedical Ultrasound beam forming. Ultrasound Med. Biol. 1994, 20, 403–428. [Google Scholar] [CrossRef] [PubMed]
- Matrone, G.; Savoia, A.S.; Caliano, G.; Magenes, G. The Delay Multiply and Sum Beamforming Algorithm in Ultrasound B-Mode Medical Imaging. IEEE Trans. Med. Imaging 2015, 34, 940–949. [Google Scholar] [CrossRef] [PubMed]
- Jeon, S.; Park, E.-Y.; Choi, W.; Managuli, R.; Lee, K.J.; Kim, C. Real-time delay-multiply-and-sum beamforming with coherence factor for in vivo clinical photoacoustic imaging of humans. Photoacoustics 2019, 15, 100136. [Google Scholar] [CrossRef]
- Ibrahim, A.; Hager, P.A.; Bartolini, A.; Angiolini, F.; Arditi, M.; Thiran, J.P.; Benini, L.; De Micheli, G. Efficient Sample Delay Calculation for 2-D and 3-D Ultrasound Imaging. IEEE Trans. Biomed. Circuits Syst. 2017, 11, 815–831. [Google Scholar] [CrossRef] [PubMed]
- Lee, S.; Yun, S.; Bae, J. A low-power and area-efficient ultrasound receiver using beamforming successive approximation register analog-to-digital converter with capacitive digital-to-analog converter combined delay cell structure for 3-D imaging systems. Electron. Lett. 2022, 58, 819–855. [Google Scholar] [CrossRef]
- Hollman, K.; Rigby, K.; O'Donnell, M. Coherence factor of speckle from a multi-row probe. In Proceedings of the 1999 IEEE Ultrasonics Symposium, Tahoe, NV, USA, 17–20 October 1999. [Google Scholar] [CrossRef]
- Treeby, B.E.; Cox, B.T. k-Wave: MATLAB toolbox for the simulation and reconstruction of photoacoustic wave fields. J. Biomed. Opt. 2010, 15, 021314. [Google Scholar] [CrossRef] [PubMed]


| Beamforming Algorithm | Channels | Logic LUTs | Memory LUTs | Regs | BRAM | DSP |
|---|---|---|---|---|---|---|
| Delay and Sum | 16 | 36.27% | 0.51% | 22.91% | 0 | 26.67% |
| Single Precision Coherence Factor | 16 | 51.14% | 0.51% | 23.30% | 0 | 57.08% |
| Shift Coherence Factor | 16 | 39.21% | 0.51% | 23.22% | 0 | 27.08% |
| Beamforming Algorithm | ALL | ETC | Delay Generator | FIFO | CF |
|---|---|---|---|---|---|
| Delay and Sum | 483.080 W (100%) | 25.309 W (5.2%) | 359.546 W (74.4%) | 98.495 W (20.4%) | 0 W (0%) |
| Single Precision Coherence Factor | 689.602 W (100%) | 20.668 W (3%) | 357.116 W (51.8%) | 113.407 W (16.4%) | 198.411 W (28.8%) |
| Shift Coherence Factor | 522.020 W (100%) | 27.404 W (5.3%) | 353.826 W (67.8%) | 112.823 W (21.6%) | 27.967 W (5.3%) |
| This Work | JSSC2022 [14] | ISSCC2019 [8] | TBCAS2017 [10] | TBCAS2014 [9] | |
|---|---|---|---|---|---|
| Process | 180 nm | 180 nm | 180 nm | 130 nm | 130 nm |
| Center Frequency | Standard CMOS | Standard CMOS | Standard CMOS | Standard CMOS | Standard CMOS |
| Delay Dynamic Range (Max. delay/delay resolution) | 160 (1.33 μs/8.33 ns) | N/A | 256 (1.28 μs/5 ns) | 1260 (7.875 μs/6.25 ns) | 1280 (8 μs/6.25 ns) |
| Memory Usage | X | SRAM | X | X | X |
| Delay cell type | Analog S/H + FIFO | Memory | Analog S/H | FIFO | Analog S/H + FIFO |
| Overall Power | 395 mW | 142.3 mW | 371.88 mW | 605 mW | 1.14 W |
| # Channel | 48 | 64 | 36 | 64 | 64 |
| Delay Generation (Method) | On-chip (Calculation) | On-chip (Calculation) | On-chip (LUT) | On-chip (LUT) | Off-chip |
| TX Beamforming | O | O | O | X | X |
| Area (mm2) | 24.8 | 32.5 | 11.75 | 30.25 | 19.4 |
| Beamformer Architecture | Area | Power | Cell Count |
|---|---|---|---|
| Digital Beamformer | 6.76 mm2 | 358 mW | 270,317 |
| TDM Digital Beamformer | 2.42 mm2 | 226 mW | 84,772 |
Disclaimer/Publisher’s Note: The statements, opinions and data contained in all publications are solely those of the individual author(s) and contributor(s) and not of MDPI and/or the editor(s). MDPI and/or the editor(s) disclaim responsibility for any injury to people or property resulting from any ideas, methods, instructions or products referred to in the content. |
© 2024 by the authors. Licensee MDPI, Basel, Switzerland. This article is an open access article distributed under the terms and conditions of the Creative Commons Attribution (CC BY) license (https://creativecommons.org/licenses/by/4.0/).
Share and Cite
Yun, S.; Lee, S.; Bae, J. A 48-Channel High-Resolution Ultrasound Beamforming System for Ultrasound Endoscopy Applications. Electronics 2024, 13, 568. https://doi.org/10.3390/electronics13030568
Yun S, Lee S, Bae J. A 48-Channel High-Resolution Ultrasound Beamforming System for Ultrasound Endoscopy Applications. Electronics. 2024; 13(3):568. https://doi.org/10.3390/electronics13030568
Chicago/Turabian StyleYun, Soohyun, Seungah Lee, and Joonsung Bae. 2024. "A 48-Channel High-Resolution Ultrasound Beamforming System for Ultrasound Endoscopy Applications" Electronics 13, no. 3: 568. https://doi.org/10.3390/electronics13030568
APA StyleYun, S., Lee, S., & Bae, J. (2024). A 48-Channel High-Resolution Ultrasound Beamforming System for Ultrasound Endoscopy Applications. Electronics, 13(3), 568. https://doi.org/10.3390/electronics13030568