
Determinants of the Generation of Higher Current Harmonics in Different Operating States of the RGB LED Lamp

 , and
, and 
Abstract
1. Introduction
1.1. Background
1.2. Literature Review
1.3. Motivation
2. Harmonics in LED Lamps
2.1. The Role of LED Lamps in Lighting Systems
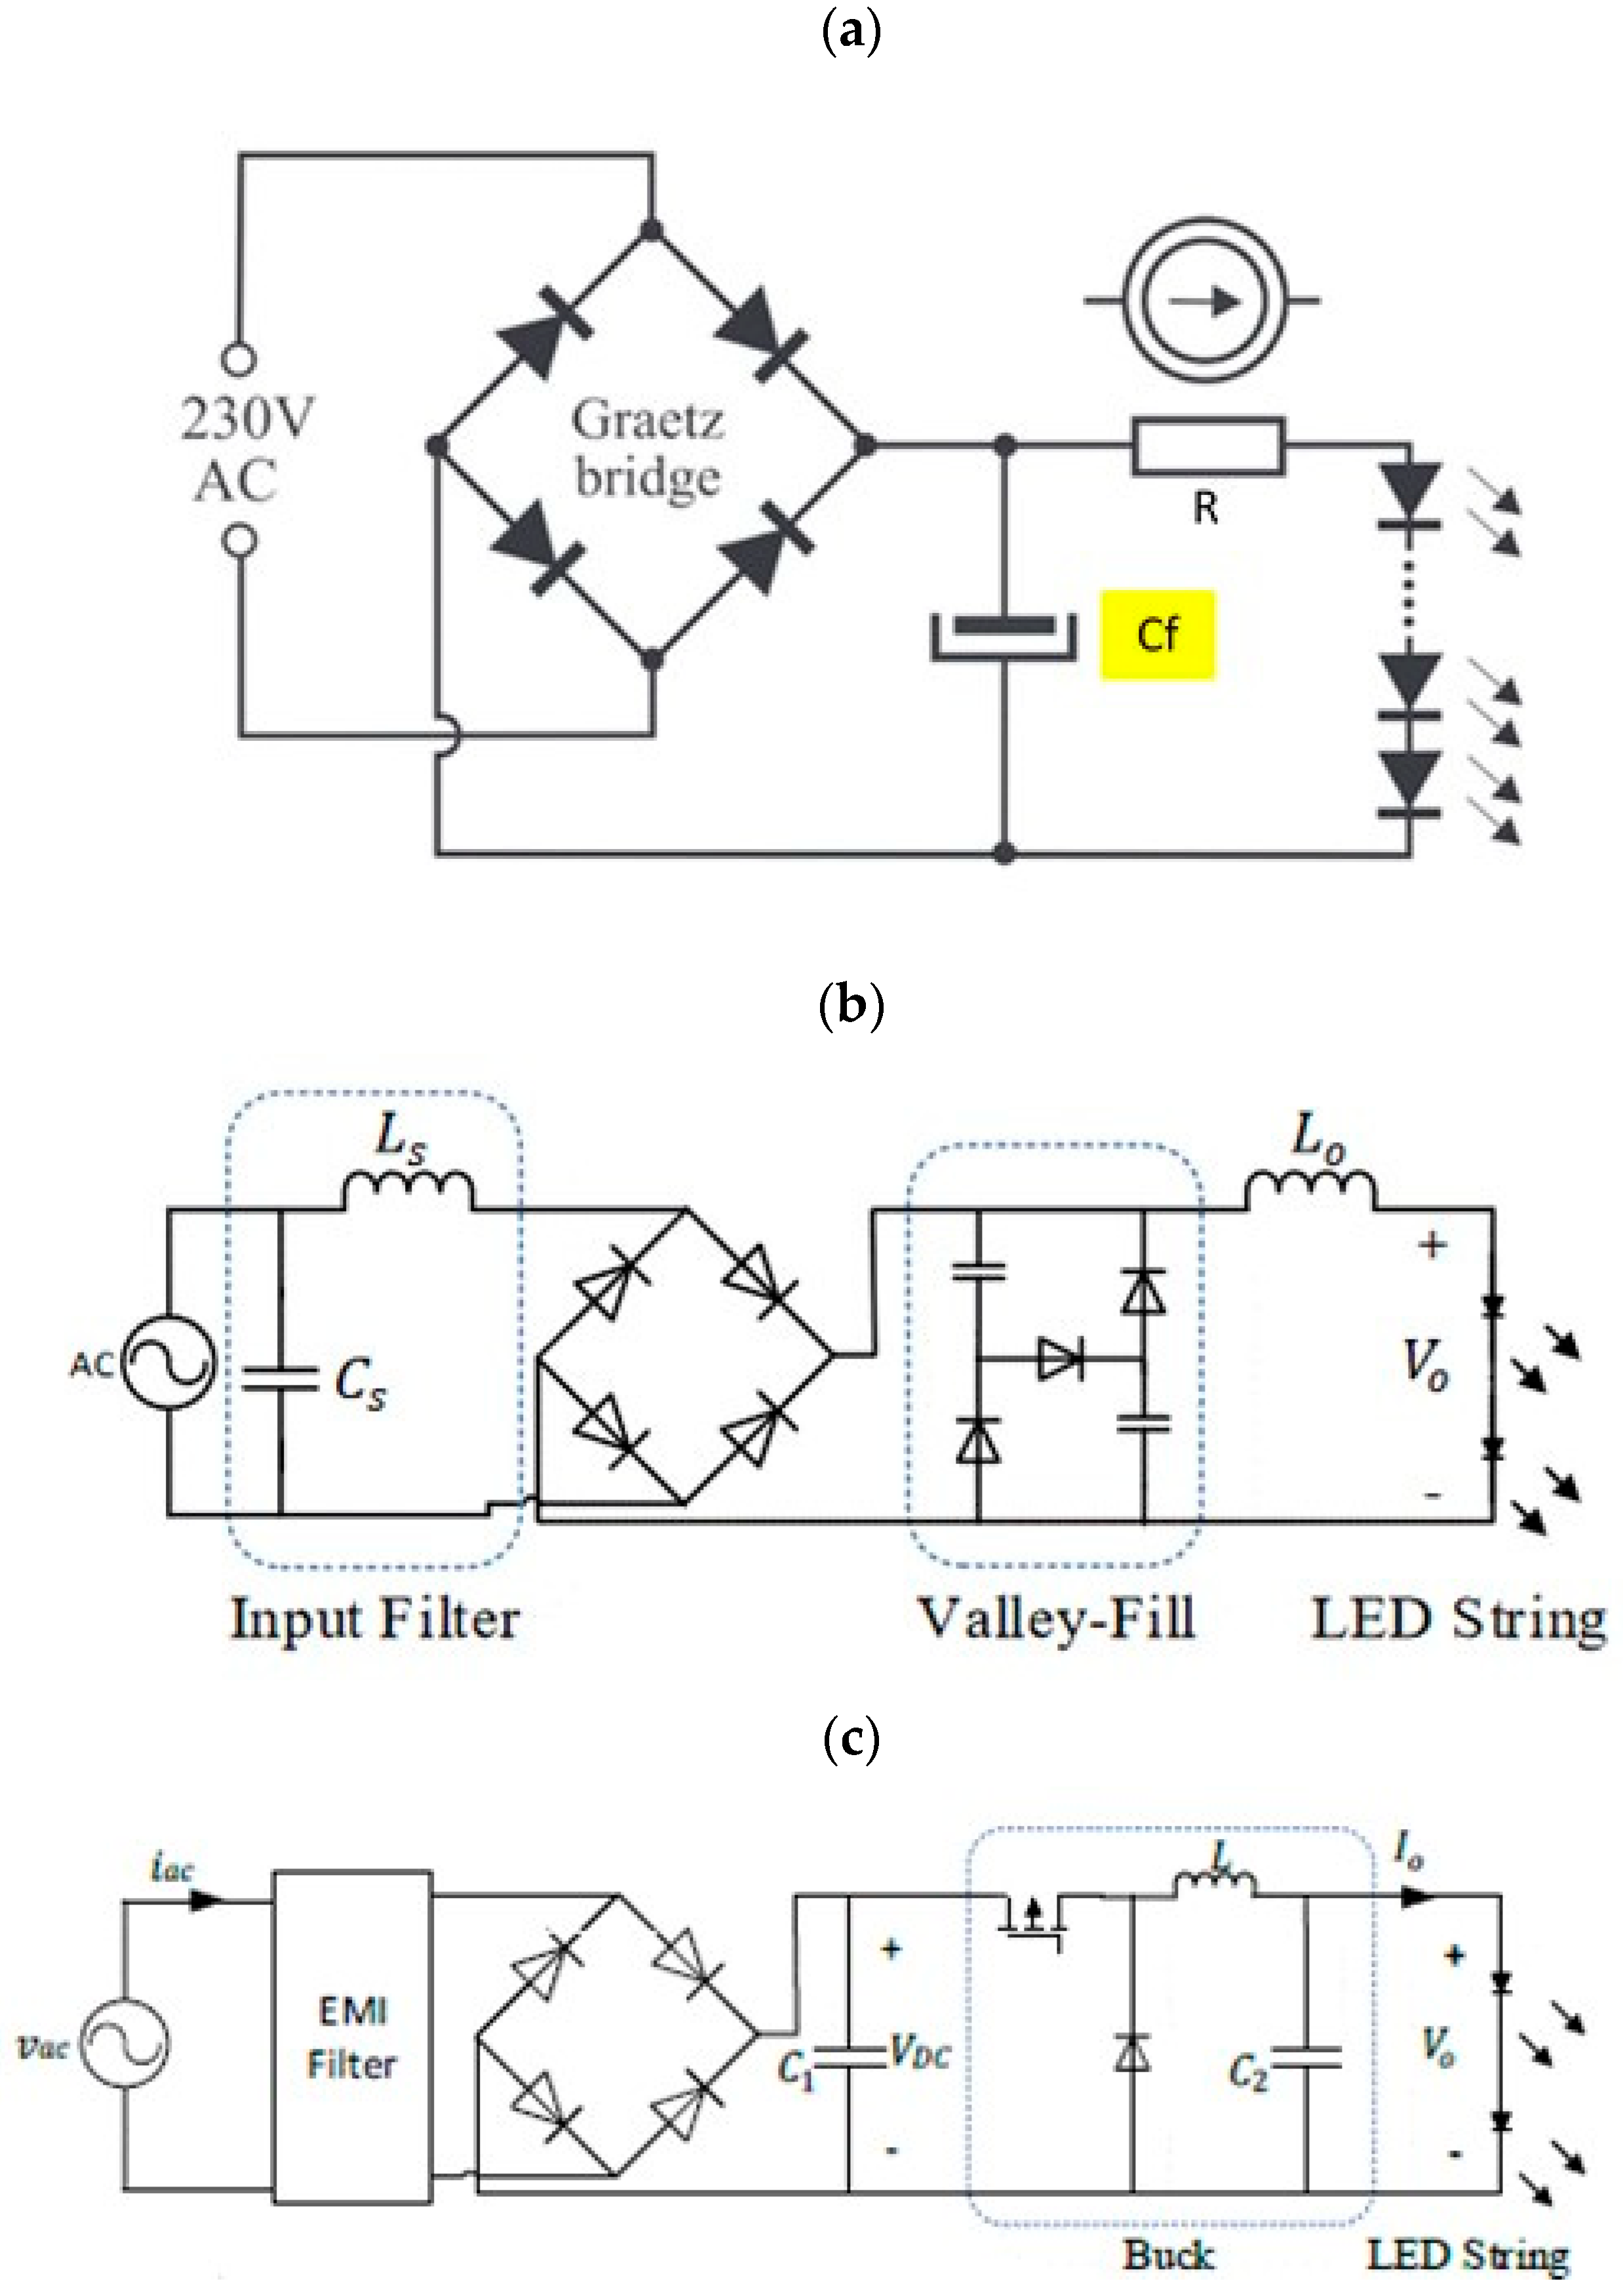
2.2. Power Supplies Used in LED Lamps vs. Current Harmonics
3. Research of the Content of Higher Harmonics Generated by the RGB LED Lamp
3.1. Research Methodology
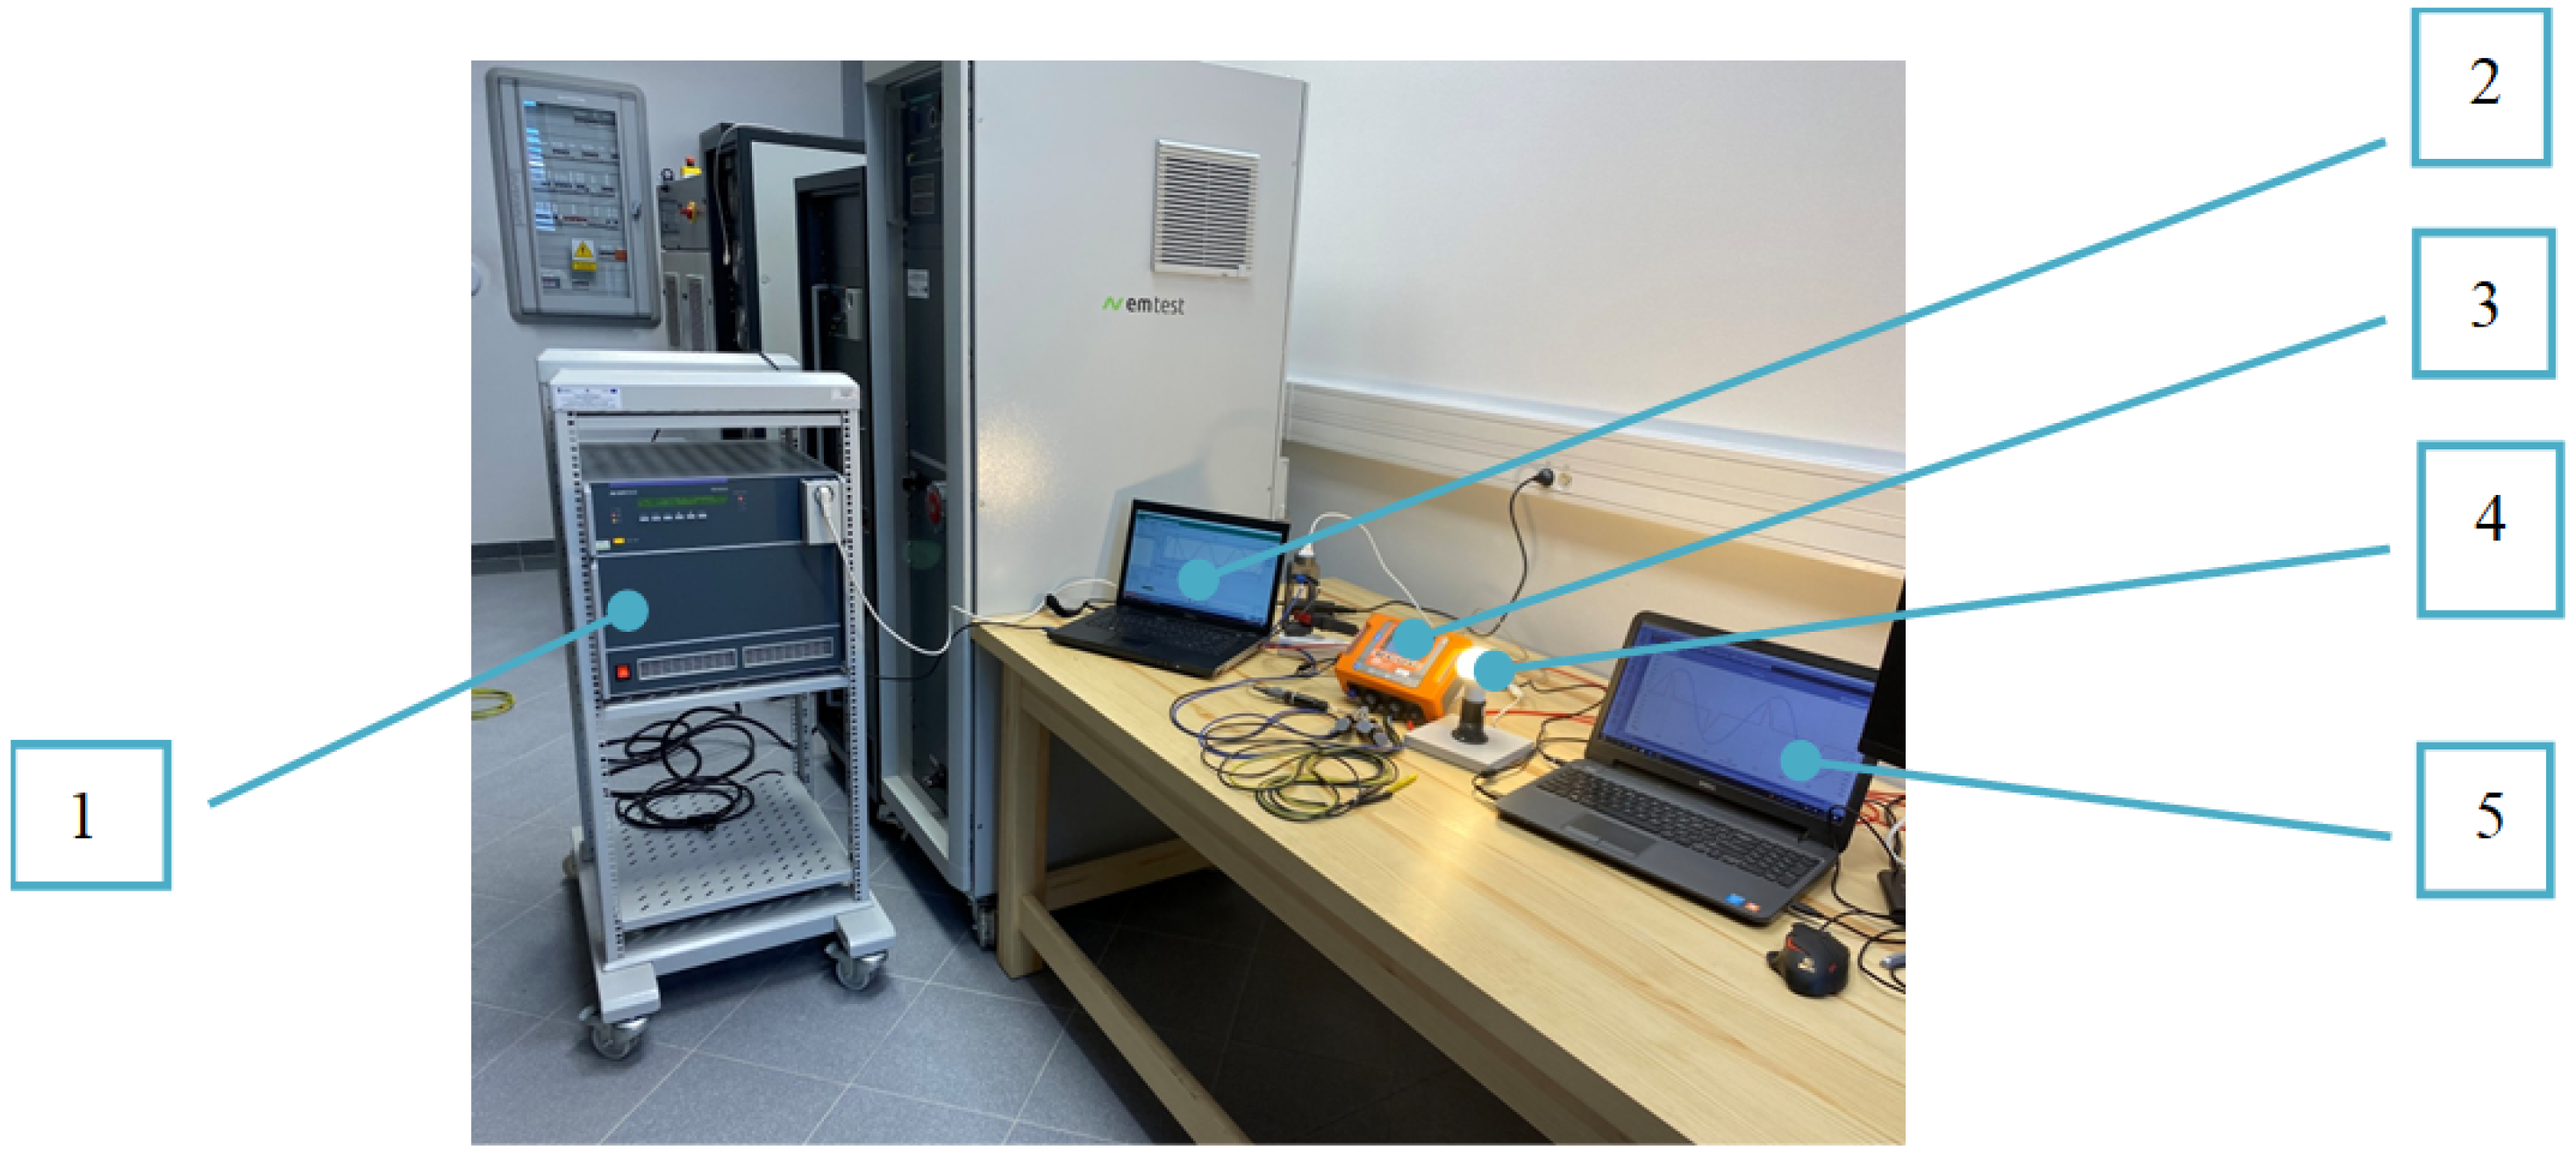
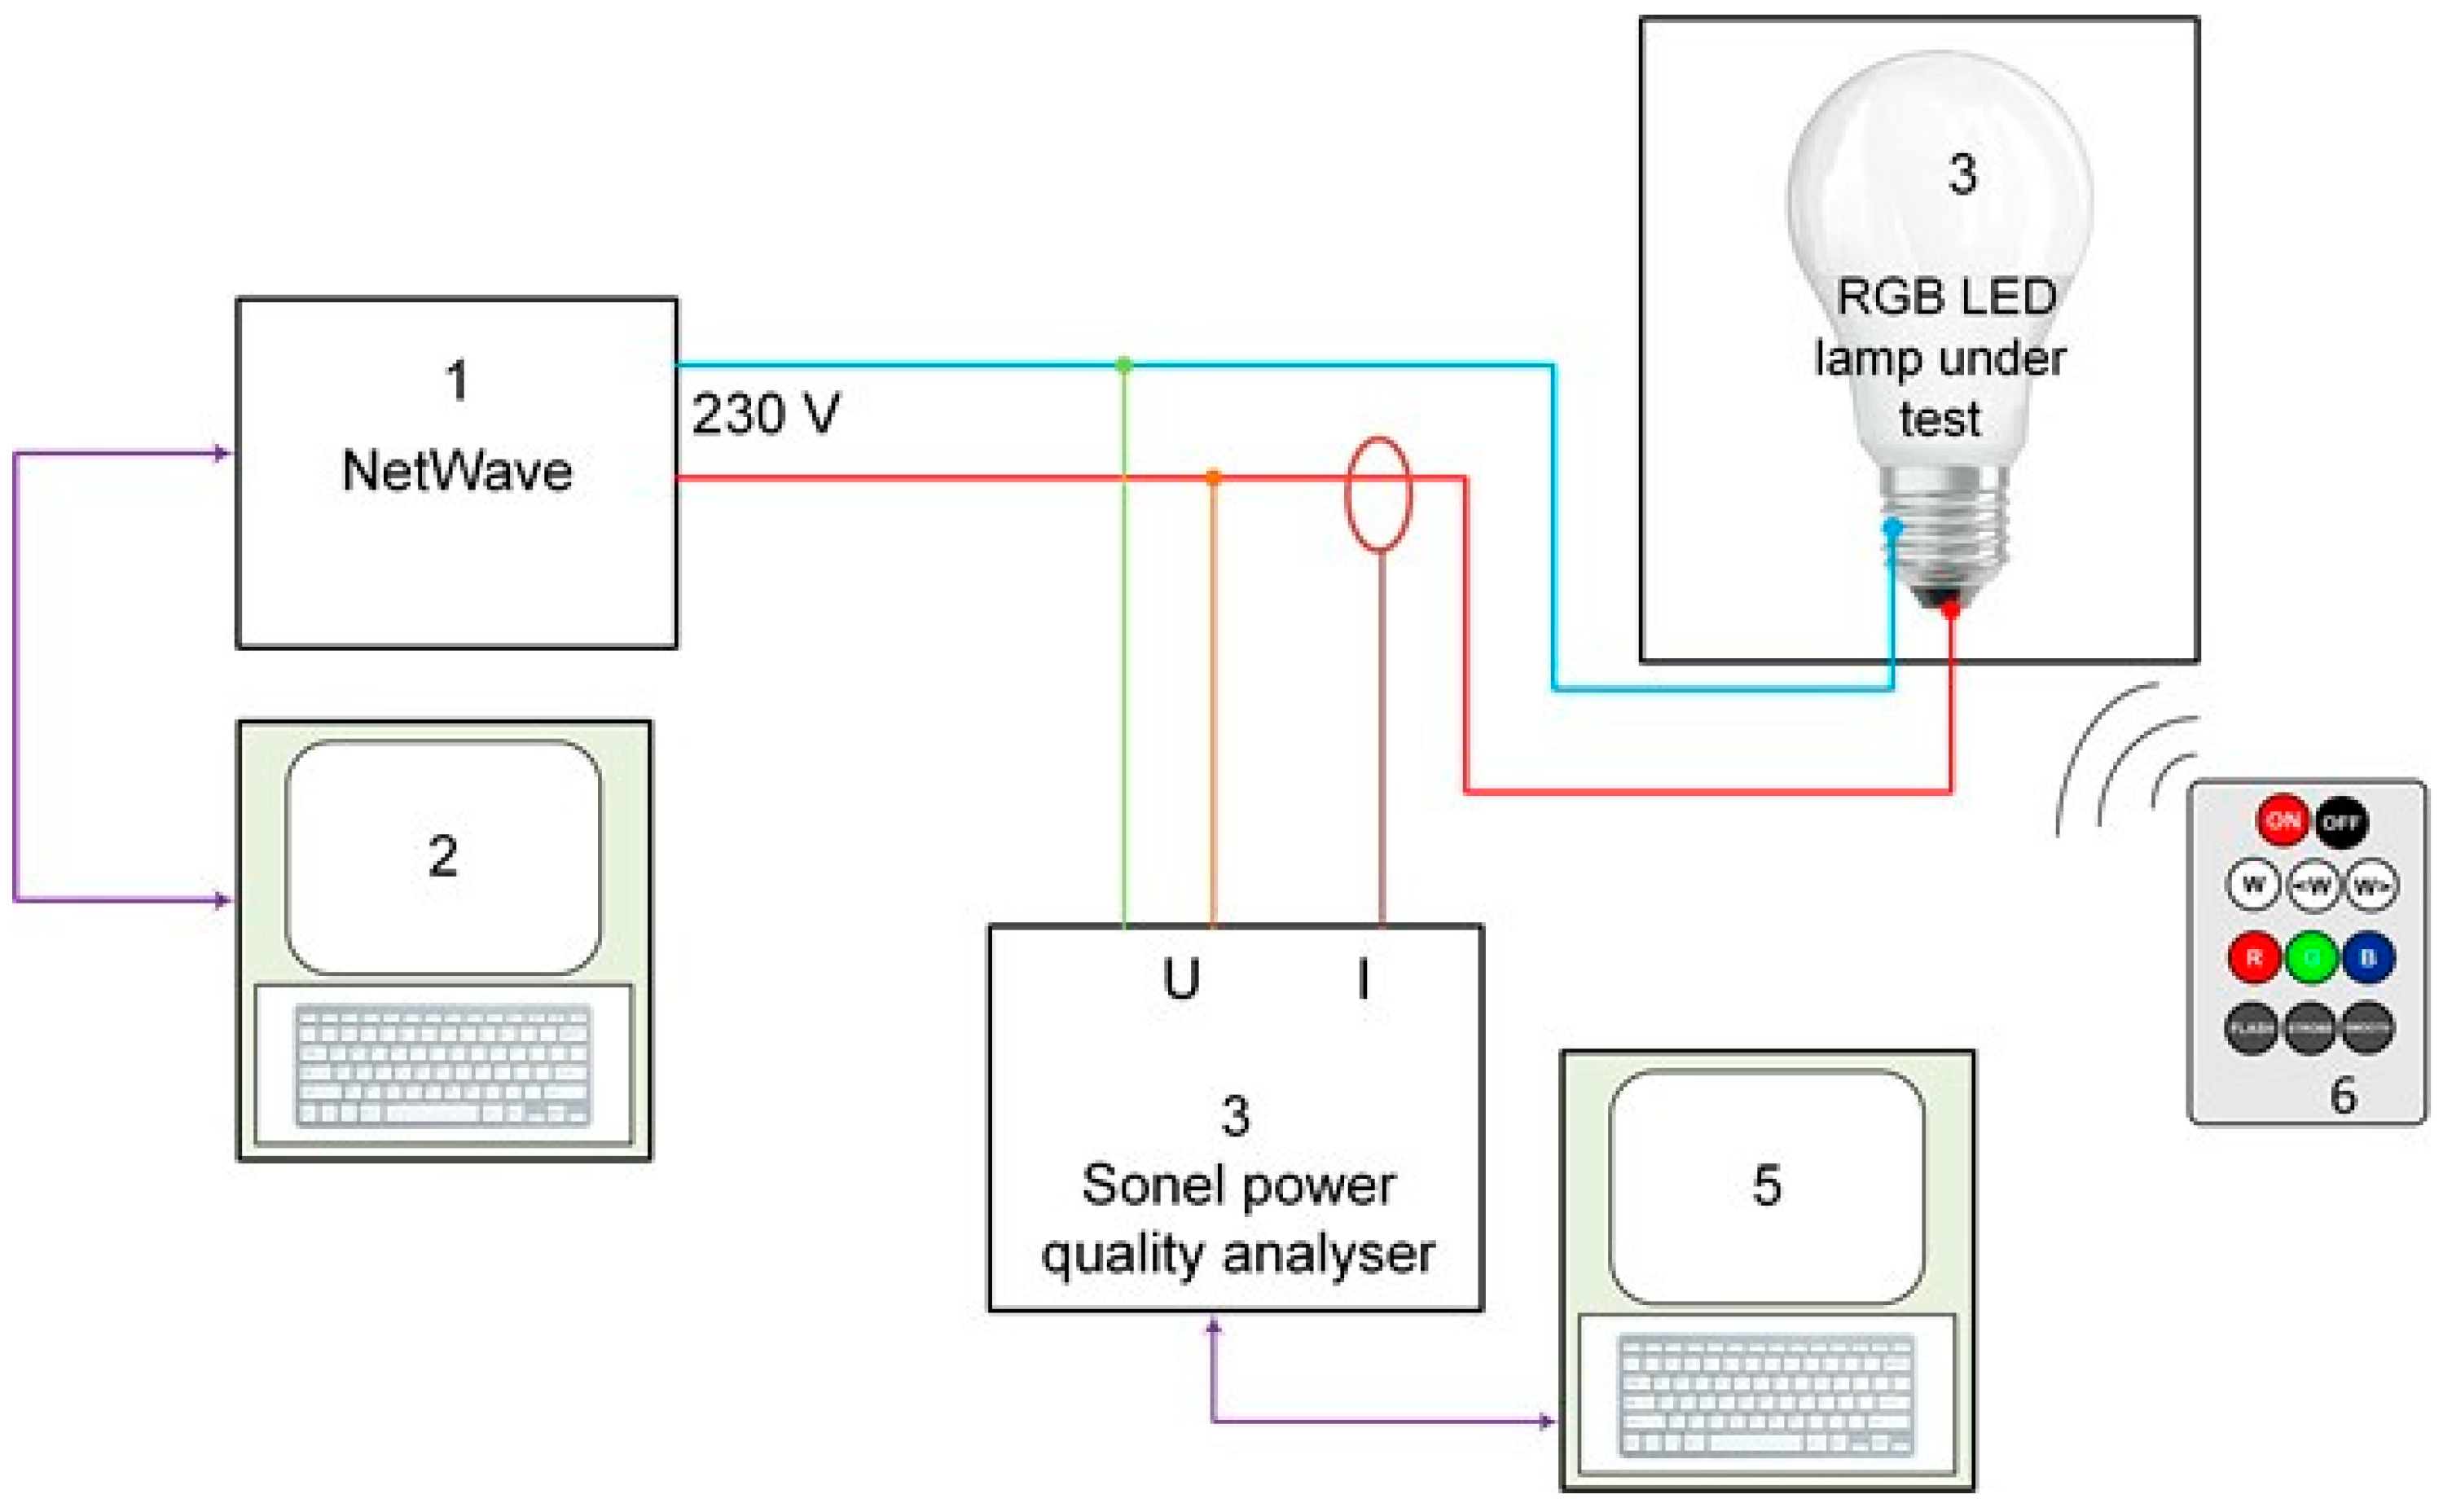
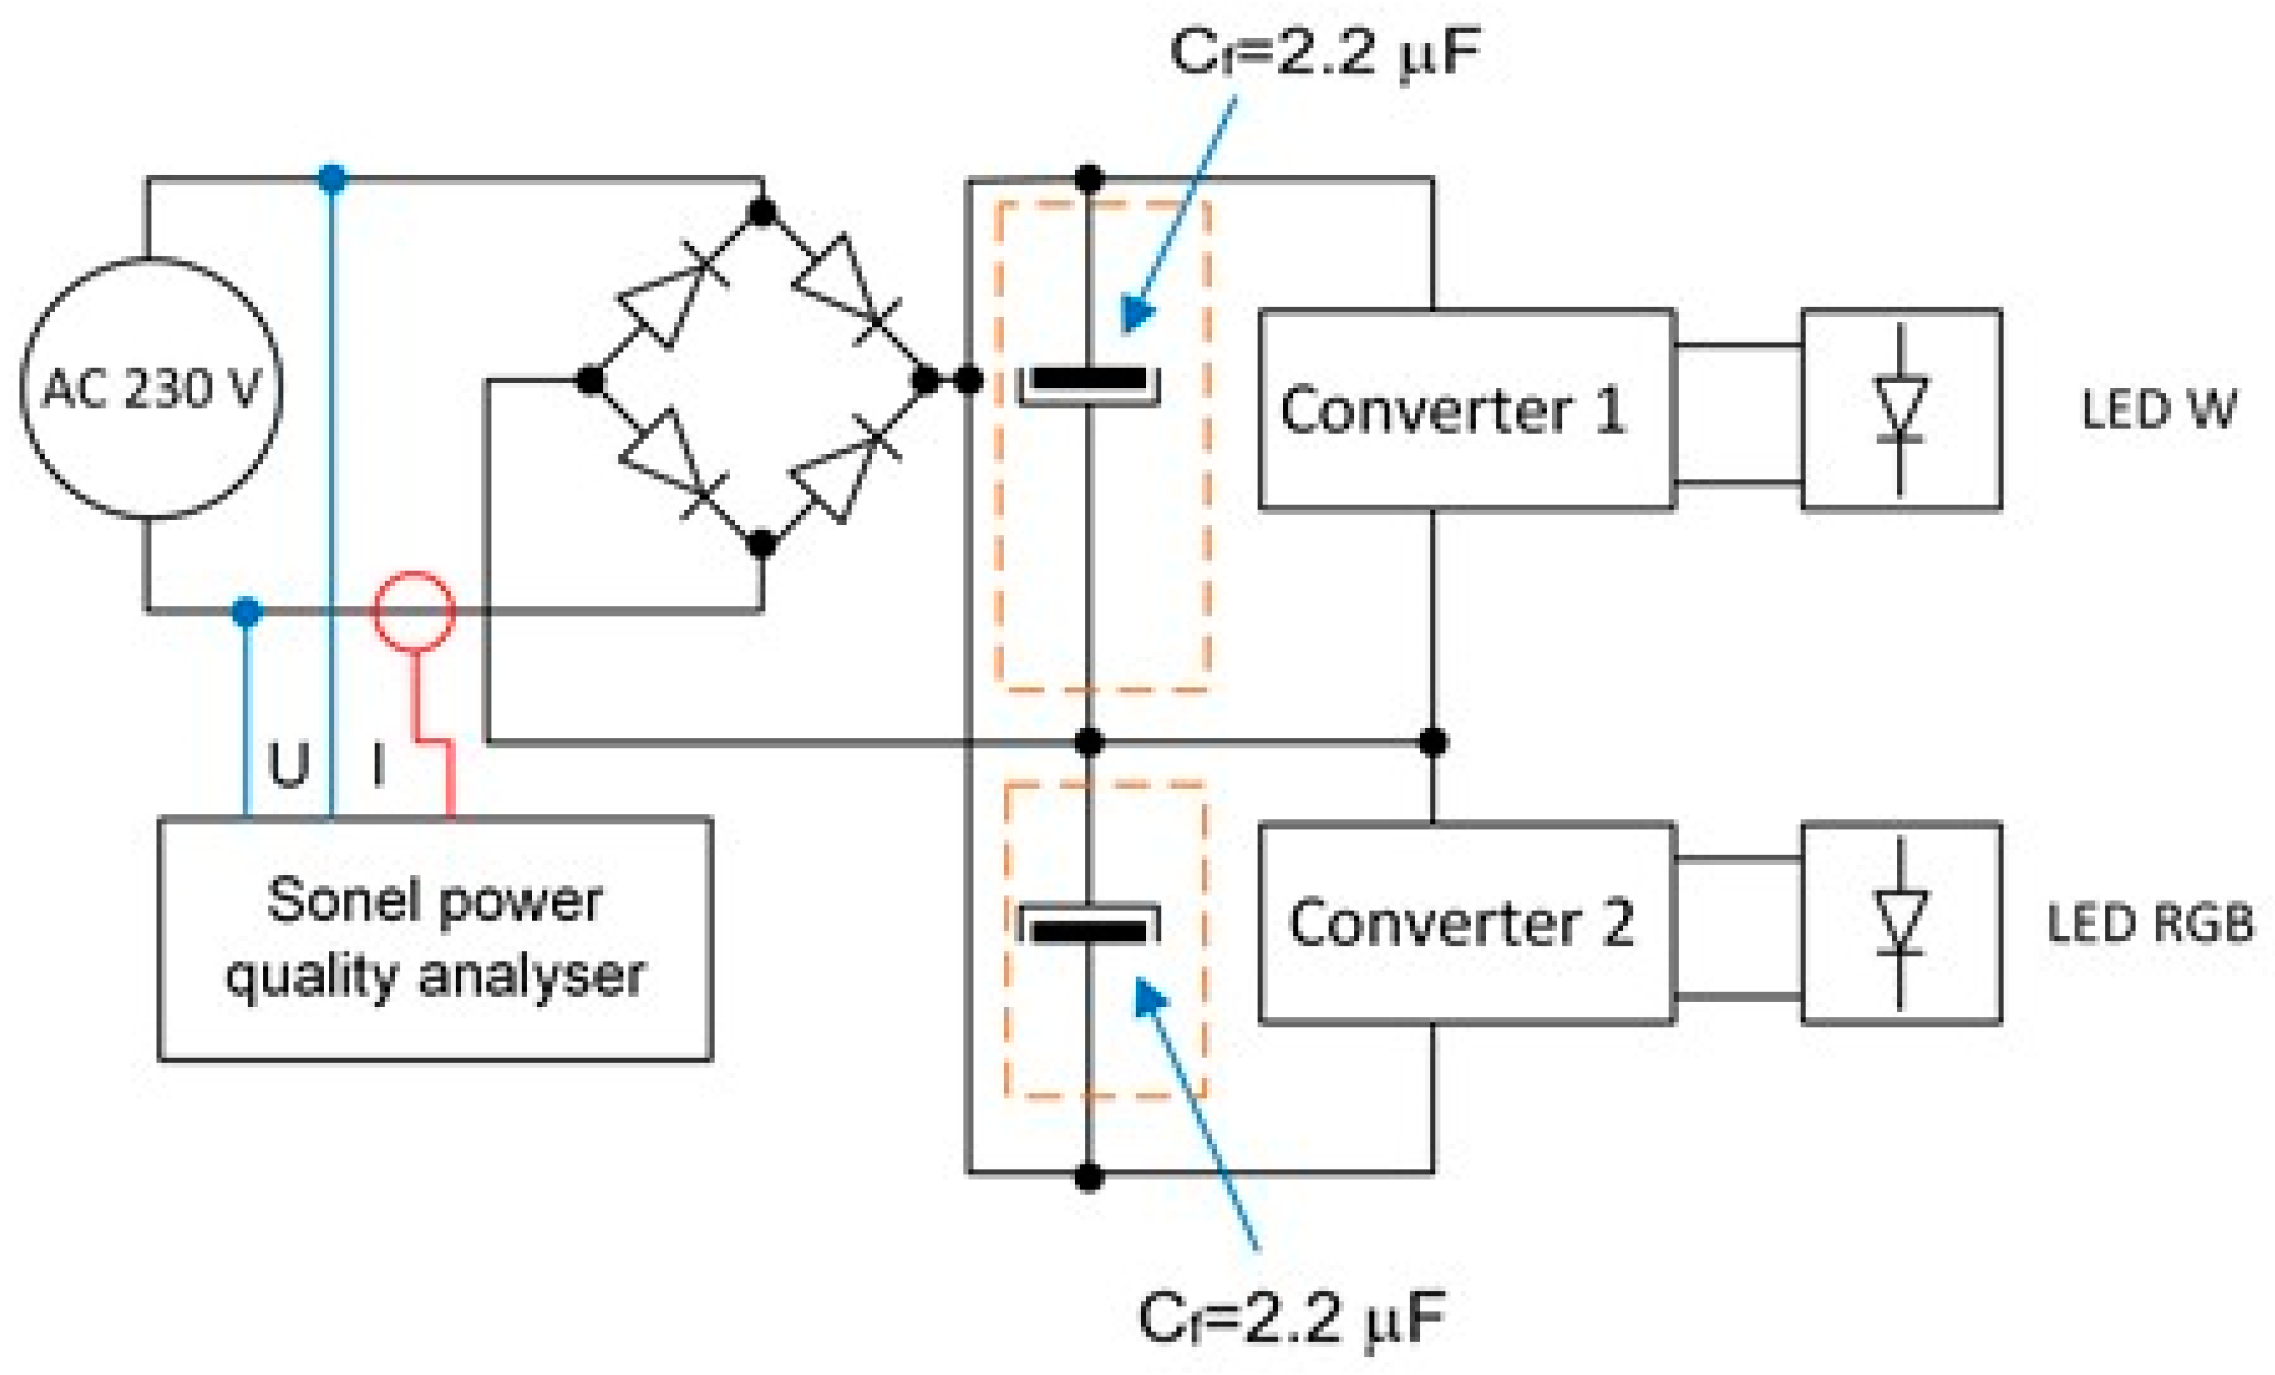
3.2. Test Stand
3.3. Test Results for the RGB LED Lamp
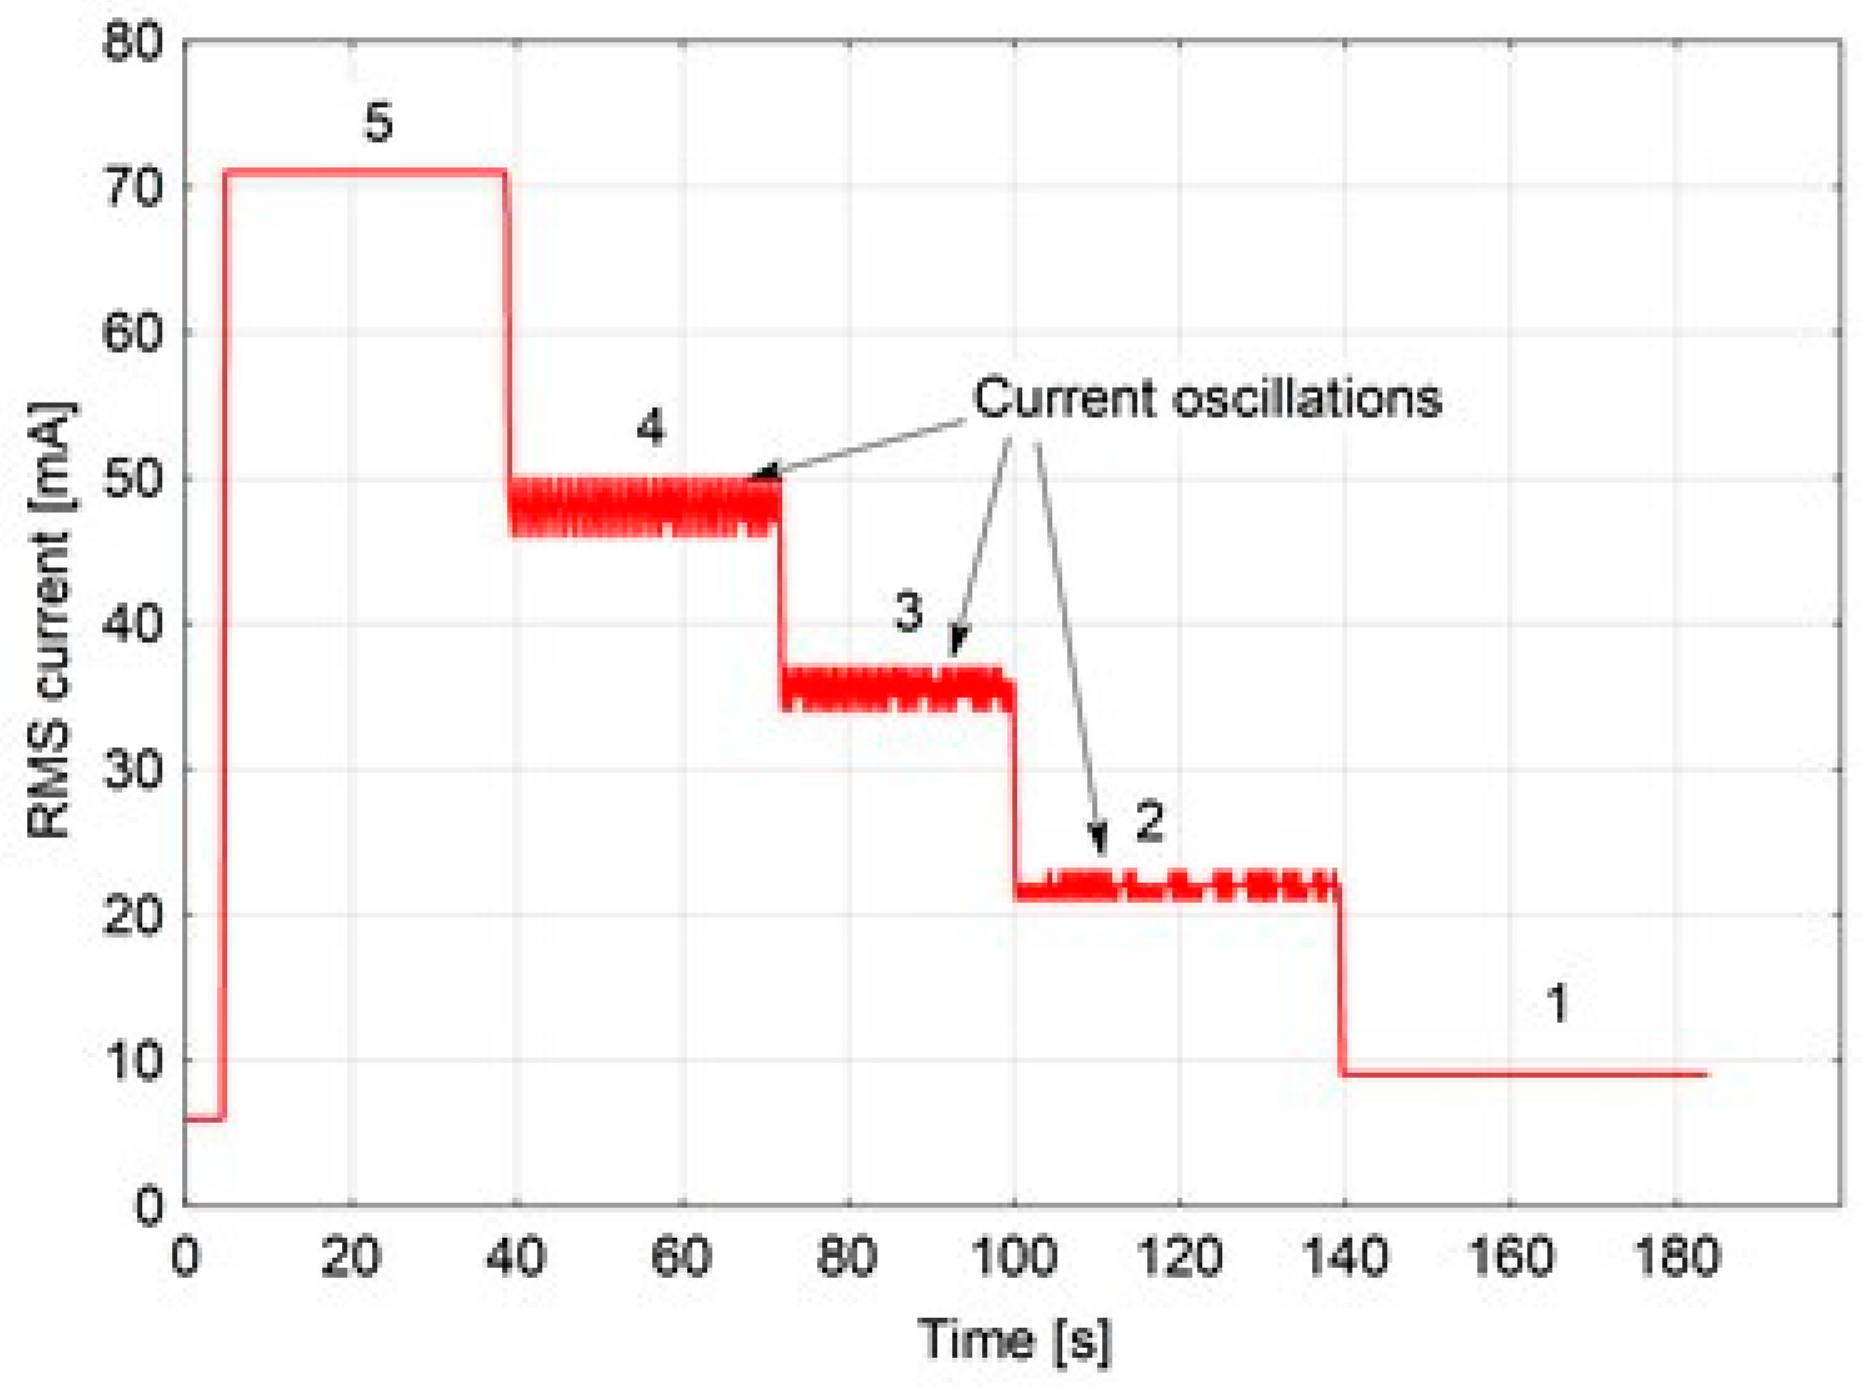
3.3.1. Change in the Luminous Flux Value of White Light
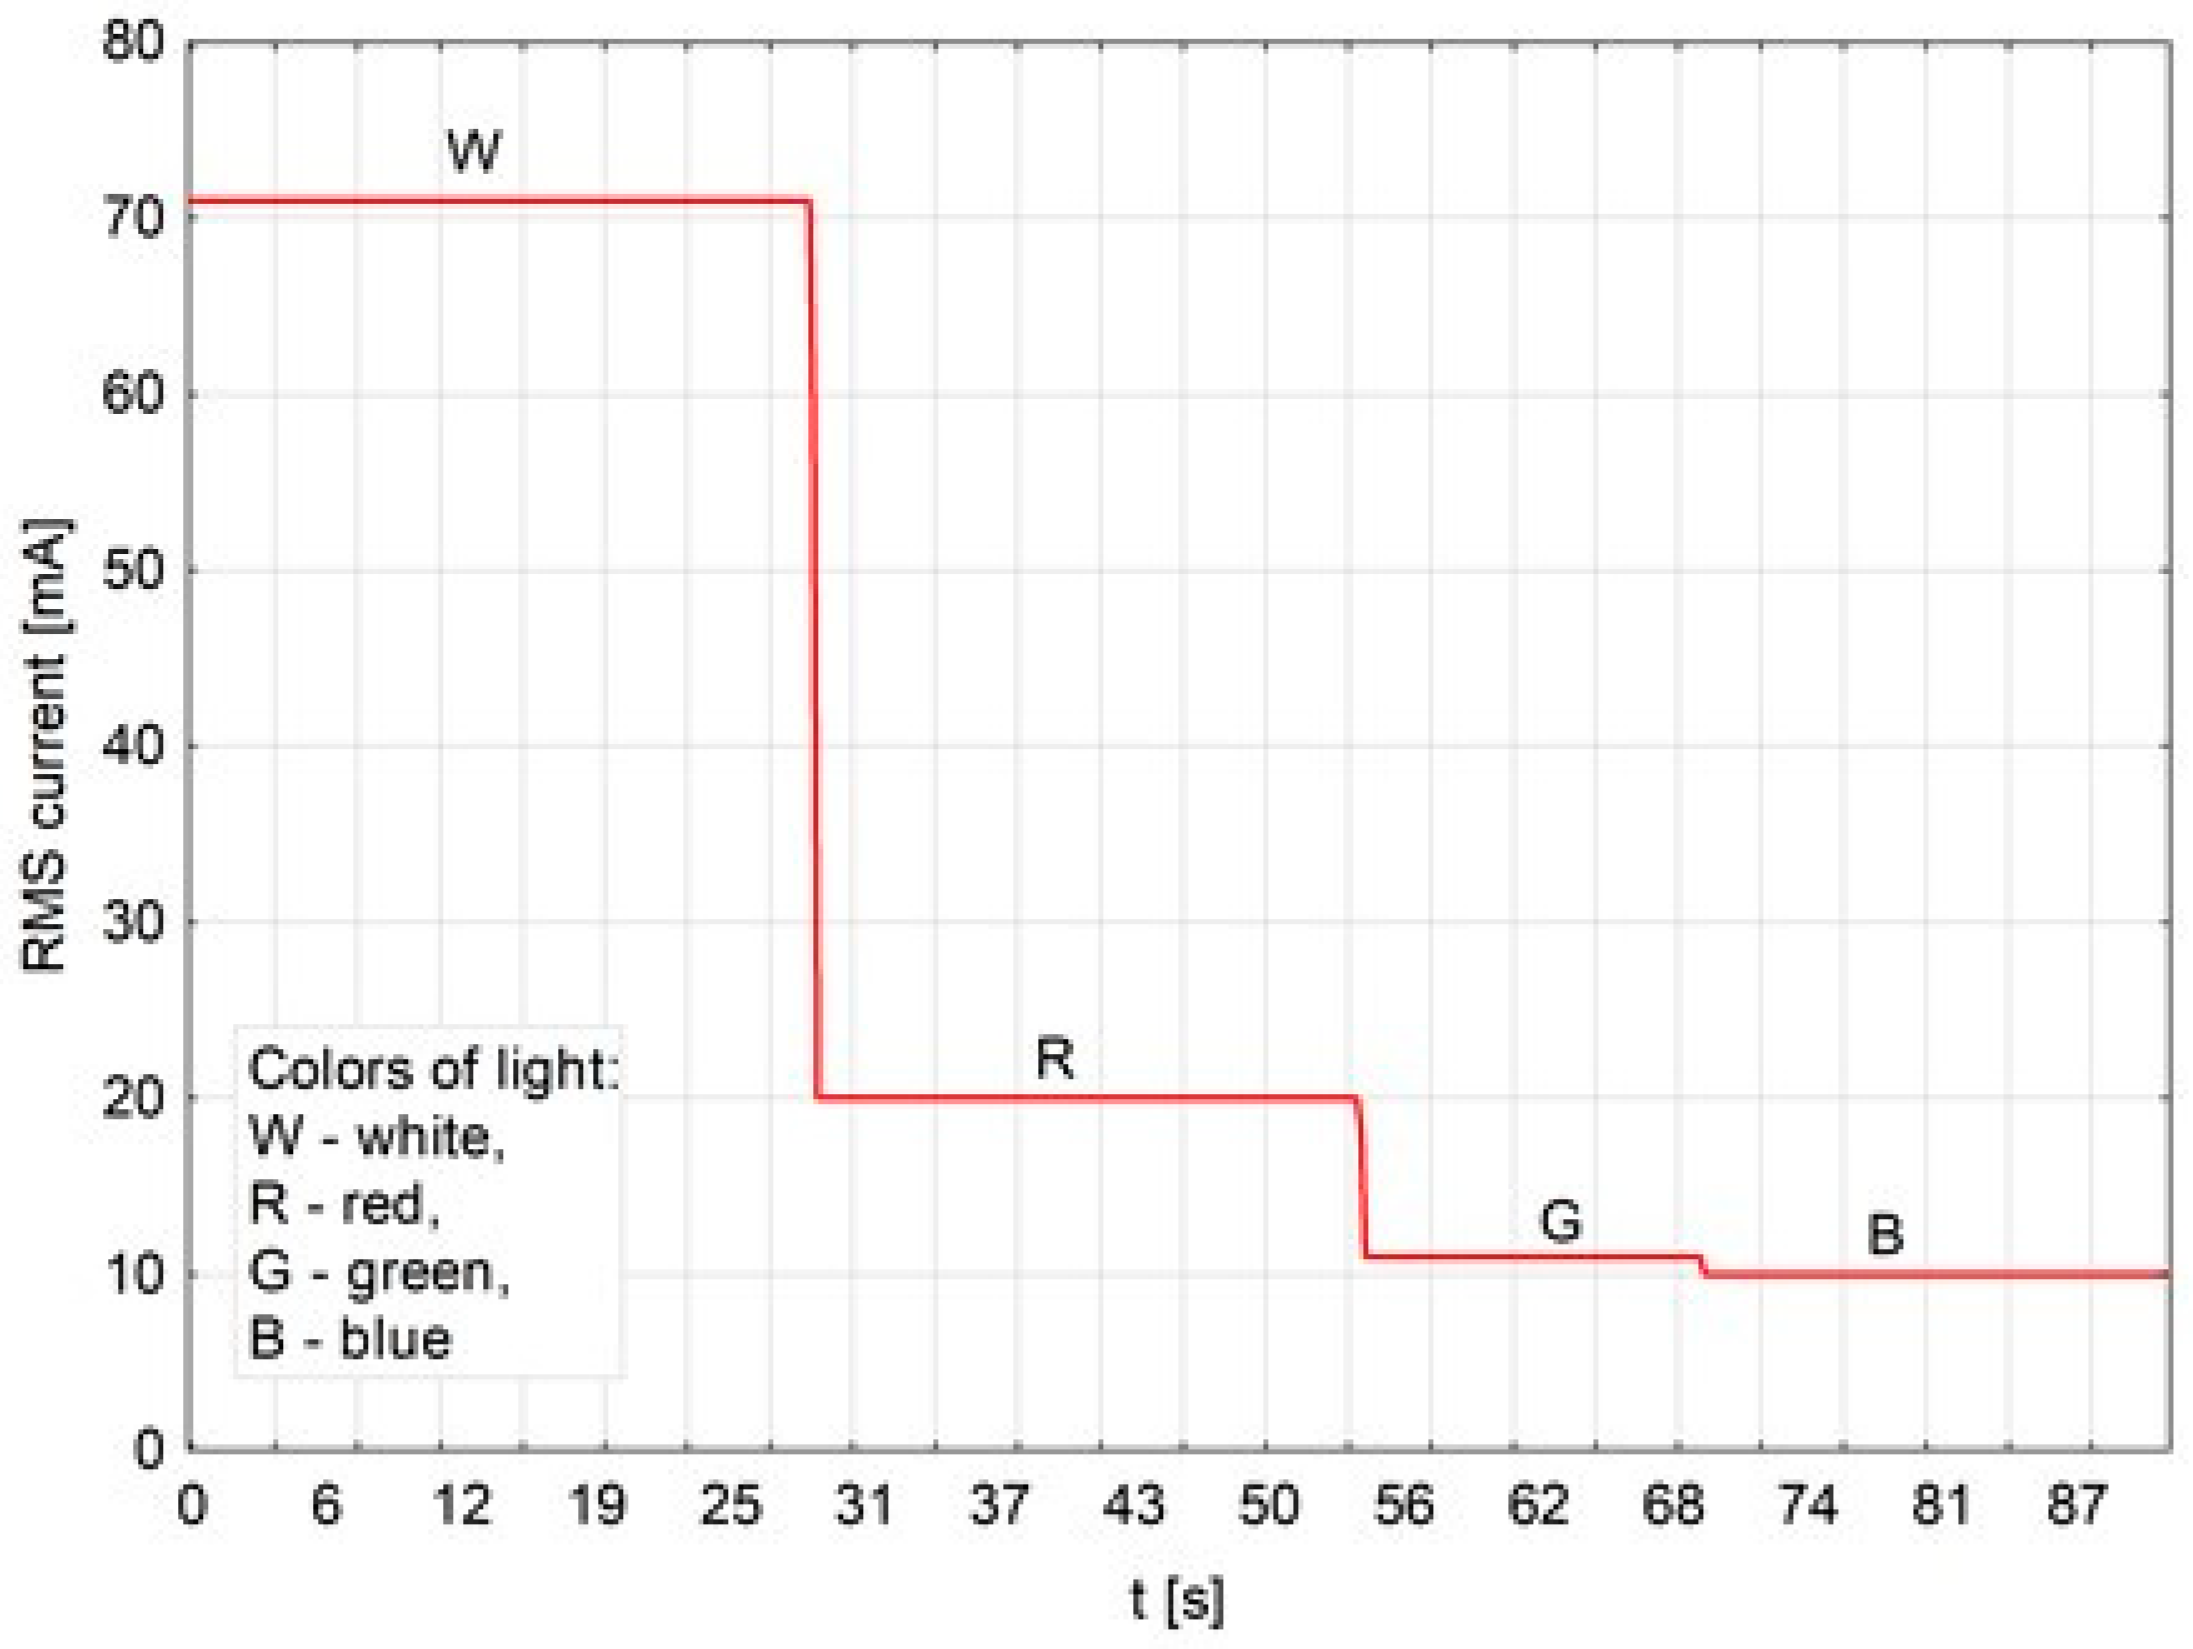
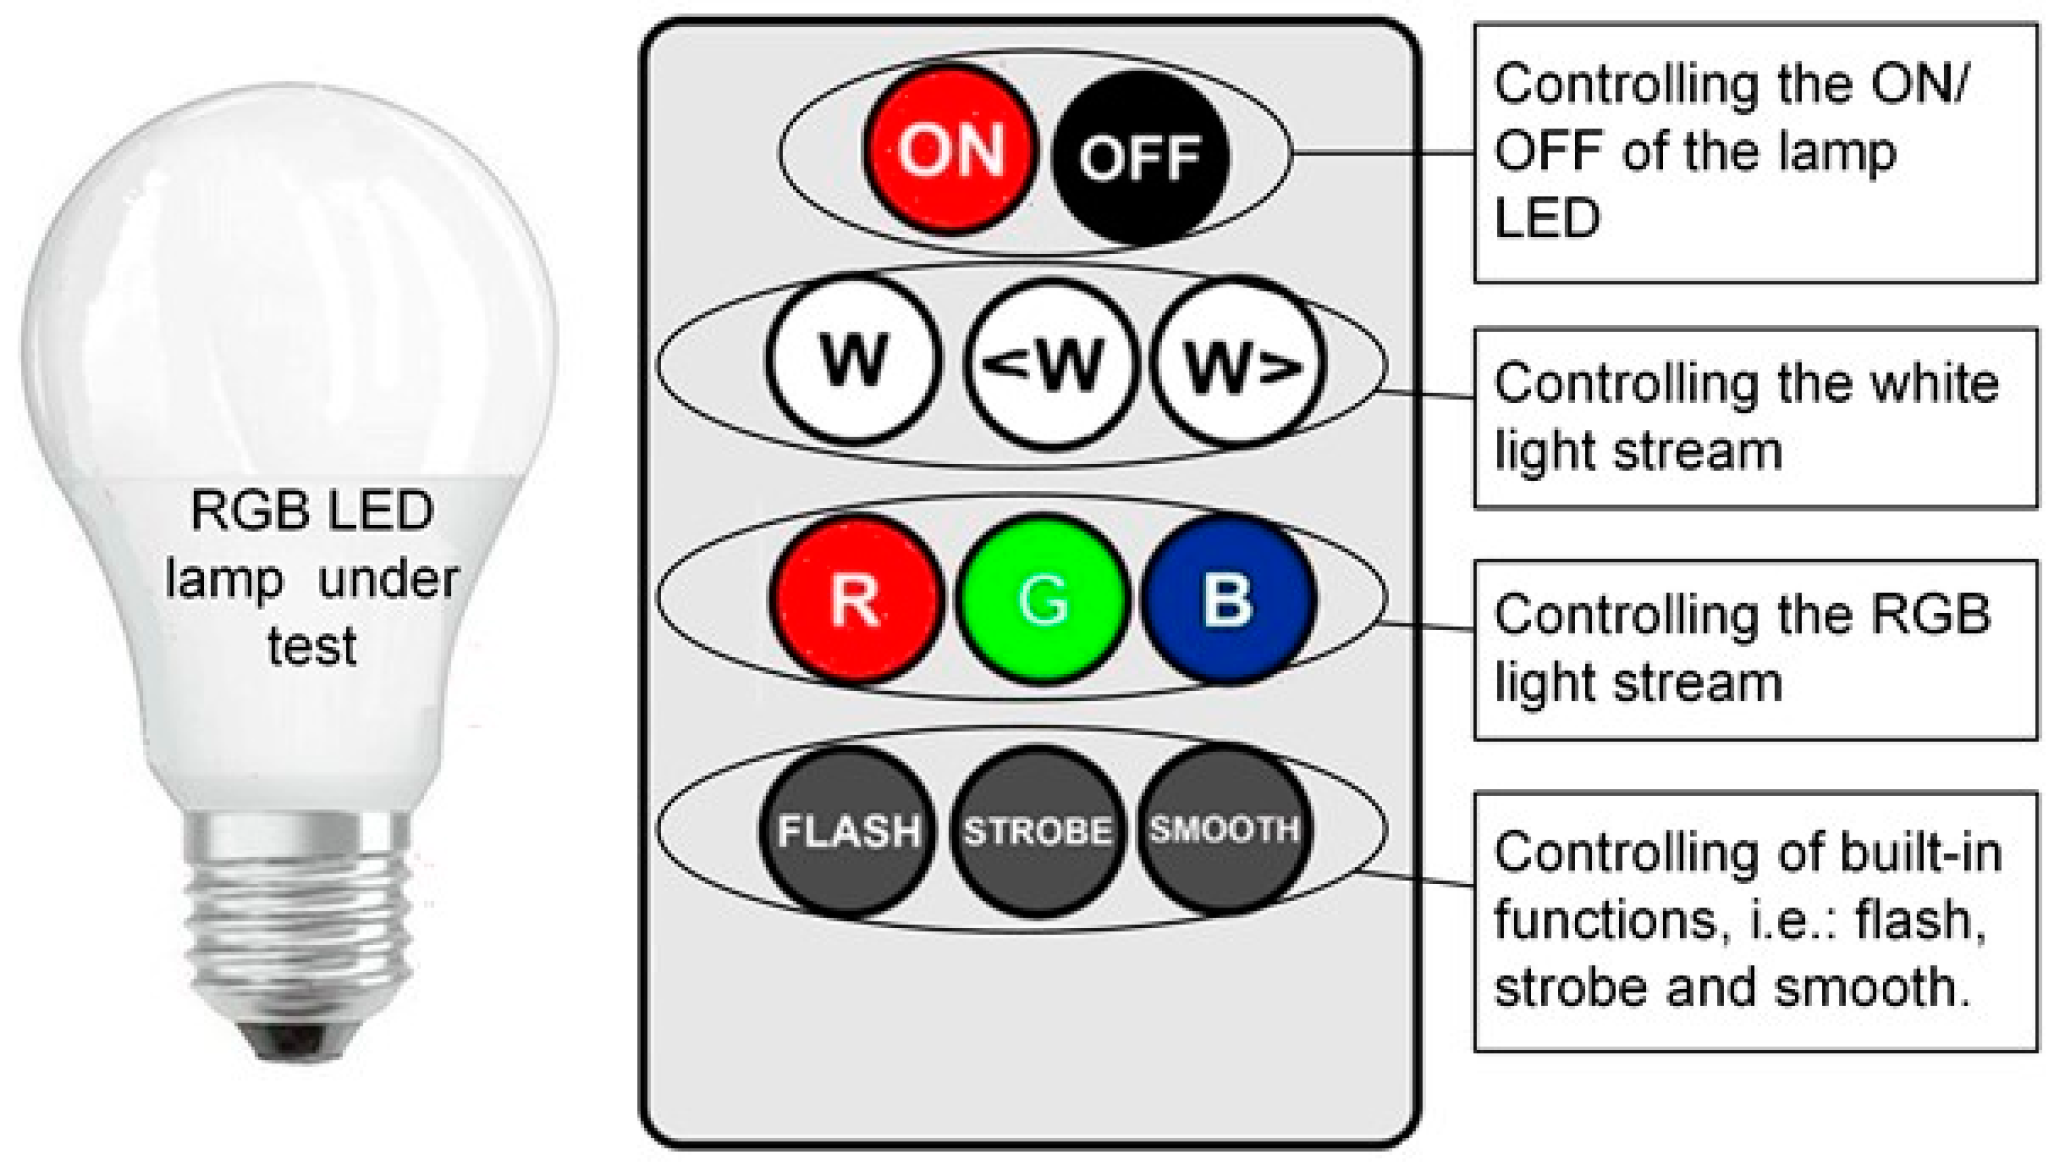
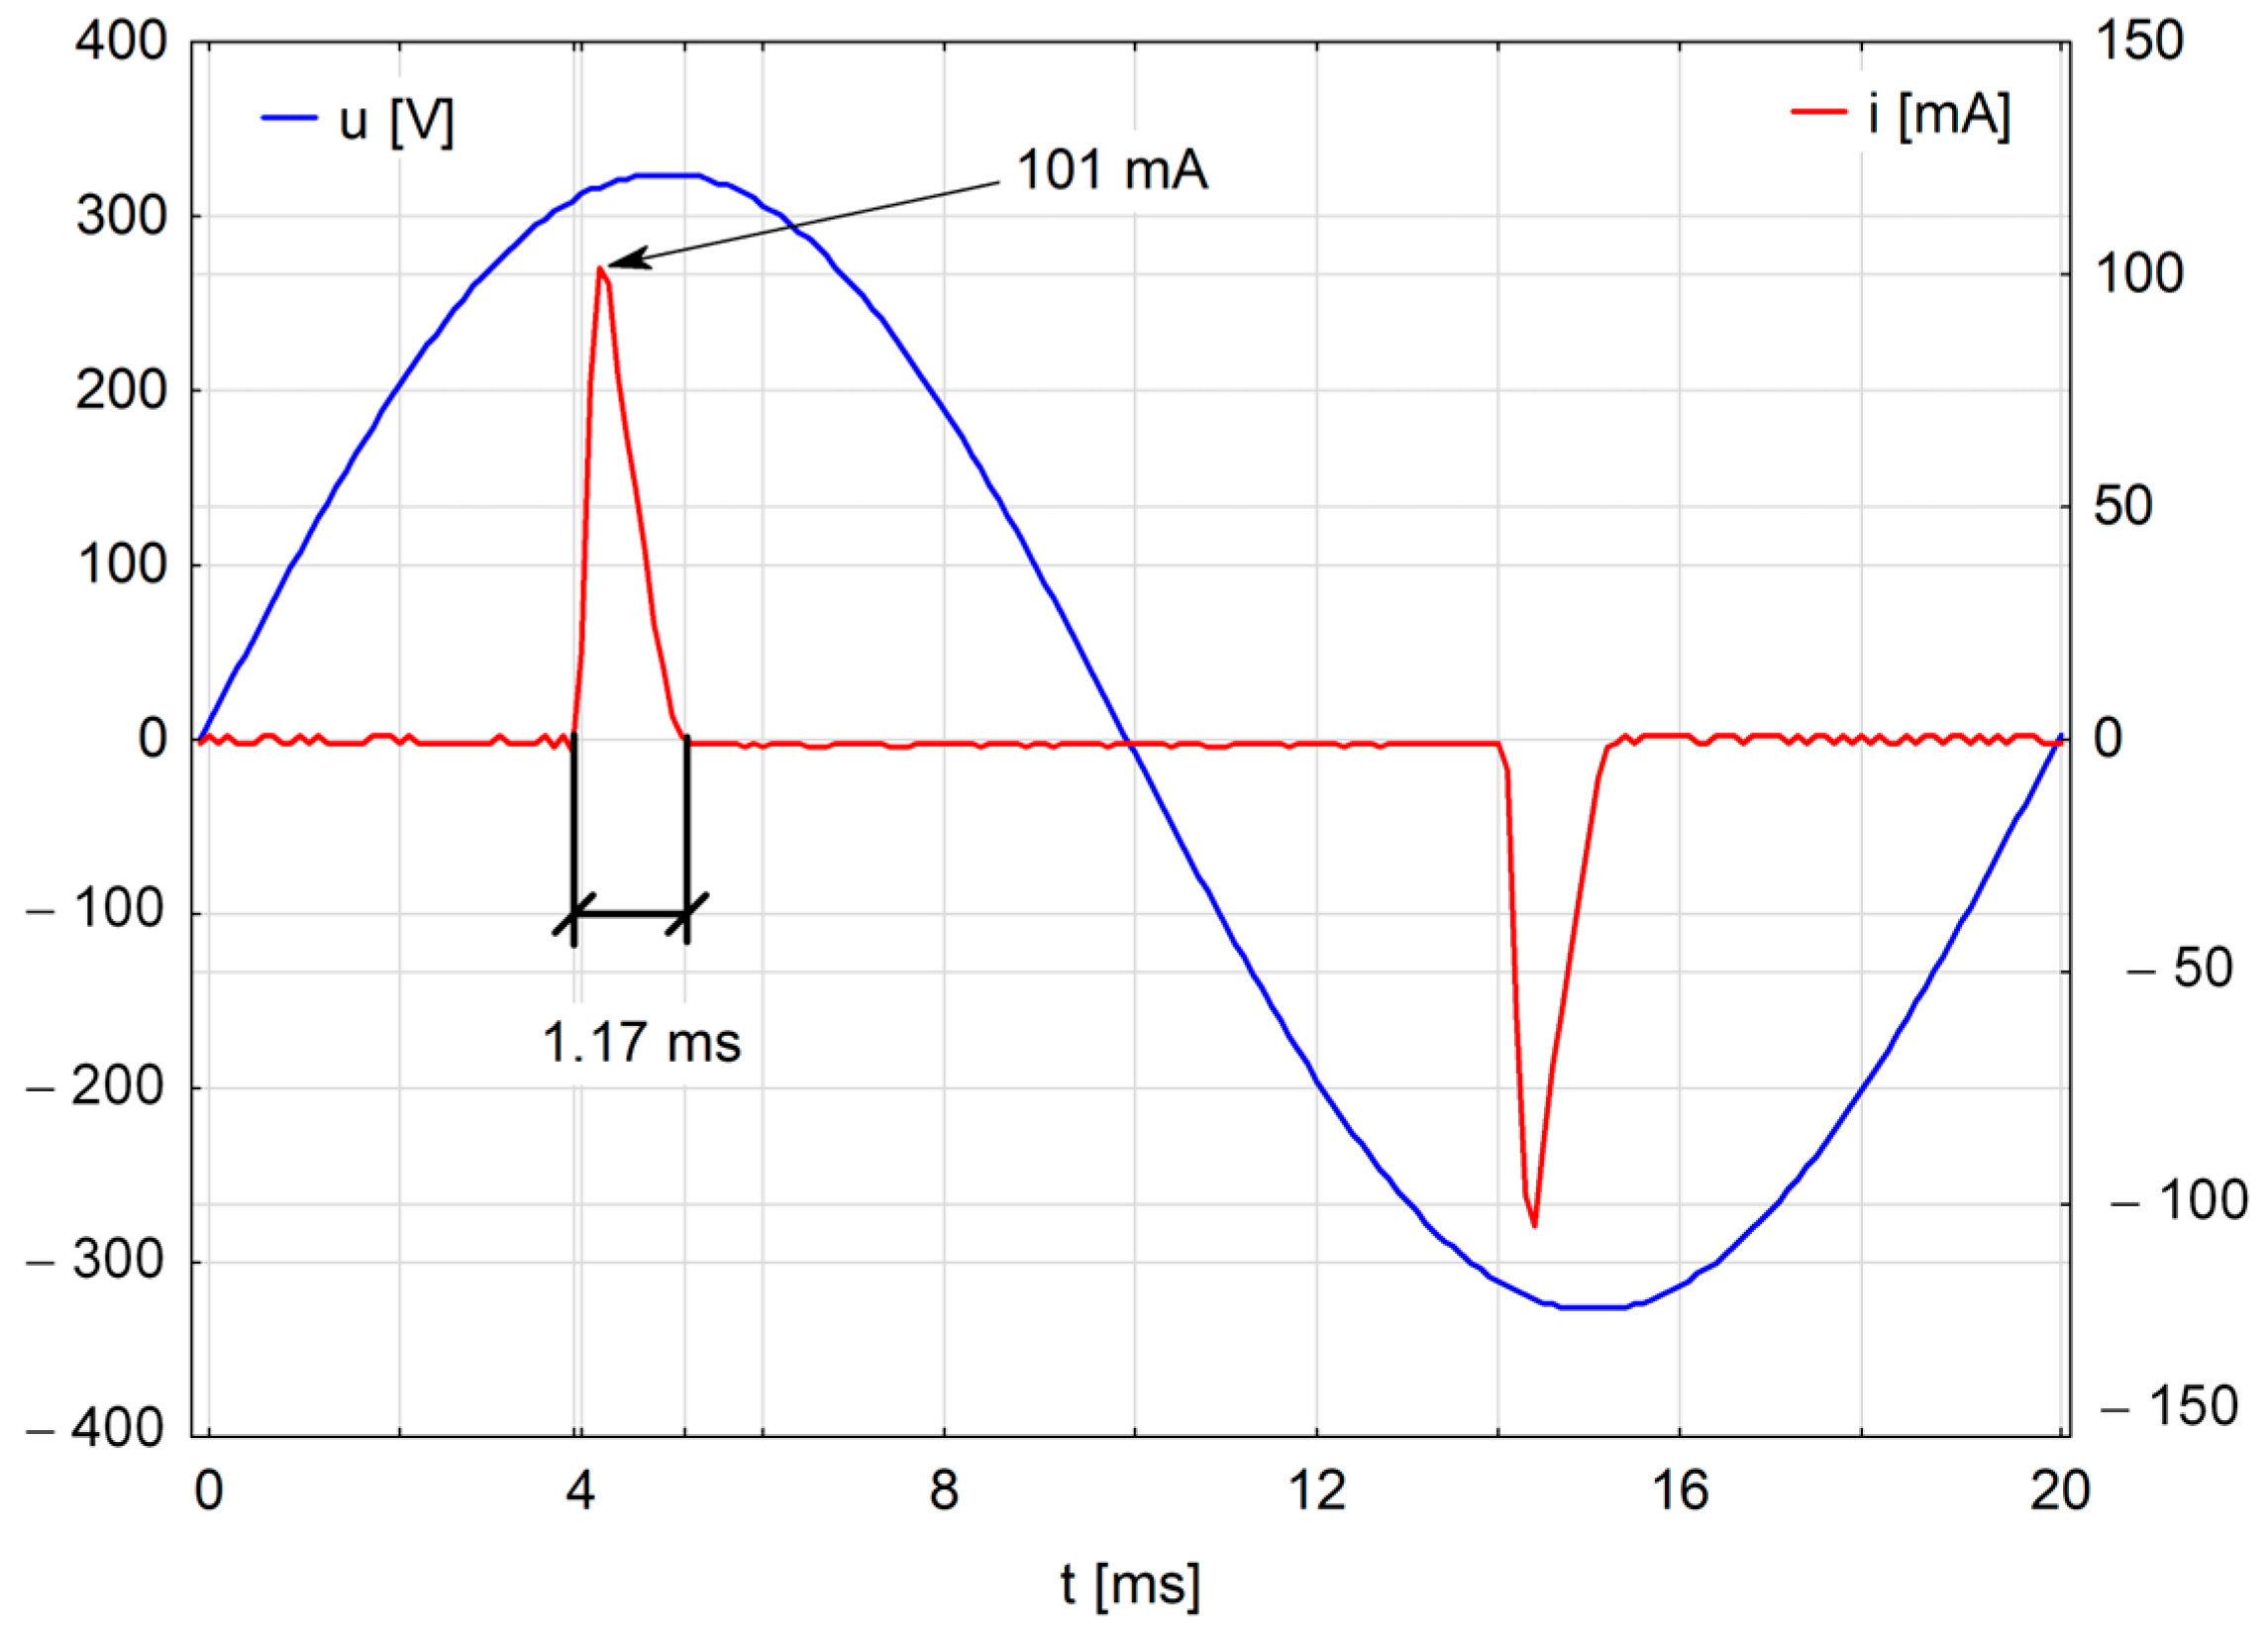
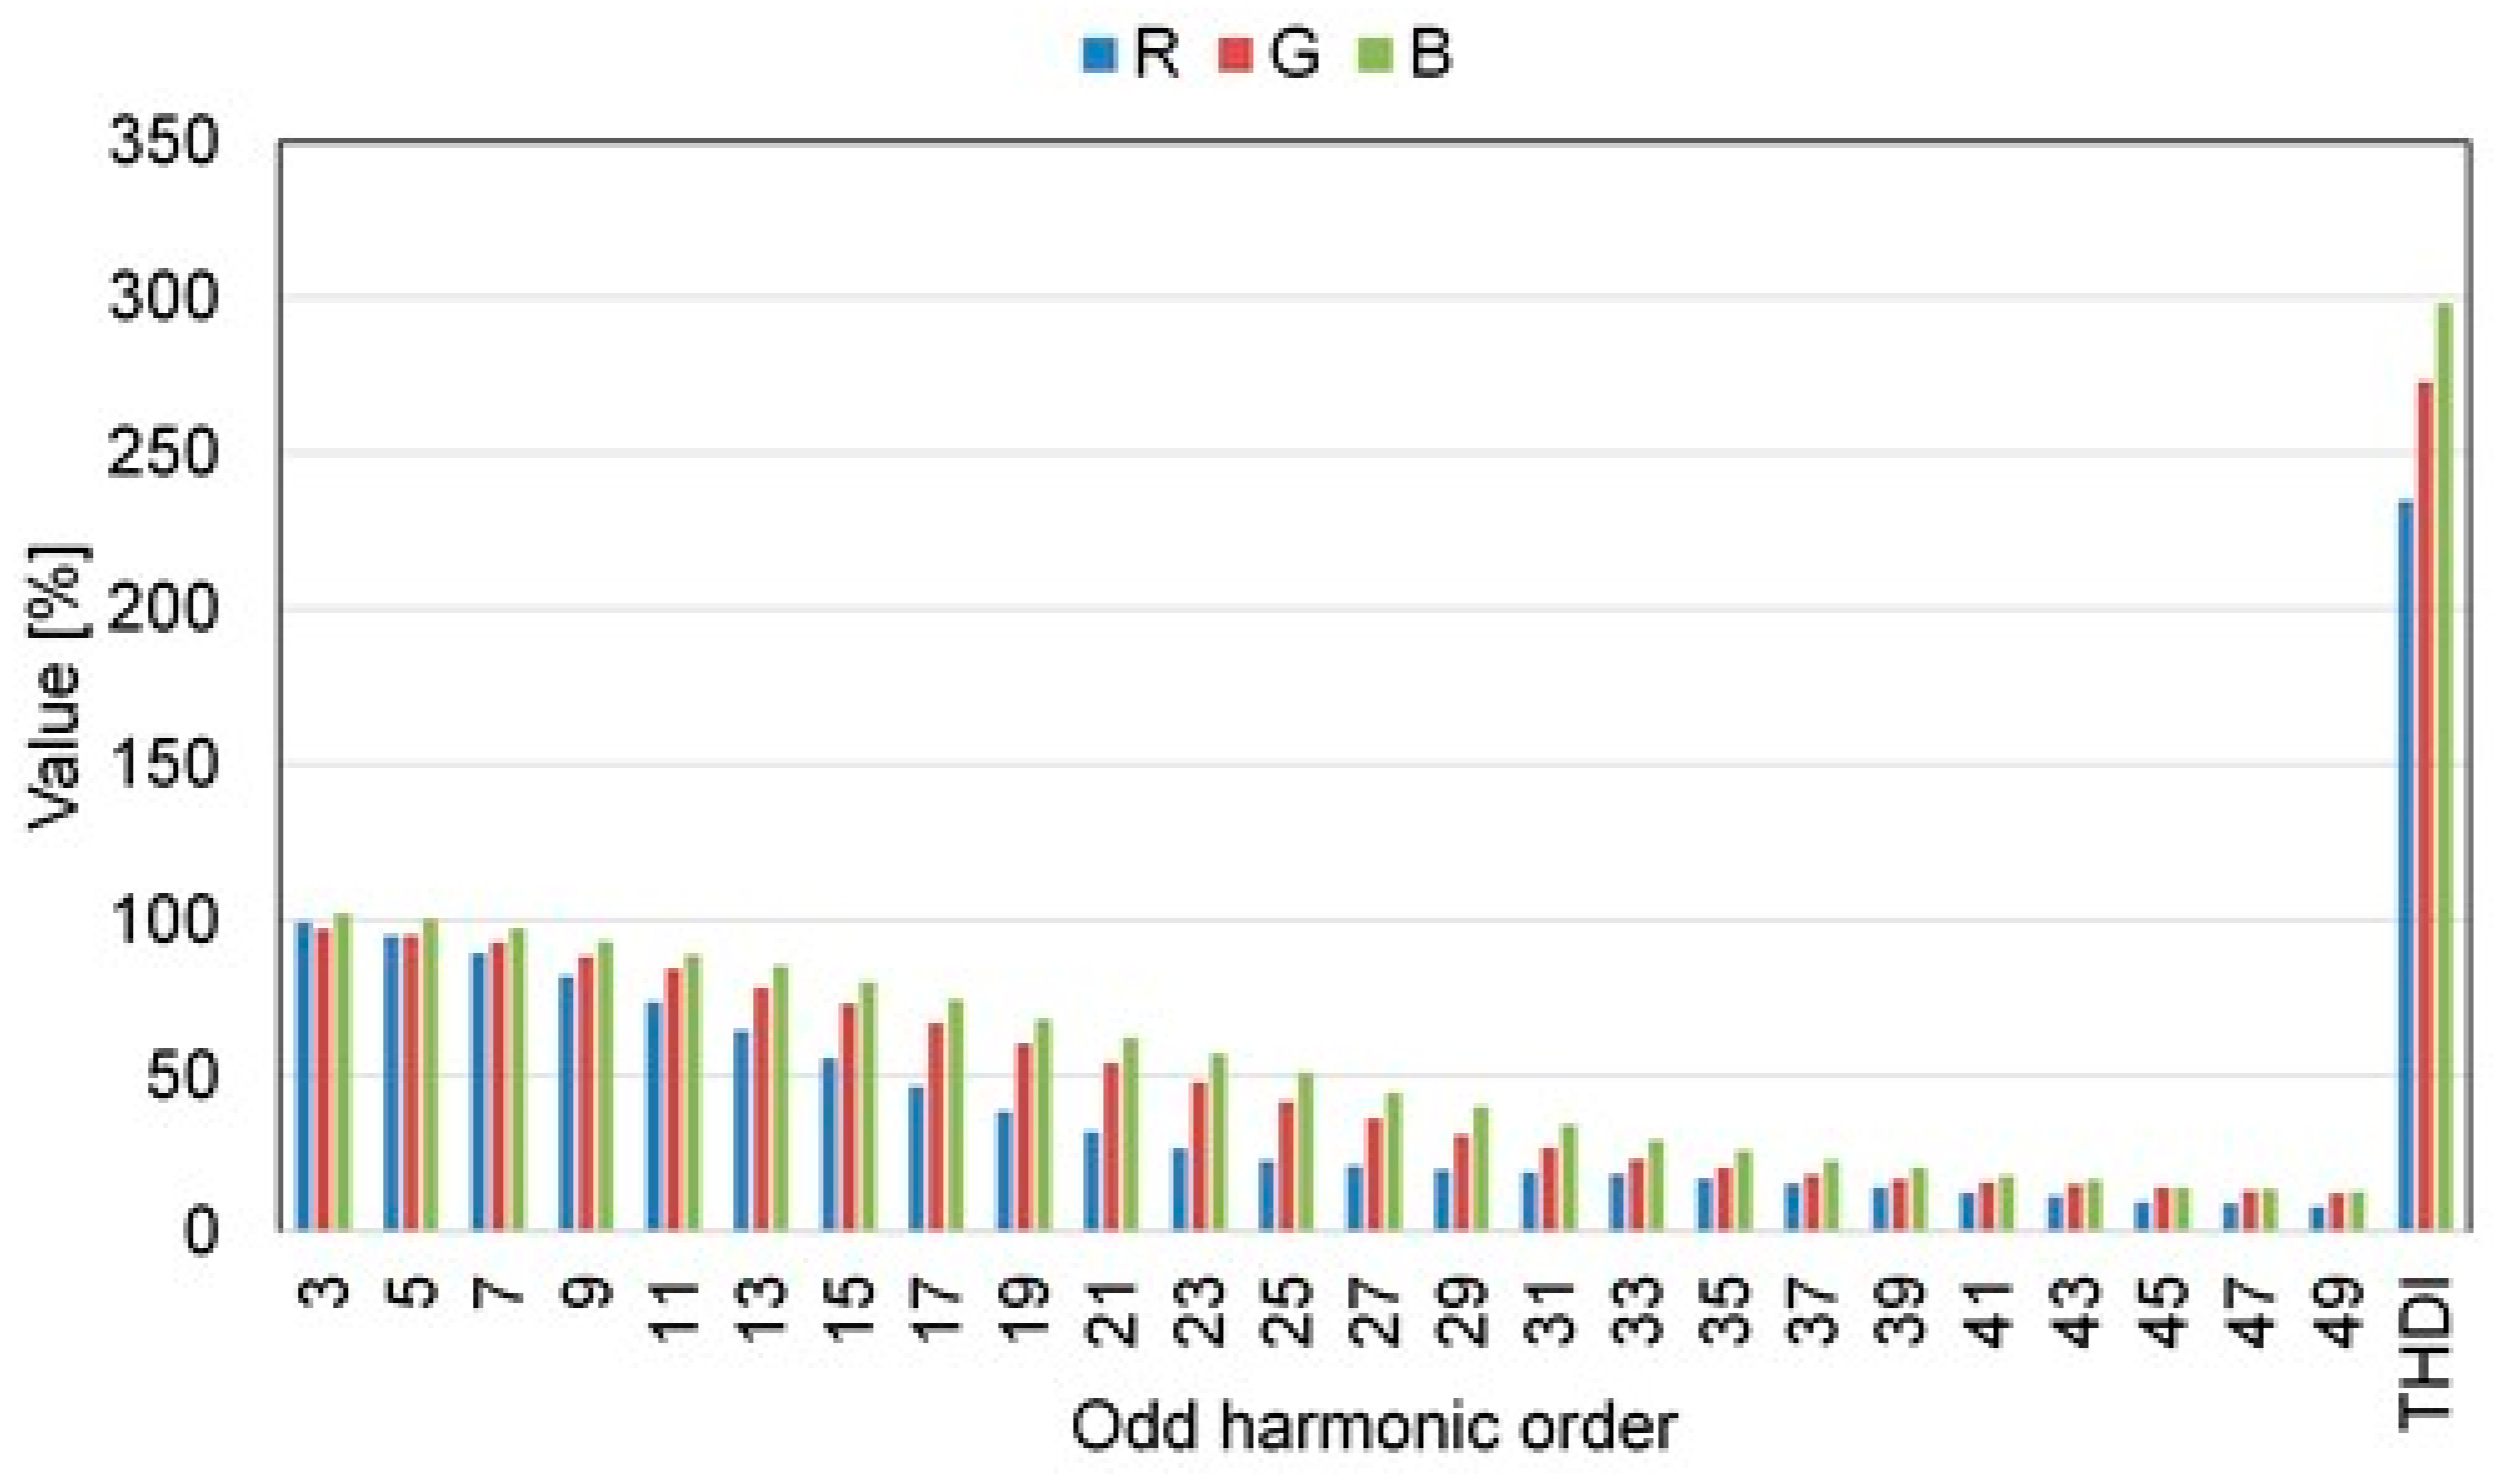
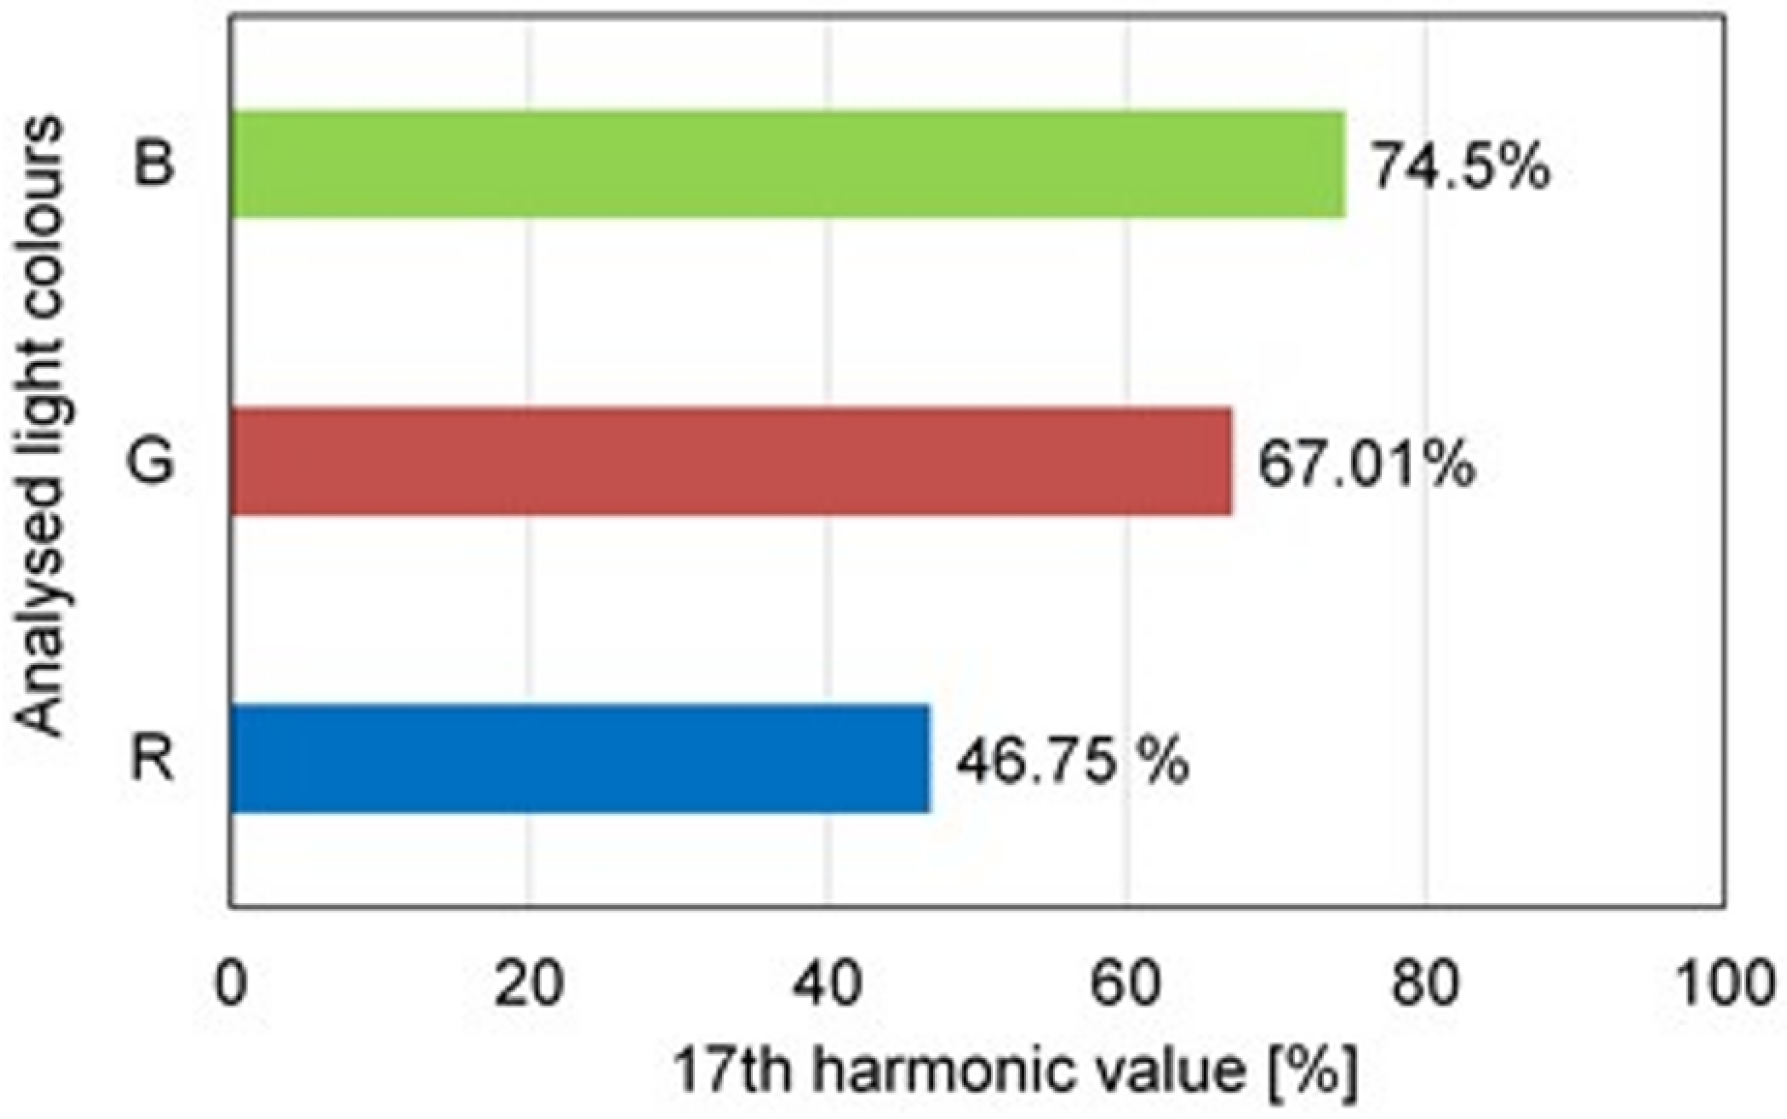
3.3.2. Changing the Colour of RGB Light
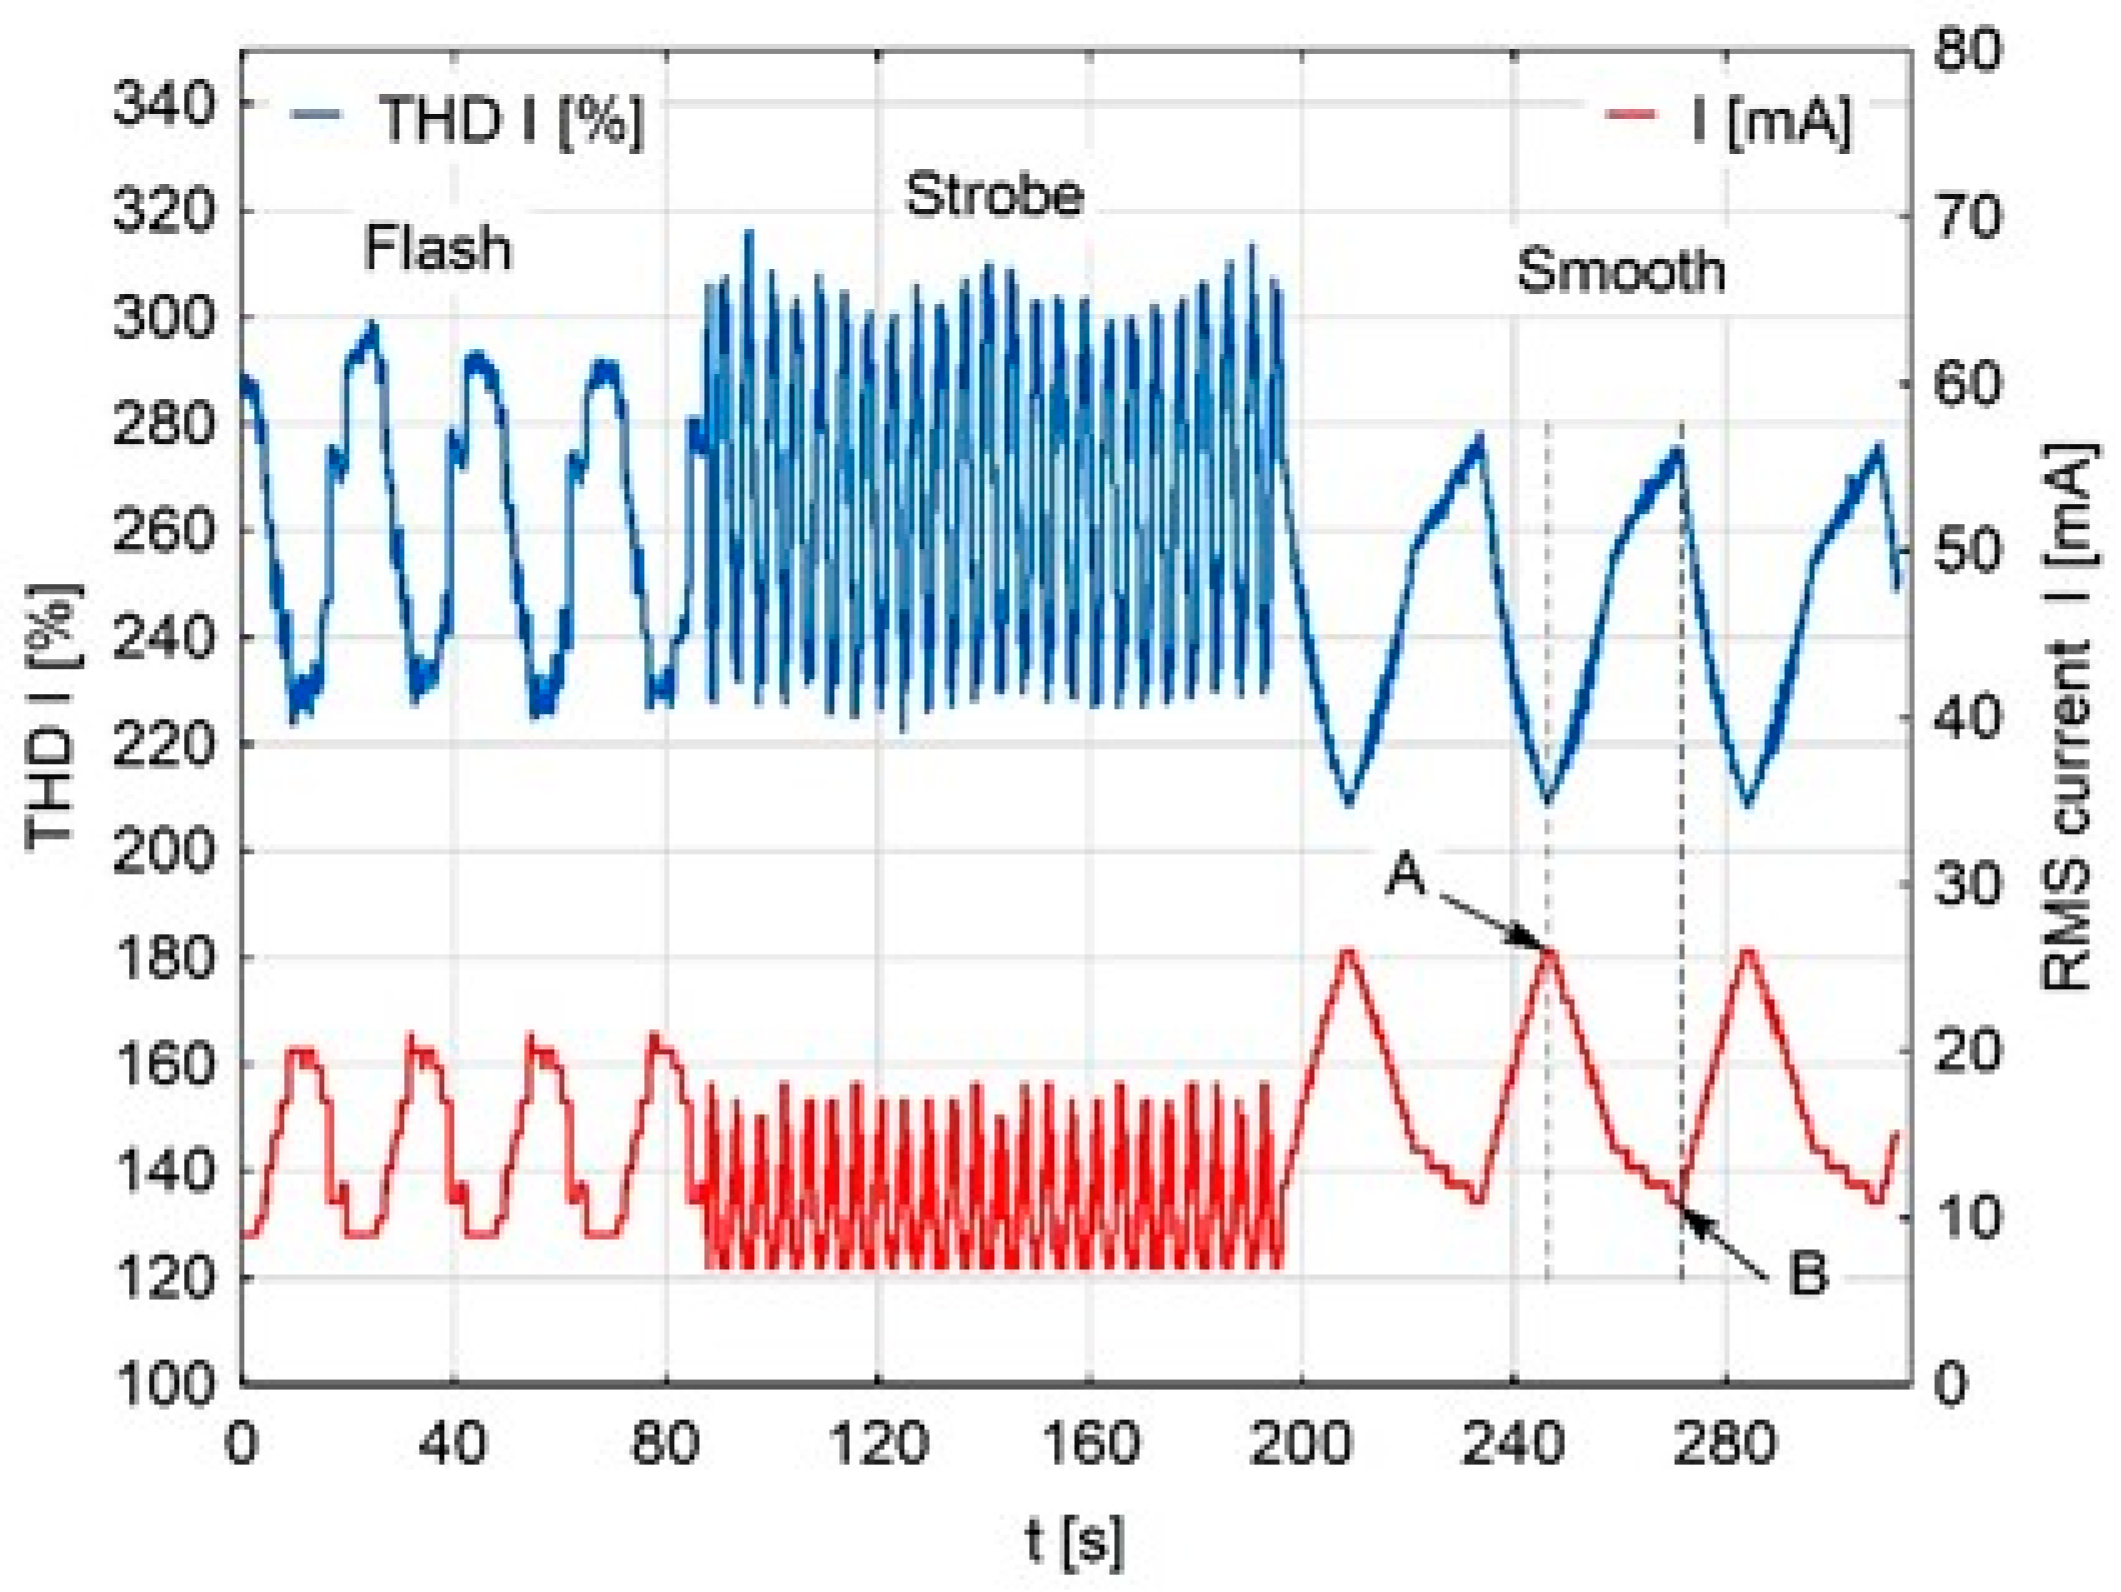
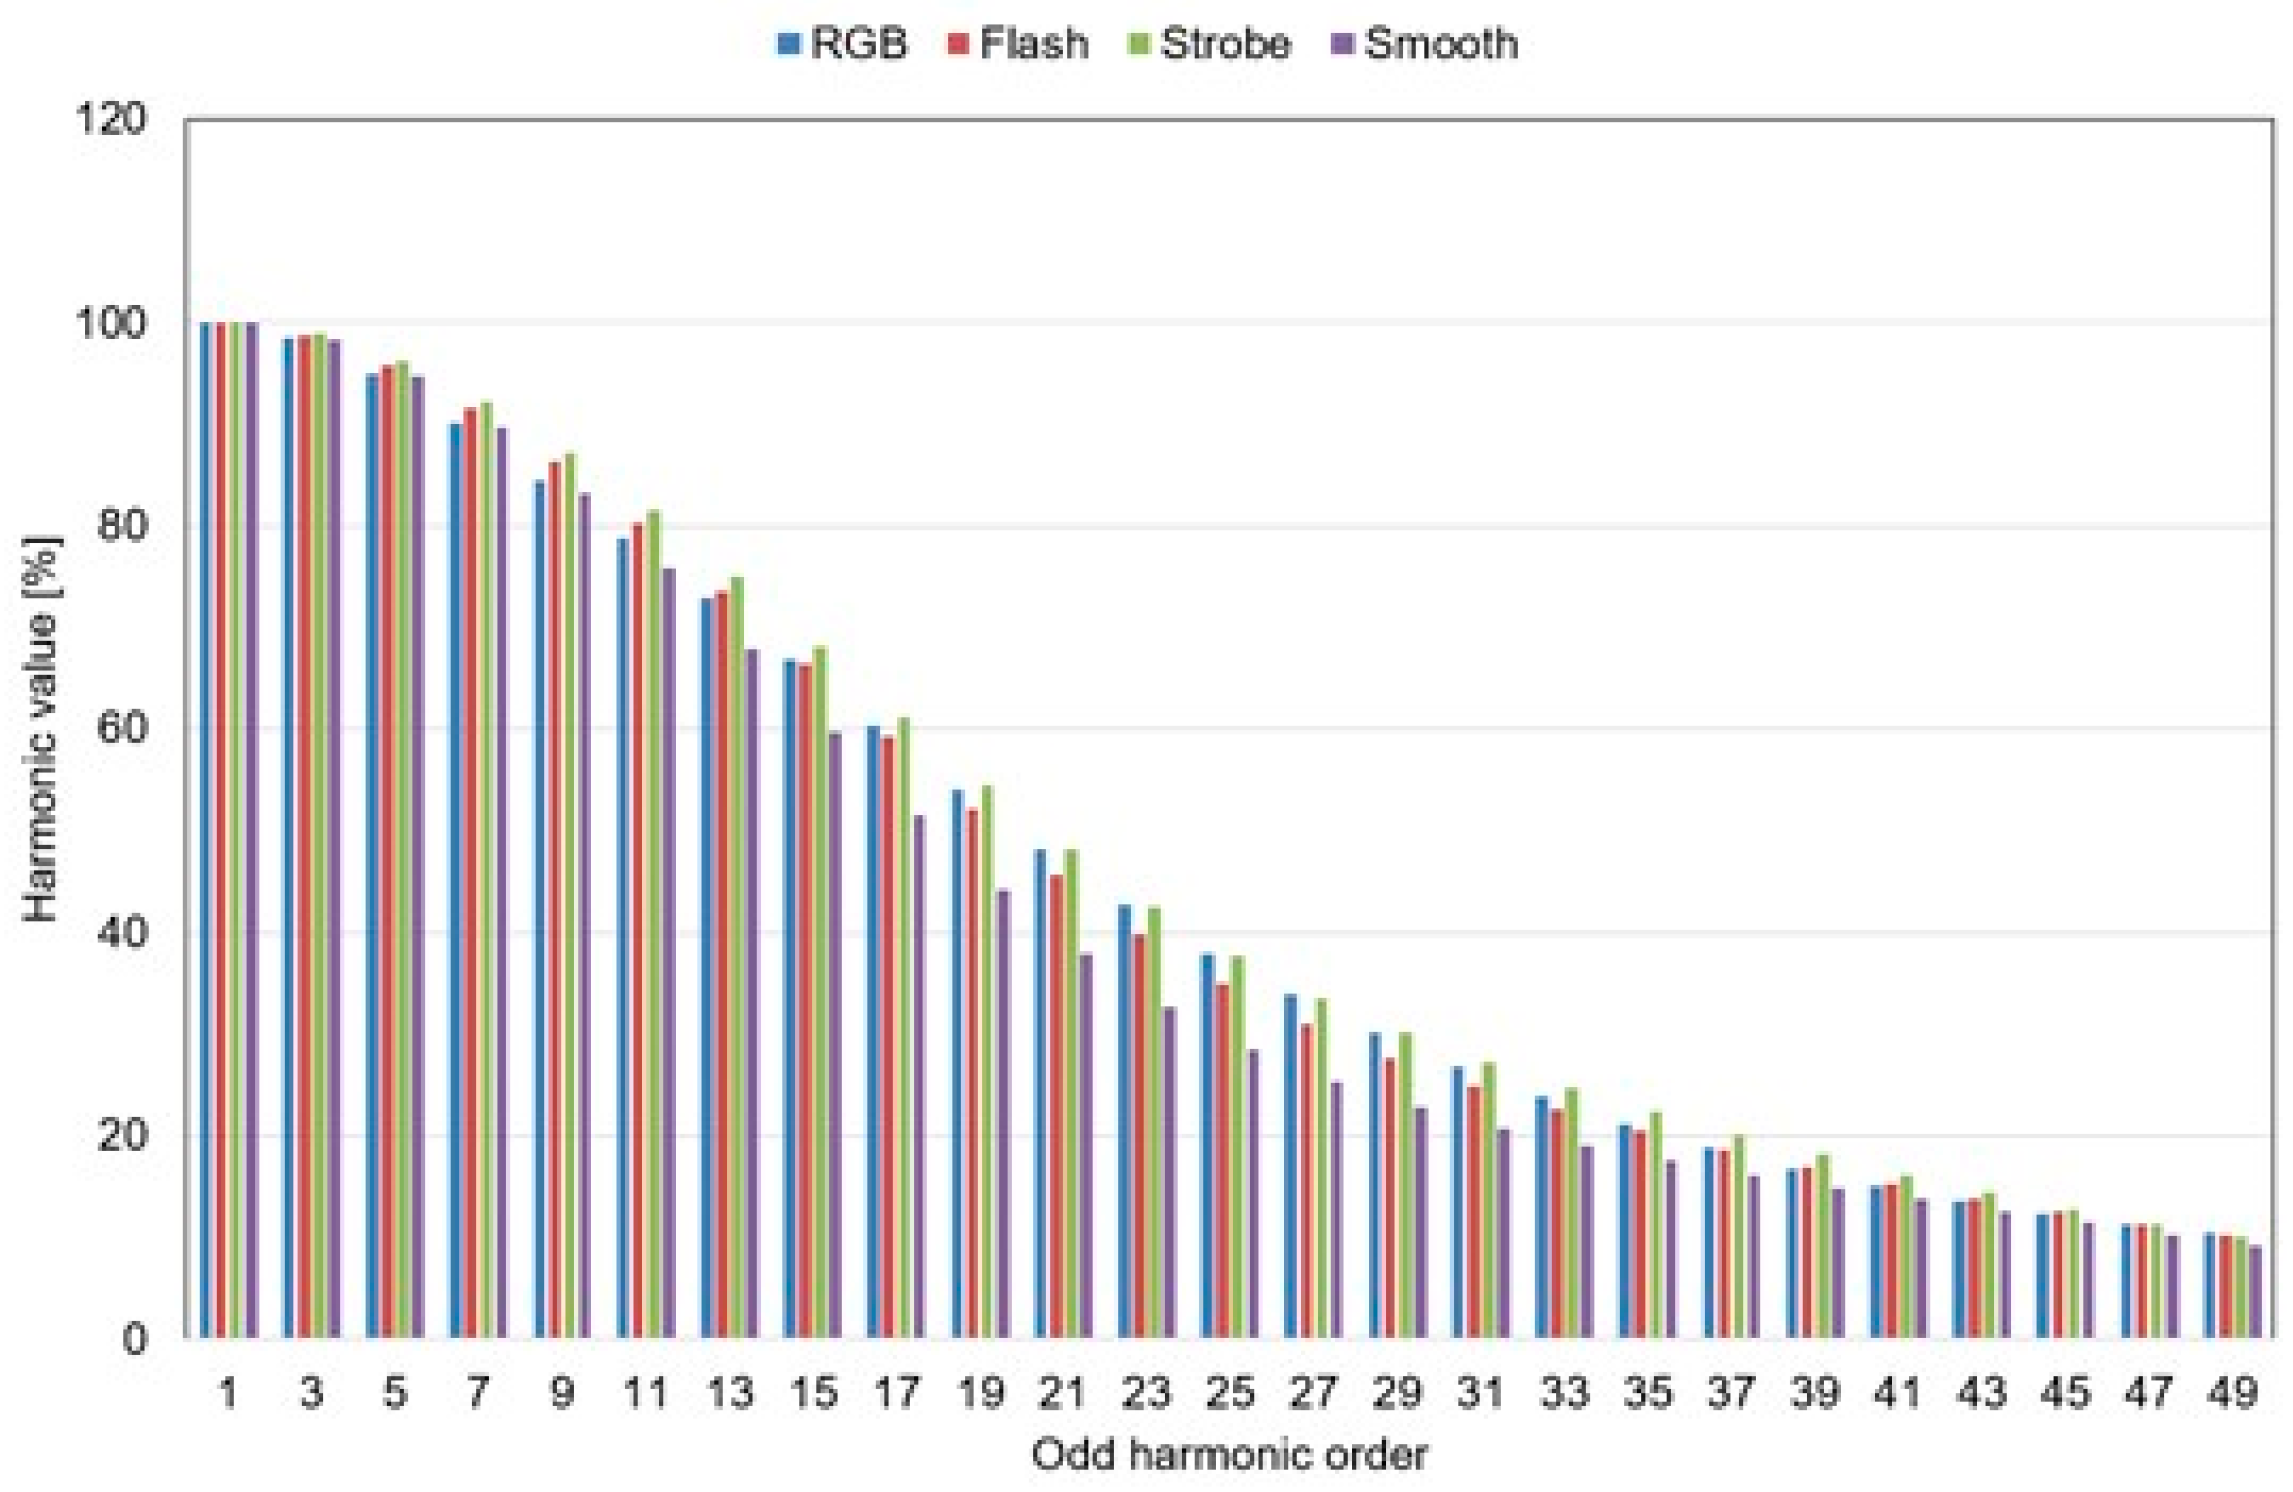
3.3.3. Built-In Functions (Flash, Strobe, Smooth) vs. Values of Generated Harmonics
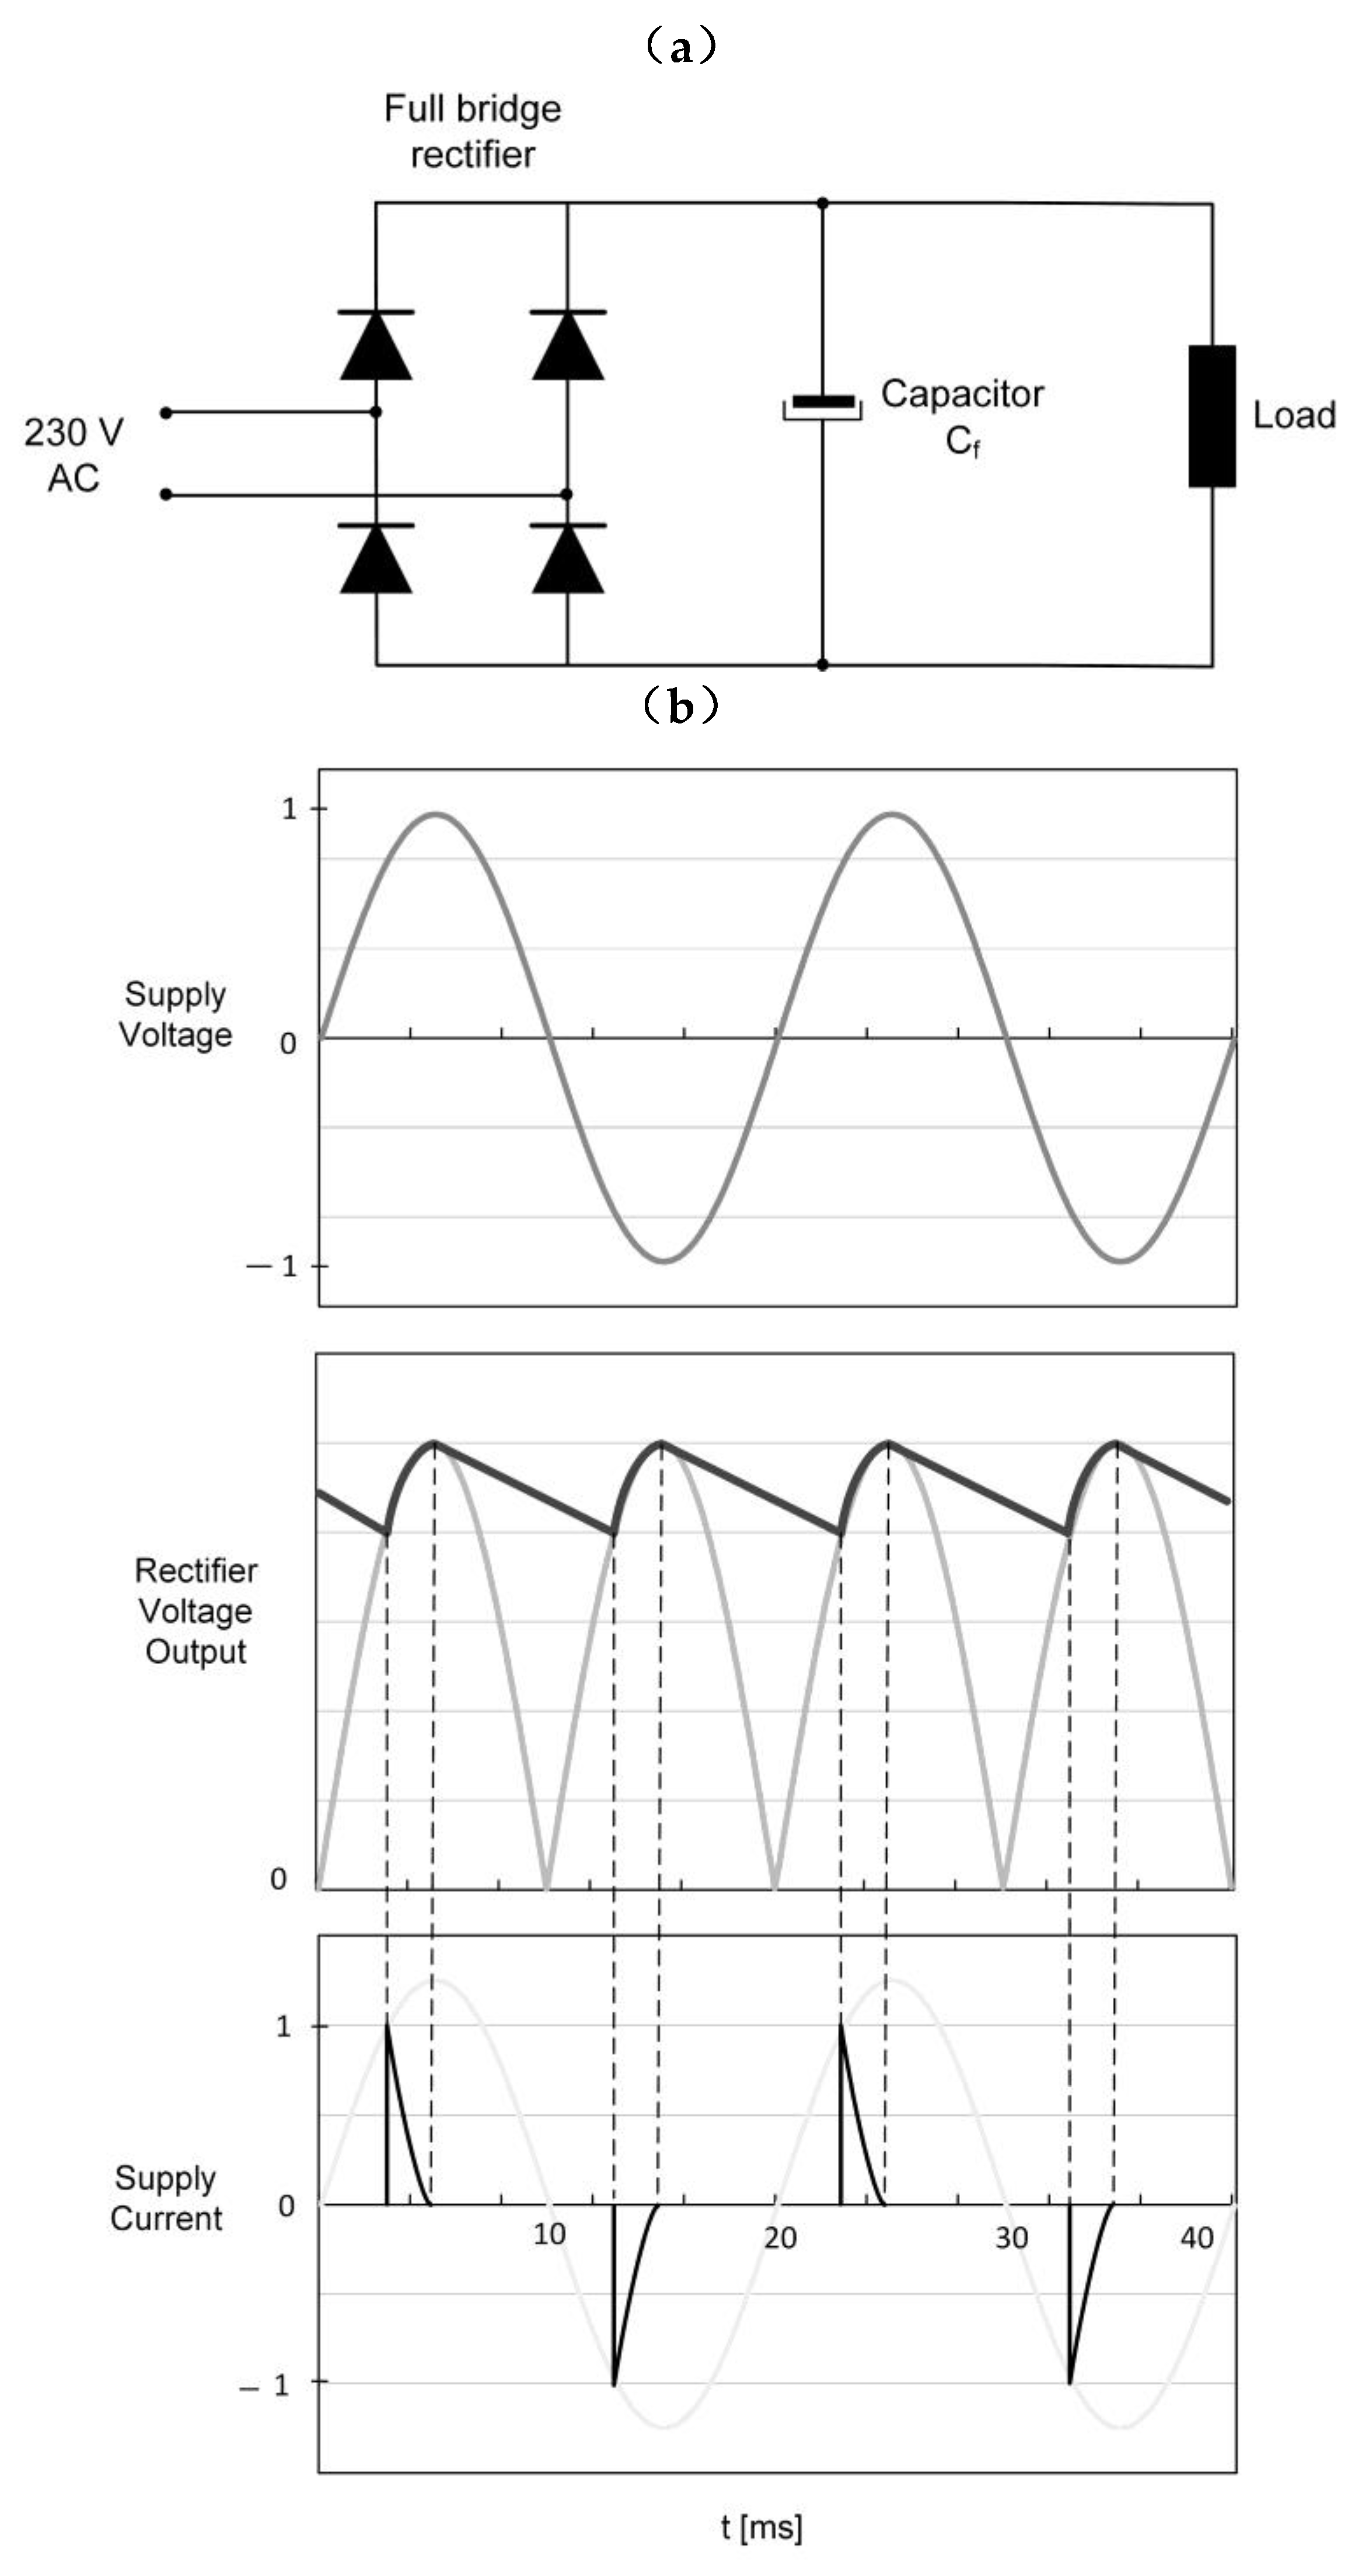
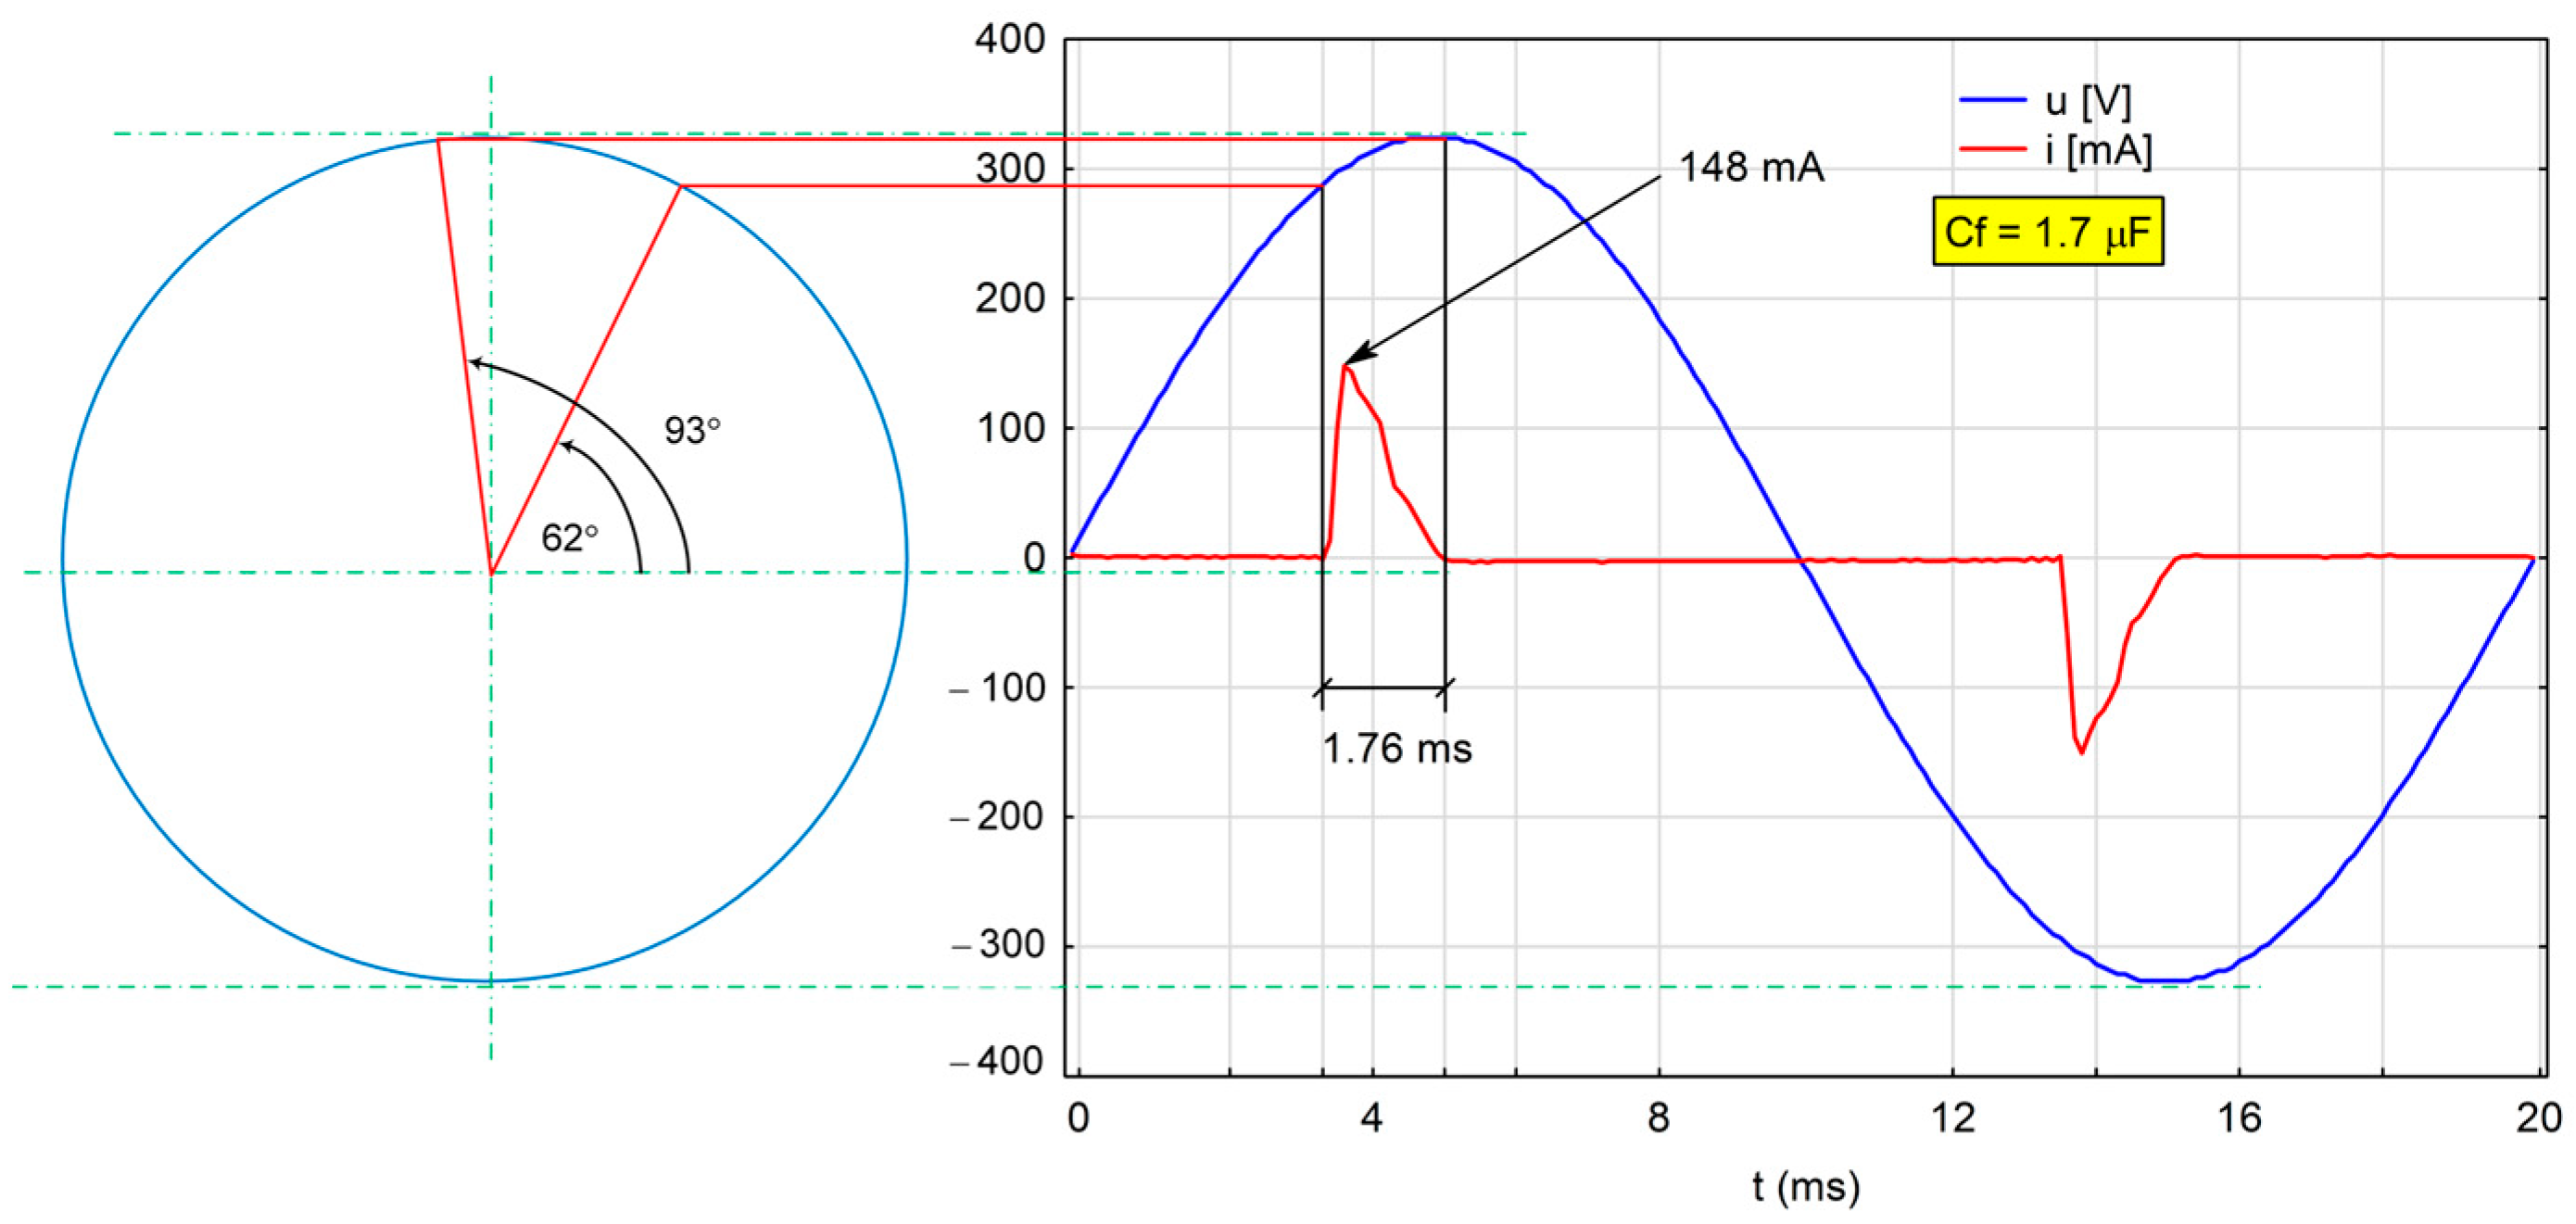
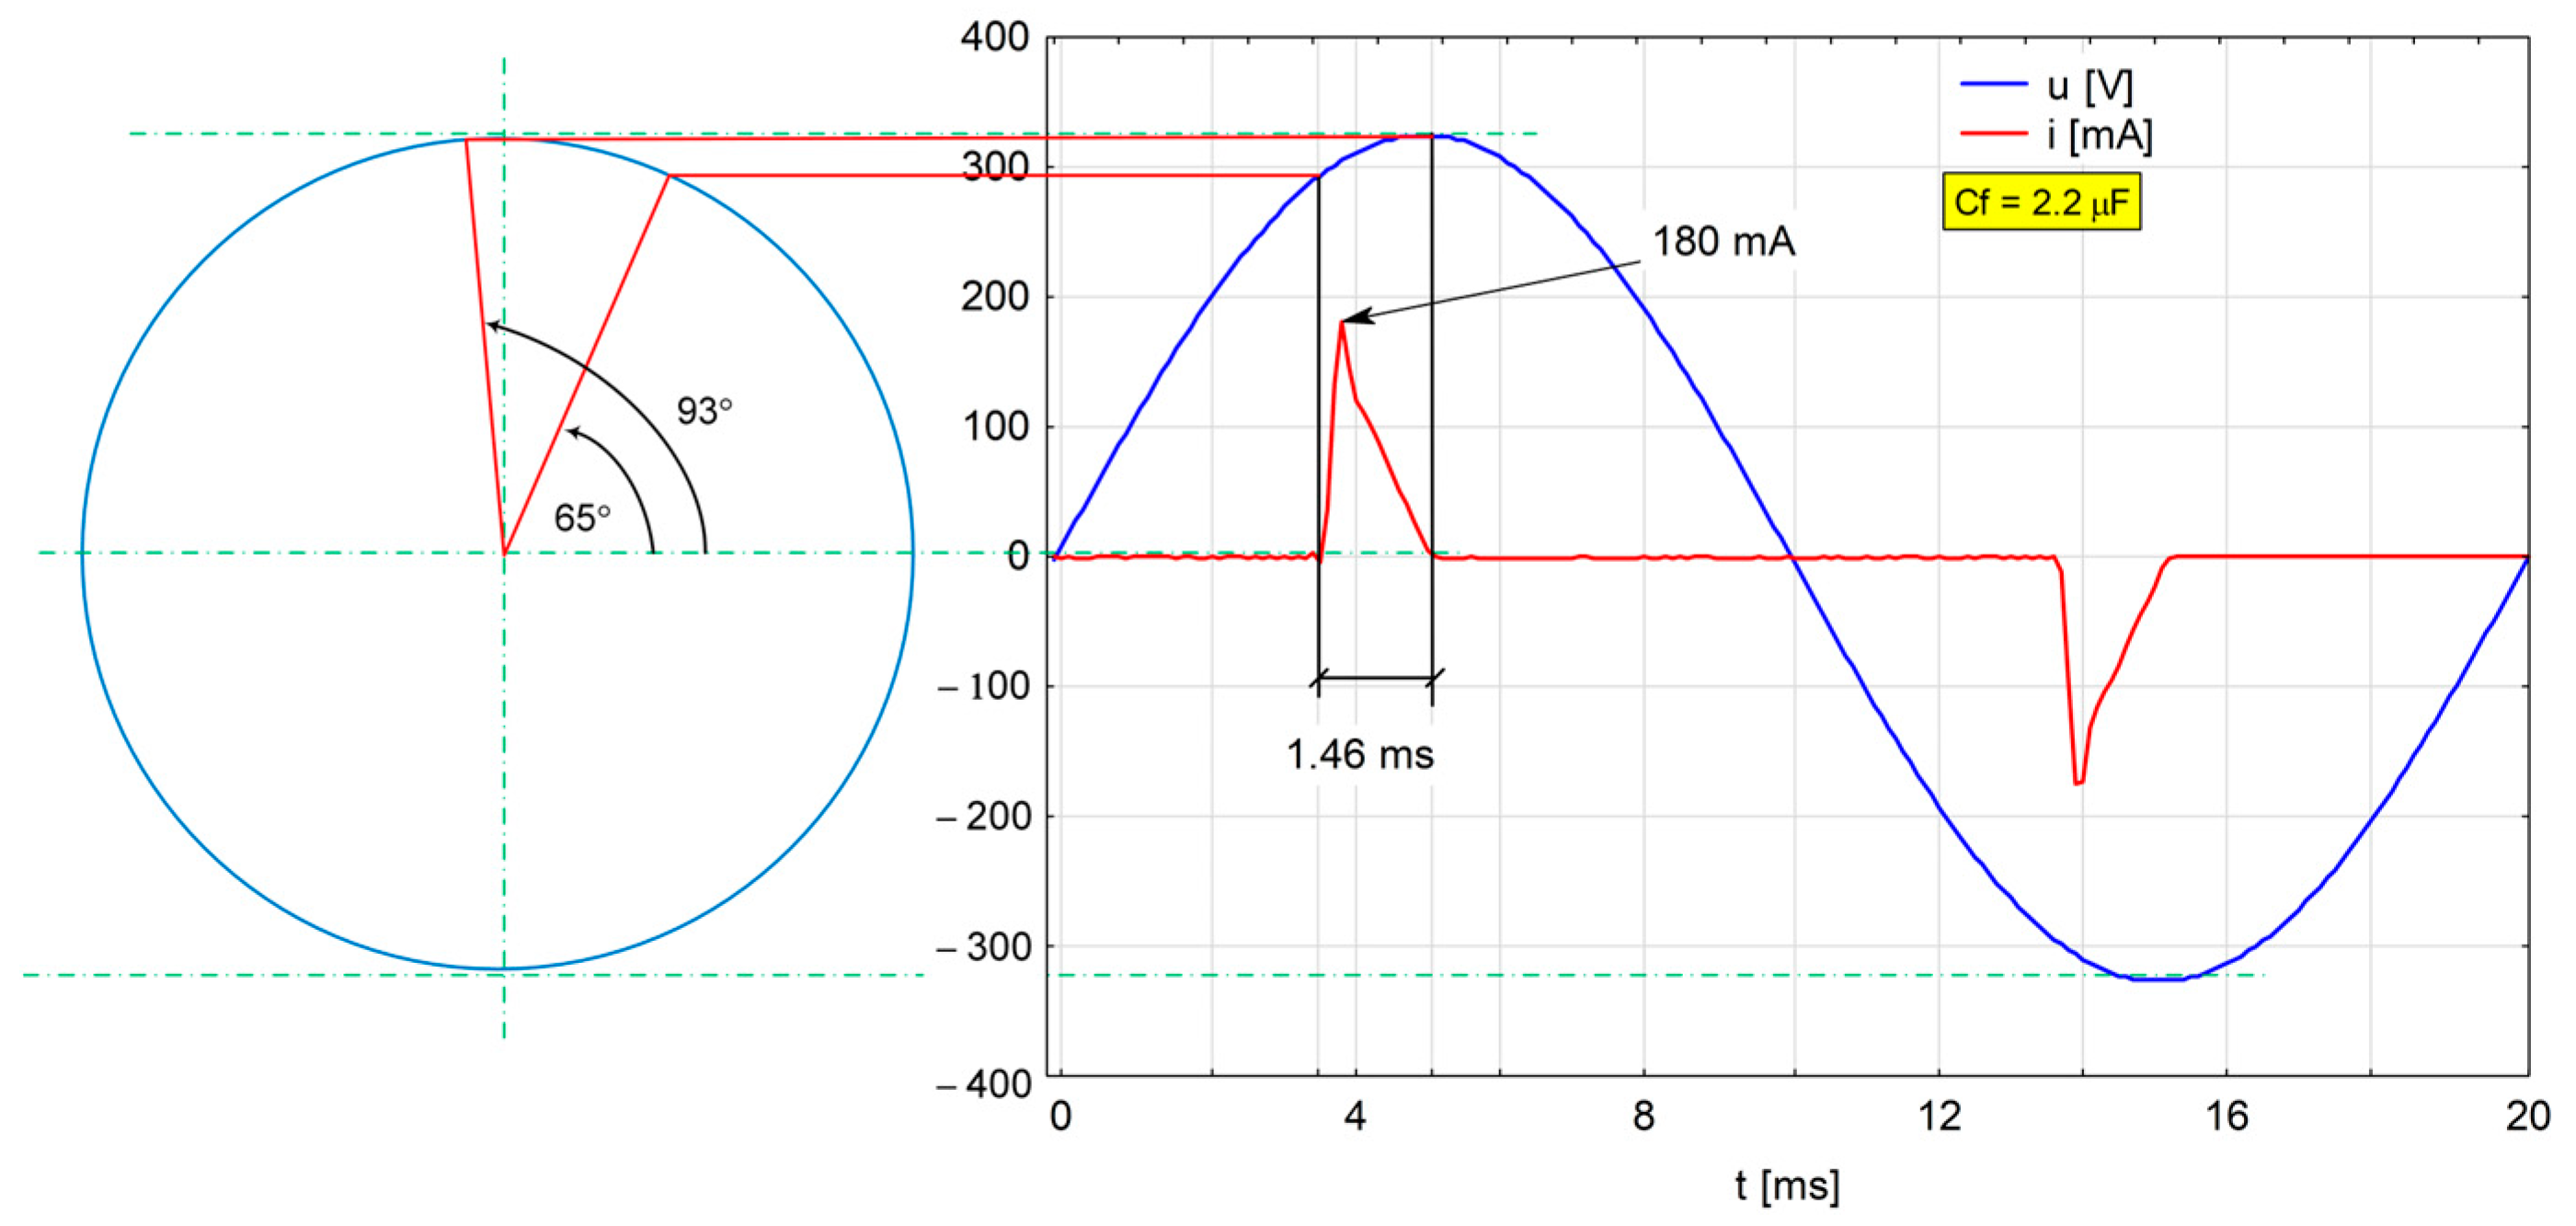
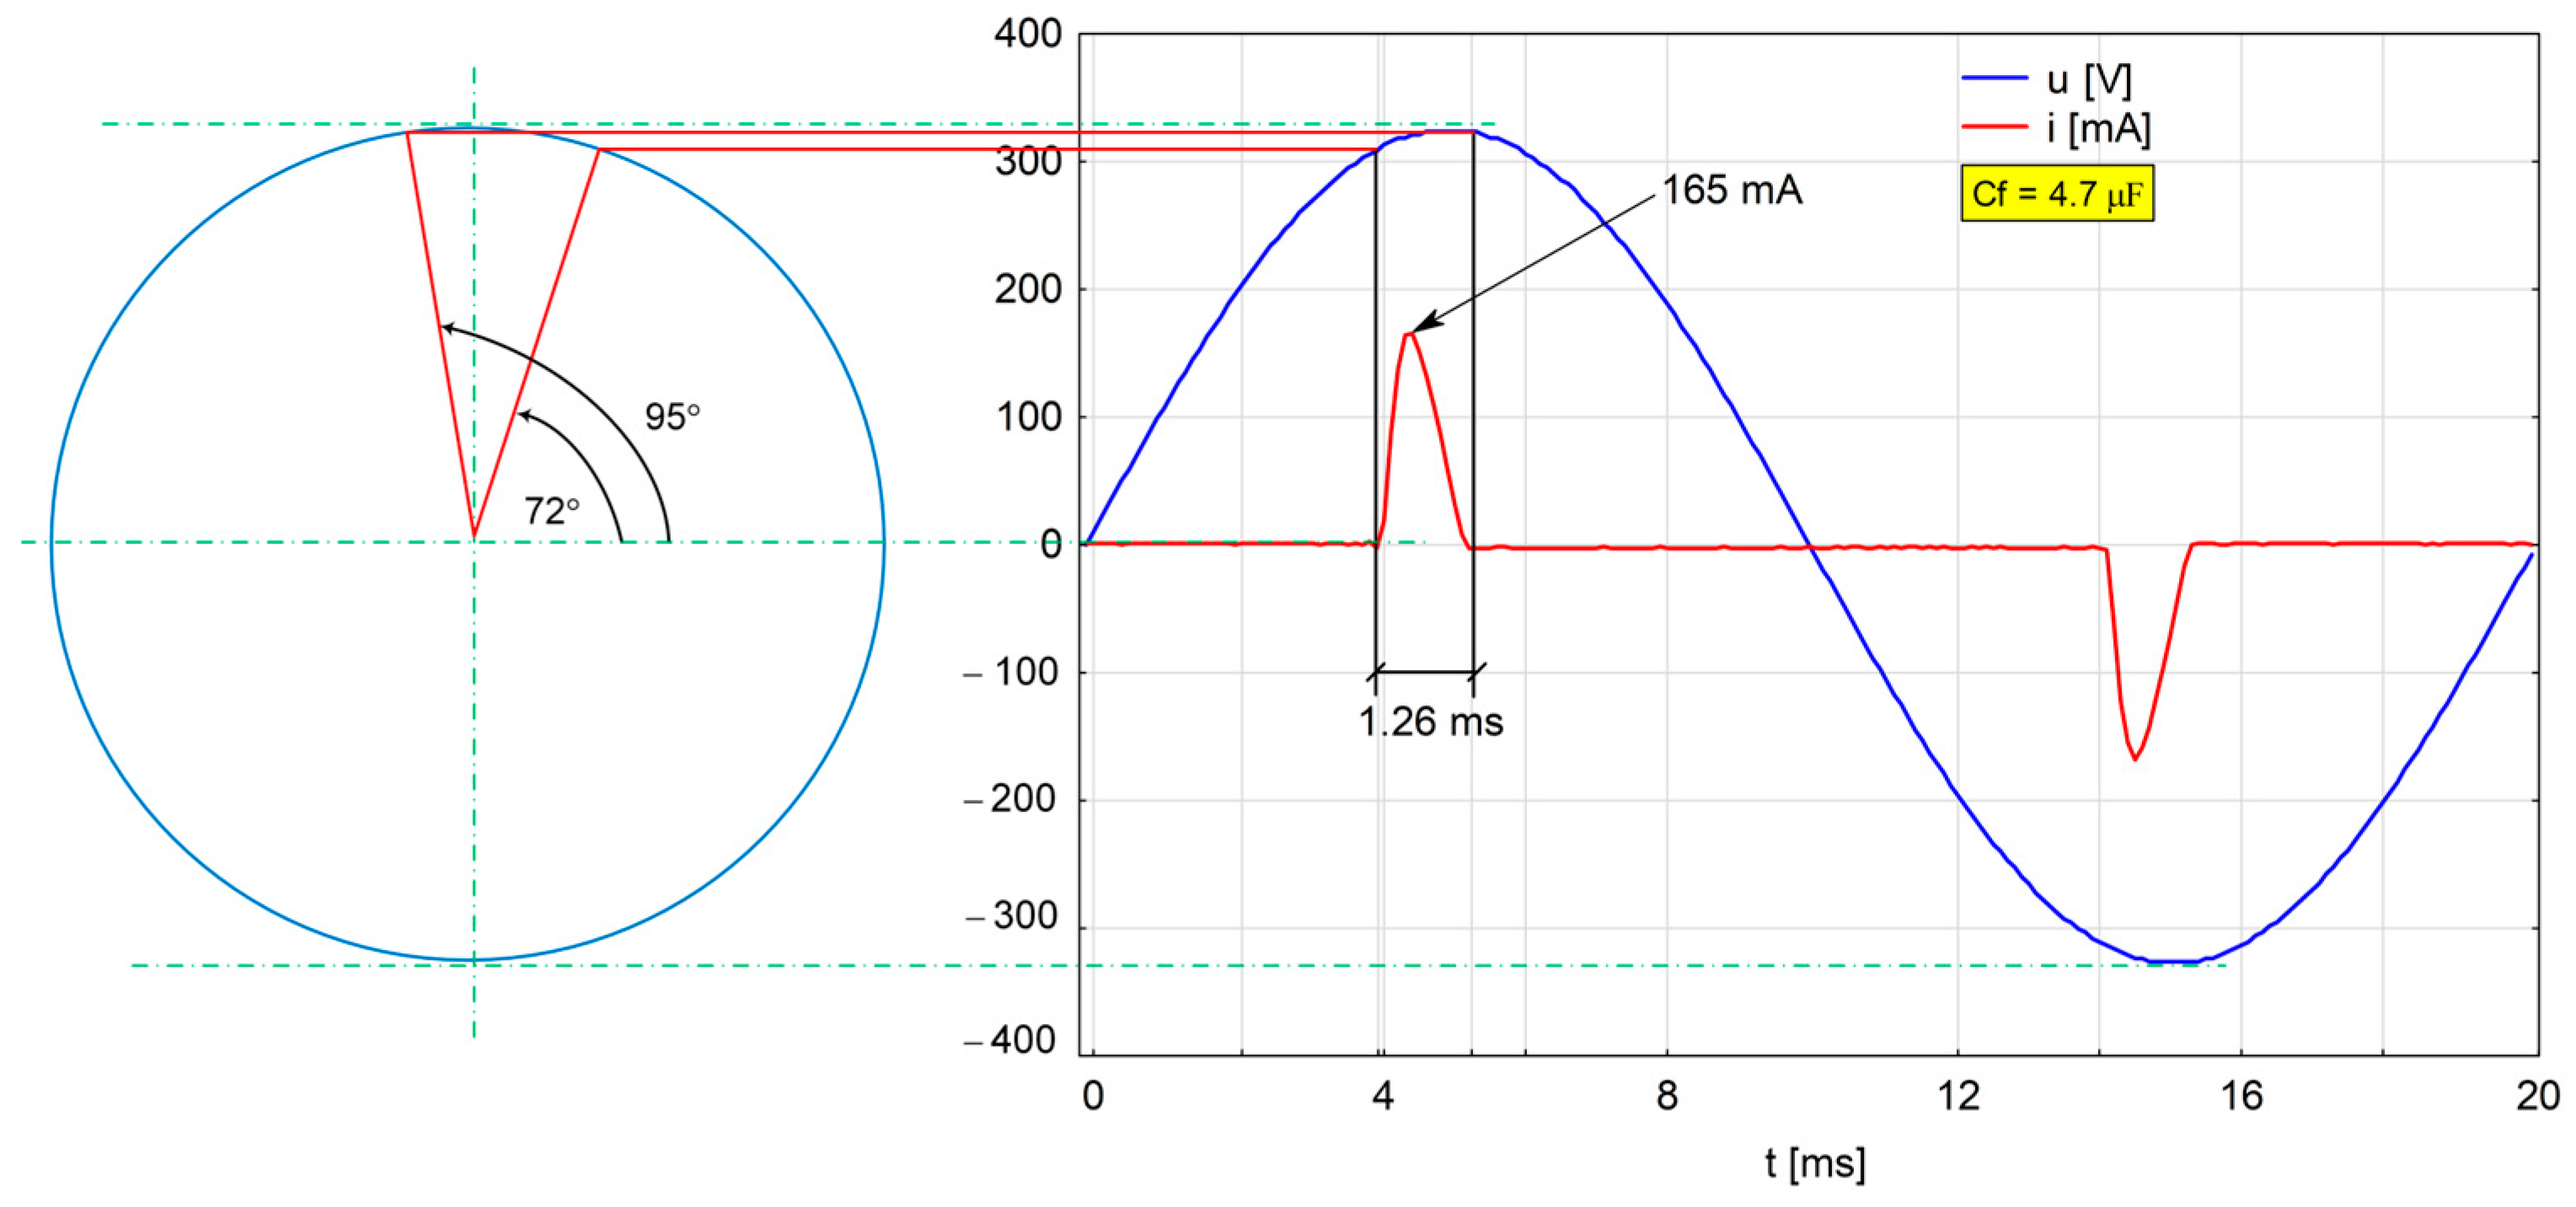
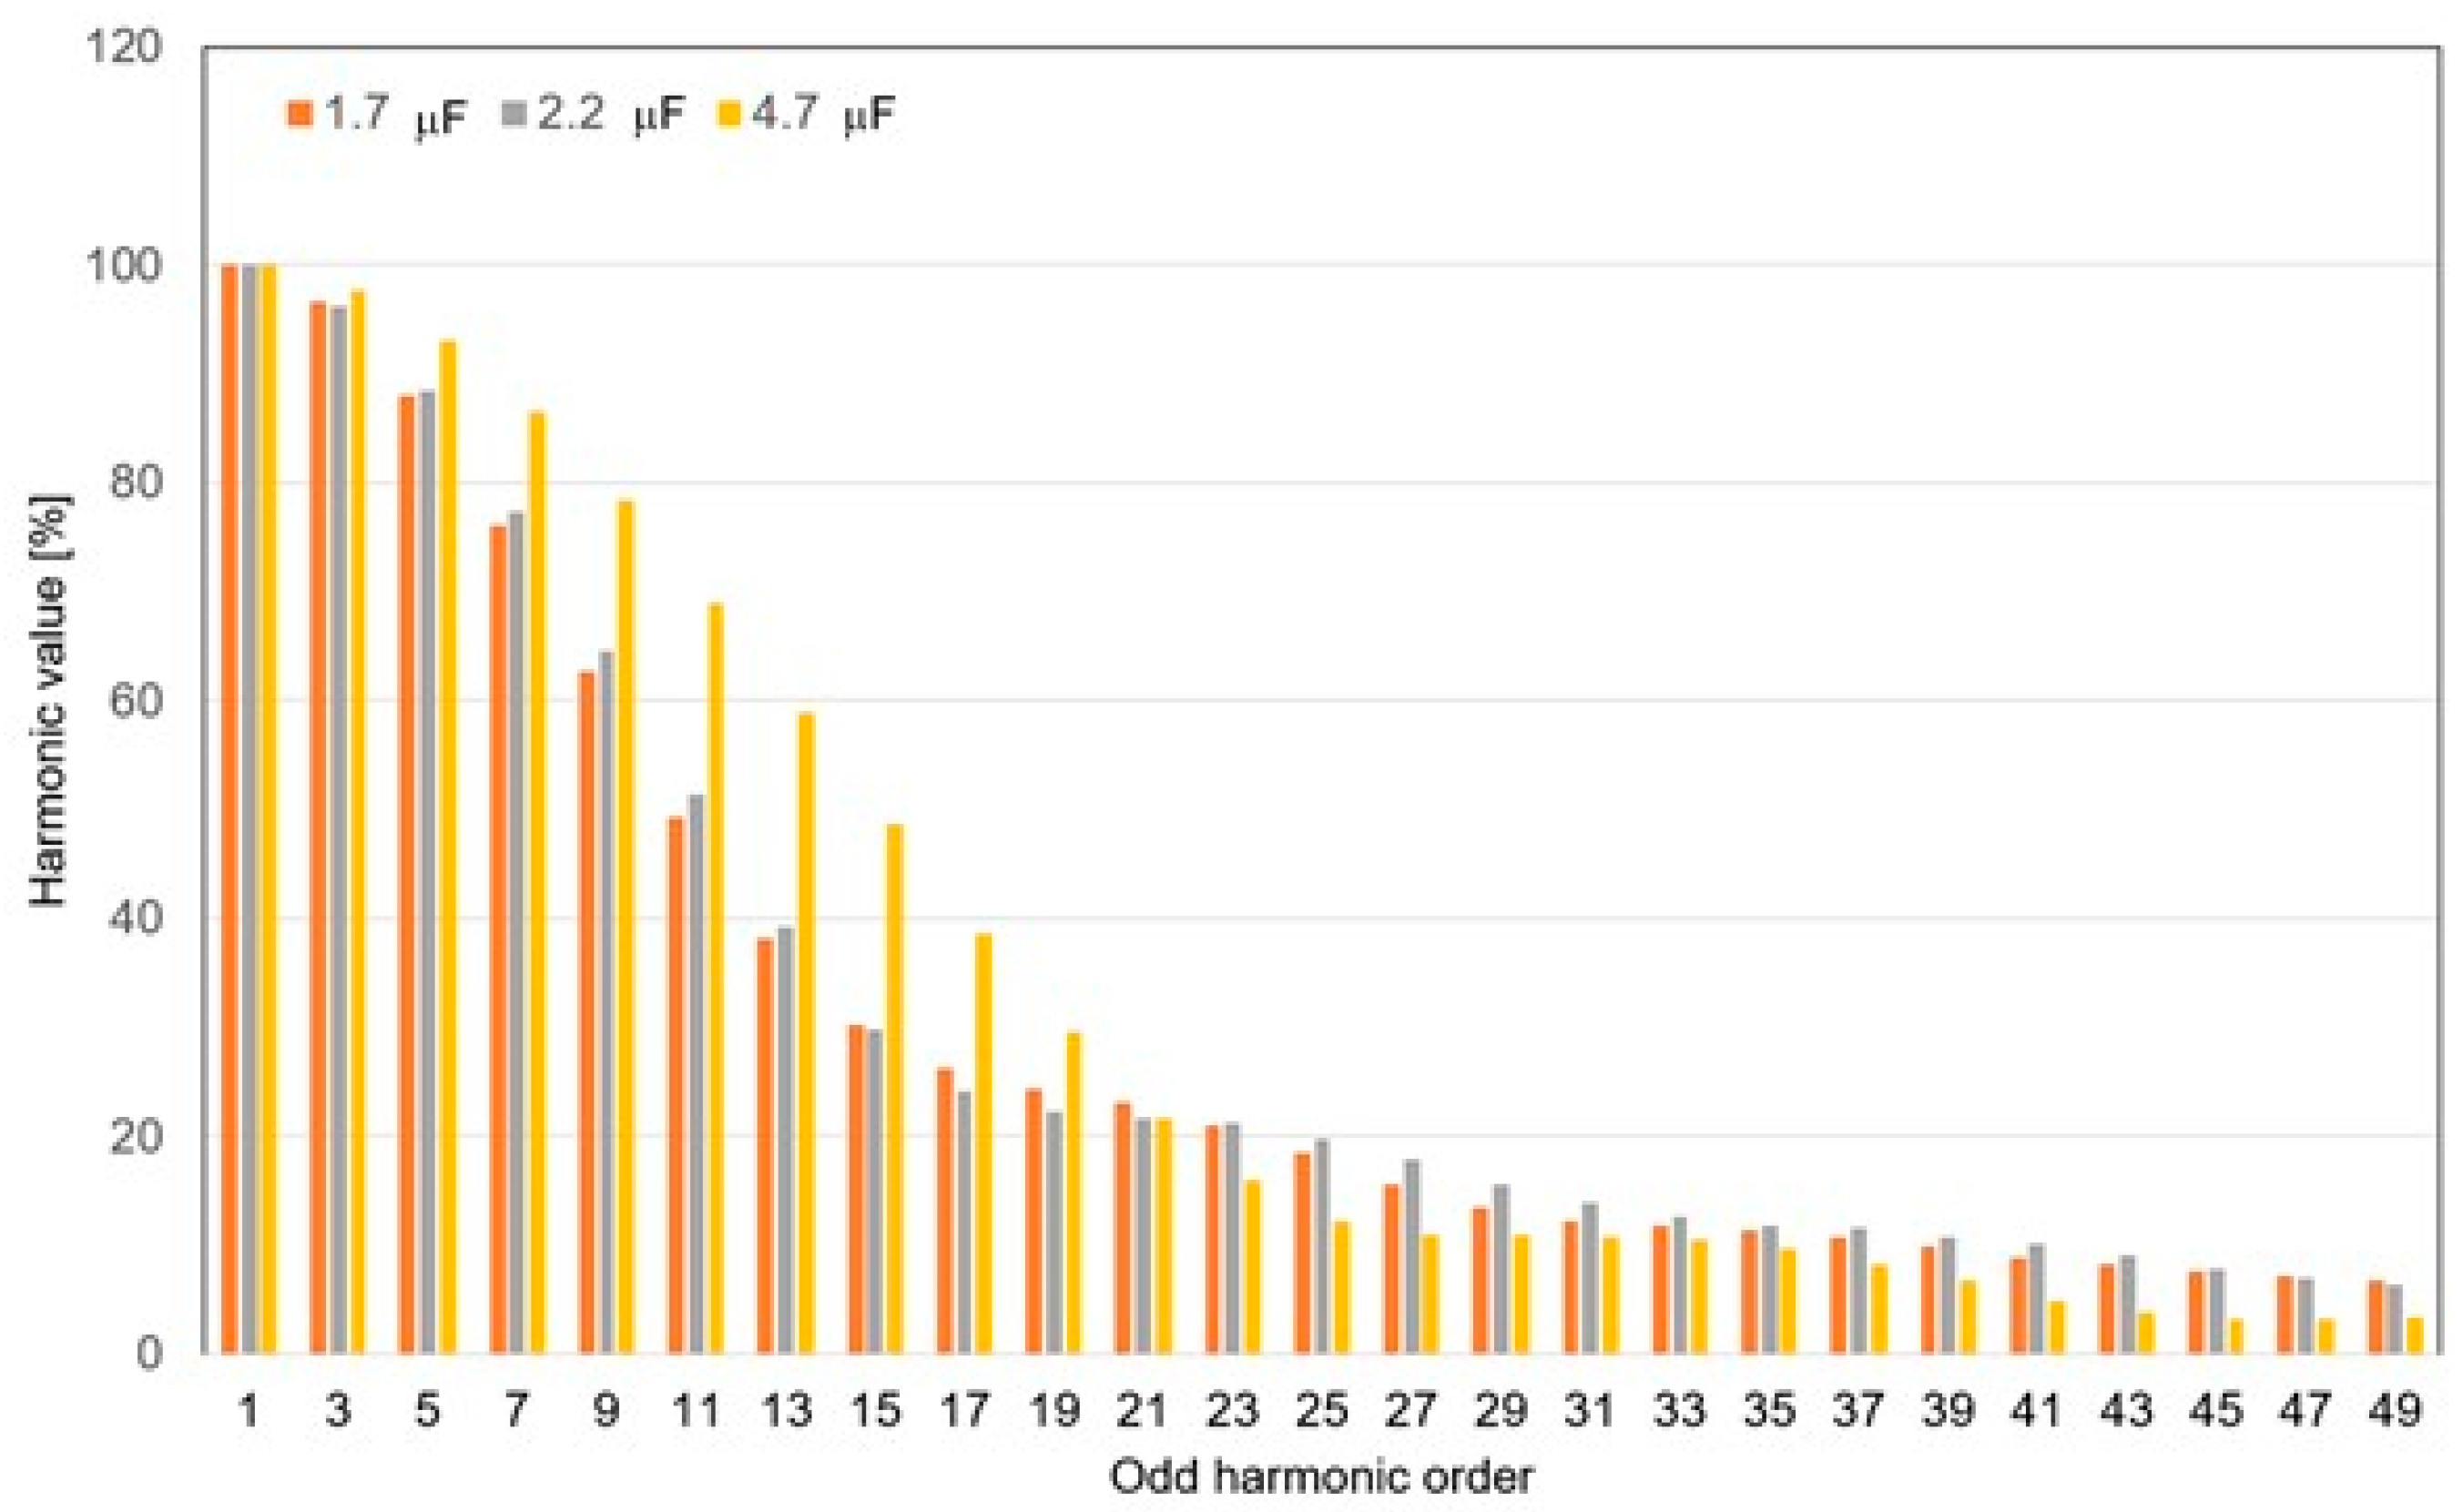
3.3.4. The Effect of Changes in the Value of the Filter Capacitor in the Power Supply
4. Conclusions
Author Contributions
Funding
Data Availability Statement
Conflicts of Interest
References
- Sabat, W.; Klepacki, D.; Kamuda, K.; Kuryło, K. Analysis of LED Lamps’ Sensitivity to Surge Impulse. Electronics 2022, 11, 1140. [Google Scholar] [CrossRef]
- Sabat, W.; Klepacki, D.; Kuryło, K.; Kamuda, K. Analysis of propagation process of conductive electromagnetic disturbances in AC/DC low power converter. In Proceedings of the 21st European Microelectronics and Packaging Conference (EMPC) & Exhibition, Warsaw, Poland, 10–13 September 2017; pp. 1–5. [Google Scholar] [CrossRef]
- Sabat, W.; Klepacki, D.; Kurylo, K.; Kamuda, K. Mathematical Model of the Susceptibility of an Electronic Element to a Standardized Type of Electromagnetic Disturbance. Energies 2023, 16, 7022. [Google Scholar] [CrossRef]
- Kuryło, K.; Sabat, W.; Klepacki, D.; Kamuda, K. Comparison of Two Measurement Methods for the Emission of Radiated Disturbances Generated by LED Drivers. Energies 2022, 15, 9372. [Google Scholar] [CrossRef]
- Arias, M.; Vazquez, A.; Javier, S. An overview of the AC-DC and DC-DC converters for LED lighting applications. Automatika 2012, 53, 156–172. [Google Scholar] [CrossRef]
- Dolara, A.; Leva, S. Power Quality and Harmonic Analysis of End User Devices. Energies 2012, 5, 5453–5466. [Google Scholar] [CrossRef]
- Bednarek, K.; Kasprzyk, L. Suppression of higher harmonic components introduction to the networks and improvement of the conditions of electric supply of electrical equipment. Electr. Eng. Rev. 2012, 88, 236–239. [Google Scholar]
- Gonen, T. Electric Power Distribution System Engineering, 3rd ed.; CRC Press: Boca Raton, FL, USA, 2014. [Google Scholar]
- Das, J.C. Power System Harmonics and Passive Filter Designs, 1st ed.; Wiley-IEEE Press: Hoboken, NJ, USA, 2015. [Google Scholar]
- Hanzelka, Z. Electricity quality part 4-High harmonics of voltages and currents. Electr. Install. 2001, 12, 10–17. [Google Scholar]
- Zeghoudi, A.; Bendaoud, A.; Canale, L.; Tilmatine, A.; Slimani, H. Common Mode and Differential Mode Noise of AC/DC LED Driver. In Proceedings of the IEEE International Conference on Environment and Electrical Engineering and IEEE Industrial and Commercial Power Systems Europe (EEEIC/I&CPS Europe), Bari, Italy, 7–10 September 2021; pp. 1–6. [Google Scholar] [CrossRef]
- Zeghoudi, A.; Bendaoud, A.; Halima, S.; Benazza, B.; Houcine, M.; Canale, L. Power Impact and Electromagnetic Disturbances of different Lighting modes from Spot LED Lamp. Optik 2022, 269, 169898. [Google Scholar] [CrossRef]
- Bollen, M.H.J.; Rönnberg, S.K.; Larsson, E.O.A.; Wahlberg, M.; Lundmark, C.M. Harmonic emissions from installations with energy-efficient lighting. In Proceedings of the 11th International Conference on Electrical Power Quality and Utilization, Lisbon, Portugal, 17–19 October 2011; pp. 1–6. [Google Scholar] [CrossRef]
- Kus, V.; Pikous, J. The effects of connecting high amounts of nonlinear appliances to the supply network. In Proceedings of the 5th IEEE International Conference on Power Engineering, Energy and Electrical Drives (POWERENG), Riga, Latvia, 11–13 May 2015; pp. 201–206. [Google Scholar] [CrossRef]
- Putz, Ł.; Bednarek, K.; Nawrowski, R. Disturbances Generated by Lighting Systems with LED Lamps and the Reduction in Their Impacts. Appl. Sci. 2019, 9, 4894. [Google Scholar] [CrossRef]
- Pop, F.; Munteanu, C.; Răcăşan, A.; Păcurar, C.; Pruşu, S.; Mihai, G. Evaluation of conducted disturbances from LED lamps according to EN 55015. In Proceedings of the International Conference on Communications (COMM), Bucharest, Romania, 9–10 June 2016; pp. 509–512. [Google Scholar] [CrossRef]
- Karim, F.A.; Ramdhani, M.; Kurniawan, E. Low pass filter installation for reducing harmonic current emissions from LED lamps based on EMC standard. In Proceedings of the International Conference on Control, Electronics, Renewable Energy and Communications (ICCEREC), Bandung, Indonesia, 13–15 September 2016; pp. 132–135. [Google Scholar] [CrossRef]
- Barwar, M.K.; Sahu, L.K.; Bhatnagar, P. Reliability Analysis of PFC Multilevel Rectifier Based LED Driver Circuit. In Proceedings of the Second International Conference on Power, Control and Computing Technologies (ICPC2T), Raipur, India, 1–3 March 2022; pp. 1–5. [Google Scholar] [CrossRef]
- Kotny, J.L.; Duquesne, T.; Idir, N. EMI Filter design using high frequency models of the passive components. In Proceedings of the IEEE 15th Workshop on Signal Propagation on Interconnects (SPI), Naples, Italy, 8–11 May 2011; pp. 143–146. [Google Scholar] [CrossRef]
- Wantuch, A.; Olesiak, M. Effect of LED Lighting on Selected Quality Parameters of Electricity. Sensors 2023, 23, 1582. [Google Scholar] [CrossRef] [PubMed]
- Michalec, Ł.; Jasiński, M.; Sikorski, T.; Leonowicz, Z.; Jasiński, Ł.; Suresh, V. Impact of Harmonic Currents of Nonlinear Loads on Power Quality of a Low Voltage Network–Review and Case Study. Energies 2021, 14, 3665. [Google Scholar] [CrossRef]
- Key, T.S.; Lai, J.-S. Costs and benefits of harmonic current reduction for switch-mode power supplies in a commercial office building. IEEE Trans. Ind. Appl. 1996, 32, 1017–1025. [Google Scholar] [CrossRef]
- Arrillaga, J.; Watson, N.R. Power System Harmonics, 2nd ed.; John Wiley &Sons: Hoboken, NJ, USA, 2004. [Google Scholar]
- O’Connell, K. Heating Effects through Harmonic Distortion on Electric Cables in the Built Environment. Ph.D. Thesis, Dublin Institute of Technology, Dublin, Ireland, 23 July 2013. Available online: https://arrow.tudublin.ie/cgi/viewcontent.cgi?article=1058&context=engdoc (accessed on 15 July 2023).
- Modernization of Lighting at the Best Western Old Town Hotel in Krakow. Available online: https://greenie-world.com/en/implementations/22245/ (accessed on 22 July 2023).
- The Rapid Transition to Energy Efficient Lighting: An Integrated Policy Approach. Available online: https://www.unep.org/resources/report/rapid-transition-energy-efficient-lighting-integrated-policy-approach (accessed on 15 July 2023).
- Abdalaal, R.M.; Man Ho, C.N. Characterization of Commercial LED Lamps for Power Quality Studies. IEEE Can. J. Electr. Comput. Eng. 2021, 44, 94–104. [Google Scholar] [CrossRef]
- Sakar, S.; Rönnberg, S. Interferences in AC-DC LED drivers due to Harmonic Voltage Emission. In Proceedings of the CIRED 2021—The 26th International Conference and Exhibition on Electricity Distribution, Online Conference, Geneva, Switzerland, 20–23 September 2021; pp. 860–864. [Google Scholar] [CrossRef]
- Chęciński, J.; Filus, Z. Analysis of supply parameters of single- and double-string LED lamps with integrated AC direct capacitorless drivers. Bull. Pol. Acad. Sci. Tech. Sci. 2020, 68, 819–827. [Google Scholar] [CrossRef]
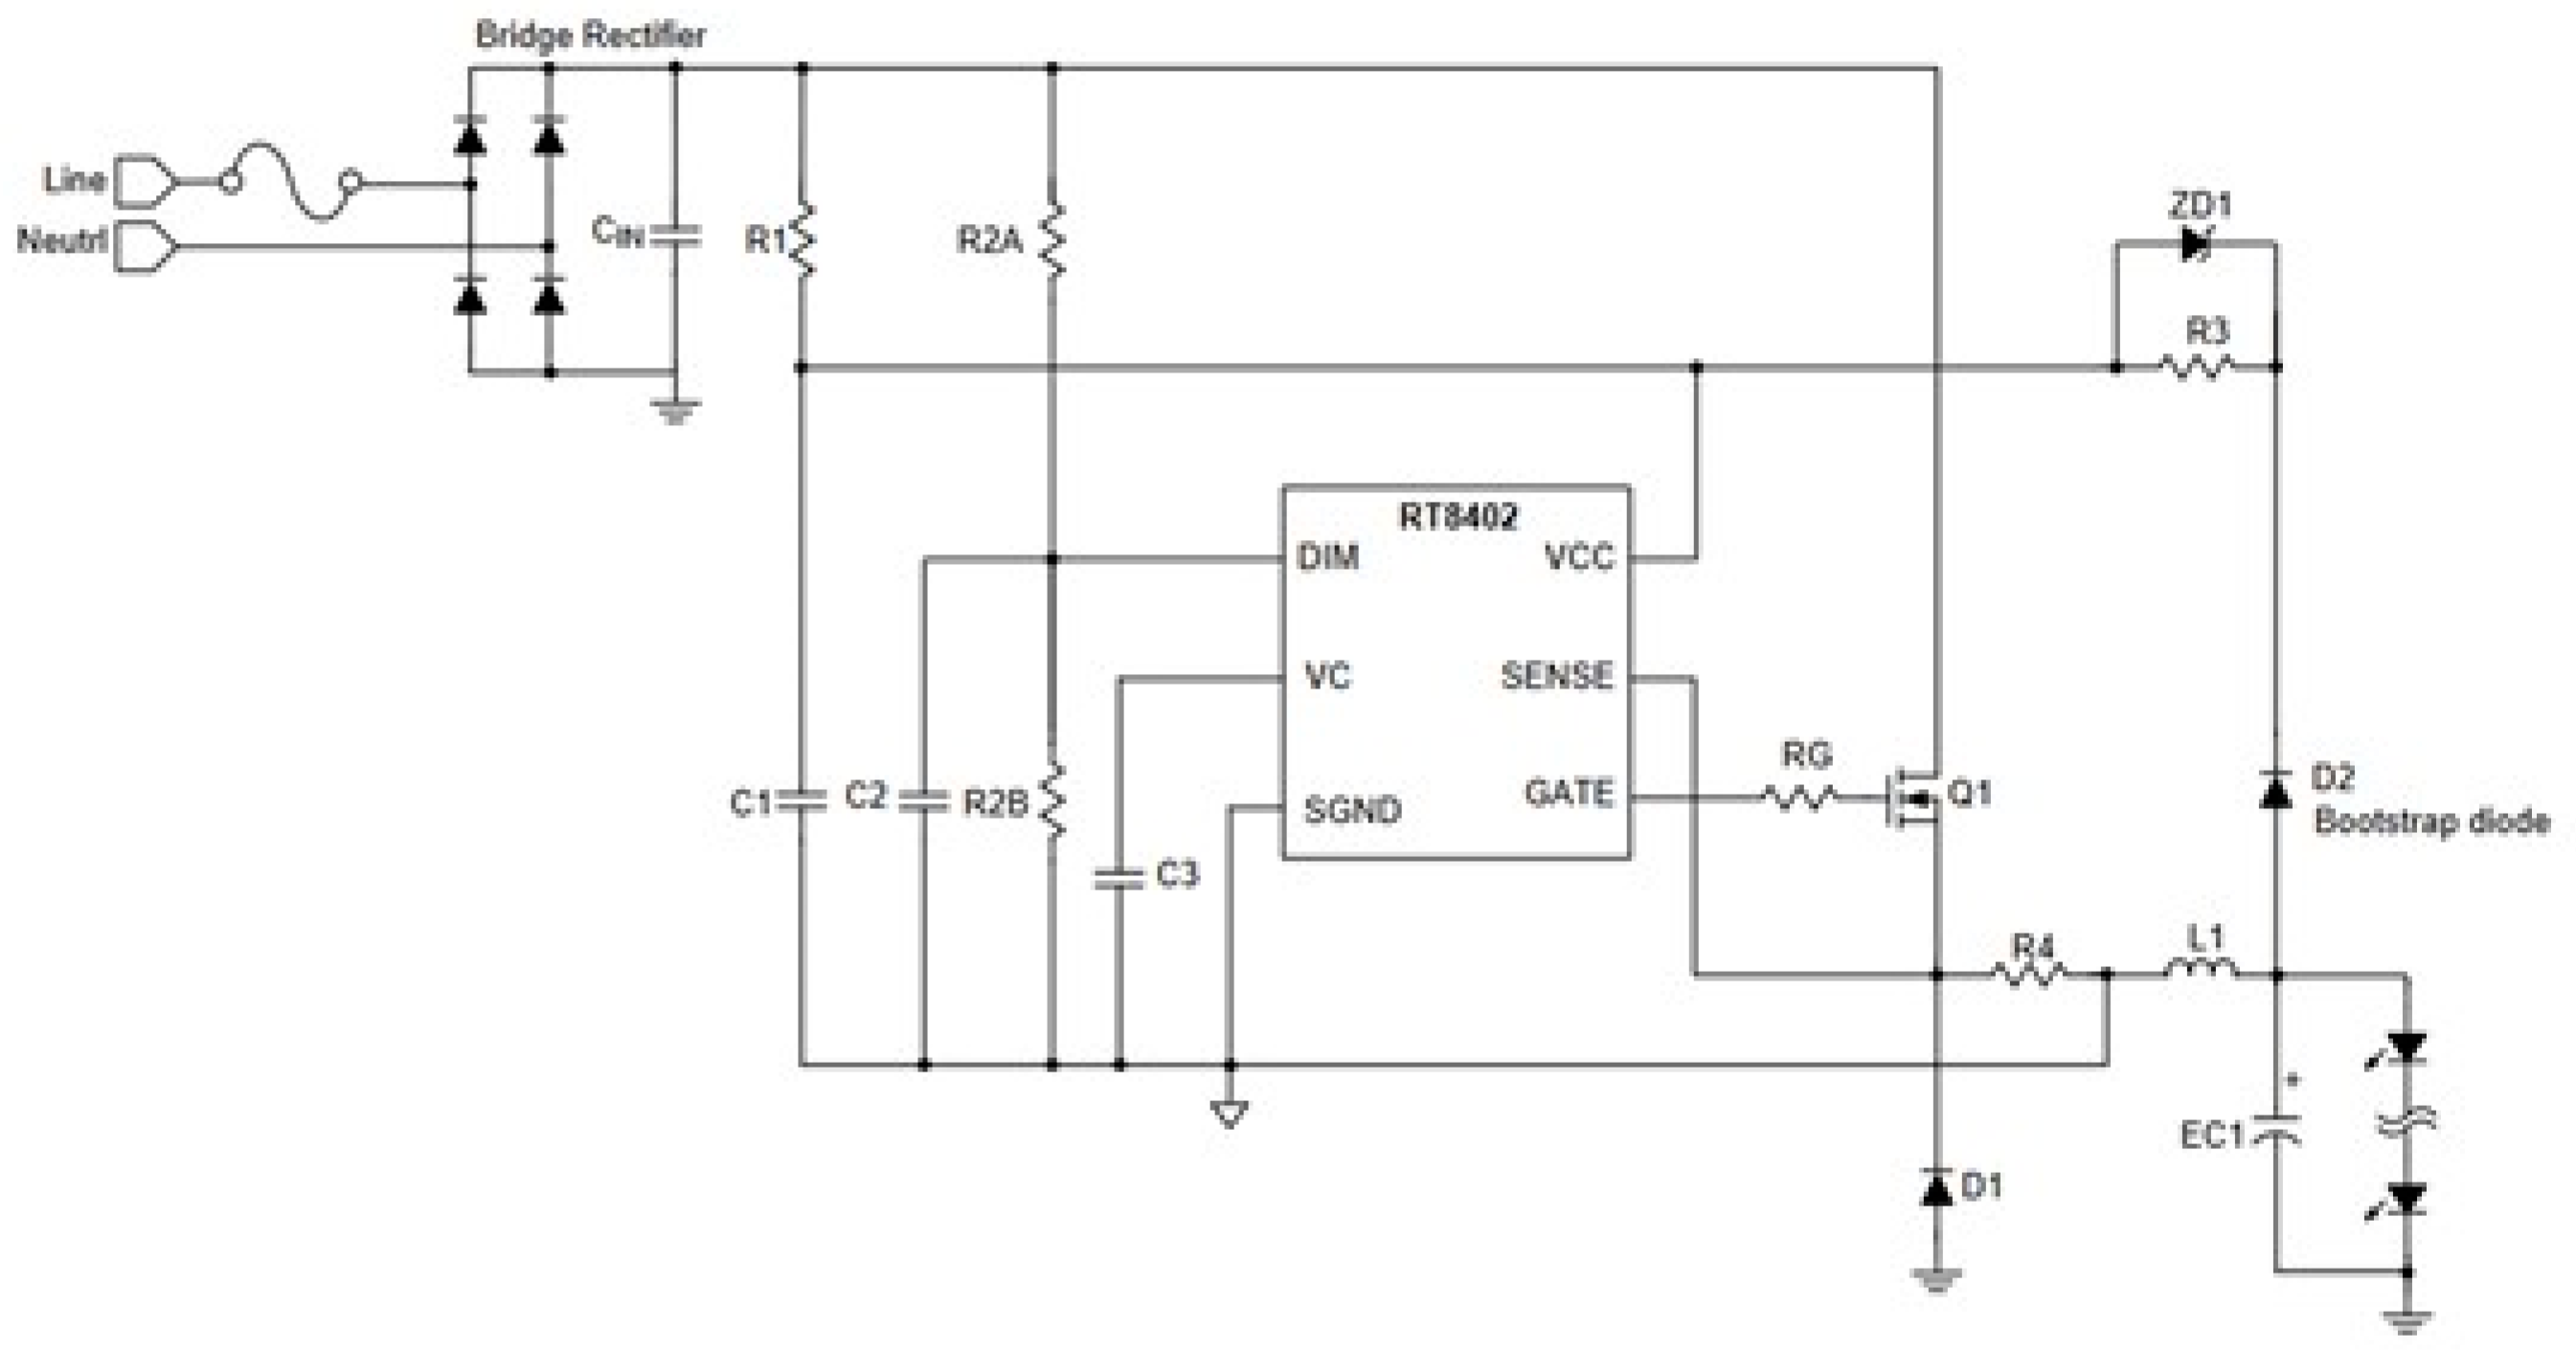
- Phase-Cut Dimmable High Side Buck LED Driver with High Power Factor. Available online: https://pdf1.alldatasheet.com/datasheet-pdf/view/957390/RICHTEK/RT8402.html (accessed on 15 July 2023).
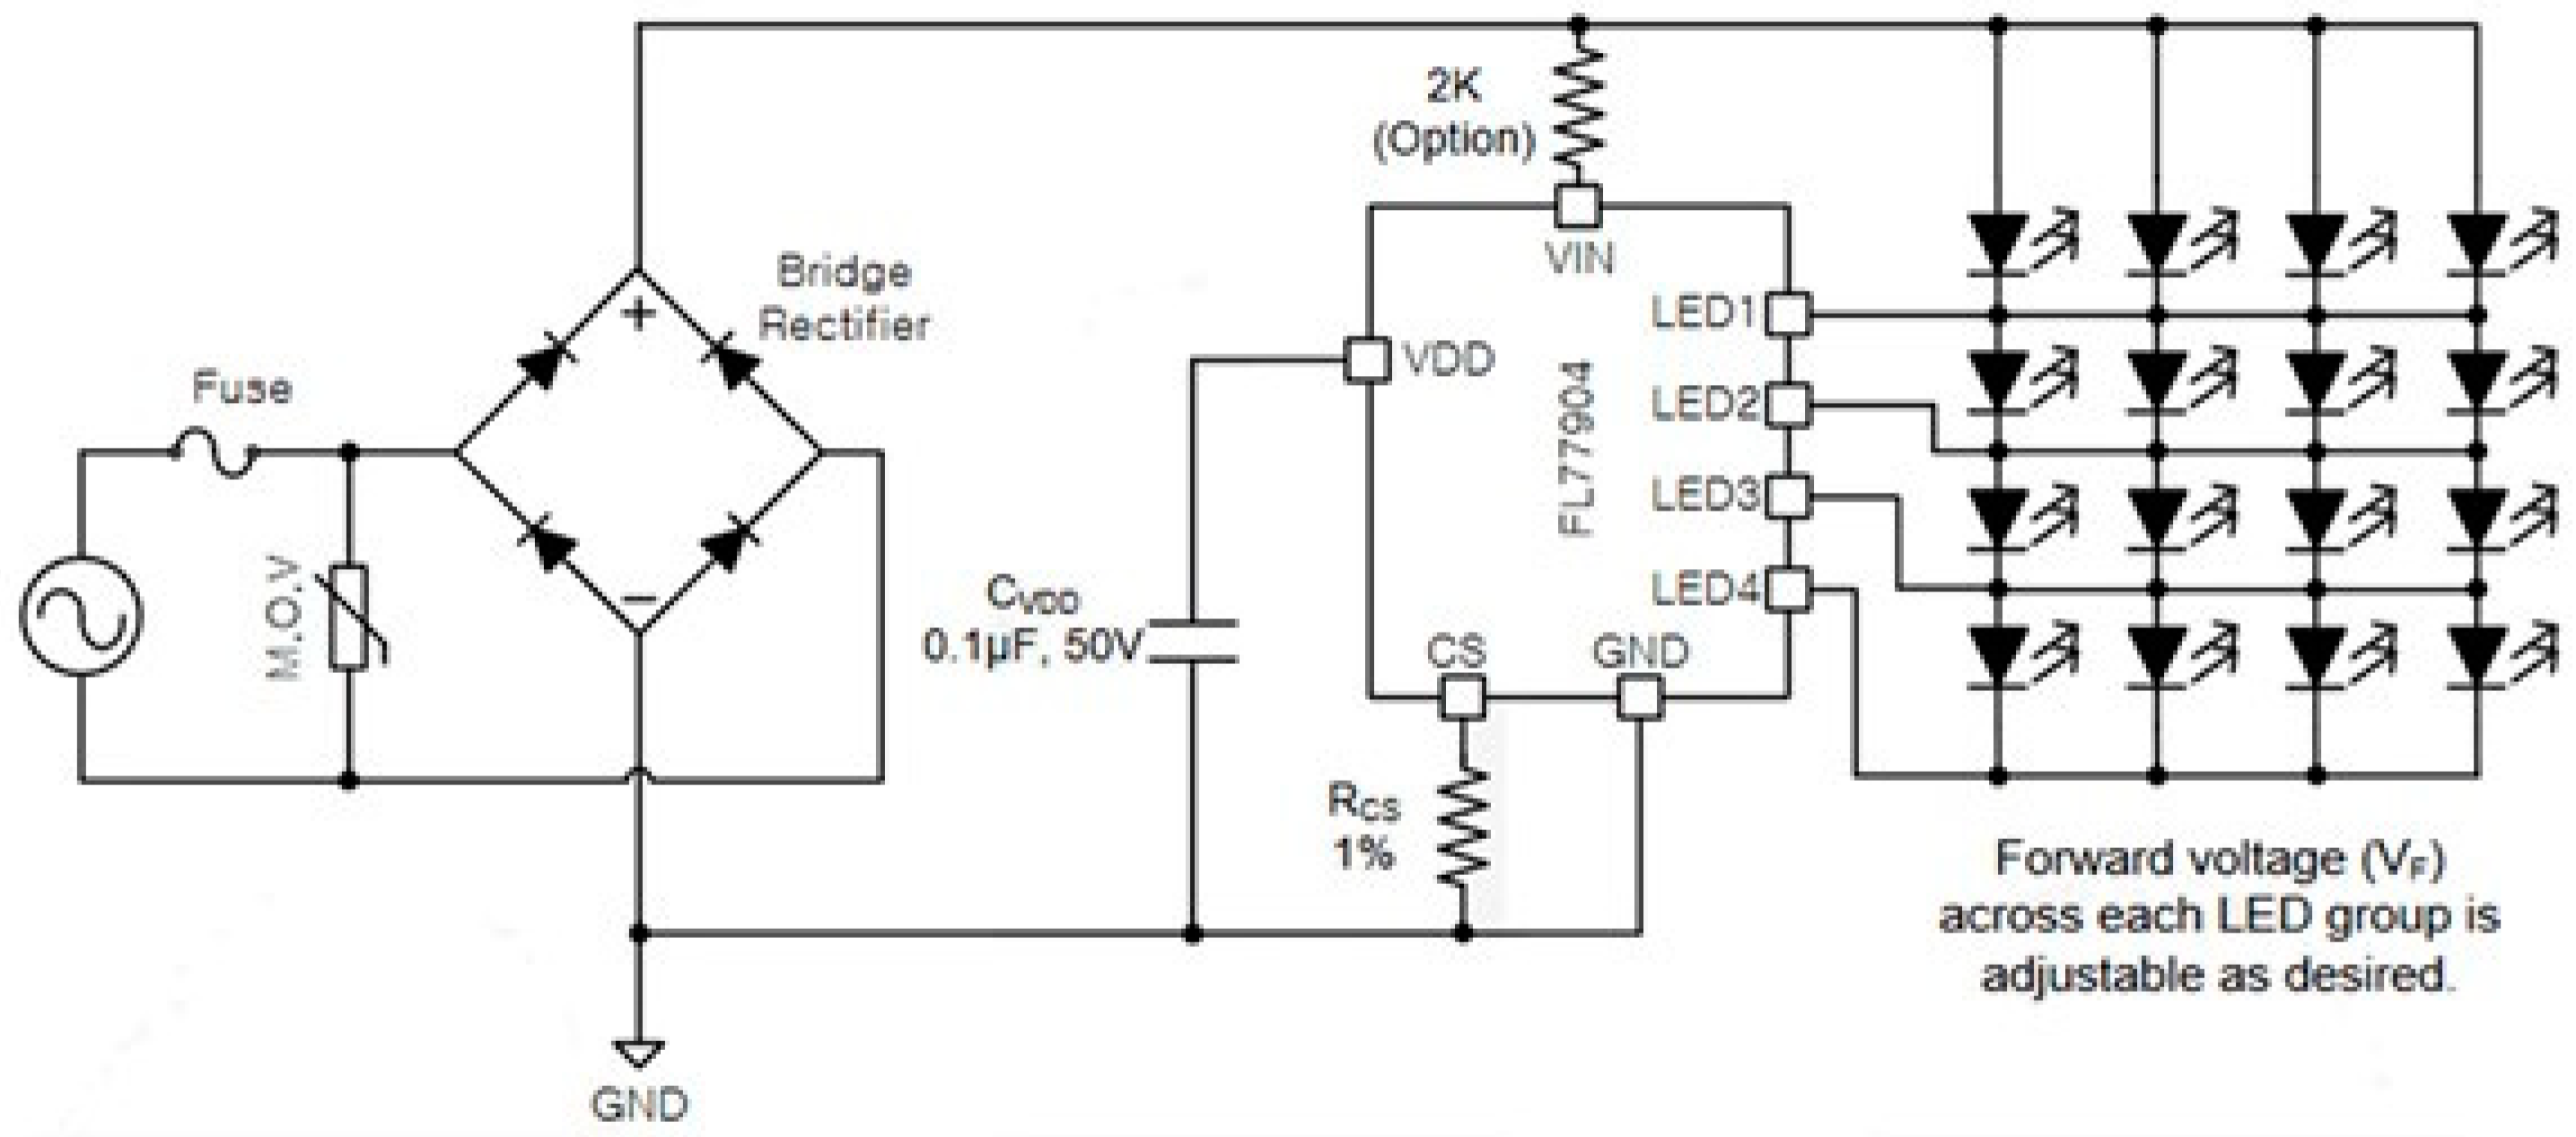
- FL77904 Phase-Cut Dimmable Compact LED Direct AC Driver. Available online: https://www.onsemi.com/download/data-sheet/pdf/fl77904-d.pdf (accessed on 15 July 2023).
- Molina, J.; Mesas, J.; Mesbahi, N.; Sainz, L. LED Lamp Modelling for Harmonic Studies in Distribution Systems. IET Gener. Transm. Distrib. 2017, 11, 1063–1071. [Google Scholar] [CrossRef]
- Uddin, S.; Sharef, H.; Krause, O.; Mohamed, A.; Hannan, M.A.; Islam, N.N. Impact of large-scale installation of LED lamps in a distribution system. Turk. J. Electr. Eng. Comput. Sci. 2015, 23, 1769–1780. [Google Scholar] [CrossRef]
- Ramljak, I.; Tokic, A. Harmonic emission of LED lighting. AIMS Energy 2020, 8, 1–26. [Google Scholar] [CrossRef]
- Lamar, D.G.; Arias, M.; Fernandez, A.; Villarejo, J.A.; Sebastian, J. Active Input Current Shaper without an Electrolytic Capacitor for Retrofit Lamps Applications. IEEE Trans. Power Electron. 2017, 32, 3908–3919. [Google Scholar] [CrossRef]
- Cheng, C.-A.; Cheng, H.-L.; Chang, C.-H.; Chang, E.-C.; Kuo, Z.-Y.; Lin, C.-K.; Hou, S.-H. An AC-DC LED Integrated Streetlight Driver with Power Factor Correction and Soft-Switching Functions. Sustainability 2023, 15, 10579. [Google Scholar] [CrossRef]
- Yau, Y.-T.; Hwu, K.-I.; Liu, K.-J. AC–DC Flyback Dimmable LED Driver with Low-Frequency Current Ripple Reduced and Power Dissipation in BJT Linearly Proportional to LED Current. Energies 2020, 13, 4270. [Google Scholar] [CrossRef]
- Di Mauro, S.; Musumeci, S.; Raciti, A.; Vasta, G. Analysis of the current harmonics injected into the power grid by dimmable LED lamps. In Proceedings of the AEIT International Annual Conference (AEIT), Capri, Italy, 5–7 October 2016; pp. 1–6. [Google Scholar] [CrossRef]


| Higher Harmonics | Conducted Interference | Radiated Interference |
|---|---|---|
| 50 Hz to 2.5 kHz | 9 kHz to 150 kHz 150 kHz to 30 MHz | 30 MHz to 1 GHz |
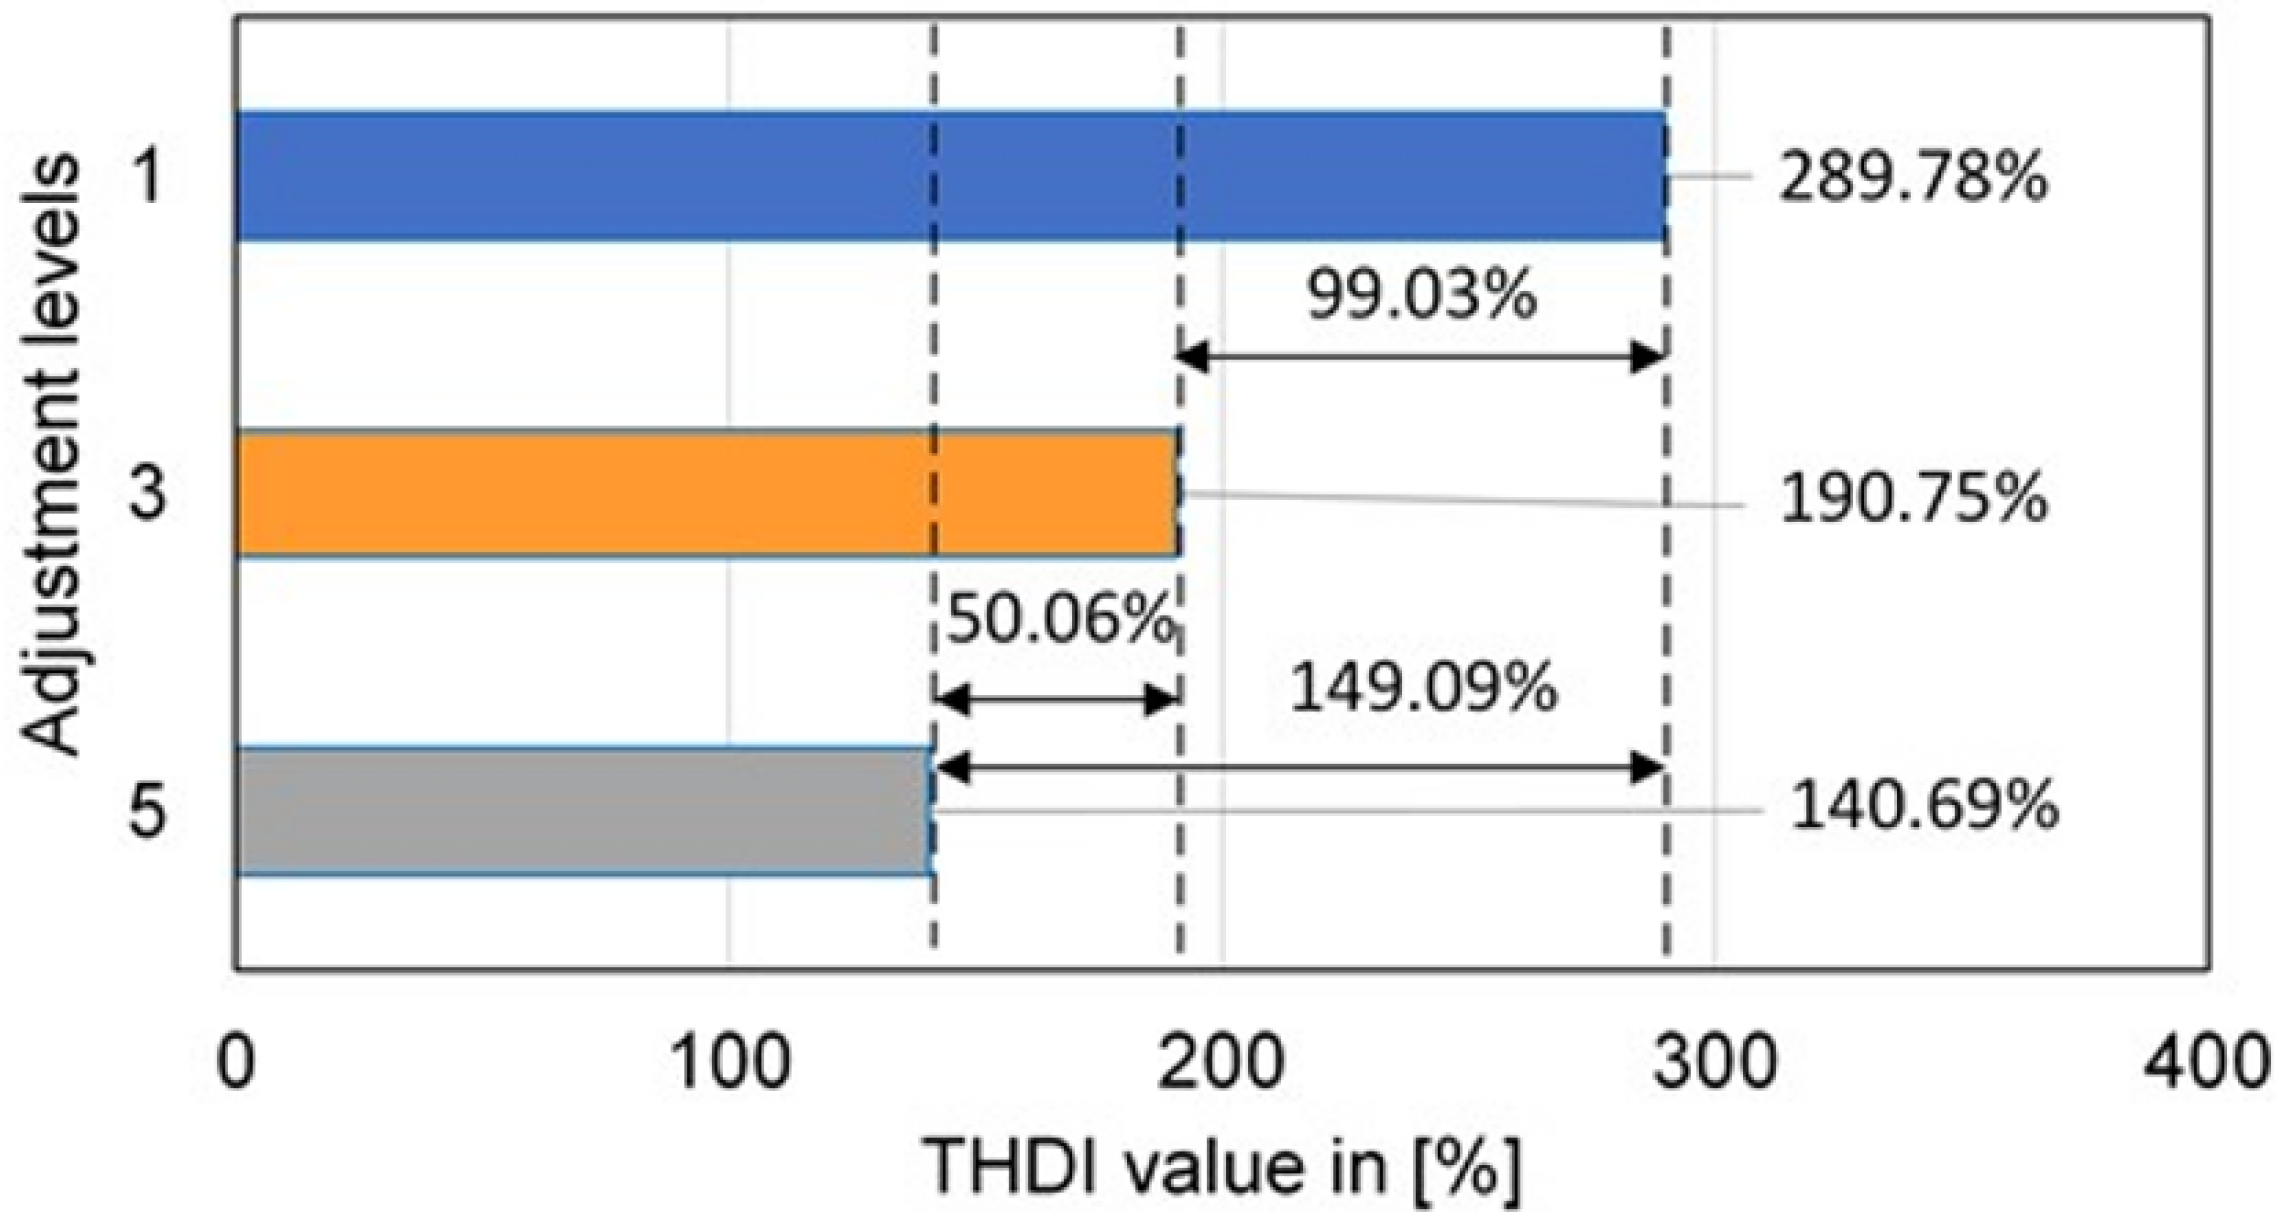
| Adjustment Levels | Analysed Parameters | |||||||
|---|---|---|---|---|---|---|---|---|
| Odd Harmonic Current Value [%] | THDI [%] | i [mA] | t [ms] | |||||
| 3 | 5 | 7 | 9 | 11 | ||||
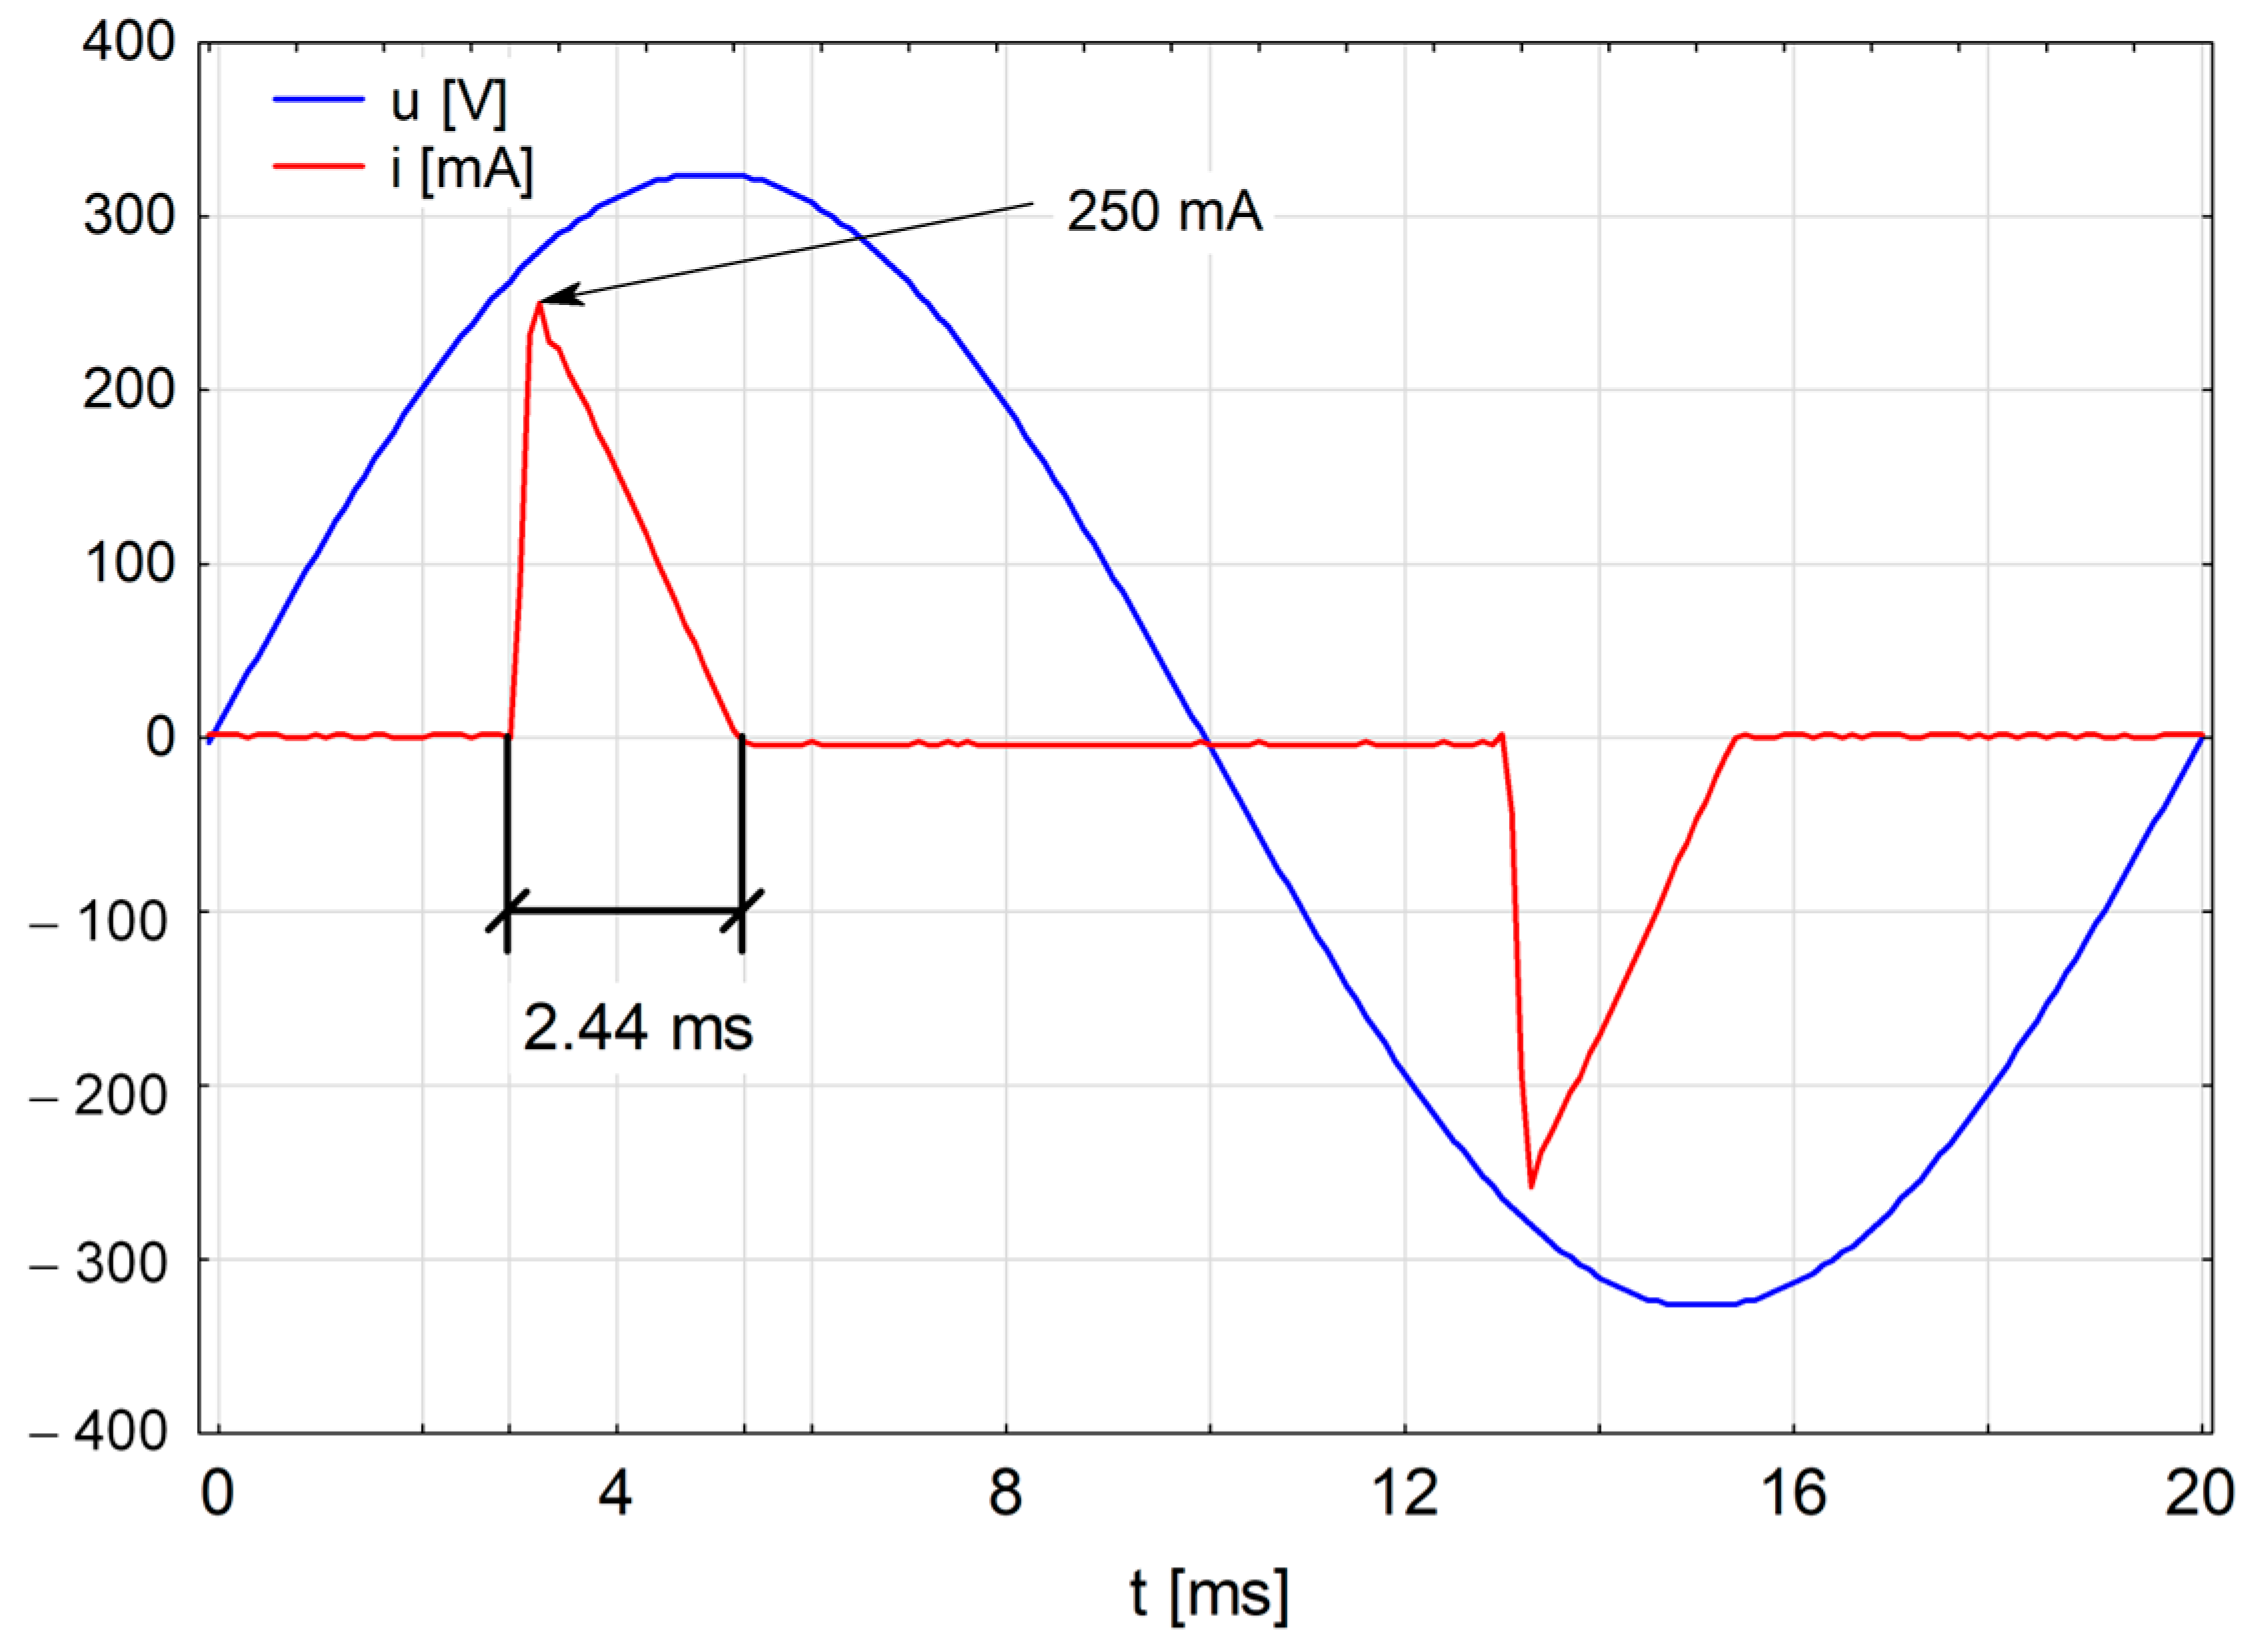
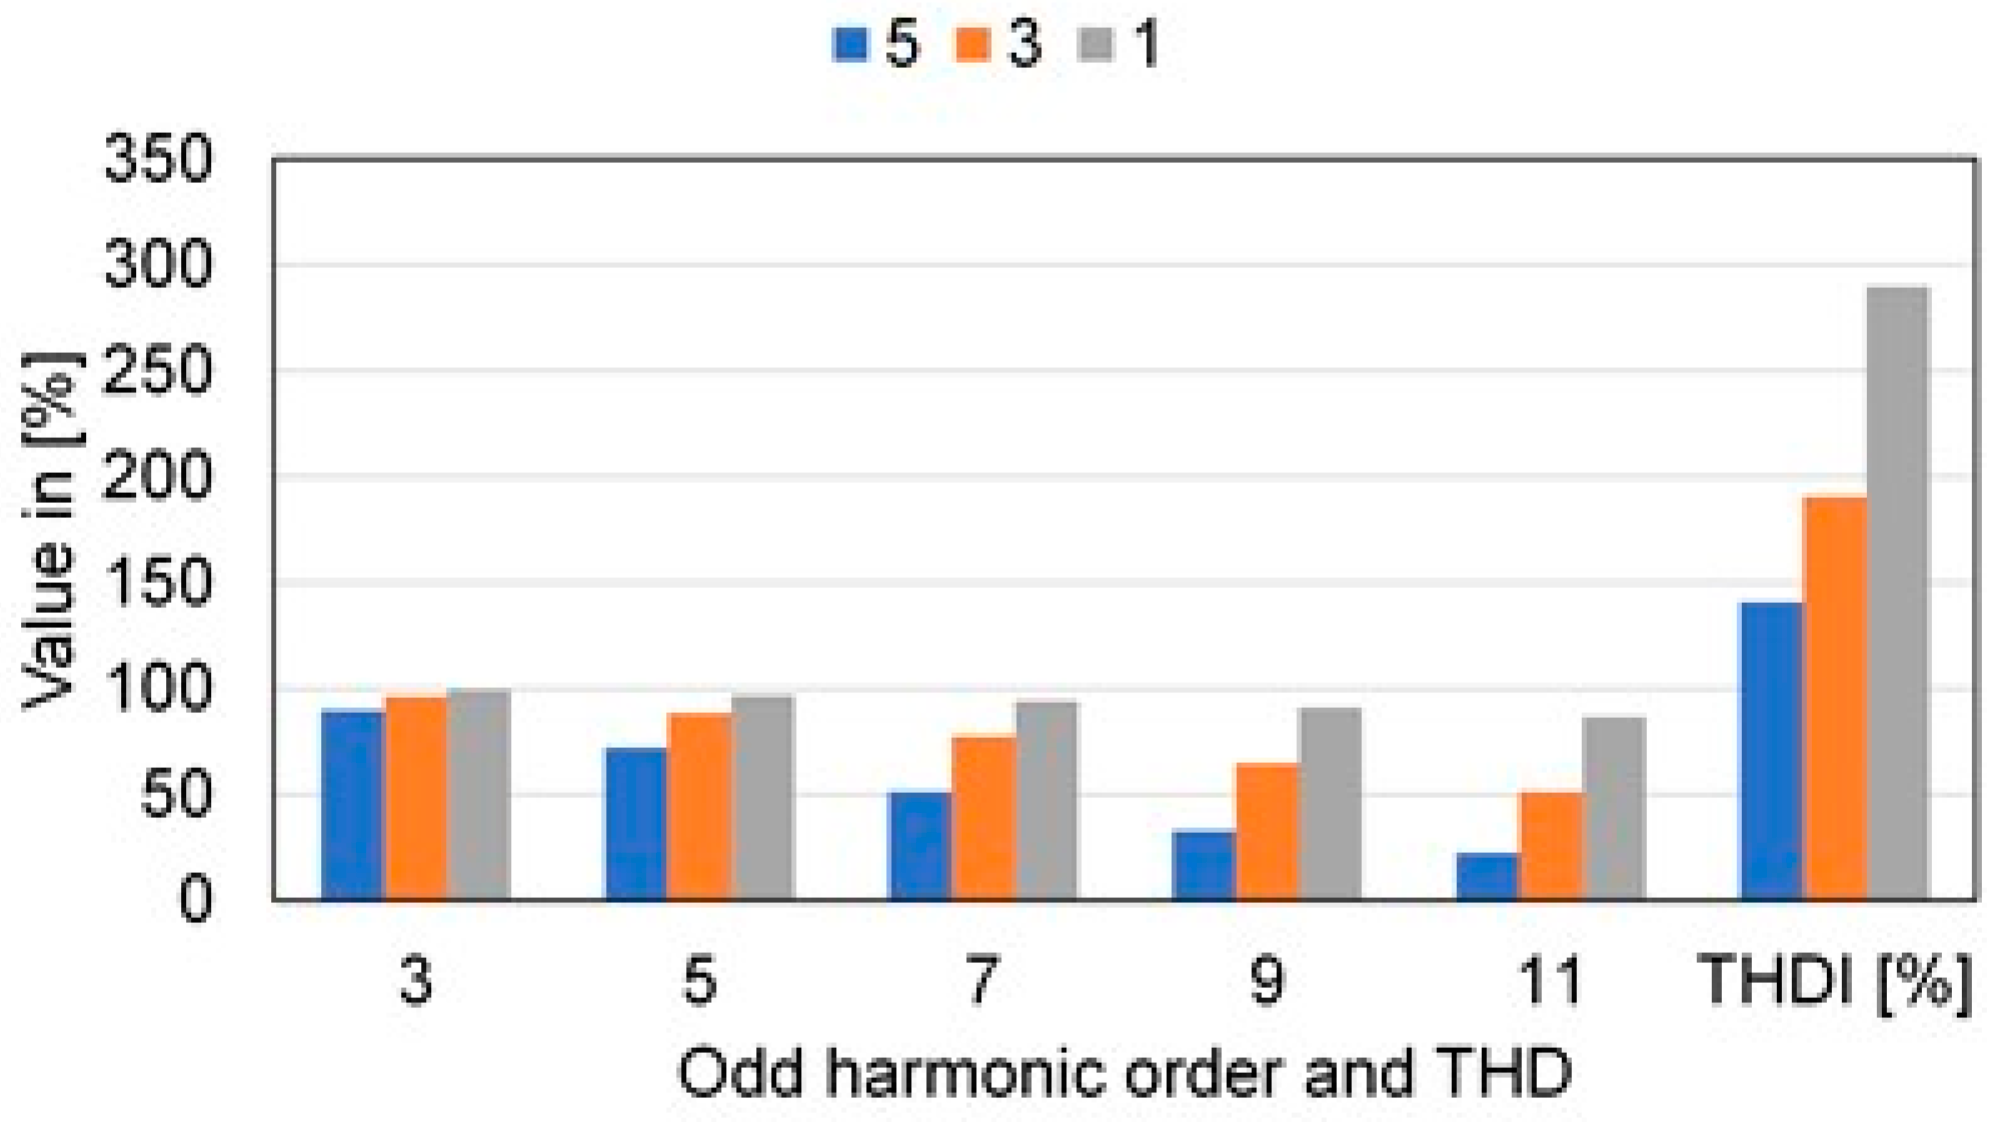
| 5 | 89.79 | 72.13 | 51.25 | 32.71 | 22.48 | 140.69 | 250.00 | 2.44 |
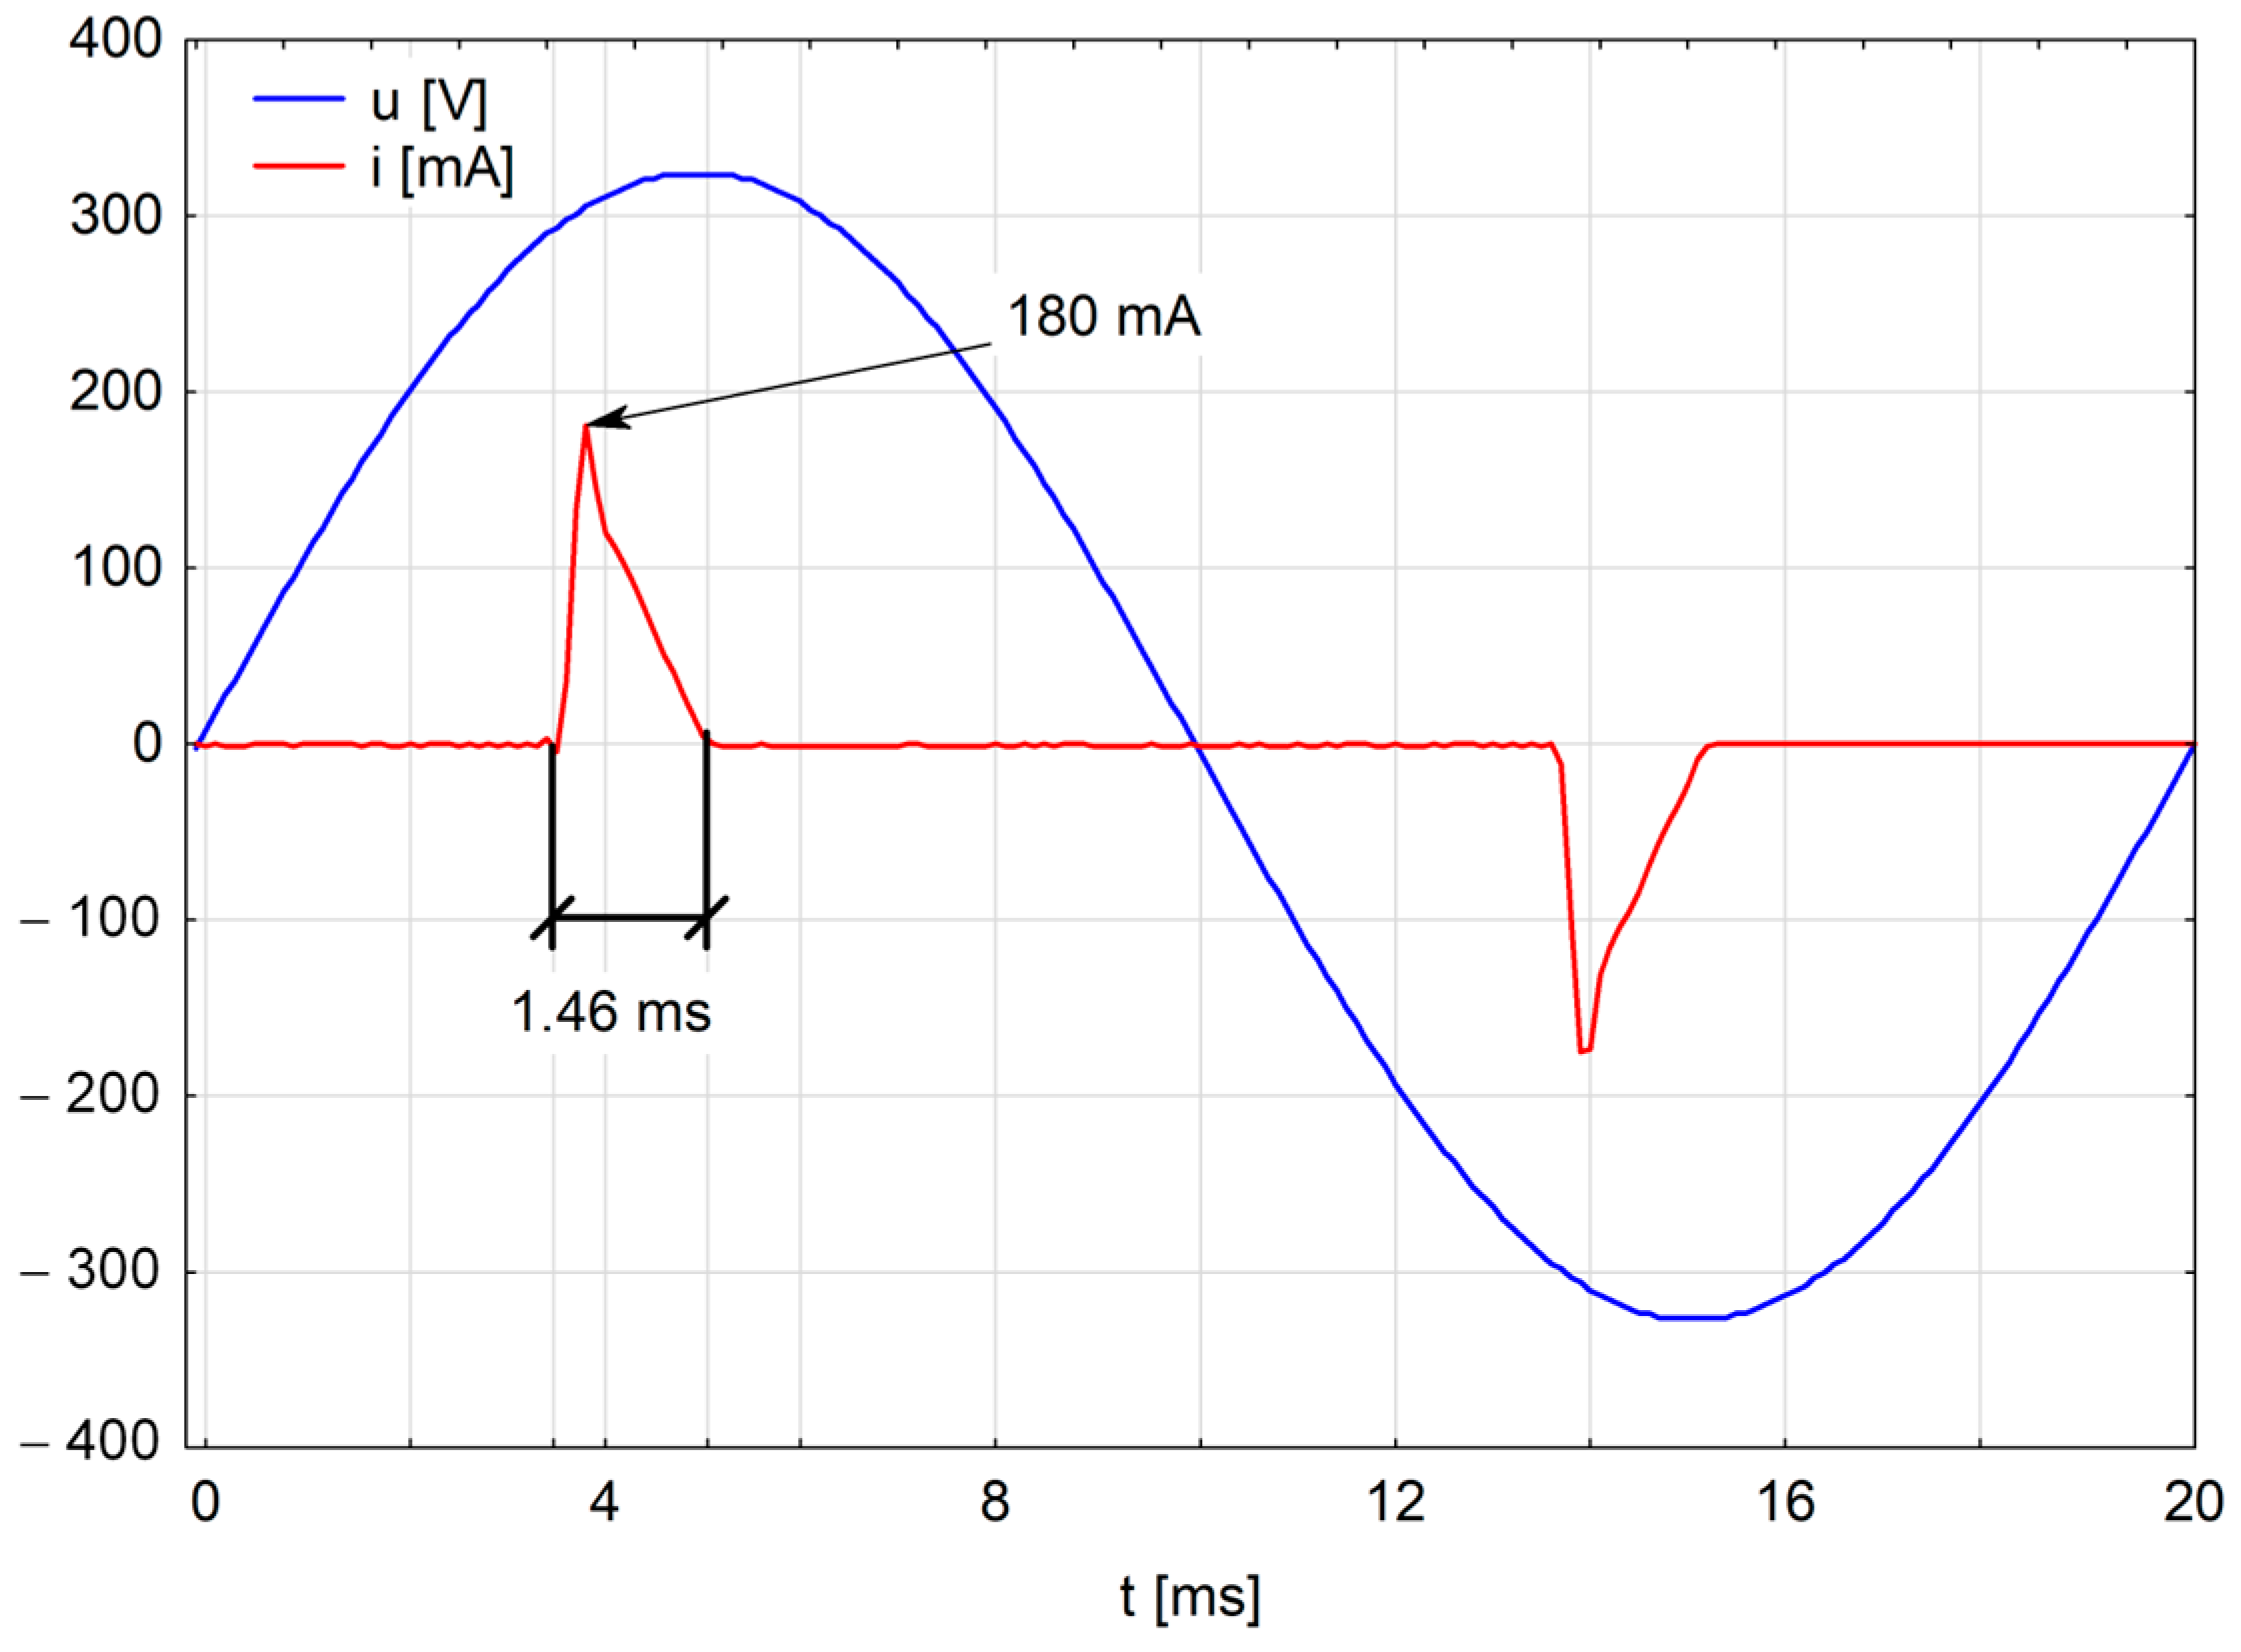
| 3 | 96.31 | 88.38 | 77.45 | 64.54 | 51.41 | 190.75 | 180.00 | 1.46 |
| 1 | 99.09 | 96.87 | 94.03 | 91.05 | 86.58 | 289.78 | 51.00 | 0.56 |
| Analysed Light Colours | Analysed Parameters | |||||||
|---|---|---|---|---|---|---|---|---|
| Odd Harmonic Current Value [%] | THDI [%] | i [mA] | t [ms] | |||||
| 3 | 5 | 7 | 9 | 11 | ||||
| R | 99.32 | 95.05 | 89.45 | 82.12 | 73.75 | 234.73 | 101.00 | 1.17 |
| G | 97.22 | 95.24 | 92.99 | 88.37 | 84.51 | 272.85 | 63.00 | 0.88 |
| B | 102.23 | 100.43 | 97.36 | 93.14 | 89.03 | 297.94 | 53.00 | 0.87 |
| Point | Analysed Parameters | ||||||||
|---|---|---|---|---|---|---|---|---|---|
| Odd Harmonic Current Value [%] | THDI [%] | RMS I [mA] | |||||||
| 3 | 5 | 7 | 9 | 11 | 13 | 15 | |||
| A | 97.37 | 91.25 | 83.43 | 73.55 | 63.01 | 51.68 | 41.01 | 209.03 | 26.00 |
| B | 99.57 | 97.92 | 94.24 | 90.13 | 84.99 | 80.05 | 73.63 | 275.32 | 11.00 |
| Capacitor Value | Analysed Parameters | |||||||
|---|---|---|---|---|---|---|---|---|
| Odd Harmonic Current Value [%] | THDI [%] | i [mA] | t [ms] | |||||
| 3 | 5 | 7 | 9 | 11 | ||||
| 1.7 μF | 96.60 | 88.03 | 76.16 | 62.64 | 49.28 | 188.65 | 148.00 | 1.76 |
| 2.2 μF | 96.31 | 88.38 | 77.45 | 64.54 | 51.41 | 190.75 | 180.00 | 1.46 |
| 4.7 μF | 97.63 | 93.08 | 86.56 | 78.35 | 68.95 | 215.46 | 165.00 | 1.26 |
Disclaimer/Publisher’s Note: The statements, opinions and data contained in all publications are solely those of the individual author(s) and contributor(s) and not of MDPI and/or the editor(s). MDPI and/or the editor(s) disclaim responsibility for any injury to people or property resulting from any ideas, methods, instructions or products referred to in the content. |
© 2024 by the authors. Licensee MDPI, Basel, Switzerland. This article is an open access article distributed under the terms and conditions of the Creative Commons Attribution (CC BY) license (https://creativecommons.org/licenses/by/4.0/).
Share and Cite
Kuryło, K.; Sabat, W.; Klepacki, D.; Kamuda, K.; Jankowski-Mihułowicz, P. Determinants of the Generation of Higher Current Harmonics in Different Operating States of the RGB LED Lamp. Electronics 2024, 13, 531. https://doi.org/10.3390/electronics13030531
Kuryło K, Sabat W, Klepacki D, Kamuda K, Jankowski-Mihułowicz P. Determinants of the Generation of Higher Current Harmonics in Different Operating States of the RGB LED Lamp. Electronics. 2024; 13(3):531. https://doi.org/10.3390/electronics13030531
Chicago/Turabian StyleKuryło, Kazimierz, Wiesław Sabat, Dariusz Klepacki, Kazimierz Kamuda, and Piotr Jankowski-Mihułowicz. 2024. "Determinants of the Generation of Higher Current Harmonics in Different Operating States of the RGB LED Lamp" Electronics 13, no. 3: 531. https://doi.org/10.3390/electronics13030531
APA StyleKuryło, K., Sabat, W., Klepacki, D., Kamuda, K., & Jankowski-Mihułowicz, P. (2024). Determinants of the Generation of Higher Current Harmonics in Different Operating States of the RGB LED Lamp. Electronics, 13(3), 531. https://doi.org/10.3390/electronics13030531