Article

Streamer-to-Leader Transition Characteristics of Long Air Gap Between Sphere and Plane with Burr Defects at High Altitudes

1
China Southern Power Grid Electric Power Research Institute, Guangzhou 510663, China
2
Department of Electric Power Engineering, North China Electric Power University, Baoding 071003, China
*
Author to whom correspondence should be addressed.
Electronics 2024, 13(24), 4899; https://doi.org/10.3390/electronics13244899 (registering DOI)
Submission received: 5 November 2024 / Revised: 10 December 2024 / Accepted: 11 December 2024 / Published: 12 December 2024
(This article belongs to the Special Issue New Insights of High-Voltage and Insulation Technology)

Abstract

:
In the valve hall of the converter station of a UHV transmission project at high altitudes, the shielding sphere and the wall/floor form a large-size sphere–plane long air gap. Burr defects on the surface of the shielding sphere can affect its discharge characteristics. The streamer-to-leader transition is a key process in the discharge of the long air gap. The existing research is limited to the discharge characteristics of small-size electrodes at low altitudes and cannot be directly extended to those of large-size electrodes at high altitudes. Therefore, this paper constructs a discharge test platform with optical–electrical synchronous detection at an altitude of 2200 m. The instantaneous optical power, electric field intensity, high potential current, and other physical parameters during the discharge in the long air gap of a 1.3 m diameter sphere–plane system were collected for both a sphere electrode with burrs and one without burrs. The injection current of the initial streamer was used as the input variable and substituted into Gallimberti’s model to analyse the transformation process of the streamer stem’s vibrational energy into translational energy. A modified model that is more suitable for high altitudes was developed by taking into account convective diffusion and the thermal expansion of the streamer, and the influence of burr defects on the characteristics of the transition from streamer to leader was analysed and compared with the experimental results. Overall, burr defects reduced the duration of the streamer-to-leader transition and facilitated discharge. The analysis results generally agree with the experimental results. The research results are of great significance for the design of the valve hall insulation in converter stations at high altitudes.

1. Introduction

It is evident that China exhibits a distinct pattern of energy and load distribution. The western and northern regions are endowed with substantial energy resources, whereas the load centre is concentrated in the central, eastern, and southeastern regions [1,2]. In recent years, China has intensified its efforts in energy development in the western region [3,4,5], resulting in a consistently high and unwavering demand for UHV transmission. The UHV project lines are lengthy, the transmission distance is considerable, the environment is intricate and changeable, and some high-altitude areas are characterised by particularly harsh climatic conditions [6,7]. The outer insulation characteristics of shielding sphere fittings inside the converter station are significantly influenced by the air pressure, temperature, and humidity. Surface burrs may emerge during processing, handling, and placement, resulting in abrupt alterations in the gap structure and subsequent impacts on the discharge characteristics of the large-size sphere–plane gaps [8,9,10,11].
The Les Renardières Group has identified four distinct phases in long air gap discharges; this classification was developed by observing their evolution [12,13]. In [14], the authors employed a Fastcam-SA1.1 high-speed camera to observe the optical morphology of a 3 m rod–plane gap discharge process. However, they did not introduce measurements of high-potential currents under the positive switching impulse. In a previous study, the authors constructed an optical observation system for rod–plane gap discharges based on a photomultiplier tube (PMT), through which they were able to obtain the streamer discharge characteristic parameters [15]. In [16], they designed a high-potential current measurement system with an integrated broadband current sensor and a high-precision opto-isolated acquisition unit that is less influenced by the electric field. In [17], the positive discharge electric field of a 1~3 m rod–plane gap was measured based on the Pockels effect transient electric field optical measurement system. However, the electric field measurement, optical observation, and synchronisation of current signals have yet to be considered. Combining a PMT and an electric field sensor to observe the optical power and electric field during the discharge process can establish a connection between optical and electrical physical quantities.
The transition from a streamer to a leader is a significant process in long air gap discharge. In the initial stages, researchers established their own empirical leader starting criteria based on experimental data. Some researchers have put forth the proposition that the spacing of an electric field jump that occurs during the dark period can be employed as a criterion for the completion of the transition. A comparative analysis of the results of a 3 m-long gap positive switching impulse voltage discharge test on sphere–planes with curvatures of different radii revealed that as the radius of the curvature of the sphere electrode increased, the streamer gradually became the dominant process of discharge [18,19]. Nevertheless, this conclusion did not include an investigation of the impact of electrode surface imperfections on the discharge process of the sphere–plane long gap. The study by [20] obtained a large number of physical characteristics and discharge parameters of positive discharge with a 1 m rod–plane gap and determined a statistical relationship among the dark time, the starting voltage of the initial streamer, and the injection charge of the initial streamer when a small electrode is discharged. The study by [21] refers to the period from the beginning of the initial streamer to the time when the electric field intensity near the electrode returns to a level that allows discharge as the dark time. Building on the principles of thermodynamics, Gallimberti put forth a proposition that the transition from streamer to leader entails a V-T relaxation process, whereby vibrational energy is transformed into translational energy. This provided a thermal equilibrium model for the start of the leader [22,23]. In a modified Gallimberti model constructed by the authors of [24], they achieved a notable enhancement in computational accuracy considering the convective diffusion of the streamer channel and the morphological characteristics of the initial streamer stems at an altitude of 50 m. However, the effect of thermal expansion of the streamer channel was not taken into account, and it was clearly observed in [25] that the streamer channel exhibited radial expansion with increases in time. In a previous study, the impact of varying the initial radii of streamer stems on the temperature change rule of the discharge channel during the dark period was investigated utilising Gallimberti’s streamer leader transformation model [26]. And in [27], a model was constructed for the purpose of studying the leader’s expansion. Nevertheless, the existing time-varying law of the thermal diameter of the streamer stems is predominantly employed to delineate the physical attributes of the discharge in small-sized rod–plane electrode gaps at low altitudes, but it cannot be used directly at high altitudes.
It can be hypothesised that alterations in environmental factors, including temperature, humidity, air density, and atmospheric pressure at elevated altitudes, may exert an influence on the streamer-to-leader transition process. The study by [8] suggested that a reduction in air pressure under pin–plane and pin–pin electrode configurations results in a decrease in the streamer radius. A reduction in temperature was demonstrated to exert an inhibitory effect on positive streamer discharge in a rod–plane gap, as evidenced in [28]. As evidenced in [29], the duration of a streamer-to-leader transition for a 0.5 m air gap exhibited a sevenfold increase when the air pressure was reduced from 1 MPa to 0 MPa. In [30], a test platform for air gap discharge experiments was built, including an artificial climate chamber. Discharge current waveforms and optical images of the discharge channel were obtained for air pressures ranging from 0.03 MPa to 0.20 MPa. The research shows that the number of streamers decreased with decreasing air pressure. In a study by [10], electric field simulations were conducted on shielding spheres with burr defects. The results demonstrated that the burrs significantly enhanced the maximum electric field intensity on the surface of the sphere electrode. In their investigation of the effect of burr position and length on the discharge voltage of sphere–plane gaps with different gap distances at switching impulse voltages, the authors of [11] found that burrs had a more pronounced effect on the switching impulse discharge of shielding spheres. In a related study, the authors of [31] constructed an optoelectronic joint measurement system and conducted a positive switching impulse discharge test on a 3 m sphere–plane long air gap with burrs. The results demonstrated that the burrs markedly altered the discharge characteristics of the sphere–plane air gap. Nevertheless, the extant streamer-to-leader transition mechanism cannot be directly extended to the discharge process of large-size sphere–plane long air gaps with burr defects at high altitudes.
In this paper, a large-size electrode long-gap streamer-to-leader discharge test platform based on a combined optical–electrical parameter detection device was set up at an altitude of 2200 m. Switching impulse discharge tests were carried out for a 1.3 m diameter sphere–plane 5 m gap without burrs and with a 5 mm end burr. By analysing the typical discharge test curve, the law of change in the optical–electrical parameters during the streamer-to-leader transition process was obtained. We then calculated and compared the vibrational and translational energy temperatures of the streamer channels using Gallimberti’s model. A modified model at high altitudes considering convective diffusion and radial thermal expansion was established on the basis of Gallimberti’s model. The impact of the burr defects on the streamer-to-leader transition process in the long air gap at high altitudes was examined from the standpoint of the rise rate of the streamer stem’s temperature and the rate of radial thermal expansion. Through experimental and theoretical analysis, it was found that burr defects shortened the transition time from streamer to leader, which is of great reference value for the design of external insulation for power transmission projects at high altitudes.

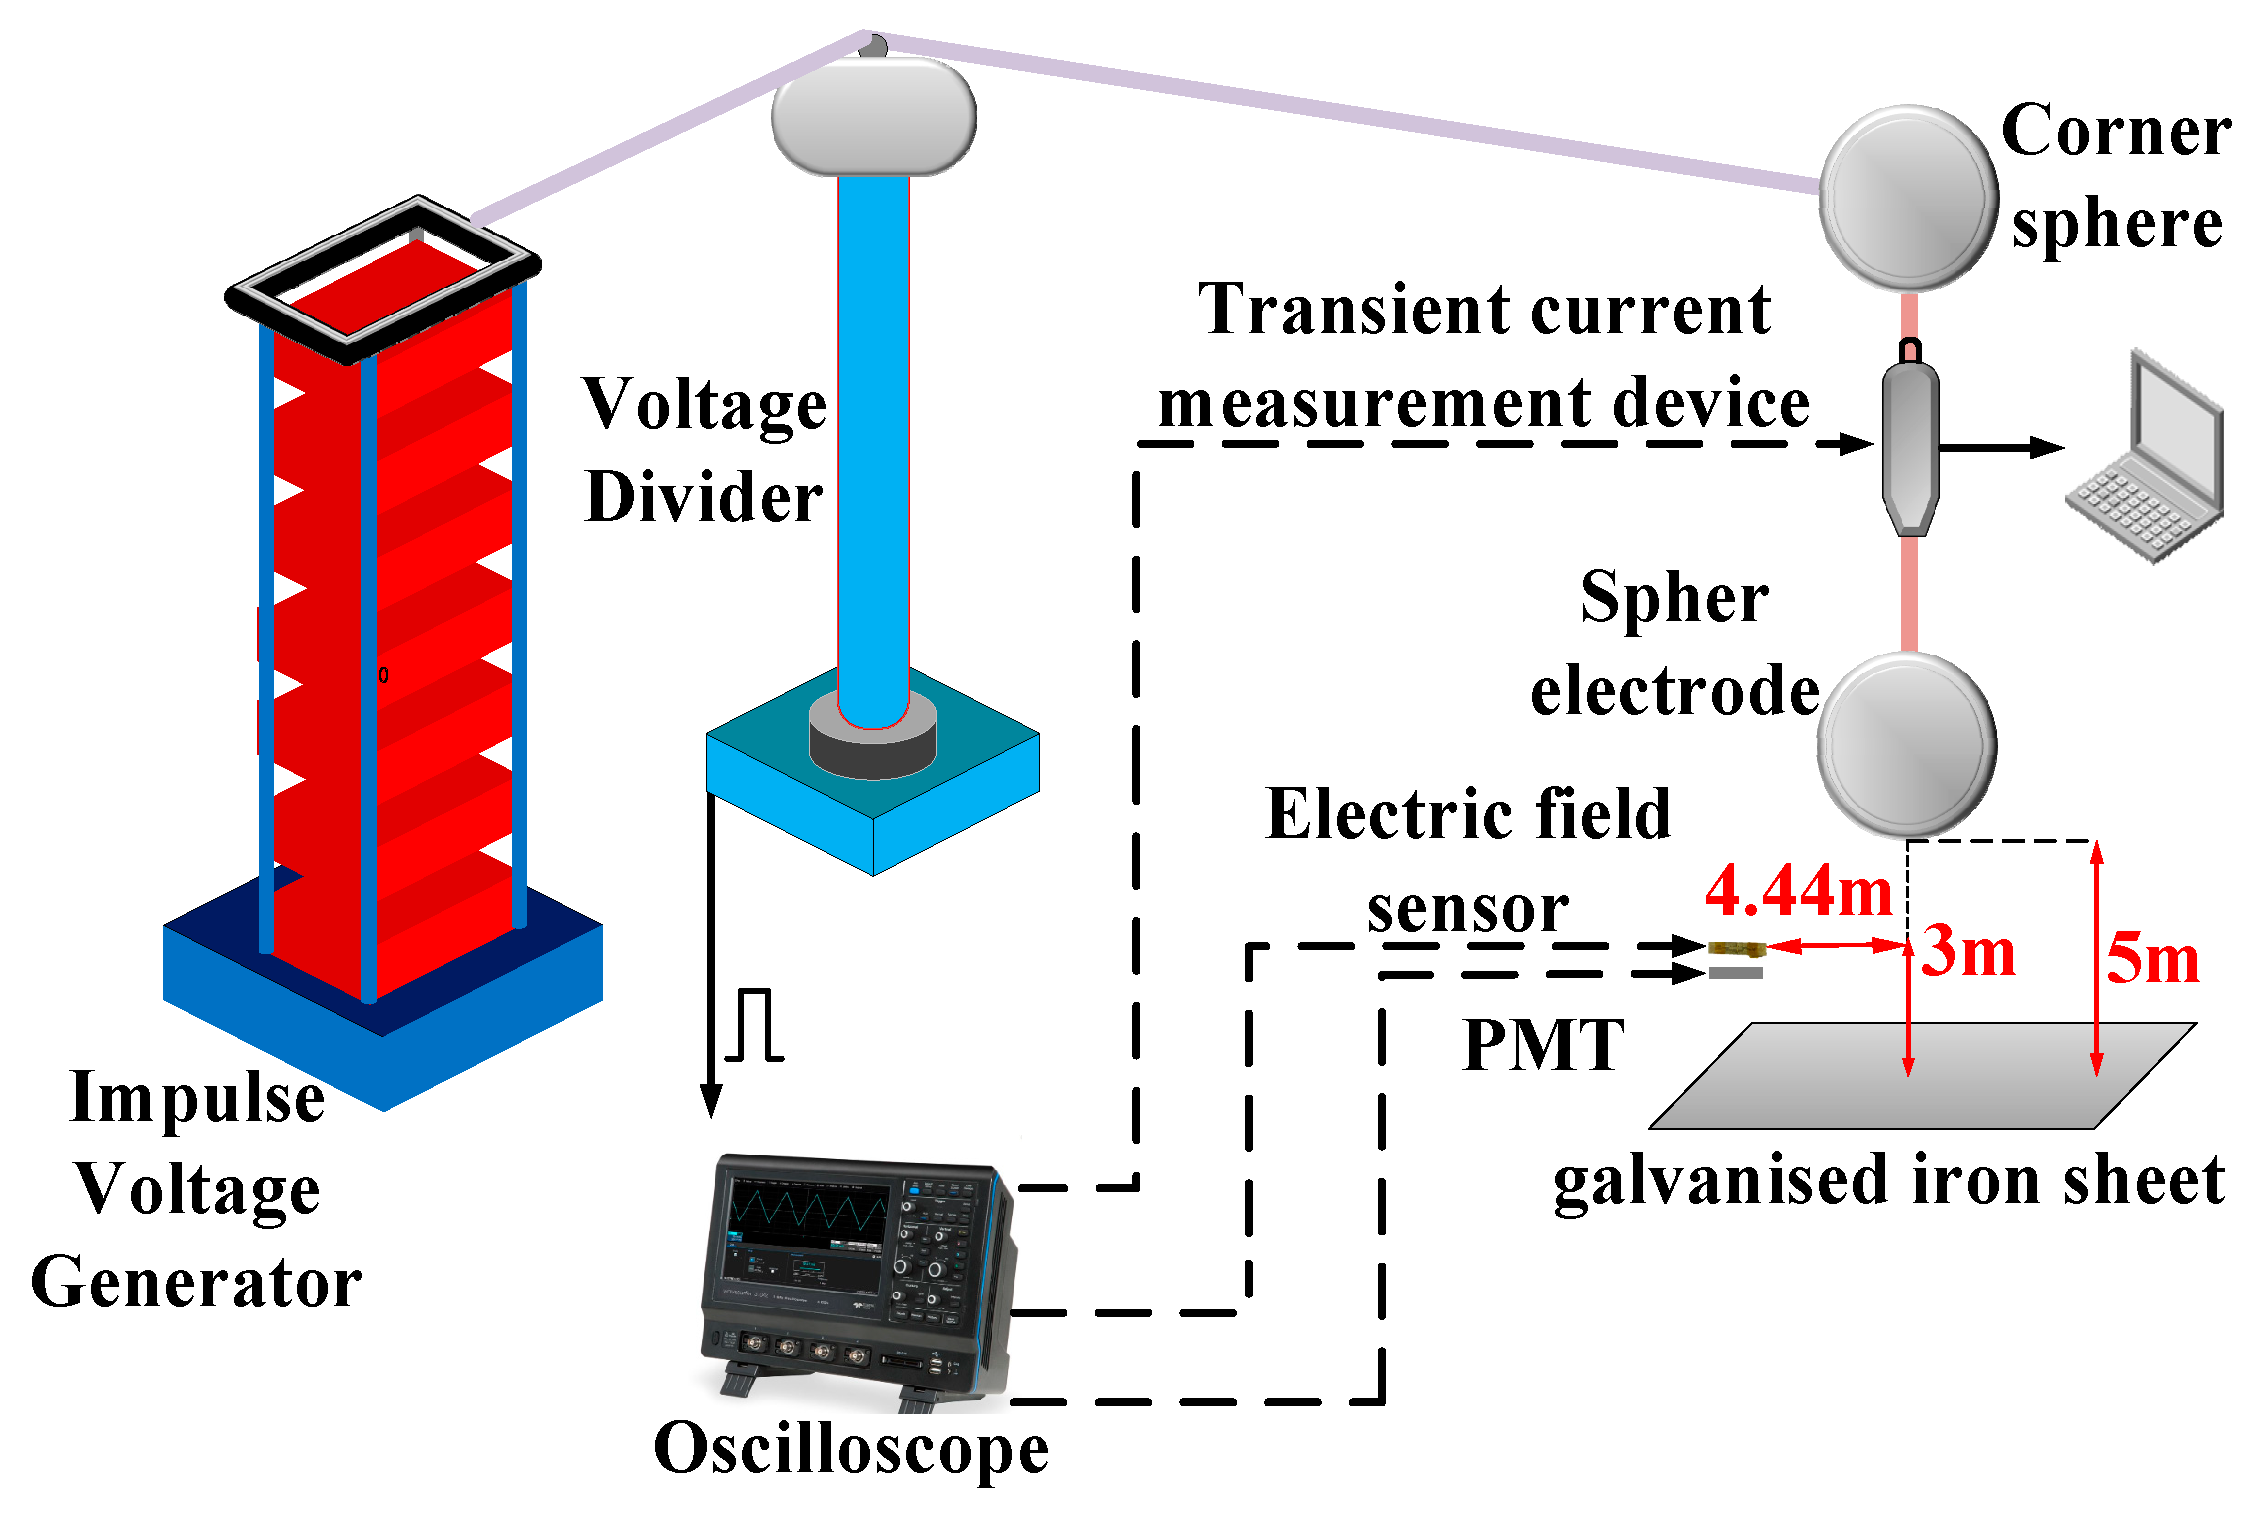
2. Experimental Set-Up

A large-size sphere–plane discharge test platform was constructed at an altitude of 2200 m in Xining city, Qinghai Province, China. The test environment was maintained at a temperature of 16.2 °C, a relative humidity of 79.22%, and an air pressure of 75.4 kPa.
The configuration of the test is illustrated in Figure 1. The diameter of the test sphere is 1.3 m, the bottom of the sphere is situated 5 m away from the grounding electrode plane, and the ground is covered with a 25 m × 25 m galvanised iron sheet. A standard positive switching impulse waveform was generated by a 6000 kV/560 kJ switching impulse voltage generator. The combined optical–electrical detection system enabled the collection of optical power signals. The electric field measurement was performed by the optoelectronic integrated electric field sensor with the Pockels effect of the lithium niobate. The distance from the photomultiplier tube and the electric field sensor probe to the axis of the sphere electrode was 4.44 m, with a height of 3 m. The signal of the impulse voltage generator was used as the trigger for each test. Upon exceeding the specified threshold, the oscilloscope acquired the electric field, the optical power, and the current signal at the same time. The time delay of the signals from the various channels was corrected during the data-processing stage. The transmission of signal data was ensured by the use of optical fibres, thereby guaranteeing the synchronisation of the data.
The experiment was carried out in accordance with the provisions of GB/T 16927.1-2011. To guarantee the precision of the test outcomes, 40 discharge trials were performed at an identical voltage rise rate across all gap configurations. In the analysis of the test results, we selected typical test result curves that are representative of the general discharge process to describe the characteristics of most cases of gap discharge.

3. Analysis of Test Results

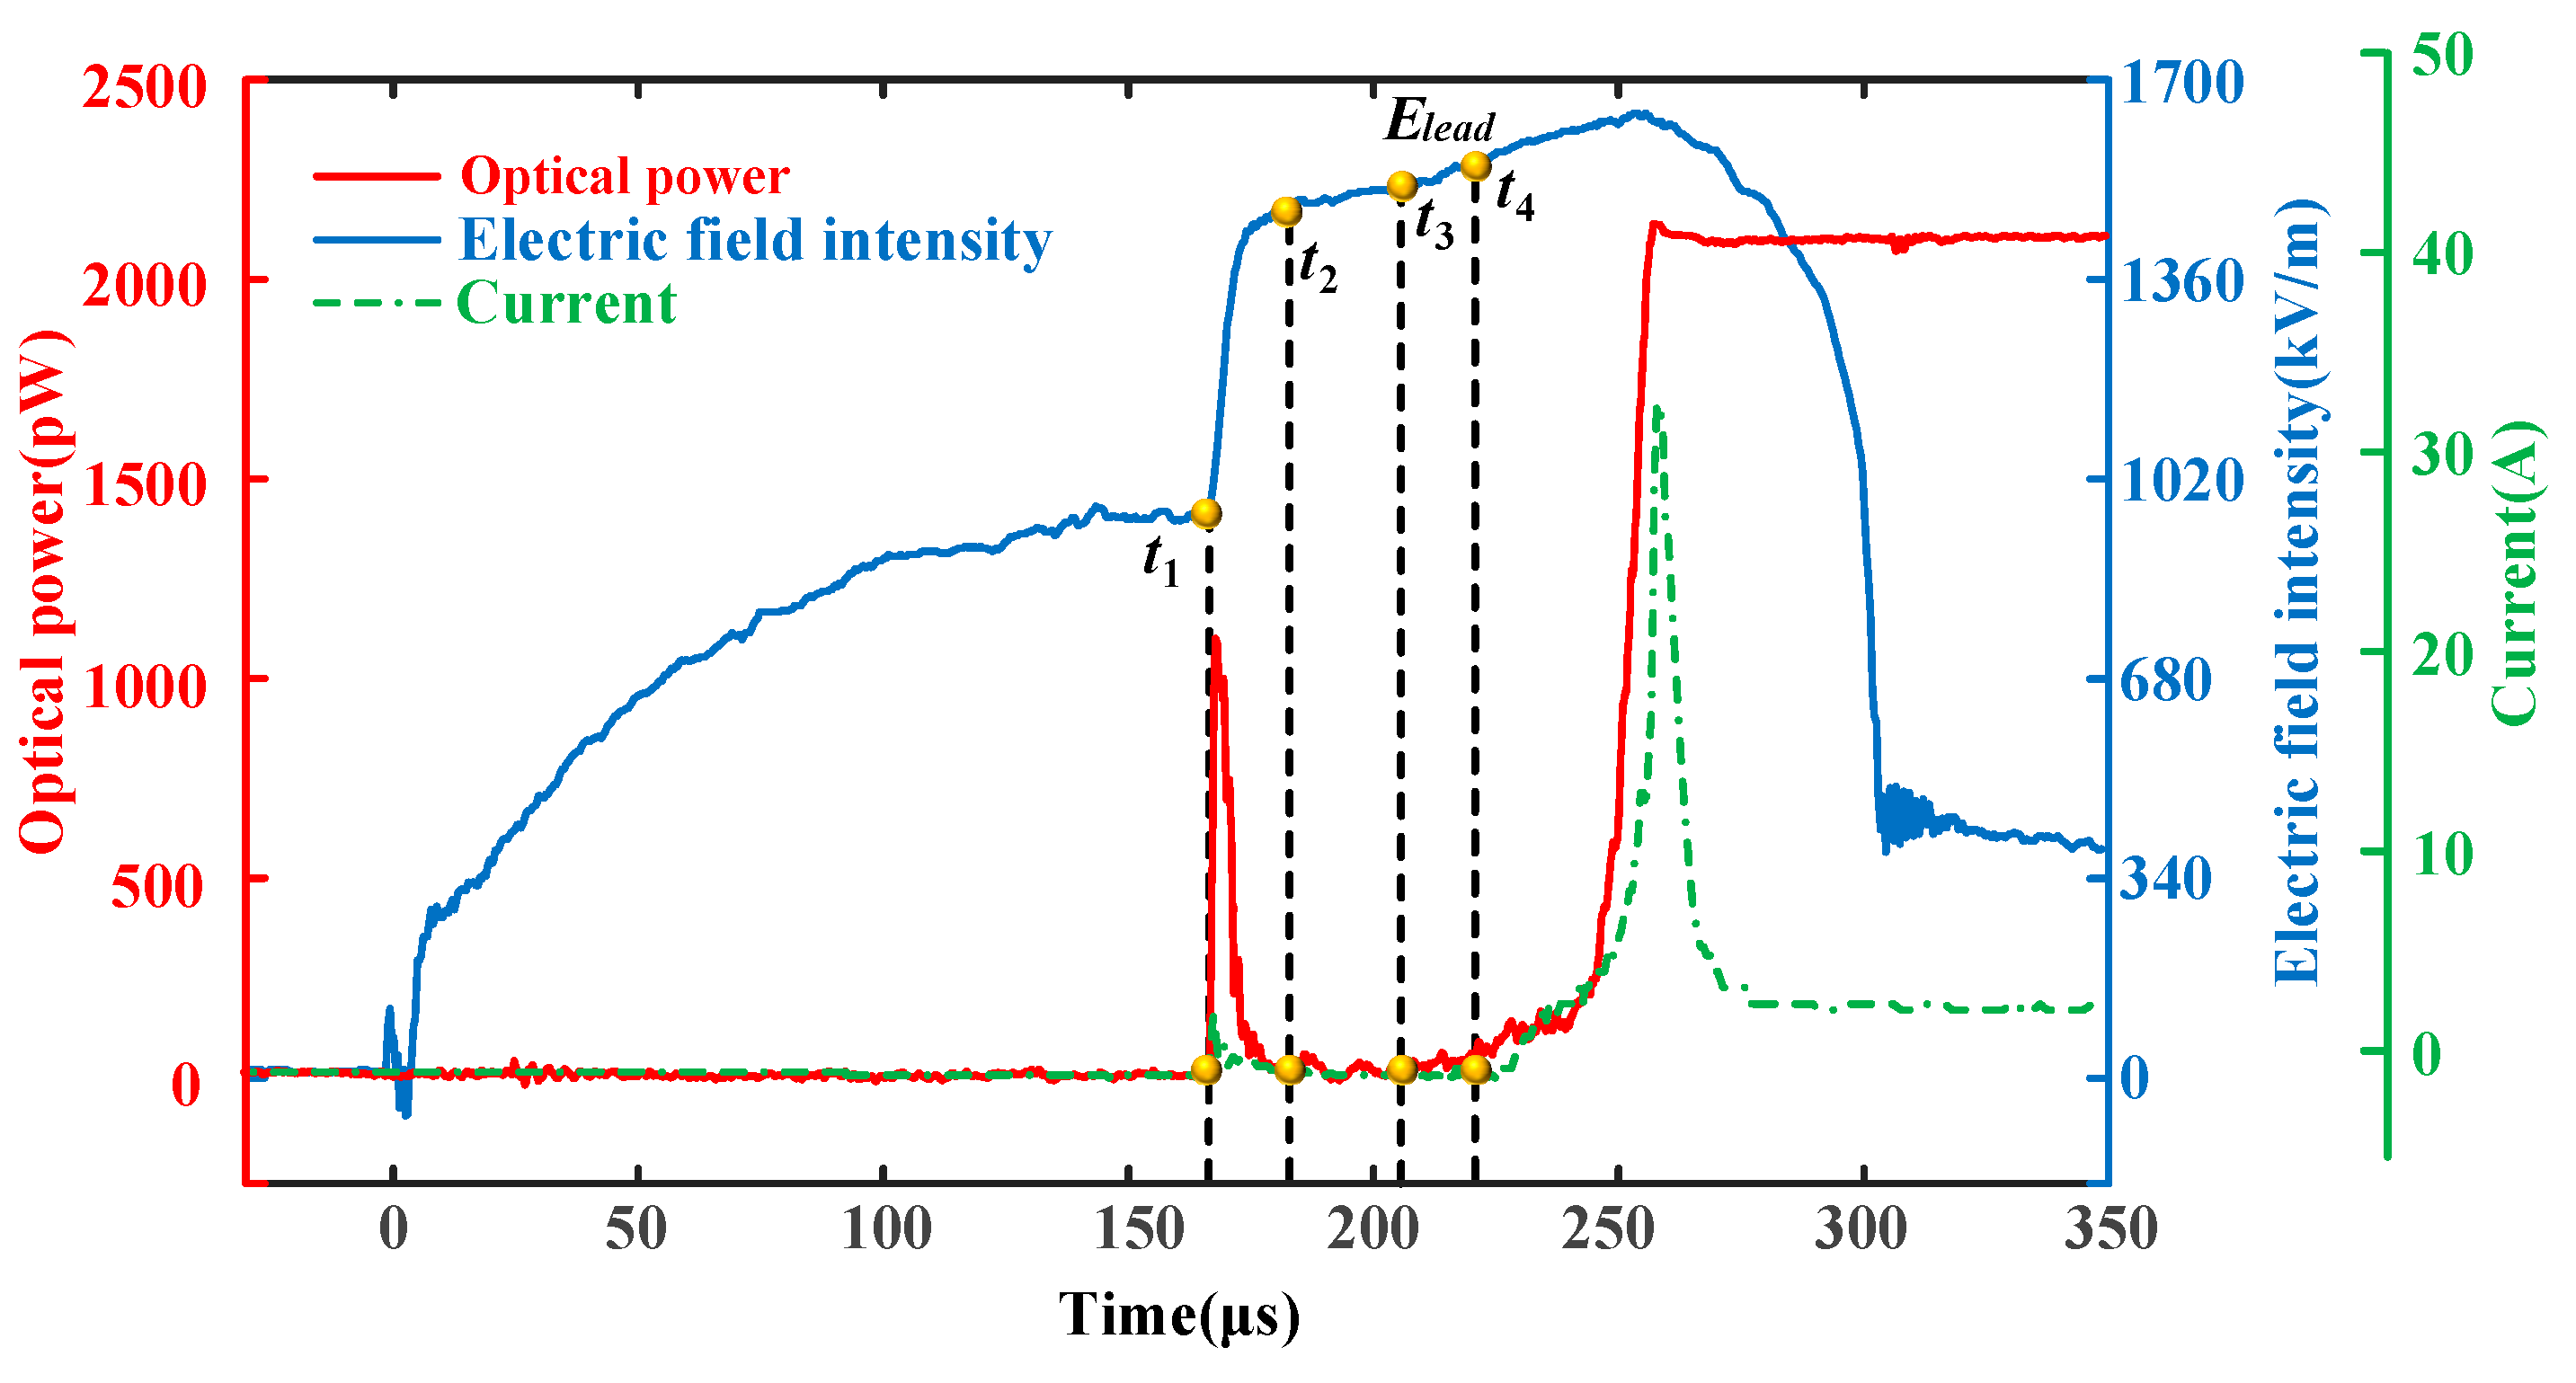
3.1. A 1.3 m Diameter Sphere–Plane 5 m Gap

A set of typical optical–electrical characteristic curves of a 1.3 m sphere–plane 5 m gap discharge test, carried out using the test platform, was selected for analysis. The characteristic curves in question mainly consisted of the spatial electric field intensity, high potential current, and instantaneous optical power curves. The streamer-to-leader transition stage can be further divided into four phases, namely t1—the initial streamer start, t2—the initial streamer end, t3—the completion of the streamer-to-leader transition, and t4—the leader start. This is illustrated in Figure 2.
As illustrated in Figure 2, at the instant of t1 = 166.89 μs, the initial starting of the streamer was accompanied by a rapid increase in optical power to a peak value of 1109.12 pW. Concurrently, the streamer starting field intensity was 934.88 kV/m. At this juncture, the free electrons were injected into the positive spherical electrode via the streamer channel, where they underwent violent collisions with the gas molecules, resulting in strong ionisation. The discharge current reached a peak value of 1.15 A at 168.00 μs. Due to the residual positive ions in the streamer branch channel inhibiting the forward movement of the streamer, the discharge current decayed, the increase rate of the spatial electric field intensity decreased, and the field intensity of the head of the streamer branch was less than the streamer critical starting field intensity at t2 = 182.11 μs. This marked the end of the initial streamer. The initial streamer had a duration of 15.22 μs, during this period, and the spatial electric field intensity demonstrated a rate of increase of 35.33 kV·(m·μs)−1.
At t1 = 166.89 μs, the process of the streamer-to-leader transition commenced. The minor proportion of energy generated by the collision ionisation of free electrons in the initial streamer phase was directly characterised as translational energy, promoting the temperature growth of the streamer channel. The streamer-to-leader transition channel was heated up by relaxation in the initial phase during the dark period (t2~t3) until the critical temperature was reached at the moment of t3 = 207.44 μs. The negative ions were thermally ionised, resulting in the generation of a substantial number of free electrons and neutral molecules, thereby completing the streamer-to-leader transition. The duration of this transition was given as the difference between t3 and t1, which was 40.55 μs. The spatial electric field intensity exhibited a rate of change in the initial phase of the dark period, with a value of 1.46 kV·(m·μs)−1.
The drift and diffusion of positive ions causes an increase in the net positive charge in space, which in turn distorts the electric field of the streamer-to-leader system’s head. For the 1.3 m diameter sphere–plane 5 m gap, the distorted electric field began to recover at t3 = 207.44 μs, and after the space electric field intensity of the streamer-to-leader system’s head gradually recovered to Elead =1549.38 kV/m within 15.19 μs, the streamer-to-leader system began to move forward at t4 = 222.63 μs. The increase rate of the spatial electric field intensity during the recovery phase of the distorted electric field (t3~t4) was 2.62 kV·(m·μs)−1.

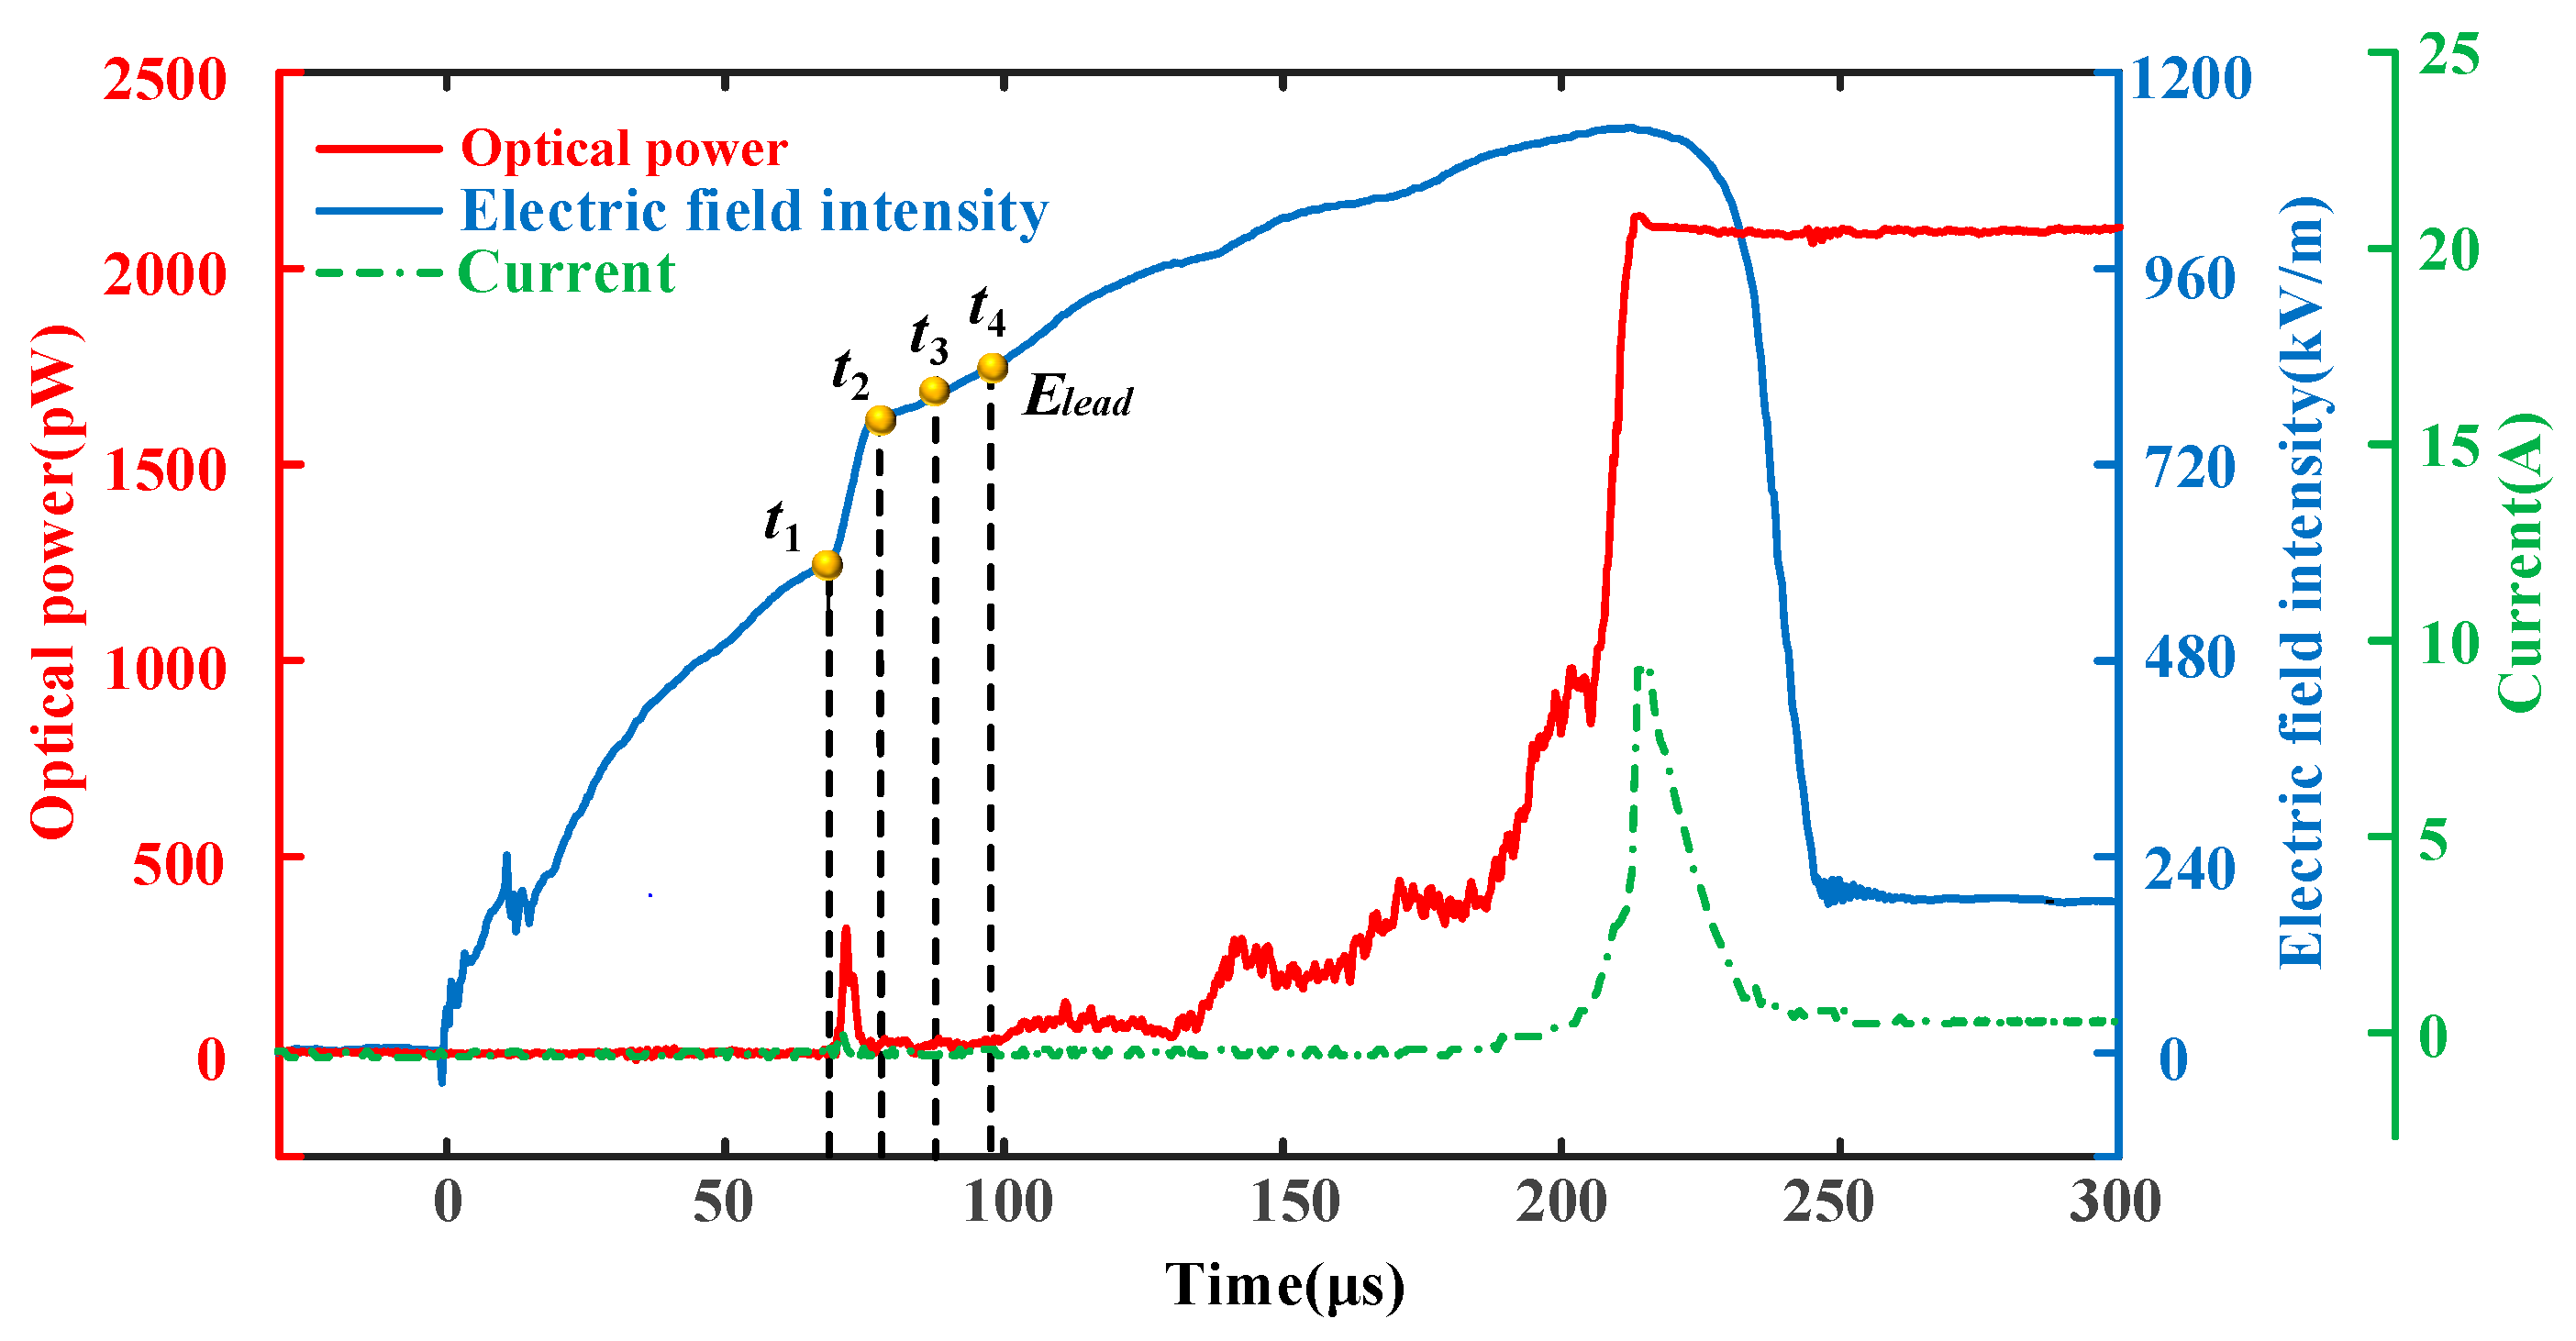
3.2. A 1.3 m Diameter Sphere with a 5 mm End Burr–Plane 5 m Gap

A group of specimens with an altitude of 2200 m and a diameter of 1.3 m, containing a 5 mm end burr, was selected for testing. The specimens were subjected to a discharge test with a 5 m air gap, and the results are shown in Figure 3.
As illustrated in the Figure 3, the initial streamer commenced at the instant of t1 = 69.50 μs. Thereafter, the optical power rapidly attained a peak of 308.17 pW, while the field intensity at the inception of the streamer was 510.60 kV/m. Free electrons collided violently with gas molecules during injection into the positive spherical electrode via the streamer channel. This resulted in the discharge current reaching a peak value of 0.65 A at 71.00 μs. The initial streamer stopped developing at t2 = 77.90 μs due to the positive space charge, which inhibited the field intensity of the streamer head. The initial streamer had a duration of 8.40 μs, with an electric field intensity jump rate of 20.50 kV·(m·μs)−1.
The transition from streamer to leader began with the collisional ionisation of free electrons injected into the spherical electrode via the discharge channel. From t1 = 69.50 μs, the collisional ionisation promoted the temperature growth of the streamer channel, while the relaxation process in the initial phase of the dark period (t2~t3) continued to heat up the streamer-to-leader transition channel until the critical temperature was reached at the moment of t3 = 91.04 μs. The negative ions were thermally ionised and detached, resulting in the production of a considerable quantity of thermal ions. The thermal ionisation and desorption of negative ions gave rise to a multitude of free electrons and neutral molecules, marking the completion of the transition. The duration of the transition was t3t1 = 21.54 μs. The rise rate in the electric field intensity within the initial phase of the dark period was 3.63 kV·(m·μs)−1.
In the transition process from streamers to leaders, the drift and diffusion of positive ions result in an increase in the net positive charge in the surrounding space, which in turn causes distortion of the electric field of the streamer-to-leader system’s head. In the case of a 5 m gap between a 1.3 m diameter sphere containing a 5 mm end burr and a plane, the distorted electric field began to recover at t3 = 91.04 μs. As the applied voltage on the positive electrode increased, the electric field intensity in the streamer-to-leader system’s head gradually recovered to Elead =748.98 kV/m within 7.20 μs. This was followed by the development of the streamer-to-leader system at t4 = 98.24 μs. The rise rate of the spatial electric field intensity during the recovery period (t3~t4) was 6.38 kV·(m·μs)−1.
According to the theory of critical volume [32,33], since the critical volume of the sphere electrode was larger when there was no burr, the initial streamer discharge was more violent and developed over a longer distance. After the streamer-to-leader transition, the leader travelled a shorter distance before breakdown. However, the sphere electrode with burrs had a smaller critical volume, the initial streamer discharge was weaker, the development duration was shorter, and after the streamer-to-leader transition, the distance to breakdown after development was longer and more time was required, which explains the difference in the curves between Figure 2 and Figure 3.

3.3. Analysis of Physical Quantities in the Process of the Streamer-to-Leader Transition

The approximate expression for the inhomogeneity coefficient K1 in the smooth state of the sphere is given in [34,35].
K 1 = ( 4 l D + 1 ) + ( 4 l D + 1 ) 2 + 8 4
where l represents the sphere–plane gap distance, m; D represents the sphere diameter, m.
For the sphere surface with burr defects, the approximate expression for the inhomogeneous gap coefficient K2 is as follows [36,37]:
U p = K 2 × 500 ( d ) 0.6
where Up represents the sphere–plane air gap discharge voltage, kV; d represents the sphere–plane clearance distance, m.
The gap coefficient K1 was calculated to be 8.25 for a 1.3 m diameter sphere–plane with a 5 m gap, and K2 was calculated to be 0.91 for a 1.3 m diameter sphere with a 5 mm end burr–plane and a 5 m gap. These calculations were performed using Equations (1) and (2). The discharge phases can be classified into four distinct phases: initial streamer, dark period, leader development, and end-jump breakdown.
The voltages corresponding to the streamer starting moment and the leader starting moment are the streamer starting voltage and the leader starting voltage, respectively. These can be obtained according to the voltage values of the corresponding moments in the waveform of the switching impulse voltage. The mean values of the starting moment and starting voltage were plotted by taking the mean values of several groups of test results of the two gap structures, as illustrated in Table 1.
As illustrated in Table 1, a comparison between the 1.3 m diameter sphere–plane 5 m gap and the 1.3 m diameter sphere 5 mm end burr–plane 5 m gap reveals that following the change from the gap structure K1 = 8.25 to the gap structure K2 = 0.91, it was found that the sphere surface containing burrs resulted in reductions of 97.39 μs in the streamer starting delay, of 585.70 kV in the streamer starting voltage, of 124.39 μs in the leader starting moment, of 496.39 kV in the leader starting voltage, and of 37.72% and 32.02% in the streamer starting voltage and leader starting voltage, respectively. Furthermore, the correlation analysis of the optical–electrical characteristic curves revealed a reduction in the initial streamer duration from 15.22 μs to 8.40 μs, and in the streamer-to-leader transition time from 40.55 μs to 21.54 μs. The presence of burr defects was observed to result in a notable reduction in several key parameters, including the streamer starting delay, the leader starting moment, the streamer starting voltage, the leader starting voltage, and the duration of the streamer-to-leader transition.

4. Streamer-to-Leader Transition Model for Long Air Gap Discharge at High Altitudes

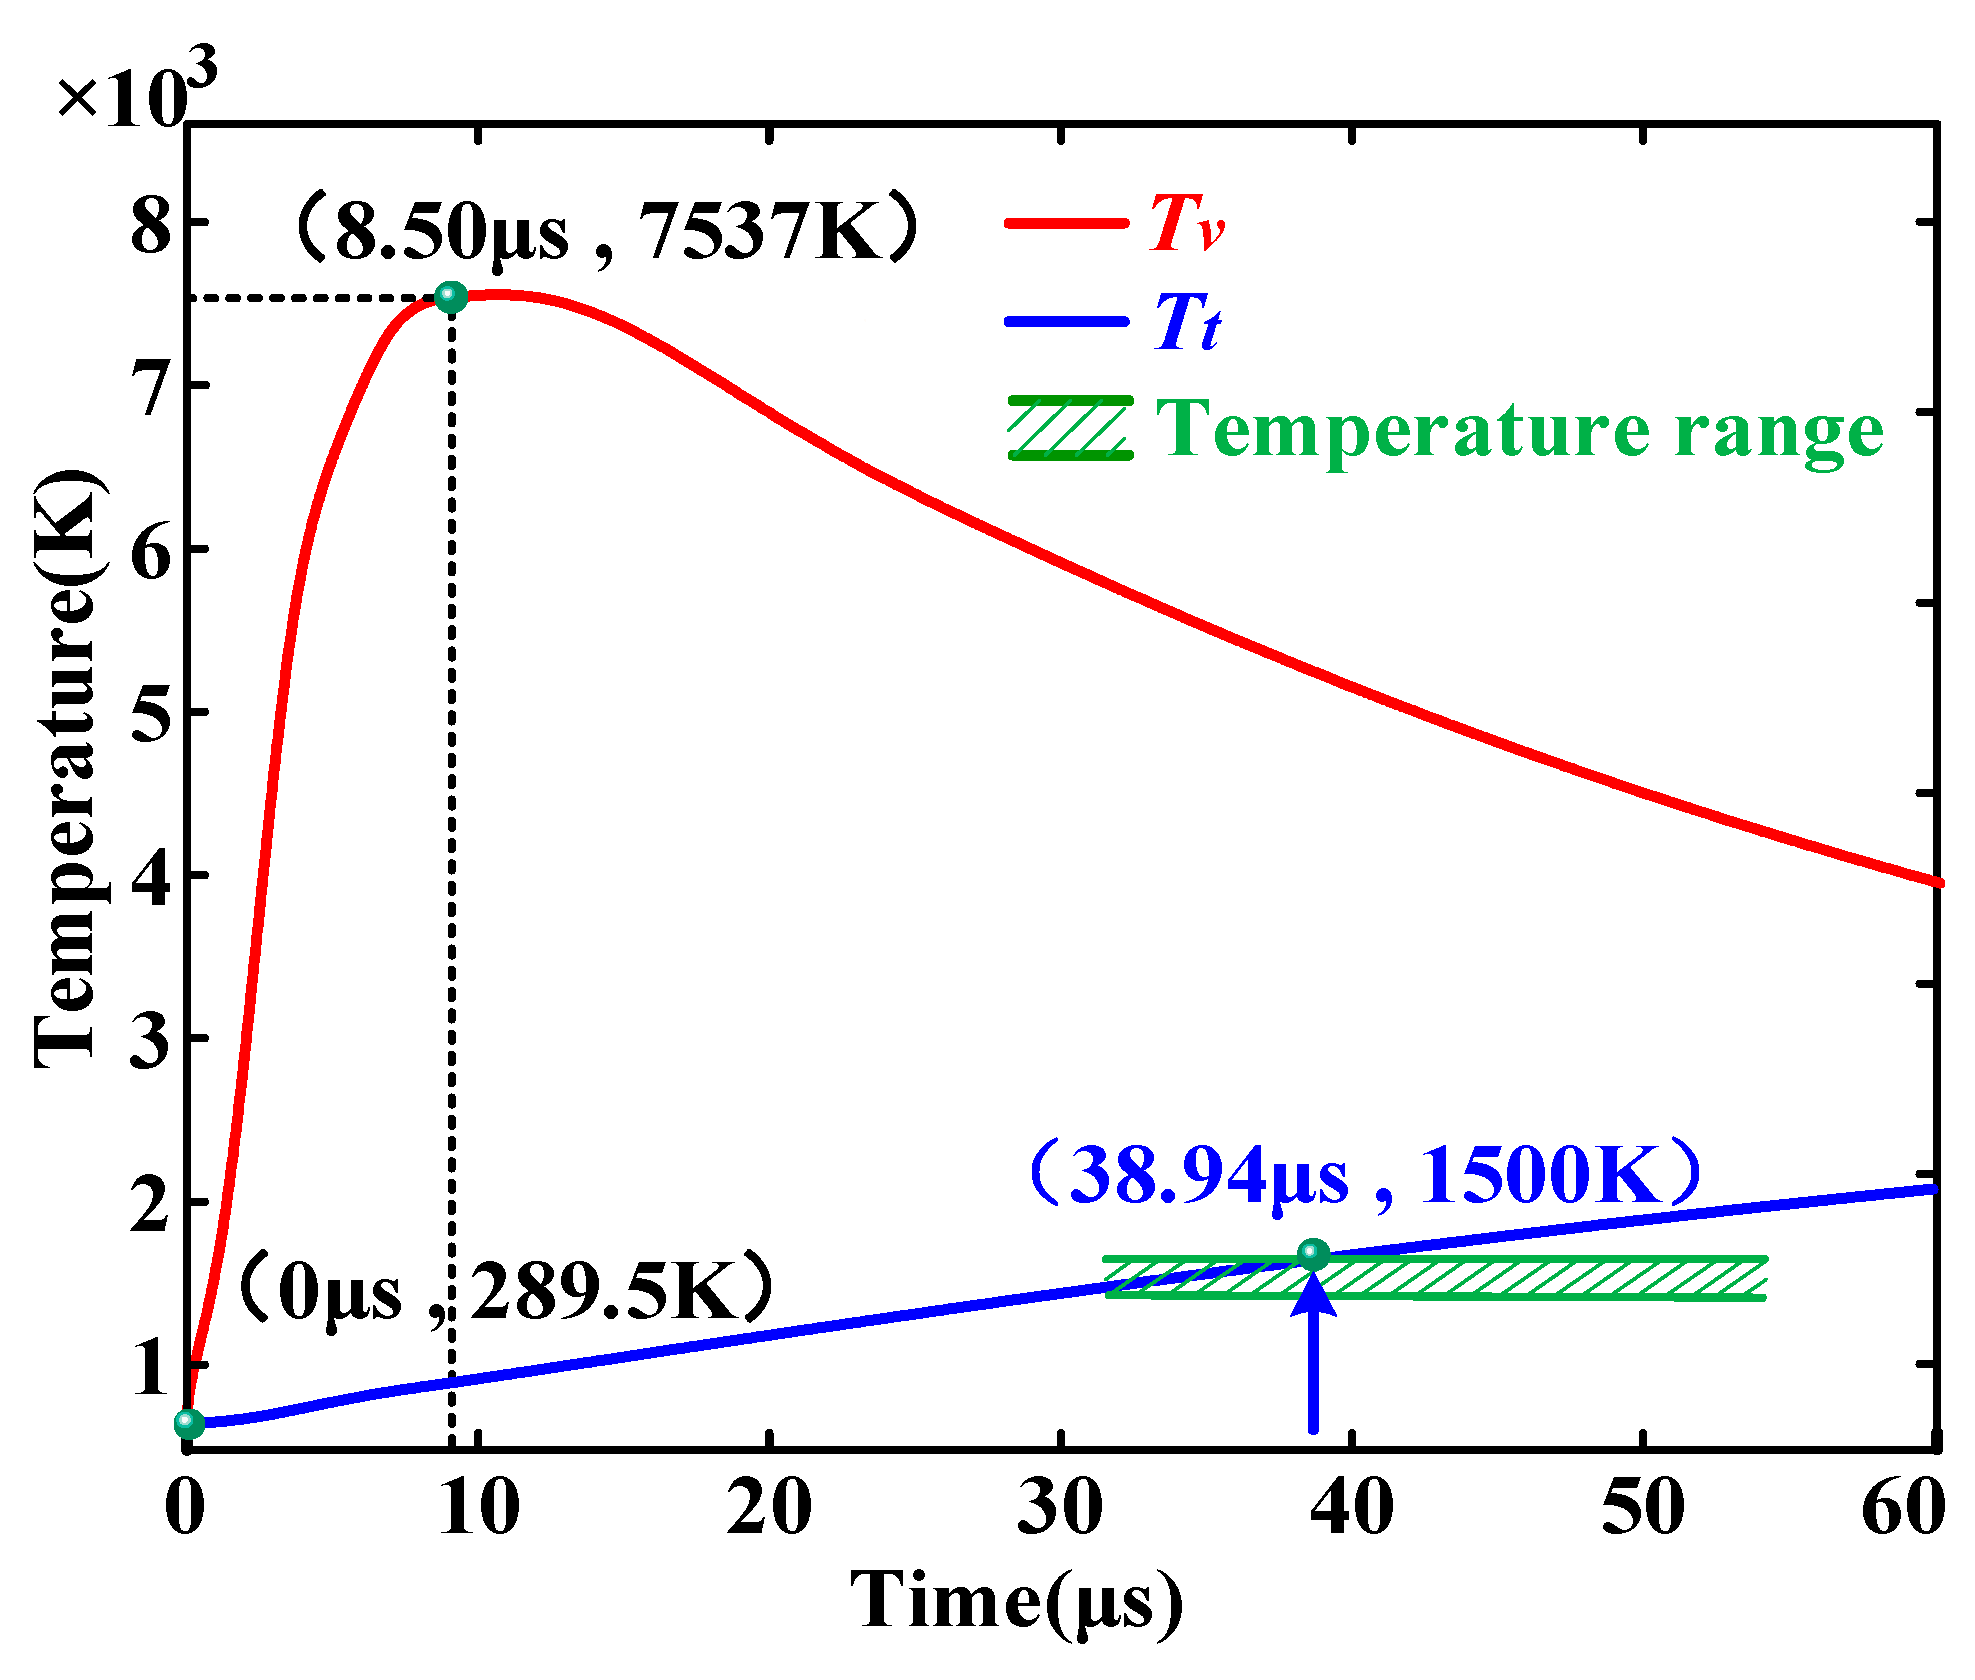
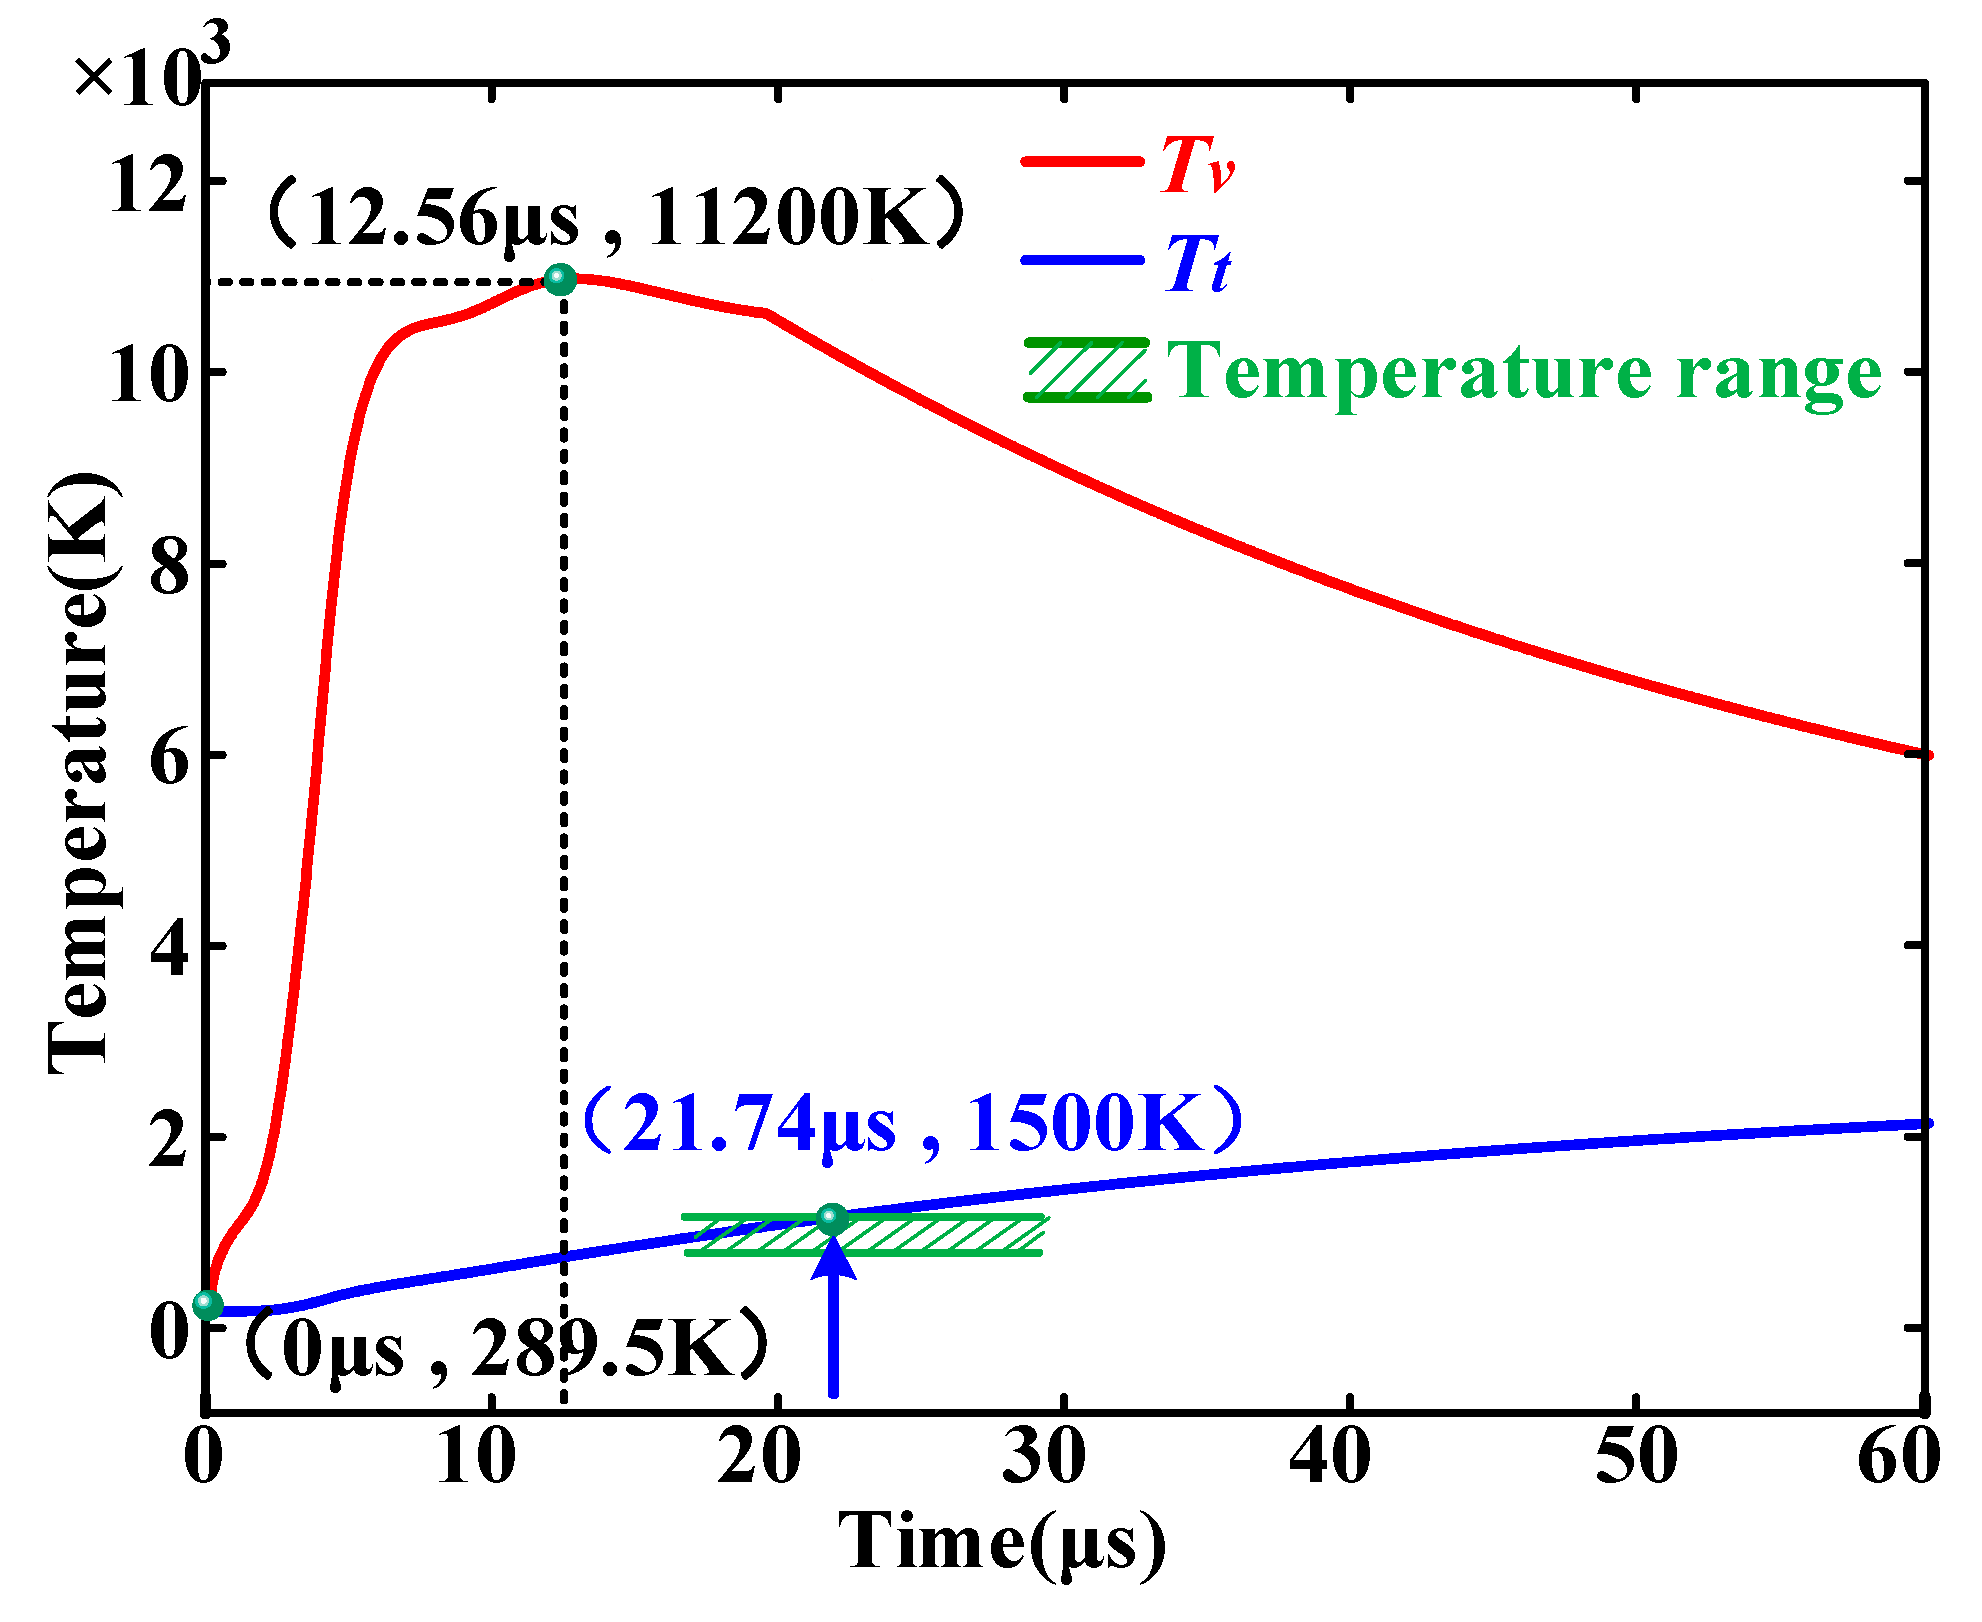
4.1. Temperature of Vibrational Energy and Translational Energy

The current of the initial streamer injection was taken as the input variable and substituted into the classical leader starting thermal equilibrium model established by Gallimberti [22,23]. This allowed the time-varying curves of the streamer stem vibrational and translational temperatures to be obtained. The time-varying curves of the streamer stem vibrational energy temperature, Tv, and the translational energy temperature, Tt, for the 1.3 m diameter sphere–plane 5 m gap and the 1.3 m diameter sphere with a burr–plane 5 m gap are illustrated in Figure 4 and Figure 5. The initial temperatures of the streamer vibrational energy and translational energy were 289.5 K. The starting moment of the streamer was defined as time zero, and the upper and lower boundaries of the critical temperature range were 1300 K and 1500 K, respectively.
In Table 2, the tmax-v is the moment when the vibrational energy temperature of the streamer stem rose to a peak, Kv-I is the rate of increase in the vibrational energy temperature before it reached a peak value, Kv-II is the rate of decrease in the vibrational energy temperature after reaching the peak, and Kh is the rate of increase in the translational energy temperature. As illustrated in Figure 4 and Table 2, the vibrational energy temperature (Tv) of the streamer stem with a 1.3 m diameter sphere–plane gap of 5 m at an altitude of 2200 m was rapidly elevated to 7537 K over time, reaching 852.65 K/μs as the average rate of temperature rise. Thereafter, the Tv declined at a rate of 77.40 K/μs. The average temperature increase rate of the translational energy temperature of the streamer stem (Tt) was 38.96 K/μs, and the duration of the streamer-to-leader transition simulation for this group was 38.94 μs. As illustrated in Figure 5 and Table 2, the vibrational energy temperature of the 1.3 m diameter burr-containing sphere–plane with a 5 m gap at an altitude of 2200 m, Tv, rapidly elevated to a peak of 11,200 K with a temperature increase rate of 868.67 K/μs. Thereafter, the temperature change rate of Tv decreased by 100.37 K/μs, yet the streamer stem translational energy temperature (Th) reached 1300–1500 K at an average temperature rise rate of 54.23 K/μs. The simulation duration for this group was 21.74 μs.
Combining the aforementioned curves of the vibrational energy temperature and translational energy temperature changes during the streamer-to-leader transition process revealed that the vibrational energy temperature of the streamer stem, Tv, was initially elevated to its peak value with a rising rate of Kv-I. Subsequently, cooling was applied at a rate of Kv-II, resulting in the gradual conversion of vibrational energy into translational energy. The rate of increase in the translational energy temperature of the streamer stem was relatively flat, with a value of Kh, and rose slowly to reach the critical temperature range, which was between 1300 K and 1500 K. Comparing the rate of increase in the vibrational energy temperature and translational energy between a 1.3 m diameter sphere–plane gap with burr and a smooth sphere–plane gap, it can be seen that the Kv-I, Kv-II, and Kh of the sphere–plane gap with burrs were 1.88%, 29.68%, and 39.19% higher than those of the smooth sphere–plane clearance, respectively. It can, therefore, be concluded that the presence of burr defects caused a delay in the peak moment of the vibrational temperature (Tv), an increase in both the vibrational energy and the translational energy temperature rise rates, and a reduction in the duration of the streamer-to-leader transition.

4.2. Modified Model Considering Convective Diffusion and Thermal Expansion at High Altitudes

4.2.1. Theoretical Studies

By considering convective diffusion, Morrow obtained the following [38,39,40]:
σ z ( ρ ) = σ a z e λ ρ 2
where σz represents the charge density injected into the centre position of the root of the streamer stem, i.e., the peak total charge density; λ represents the distribution coefficient, which is related to the curvature radius of the electrode head; ρ represents the radial variable of the root of the streamer stem; and σaz represents the high-temperature region charge density in the centre of the streamer.
The streamer stem was divided into a number of micro-elements in the axial direction, and the charge Qi of the ith micro-element was calculated as follows:
Q i = ρ i 1 ρ i 2 π ρ σ z ( ρ ) d ρ
The necessary energy for the temperature’s increase was provided by electrons. With a greater number of electrons passing through the area proximate to the root of the streamer stem, the gas molecules received a greater amount of energy, resulting in a faster rise in temperature. The radial temperature distribution shows a decreasing trend from the electrode. It can be assumed the peak temperature of the streamer’s root was Tp, which allowed the central high-temperature zone to be determined. The central high-temperature zone was, therefore, 0.95Tp~Tp [38].
Following the injection of the initial discharge current, the temperature subsequently increased in a gradual manner. Once the temperature at the centre of the streamer stem root exceeded 1500 K, the central region of the anion became unstable and adsorbed a significant number of electrons, thereby forming the initial leader. Subsequently, the surrounding high-temperature gas region underwent a gradual transformation into a high-conductivity leader. This transition was completed as the temperature rose to the requisite level.
The initial streamer current Ia in the central high-temperature zone of a single streamer is as follows:
I a = I n × 1 e λ a 2 1 e λ r 2 = I r × 1 e λ a 2 1 e λ r 2
where Ia represents the central high-temperature zone current through a streamer; I represents the current of a streamer; Ir represents the injection current of a single streamer; λ represents the distribution coefficient, and in this paper, 100 was used [40]; r represents the radius of a streamer; a represents the radius of the central high-temperature zone.
In addition [41],
π r 2 = 0.2319 I r p + 0.65139
where Irp indicates the peak current of a single stem’s initial streamer.

4.2.2. Mechanism Under High-Altitude Conditions

As the altitude increases, the impact of environmental factors, including temperature, humidity, air density, and pressure, on the parameters of the theoretical model must be taken into account. The theoretical model at low altitudes is not wholly applicable to high altitudes, necessitating the incorporation of additional physical parameters, such as temperature and air pressure, and the refinement of the streamer-to-leader transition model at high altitudes.
The relative air density, δ, per unit volume of the sphere–plane air gap at an altitude of 2200 m was calculated as follows [42]:
δ = 293 P 0.10 ( t + 273.15 )
The measured pressure of P = 0.0754 MPa and the room temperature of t = 16.2 °C results in a relative air density δ = 0.908.
The absolute humidity can be obtained using the following empirical formula for relative humidity:
A H = 6.11 × R H × 2.718 17.6 t 243.15 + t 0.46 × ( 273.15 + t )
where AH is the absolute humidity; the actual relative humidity RH in this paper was taken as 56.86%, and the absolute humidity conversion value was AH = 7.86 g/m3.
The steady-state propagating electric field intensity Eav can be used to express the absolute humidity AH and the relative air density δ, as follows:
E av = 489 δ 1.05 ( 1 + A H 11 100 × δ 0.59 )
Substituting the absolute humidity (AH) and the relative air density (δ) into Equation (9), the result is Eav = 418.89 kV/m. Consequently, the approximate electric field was calculated as 2.21 × 10⁻¹⁶ V·cm2. In conjunction with Gallimberti’s model, the vibrational energy share coefficient, fv, was approximately 0.93, while the sum of the translational, rotational and electronic excitation energy share coefficients was approximately ft + fr + fe = 0.07.
In the event that the temperature of the streamer is uniform and the pressure expansion of the streamer radius is constant throughout the process of thermal ionisation, the equation considering changes in air pressure is as follows:
π a 2 T h = π δ k a 0 2 P
where Th represents the translational energy temperature; P represents the atmospheric pressure; δ represents the air density. a represents the radius of the streamer, and the radius of initial stem a0 = 8.5×10⁻⁵ m; the coefficient k is 0.10.

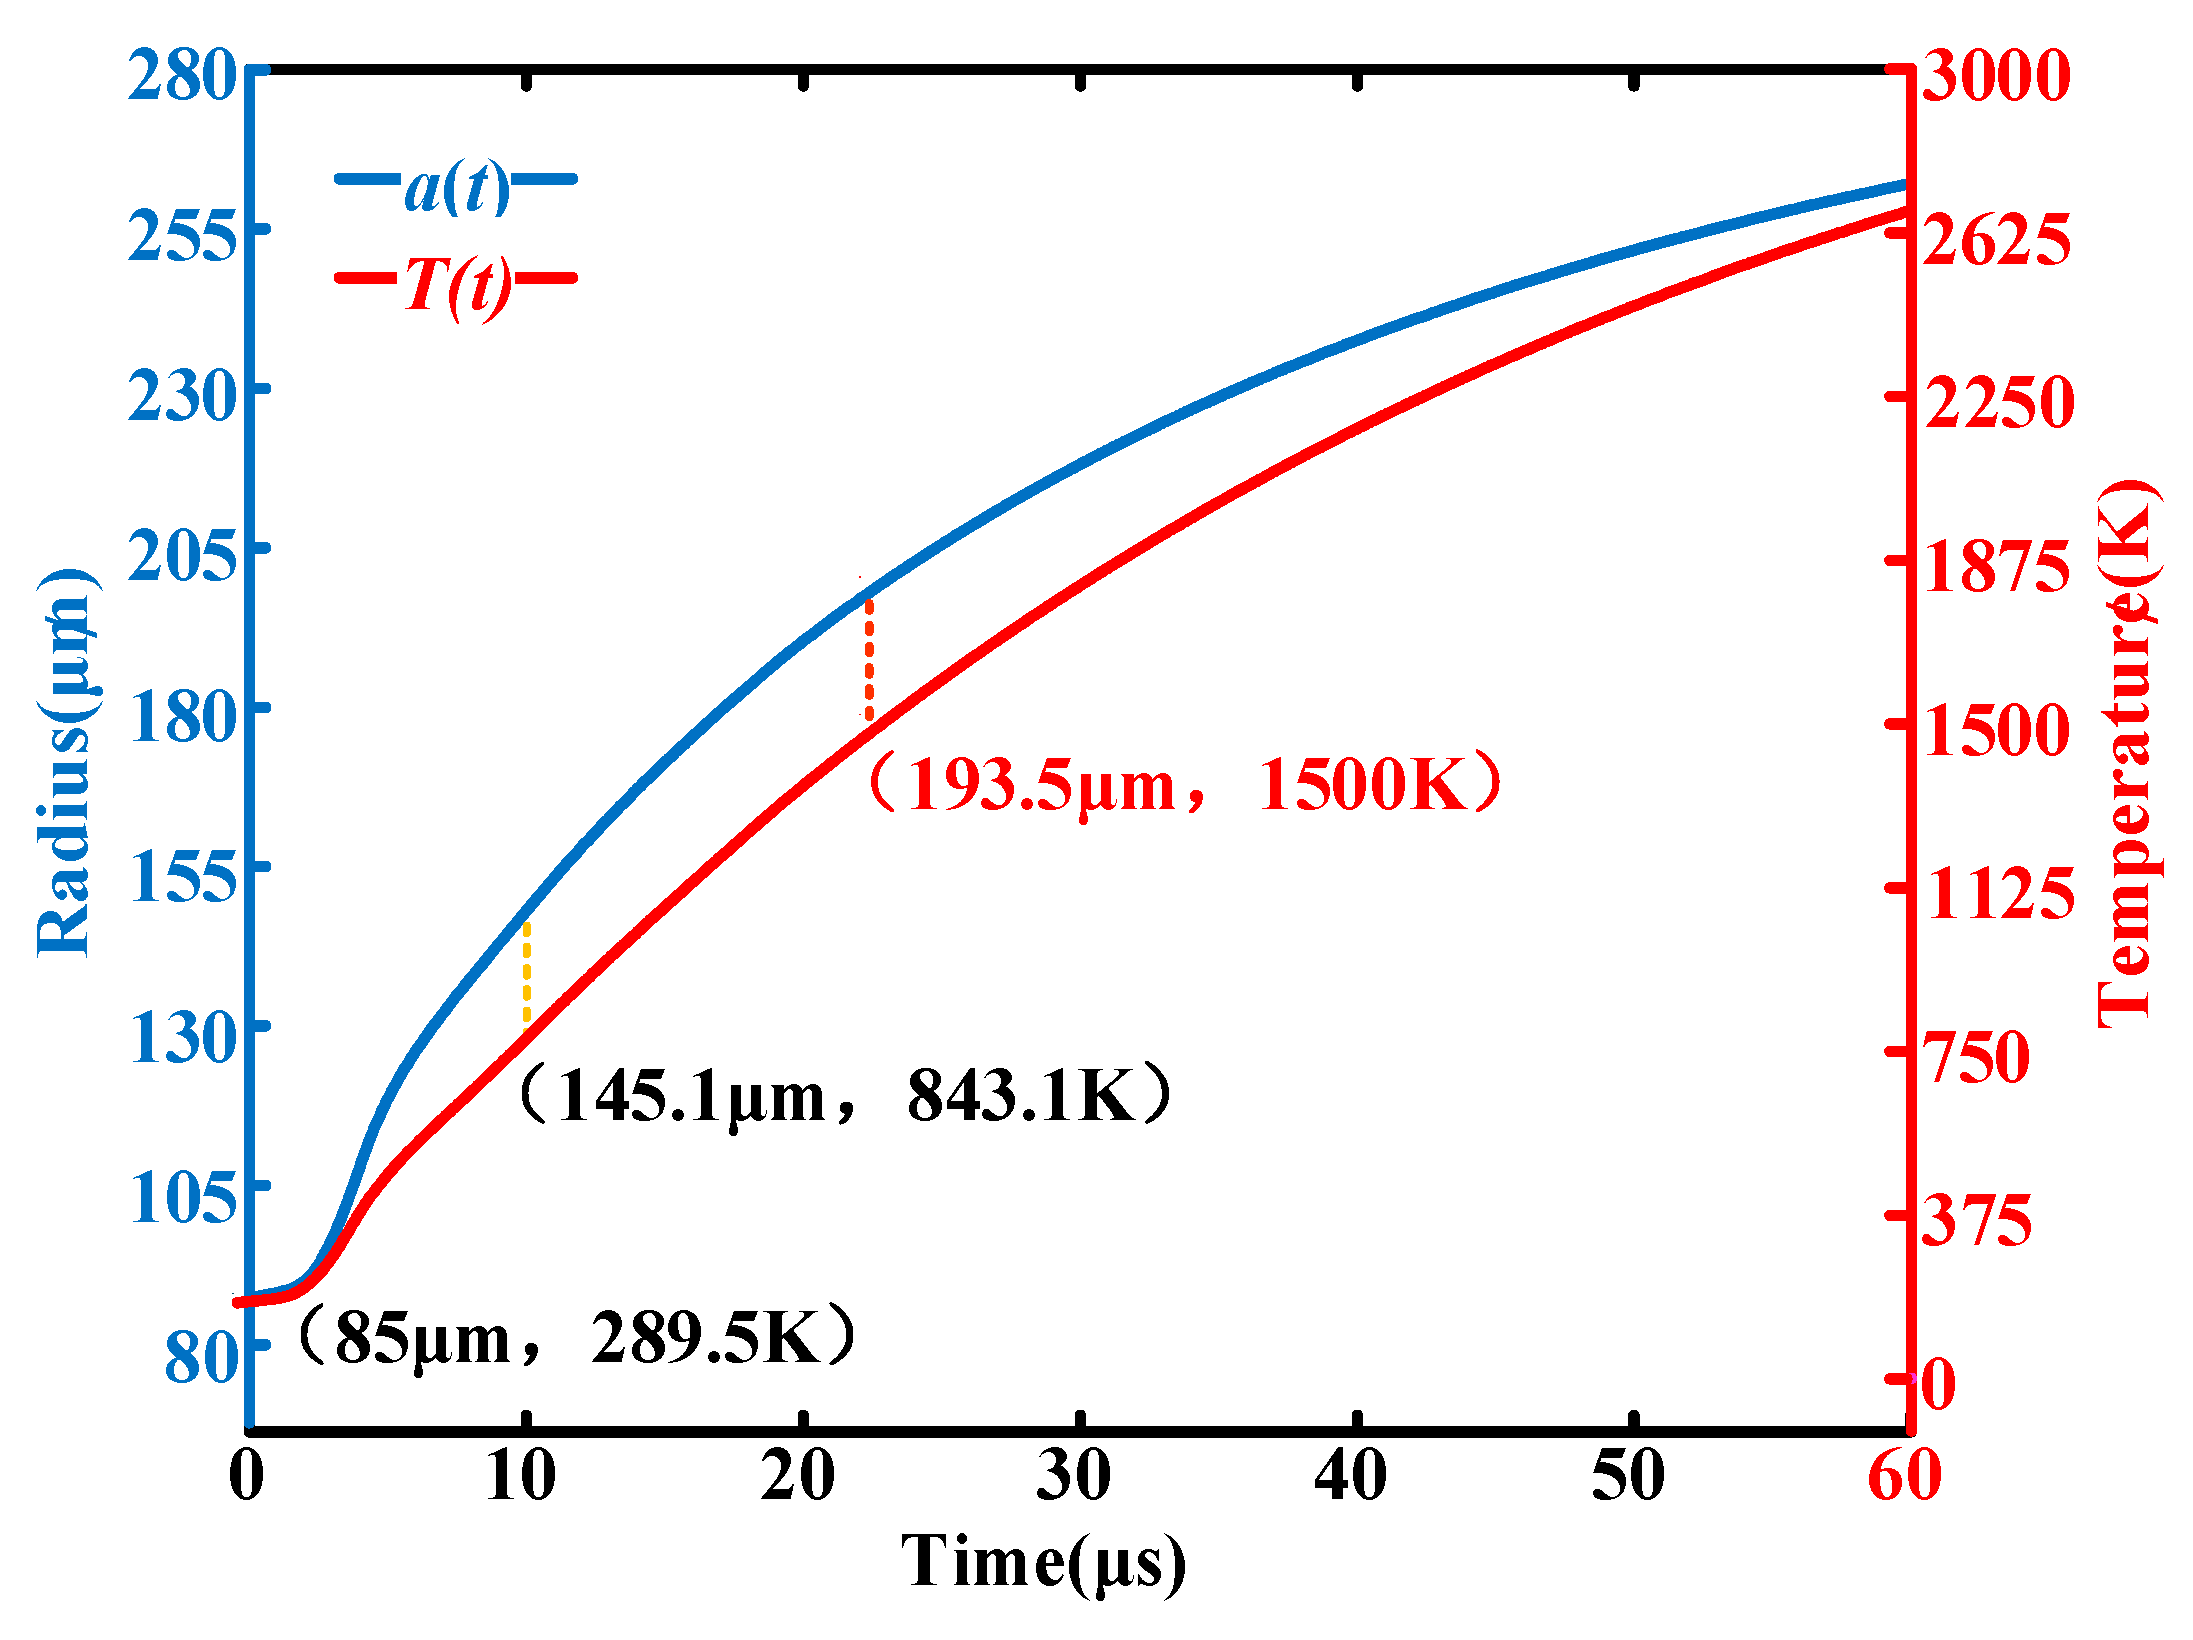
4.2.3. Modification of the Thermal Characteristics Model for Streamer-to-Leader Transition at High Altitudes

Once the aforementioned modified factors were incorporated, they were put into the Gallimberti’s model. Subsequently, the resulting values for translational energy temperature (Th) and streamer radius (a) were obtained. The specific steps of the modified model are as follows:
  • The current I(t) should be imported as an input quantity;
  • The streamer roots’ number is assumed to be n, and a single streamer’s radius is calculated according to Equation (6);
  • The central high-temperature area is determined based on the peak temperature of the streamer stem root of Tmax=1500 K and a unit radial radius of 0~5 μm, which correspond to 1425 K–1500 K;
  • Gallimberti’s model is modified based on convective diffusion and radial thermal expansion, and the modified transition duration is obtained;
  • The sudden change in the field intensity change rate during the dark period is taken as the streamer-to-leader transition criterion, and a comparison and analysis is conducted between the corrected duration tsz and the measured duration t. In the event that the absolute value of the difference between tsz and t exceeds the prescribed tolerance ε, the number of roots of the streamer stems should be iterated and the streamer stem radius r and the transition duration recalculated. Conversely, if the aforementioned difference is less than or equal to ε, the outputs will be obtained, comprising the streamer–stem radius r and the corrected time length of the transition t.

4.3. Effects of Burr Defects on Streamer-to-Leader Transition Process

In order to investigate the influence of burr defects on the streamer-to-leader transition process of the sphere–plane air gap, a 1.3 m diameter sphere containing a burr–plane with a 5 m gap at high altitude was employed. The charge test parameters were selected and incorporated into the modified model at high altitudes, enabling the time-varying characteristics to be simulated and plotted, as illustrated in Figure 6.
As illustrated in Figure 6, for the 1.3 m sphere with a surface burr–plane 5 m gap streamer-to-leader transition stage, the streamer stem central high-temperature zone initially rose to 843.1 K at a rate of 55.36 K/μs at the 10 μs mark. Concurrently, the radius of the central high-temperature zone expanded to 145.1 μm, and the central high-temperature zone then reached the critical temperature of 1500 K at a rate of 67.48 K/μs. A substantial number of free electrons were generated by the desorption of negative ions, which increased the conductivity of the channel and led to the formation of the initial leader. The maximum radius of the central high-temperature zone was 193.5 μm, the duration of the streamer-to-leader transition was simulated to be 21.71 μs, representing a discrepancy of approximately 0.79% with the measured duration of 21.54 μs.
Based on the above analysis, the typical discharge test parameters for the corresponding smooth sphere–plane air gap were also substituted into the modified model at high altitudes, followed by the temperature rise rates of the sphere–plane with burrs v′1.3–5, the smooth sphere–plane v1.3–5, the stem radial expansion rate of the streamer of the sphere–plane with burrs g′1.3–5, the smooth sphere–plane streamer stem radial expansion rate g1.3–5, the radius of the central high-temperature region of the sphere–plane with burrs a′1.3–5, the radius of the central high-temperature region of the sphere–plane without burrs a1.3–5, the time required for the sphere–plane with burrs Δt1.3–5 and the required time for the smooth sphere–plane Δt1.3–5, to compare and analyse the radial expansion rate and temperature rise rate when the temperature increased from room temperature 289.5 K to 1300 K~1500 K, as shown in Table 3.
As shown in Table 3, when the central high-temperature zone reached the criterion of 1500 K, the temperature rise rate v1.3–5, the radial expansion rate g1.3–5, and the maximum radius of the central high-temperature zone a1.3–5 were 55.76 K/μs, 8.91μm/μs, and 193.50 μm, respectively, which are increases of 83.96%, 97.56%, and 8.03% compared to the results of the smooth sphere–plane. Therefore, the time required for the sphere–plane with burrs to reach 1500 K was shorter than that for the smooth sphere–plane gap. For a 5 m air gap between a 1.3 m sphere and a plane at high altitudes, the simulation time for the transition of the sphere with burrs was 45.64% shorter than that for the smooth sphere.
A further comparative analysis of the characteristics of the central high-temperature zone at three temperatures of 1300 K, 1400 K, and 1500 K shows that the radial expansion rate and temperature rise rate at each temperature of the 1.3 m diameter sphere–plane 5 m gap discharge channel with burrs were higher than those of the 1.3 m diameter smooth sphere–plane 5 m gap. The central high-temperature zone’s maximum radius of the former was greater than that of the latter, but the length of the streamer-to-leader transition was shorter than that of the latter. The average values of each simulated quantity were obtained and compared for analysis, and the results still satisfy the above law. Taking 1500 K as the critical temperature, the results of the modified model calculation were compared with the experimental results, as shown in Table 4. It can be seen that the modified model and the experimental results basically agree, with an error margin below 1.50%.

5. Conclusions

This paper presents the results of a switching impulse discharge test conducted on a 1.3 m diameter sphere–plane with a 5 m gap at an altitude of 2200 m. The key physical parameters of the streamer-to-leader transition were statistically calculated, and a modified model at high altitudes was established. The impact of burr defects on the streamer-to-leader transition of a sphere–plane long air gap was investigated, and the conclusions are as follows:
  • According to the typical optical–electrical characteristic curve obtained from the long-gap discharge test, at an altitude of 2200 m, the discharge stages of a 1.3 m diameter sphere–plane 5 m gap with and without burrs can be divided into four stages: initial streamer, dark period, leader development, and end-jump breakdown. The burr defects greatly reduced the duration of the streamer-to-leader transition;
  • A comparative analysis of the temperature of the vibrational energy and translational energy of the streamer channel in the presence and absence of electrode burr defects was carried out to explore the transformation process of vibrational energy and translational energy. The presence of burr defects caused the peak value of the vibrational energy temperature Tv to lag, the rate of increase in the vibrational energy and translational energy temperature to increase, and the duration of the streamer-to-leader transition to decrease;
  • A modified model considering convective diffusion and thermal expansion at high altitudes is proposed. The influence of burr defects on the streamer-to-leader transition was analysed. Overall, burr defects reduced the time of the streamer-to-leader transition and made discharge easier. These conclusions are basically consistent with the results obtained from the analysis of the experimental data.

Author Contributions

Conceptualization, L.L. and H.W.; data curation, H.W. and Z.Z.; methodology, G.L.; writing—original draft preparation, H.W.; writing—review and editing, J.G.; supervision, L.L., J.G., and Z.Z.; All authors have read and agreed to the published version of the manuscript.

Funding

This research was supported by the National Engineering Research Center of UHV Technology and New Electrical Equipment (project number: 1500002023030103GY00274).

Data Availability Statement

The data are contained within this article.

Conflicts of Interest

The authors declare no conflicts of interest.

References

  1. Liu, Z.; Zhang, Q. Study on the Development Mode of National Power Grid of China. Proc. CSEE 2013, 33, 1–10. [Google Scholar]
  2. Xin, B.; Li, M.; He, J.; He, J.; Sun, W. Research on Security Defense System of New Power System. Proc. CSEE 2023, 43, 5723–5732. [Google Scholar]
  3. Zhou, Y.; Chen, J.; Zhang, N.; Zhang, Y.; Teng, C.; Huang, X. Opportunity for Developing Ultra High Voltage Transmission Technology Under the Emission Peak, Carbon Neutrality and New Infrastructure. High Volt. Eng. 2021, 47, 2396–2408. [Google Scholar]
  4. Liu, P.; Zhang, J.; Xie, L.; Li, Y.; Liu, C.; Peng, R. Study on Corona Characteristics and Type Selection of UHV Substation Conductor in 4000 m High Altitude Area. High Voltage Eng. 2023, 49, 2919–2928. [Google Scholar]
  5. Tu, H.; Fang, Y.; Li, E.; Yang, B.; Fang, J.; Zhang, X. Characterization of Sphere-plane Gap Discharge and Correction Method of Discharge Voltage Under Reduced Air Pressure. High Voltage Eng. 2024, 50, 3580–3588. [Google Scholar]
  6. Wei, X.; Zong, W.; Wang, G.; Cao, J. Experimental Studies on Switching Impulse Flashover Characteristics of External Insulation and Altitude Correction Methods for ±1100 kV UHVDC Converter Valves. Proc. CSEE 2014, 34, 1996–2003. [Google Scholar]
  7. Wang, S.; Kang, J.; Qu, Q.; Yu, X.; Bao, Z.; Li, Z. Study on Operation Adaptability of External Insulation in ±400 kV Qinghai-Tibet DC Transmission Lines in High Altitude Areas. High Voltage Eng. 2019, 45, 152–158. [Google Scholar]
  8. Meng, X.; Hui, J.; Bian, X.; Chen, F.; Wang, L.; Guan, Z.; Chen, Y. Research on the Characteristic of Streamer Discharge at Low Air Pressure. Proc. CSEE 2011, 31, 139–149. [Google Scholar]
  9. Menemenlis, C.; Harbec, G.; Grenon, J. Switching impulse corona inception and breakdown of large high-voltage electordes in air. IEEE Trans. Power Appar. Syst. 1978, 97, 2367–2374. [Google Scholar] [CrossRef]
  10. Lv, F.; Zhao, Y.; Wang, P.; Ding, Y.; Qin, Y.; Geng, J.; Xu, J.; Zhu, Y. Effect of Burr Defect on Sphere Surface on Switching Impulse Discharge Characteristics of Sphere-plane Gap. Insul. Mater. 2018, 51, 82–86. [Google Scholar]
  11. Geng, J.; Lv, F.; Ding, Y.; Zhao, Y.; Li, P.; Wang, P. Influences of surface tips of a shield ball on the discharge char-acteristics of a long sphere-plane air gap under positive switching impulses. IET Sci. Meas. Technol. 2018, 12, 902–906. [Google Scholar] [CrossRef]
  12. Renardieres, L.G. Research on long gap discharges at Les Renardieres—1973 results. Electra 1974, 35, 49–156. [Google Scholar]
  13. Renardieres, L.G. Positive Discharge in Long Air Gaps at Analysis of the discharge Renardieres—1975 Results and Conclusions. Electra 1977, 53, 31–153. [Google Scholar]
  14. Gu, S.; Chen, J.; Chen, W.; Ding, Z.; He, H.; Qian, G. Establishment of Integrated Observation System for Long Air Gap Discharges. High Voltage Eng. 2009, 35, 2640–2646. [Google Scholar]
  15. Wang, Z.; Zhuang, C.; Zhang, Y.; Zeng, R. Measurement of Streamer Propagation Velocity Based on Photomultiplier. High Voltage Eng. 2018, 44, 920–925. [Google Scholar]
  16. Yue, Y.; He, J. Digital time-resolved optical measurement of discharge currents in longair gaps. Rev. Sci. Instrum. 2013, 84, 223–558. [Google Scholar] [CrossRef]
  17. Hidaka, K.; Kouno, T. A method for measuring electric field in space charge by means of pockels device. J. Electrost. 1982, 11, 195–211. [Google Scholar] [CrossRef]
  18. Geng, Y.; Zhuang, C.; Zeng, R.; Wang, F. Streamer Inception Time Delay Characteristics Under Positive Lightning Impulse Voltage. Proc. CSEE 2013, 33, 164–169. [Google Scholar]
  19. Wang, P.; Chen, Y.; Yao, X.; Ding, Y.; Geng, J.; Lv, F.; Jiang, L.; Shi, W. Discharge Conversion Characteristics of Large Size Sphere-plane Gap Under Positive Switching Impulse Voltage at Altitude of 2200 m. Proc. CSEE 2023, 43, 6112–6123. [Google Scholar]
  20. Cheng, C. Experimental Observation Study on Thermal Characteristics of Positive Streamer to Leader Transition Process. Master’s Thesis, Huazhong University of Science & Technology, Wuhan, China, 2019. [Google Scholar]
  21. Zhao, X.; Liu, X.; Yang, Y.; Wang, X.; Liu, Y.; He, J. Observations of the channel illuminations during dark periods in long positive sparks. Geophys. Res. Lett. 2021, 48, 1–8. [Google Scholar] [CrossRef]
  22. Gallimberti, I. The mechanism of the long spark formation. Journal de Physique Colloques 1979, 40, 193–250. [Google Scholar] [CrossRef]
  23. Gallimberti, I.; Bacchiega, G.; Bondiou-Clergerie, A.; Lalande, P. Fundamental processes in long air gap discharges. C. R. Phys. 2002, 3, 1335–1359. [Google Scholar] [CrossRef]
  24. Geng, J.; Chen, Y.; Wang, P.; Ding, Y.; Lv, F.; Xiao, Z.; Liu, X.; Zhang, B. Streamer-to-leader Transition Model of Sphere-plane Long Air Gap at Positive Switching Impulse Voltage. Proc. CSEE 2021, 41, 2919–2928. [Google Scholar]
  25. Zeng, R.; Chen, S. The dynamic velocity of long positive streamers observed using a multi-frame ICCD camera in a 57 cm air gap. J. Phys. D Appl. Phys. 2013, 46, 485201. [Google Scholar] [CrossRef]
  26. Cheng, C.; Liu, L.; He, H.; Luo, B.; He, J. Experimental study of the dynamics of leader initiation with a long dark period. J. Phys. D Appl. Phys. 2020, 53, 205–213. [Google Scholar] [CrossRef]
  27. Cui, Y.; Zhuang, C.; Zhou, X.; Zeng, R. The dynamic expansion of leader discharge channels under positive voltage impulse with different rise times in long air gap: Experimental observation and simulation results. J. Appl. Phys. 2019, 125, 113302. [Google Scholar] [CrossRef]
  28. Pancheshnyi, S.; Nudnova, M.; Starikovskii, A. Development of a cathode-directed streamer discharge in air at different pressures: Experiment and comparison with direct numerical simulation. Phys. Rev. E 2005, 71, 016407. [Google Scholar] [CrossRef]
  29. Bazelyan, E.; Raizer, Y.; Aleksandrov, N. The effect of reduced air density on streamer-to-leader transition and on properties of long positive leader. J. Phys. D Appl. Phys. 2007, 40, 4133–4144. [Google Scholar] [CrossRef]
  30. Ma, X.; Zhuang, C.; Wang, Z.; Zeng, R. Positive Leader Velocity and Discharge Current Considering Leader Branching Under Different Air Pressures. IEEE Trans. Plasma Sci. 2019, 47, 1939–1943. [Google Scholar] [CrossRef]
  31. Wang, P.; Xiao, Z.; Geng, J.; Ding, Y.; Yao, X.; Lv, F. Streamer Discharge Characteristics of Long Air Gap Between Ball and Plate with Burr Defects. High Voltage Eng. 2020, 46, 3591–3596. [Google Scholar]
  32. Renardieres, L.G. Research on long air gap discharges at Les Renardières. Electra 1972, 38, 53–157. [Google Scholar]
  33. Abdel-Salam, M.; Zitoun, A.G.; El-Ragheb, M.M. Analysis of the discharge development of a positive rod-plane gap in air. IEEE Trans. Power Appar. Syst. 1976, 95, 1019–1027. [Google Scholar] [CrossRef]
  34. Dean, G. The maximum voltage gradient in a spark gap in terms of the radius of curvature of the electrodes. Gen. Electr. Rev. 1913, 16, 148–150. [Google Scholar]
  35. Schneider, H.; Turner, F. Switching-surge flashover characteristics of long sphere-plane gaps for UHV station design. IEEE Trans. Power Appar. Syst. 1975, 94, 551–560. [Google Scholar] [CrossRef]
  36. Paris, L. Influence of Air Gap Characteristics on Line-to-Ground Switching Surge Strength. IEEE Trans. Power Appar. Syst. 1967, 86, 936–947. [Google Scholar] [CrossRef]
  37. Paris, L.; Cortina, R. Switching and Lightning Impulse Discharge Characteristics of Large Air Gaps and Long Insulator Strings. IEEE Trans. Power Appar. Syst. 1968, 87, 947–957. [Google Scholar] [CrossRef]
  38. Morrow, R.; Lowke, J. Streamer propagation in air. J. Phys. D Appl. Phys. 1997, 30, 614–627. [Google Scholar] [CrossRef]
  39. Shailendra, S.; Serdyuk, Y.; Gubanski, S. Simulations of Electrical Discharges in Air Using Stabilized Drift-Diffusion Model. IEEE Trans. Plasma Sci. 2018, 46, 3031–3039. [Google Scholar]
  40. Eichwald, O.; Bensaad, H.; Ducasse, O.; Yousfi, M. Effects of numerical and physical anisotropic diffusion on branching phenomena of negative-streamer dynamics. J. Phys. D Appl. Phys. 2012, 45, 203–217. [Google Scholar] [CrossRef]
  41. Zhao, X. Research on Characteristics of the Stem in Long Air Gap Discharges under Positive Impulse Voltage. Ph.D. Thesis, Huazhong University of Science & Technology, Wuhan, China, 2017. [Google Scholar]
  42. Ribert, G.; Domingo, P.; Vervisch, L. Analysis of sub-grid scale modeling of the ideal-gas equation of state in hydrogen-oxygen premixed flames. Proc. Combust. Inst. 2019, 37, 2345–2351. [Google Scholar] [CrossRef]
Figure 1. Test arrangement of optical–electrical joint detection system.
Electronics 13 04899 g001
Figure 2. Optical–electrical characteristic curves of 1.3 m sphere–plane 5 m gap.
Electronics 13 04899 g002
Figure 3. Optical–electrical characteristic curve of 1.3 m diameter sphere with 5 mm end burr–plane 5 m gap.
Electronics 13 04899 g003
Figure 4. Tv-Tt temperature change curve of 1.3 m diameter sphere–plane 5 m gap.
Electronics 13 04899 g004
Figure 5. Tv-Tt temperature change curve of 1.3 m diameter sphere with burr–plane 5 m gap.
Electronics 13 04899 g005
Figure 6. Simulation characteristic curve of 1.3 m sphere with surface burr–plane 5 m gap streamer-to-leader transition.
Electronics 13 04899 g006
Table 1. Streamer starting voltage and leader starting voltage for the two gap structures.
Gap Structure (K)Streamer Starting Delay (μs)Streamer Starting Voltage (kV)Leader Starting Moment (μs)Leader Starting Voltage (kV)
8.25166.891552.70222.631550.27
0.9169.50967.0098.241053.88
Difference97.39585.70124.39496.39
Table 2. Parameters of vibrational and translational energy during the streamer-to-leader transition stage for two gap structures.
Gap Structuretmax-v/μsKv-I/K·μs−1Kv-II/K·μs−1Kh/K·μs−1
1.3 m diameter sphere–plane 5 m gap8.50852.65−77.4038.96
1.3 m diameter sphere with burr–plane 5 m gap12.56868.67−100.3754.23
Table 3. Simulation results of high-altitude modified model of 1.3 m sphere with surface burr-plane 5 m gap and 1.3 m smooth sphere-plane 5 m gap streamer to leader transition.
Temperature/Kv1.3–5
(K/μs)
v1.3–5
(K/μs)
g1.3–5
(μm/μs)
g1.3–5
(μm/μs)
a1.3–5
(μm)
a1.3–5
(μm)
Δt1.3–5
(μs)
Δt1.3–5
(μs)
1300 K53.6433.639.565.52180.20165.818.8430.05
1400 K56.2831.939.484.98187.10173.119.7334.78
1500 K55.7630.318.914.51193.50180.2021.7139.94
Average value55.2331.969.325.00186.93173.0320.0934.92
Table 4. Comparison of the results of the modified model with the experimental results.
Gap StructureCalculated Value (μs)Experimental Value (μs)Error
1.3 m diameter sphere–plane 5 m gap39.9440.551.50%
1.3 m diameter sphere with burr–plane 5 m gap21.7121.540.79%
Disclaimer/Publisher’s Note: The statements, opinions and data contained in all publications are solely those of the individual author(s) and contributor(s) and not of MDPI and/or the editor(s). MDPI and/or the editor(s) disclaim responsibility for any injury to people or property resulting from any ideas, methods, instructions or products referred to in the content.

