Article

Computing Unit and Data Migration Strategy under Limited Resources: Taking Train Operation Control System as an Example

1
Maglev Transportation Engineering R&D Center, Tongji University, Shanghai 201804, China
2
The Key Laboratory of Road and Traffic Engineering of the Ministry of Education, Tongji University, Shanghai 201804, China
3
Shanghai Electric Thales Transportation Automation System Co., Ltd., Shanghai 201103, China
4
Technology Center, Shanghai Shentong Metro Group Co., Ltd., Shanghai 201103, China
*
Authors to whom correspondence should be addressed.
Electronics 2024, 13(21), 4328; https://doi.org/10.3390/electronics13214328
Submission received: 24 July 2024 / Revised: 26 September 2024 / Accepted: 15 October 2024 / Published: 4 November 2024

Abstract

:
There are conflicts between the increasingly complex operational requirements and the slow rate of system platform upgrading, especially in the industry of railway transit-signaling systems. We attempted to address this problem by establishing a model for migrating computing units and data under resource-constrained conditions in this paper. By decomposing and reallocating application functions, optimizing the use of CPU, memory, and network bandwidth, a hierarchical structure of computing units is proposed. The architecture divides the system into layers and components to facilitate resource management. Then, a migration strategy is proposed, which mainly focuses on moving components and data from less critical paths to critical paths and ultimately optimizing the utilization of computing resources. Specifically, the test results suggest that the method can reduce the overall CPU utilization by 27%, memory usage by 6.8%, and network bandwidth occupation by 35%. The practical value of this study lies in providing a theoretical model and implementation method for optimizing resource allocation in scenarios where there is a gap between resource and computing requirements in fixed-resource service architectures. The strategy is compatible for distributed computing architectures and cloud/cloud–edge-computing architectures.

1. Introduction

In some real-time control domains, there is a significant gap between the computational capabilities of processing units and the requirements of high computational power, clustering, load balancing, distributed parallel computing, etc. [1,2]. For example, in the rail transportation system sector, by the end of 2022, only one system manufacturer had launched a cloud-computing platform with high computational capabilities [3], which is still in the initial stages of operation in 2024. It has become increasingly important to replace computing platforms with new ones or to upgrade existing platforms with new technologies [4]. This issue becomes even more prominent when enhancing and optimizing computational capabilities under conditions such as embedded operating systems where the underlying platform is tightly bound to hardware, with low frequency and small room of updates, and limited computational resources [5]. Therefore, a good component- and data-migration strategy is particularly critical.
System architects and specialists have conducted research from multiple perspectives, including process/thread scheduling, memory management, interface optimization, and load balancing. In terms of computing loading balance, Hu et al. [5] and Tang et al. [6] analyzed the CPU/GPU resource allocation from data flow impact and proposed a framework model for resource scheduling by modifying layers of the operating system. With regard to process/thread scheduling, Sun et al. [7] described the mathematical relationship between energy consumption, response time, and resource utilization, in order to meet the requirements of high energy efficiency and low response time. By using the distributed-flow computing theory, they modeled the data flow graph and gave a real-time and energy-saving resource scheduler based on a RE-STREAM model. In terms of memory management and interface optimization, Yang et al. [8] adopted the Kuhn–Tucker (KKT) theory and Binary Search Iterative methodology, taking time delay and energy consumption into consideration. By doing so, a Branch-and-Bound-based Overhead Minimization Offload Algorithm (BB-OMOA) was proposed to obtain the optimal offload decisions. Li et al. [9] proposed a computing-task-unloading strategy based on the gradient algorithm. They copied the subtasks to the so-called secondary unloading units (which means the edge-computing unit in this context) in case the main computing unit failed. Liu et al. [10] applied the improved genetic algorithm with penalty features to the unmanned aerial vehicle (UAV) mobile edge-computing server. Pu et al. [11] studied the inter-thread scheduling of components on the Storm platform and designed an optimal thread reallocation model and a data migration model based on the CPU usage, memory loading, and network bandwidth.
From the partial studies presented above, which specifically refer to the resource allocation [5,12], computing-resource–data matching [13,14], resource scaling [15,16], and quantitative evaluation algorithm of resource mining/utilization [17,18], it can be seen that those methodologies are kinds of “Aftermath Remediation”, i.e., they attempt to decompose and reallocate computing resources to different levels of the target program when a mismatch between computing resources and demand occurs. This could be very difficult when most of the computing resources are fixed and have clear calculation tasks pre-defined. Little room would be left for computing-resource reallocation. Another point is that in some studies [15,16,17,18,19,20], attention is paid to the cloud-computing or cloud–edge-computing architectures. Embedded safety systems, especially real-time vital control systems which are widely used in the railway transit industry, are rarely mentioned. Furthermore, certain studies [6,7,8,9,10] further revealed an optimization path on a CPU/GPU load-balancing algorithm. In those articles, a research direction of resource-consuming optimization on a cluster is pointed out. However, the scope of work is limited to the main processor (software or hardware). No analysis is put in place on how to conduct a collaborative optimization from the overall system scope. So, it needs further verifications targeting the effectiveness through real engineering projects. Lastly, the critical computing path [11] and critical links [21,22] are determined via the time required from the longest range of dependent activities; thus, accordingly, the critical path method (CPM) algorithm is used to schedule those activities.
This paper attempts to fill up the gap described above: It encapsulates the entire real-time control subsystem as a “node”. A node is responsible for assembling all calculating units to form a complete functional chain; it encapsulates a set of software components as a “computing unit”. A computing unit is responsible for implementing one or more specific functions. By connecting data streams involving inter-unit and intra-unit communication resources through nodes and computing units, a critical computing path strategy is formed, and the computing consumption along the path is calculated. On this basis, a principle regarding component and data migration can be defined, and thus the migration strategy model is established and followed by an experimental analysis with conclusions. To summarize, the contributions of this paper are as follows:
(1)
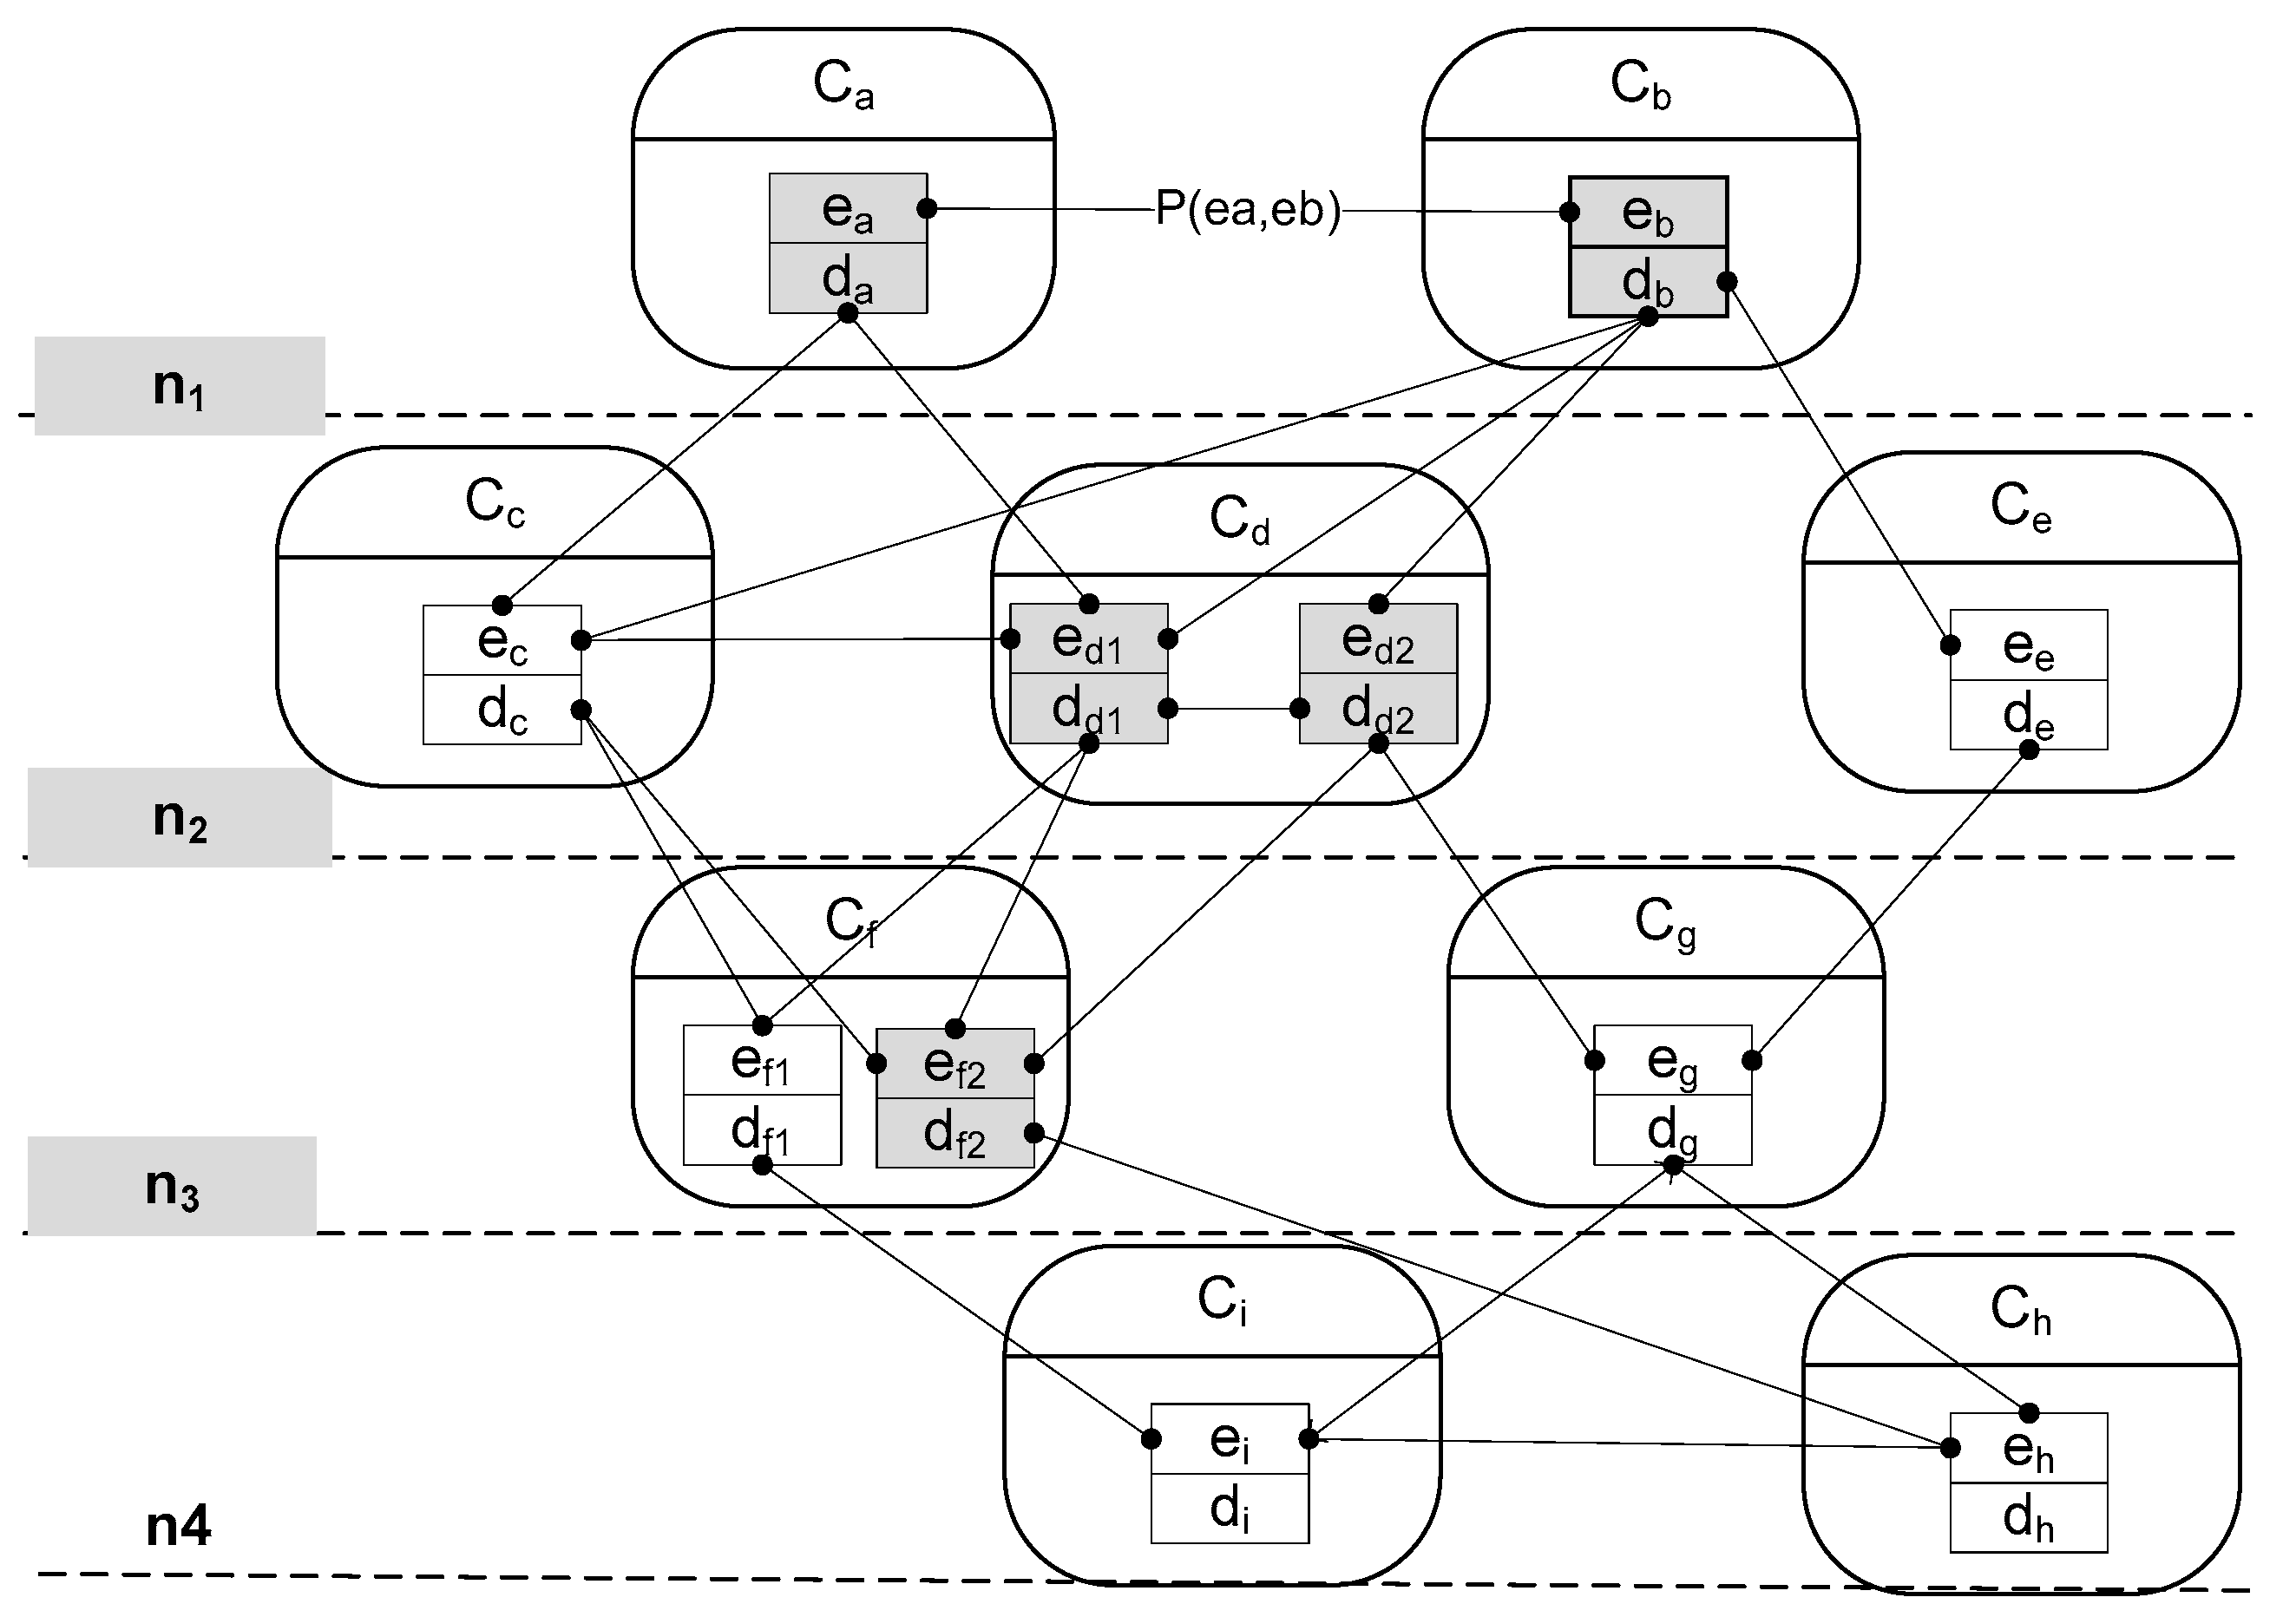
A hierarchical architecture of computing units and data abstraction is formed under limited computing resources. It abstracts real systems into a data-processing-and- transmission model, which is composed of nodes, components, data, and data flow;
(2)
A resource consumption calculation method is created. The method establishes a data migration model and lists migration criteria under resource constraints. The attributes of resource consumption, i.e., a combination of CPU usage, RAM occupancy, and network bandwidth demand, are added to the critical computing path;
(3)
A computing unit and data migration method is proposed. This method optimizes the resource cost by placing associate components/data from non-critical paths to the critical paths and transforms the path between nodes into the path within nodes.
Real-time vital control systems are emphasized in this paper, while the next step can be set to create a general migration algorithm with more compatible and configurable features, e.g., weighing the software’s cycloramic complexity, cybersecurity measurement cost, etc., into the algorithm. From a methodological perspective, it can be summarized as how to define low coupling interfaces between components in software detail design, and how to adjust function allocation from a node perspective to make it highly cohesive.
With regard to this paper’s structure, Section 1 is the introduction of this article, including the background, literature review, and innovations; Section 2 presents an abstract hierarchical architecture of computing units and establishes a path-based resource consumption model through suggested critical paths; Section 3 demonstrates the path cost after migration activities and puts forward the basic migration criteria and migration strategies; Section 4 provides the specific algorithm and steps of components and data migration; The effectiveness and correctness of the algorithm is tested in Section 5; and Section 6 provides conclusions and information related to this paper.

2. System Abstraction

In order to analyze the computing units and their data redistribution based on limited computing resources, this Section introduces a hierarchical architecture, which decomposes computing units into nodes (subsystem layer), components (functional modules in computing units), data, and data flows and then generalizes the architecture into a data-processing and -transmission collaboration diagram. Finally, it establishes a path-based resource consumption model through critical transmission paths and provides a theoretical basis for the following component and data migration strategies.
Security control systems and security-critical systems share common features, including real-time monitoring, emergency response, access control, logging, and record-keeping. What makes safety-critical systems different from safety control systems is that safety-critical systems must meet the requirements of safety integration level 4’s requirements (SIl4), which is the highest safety level of a controller.

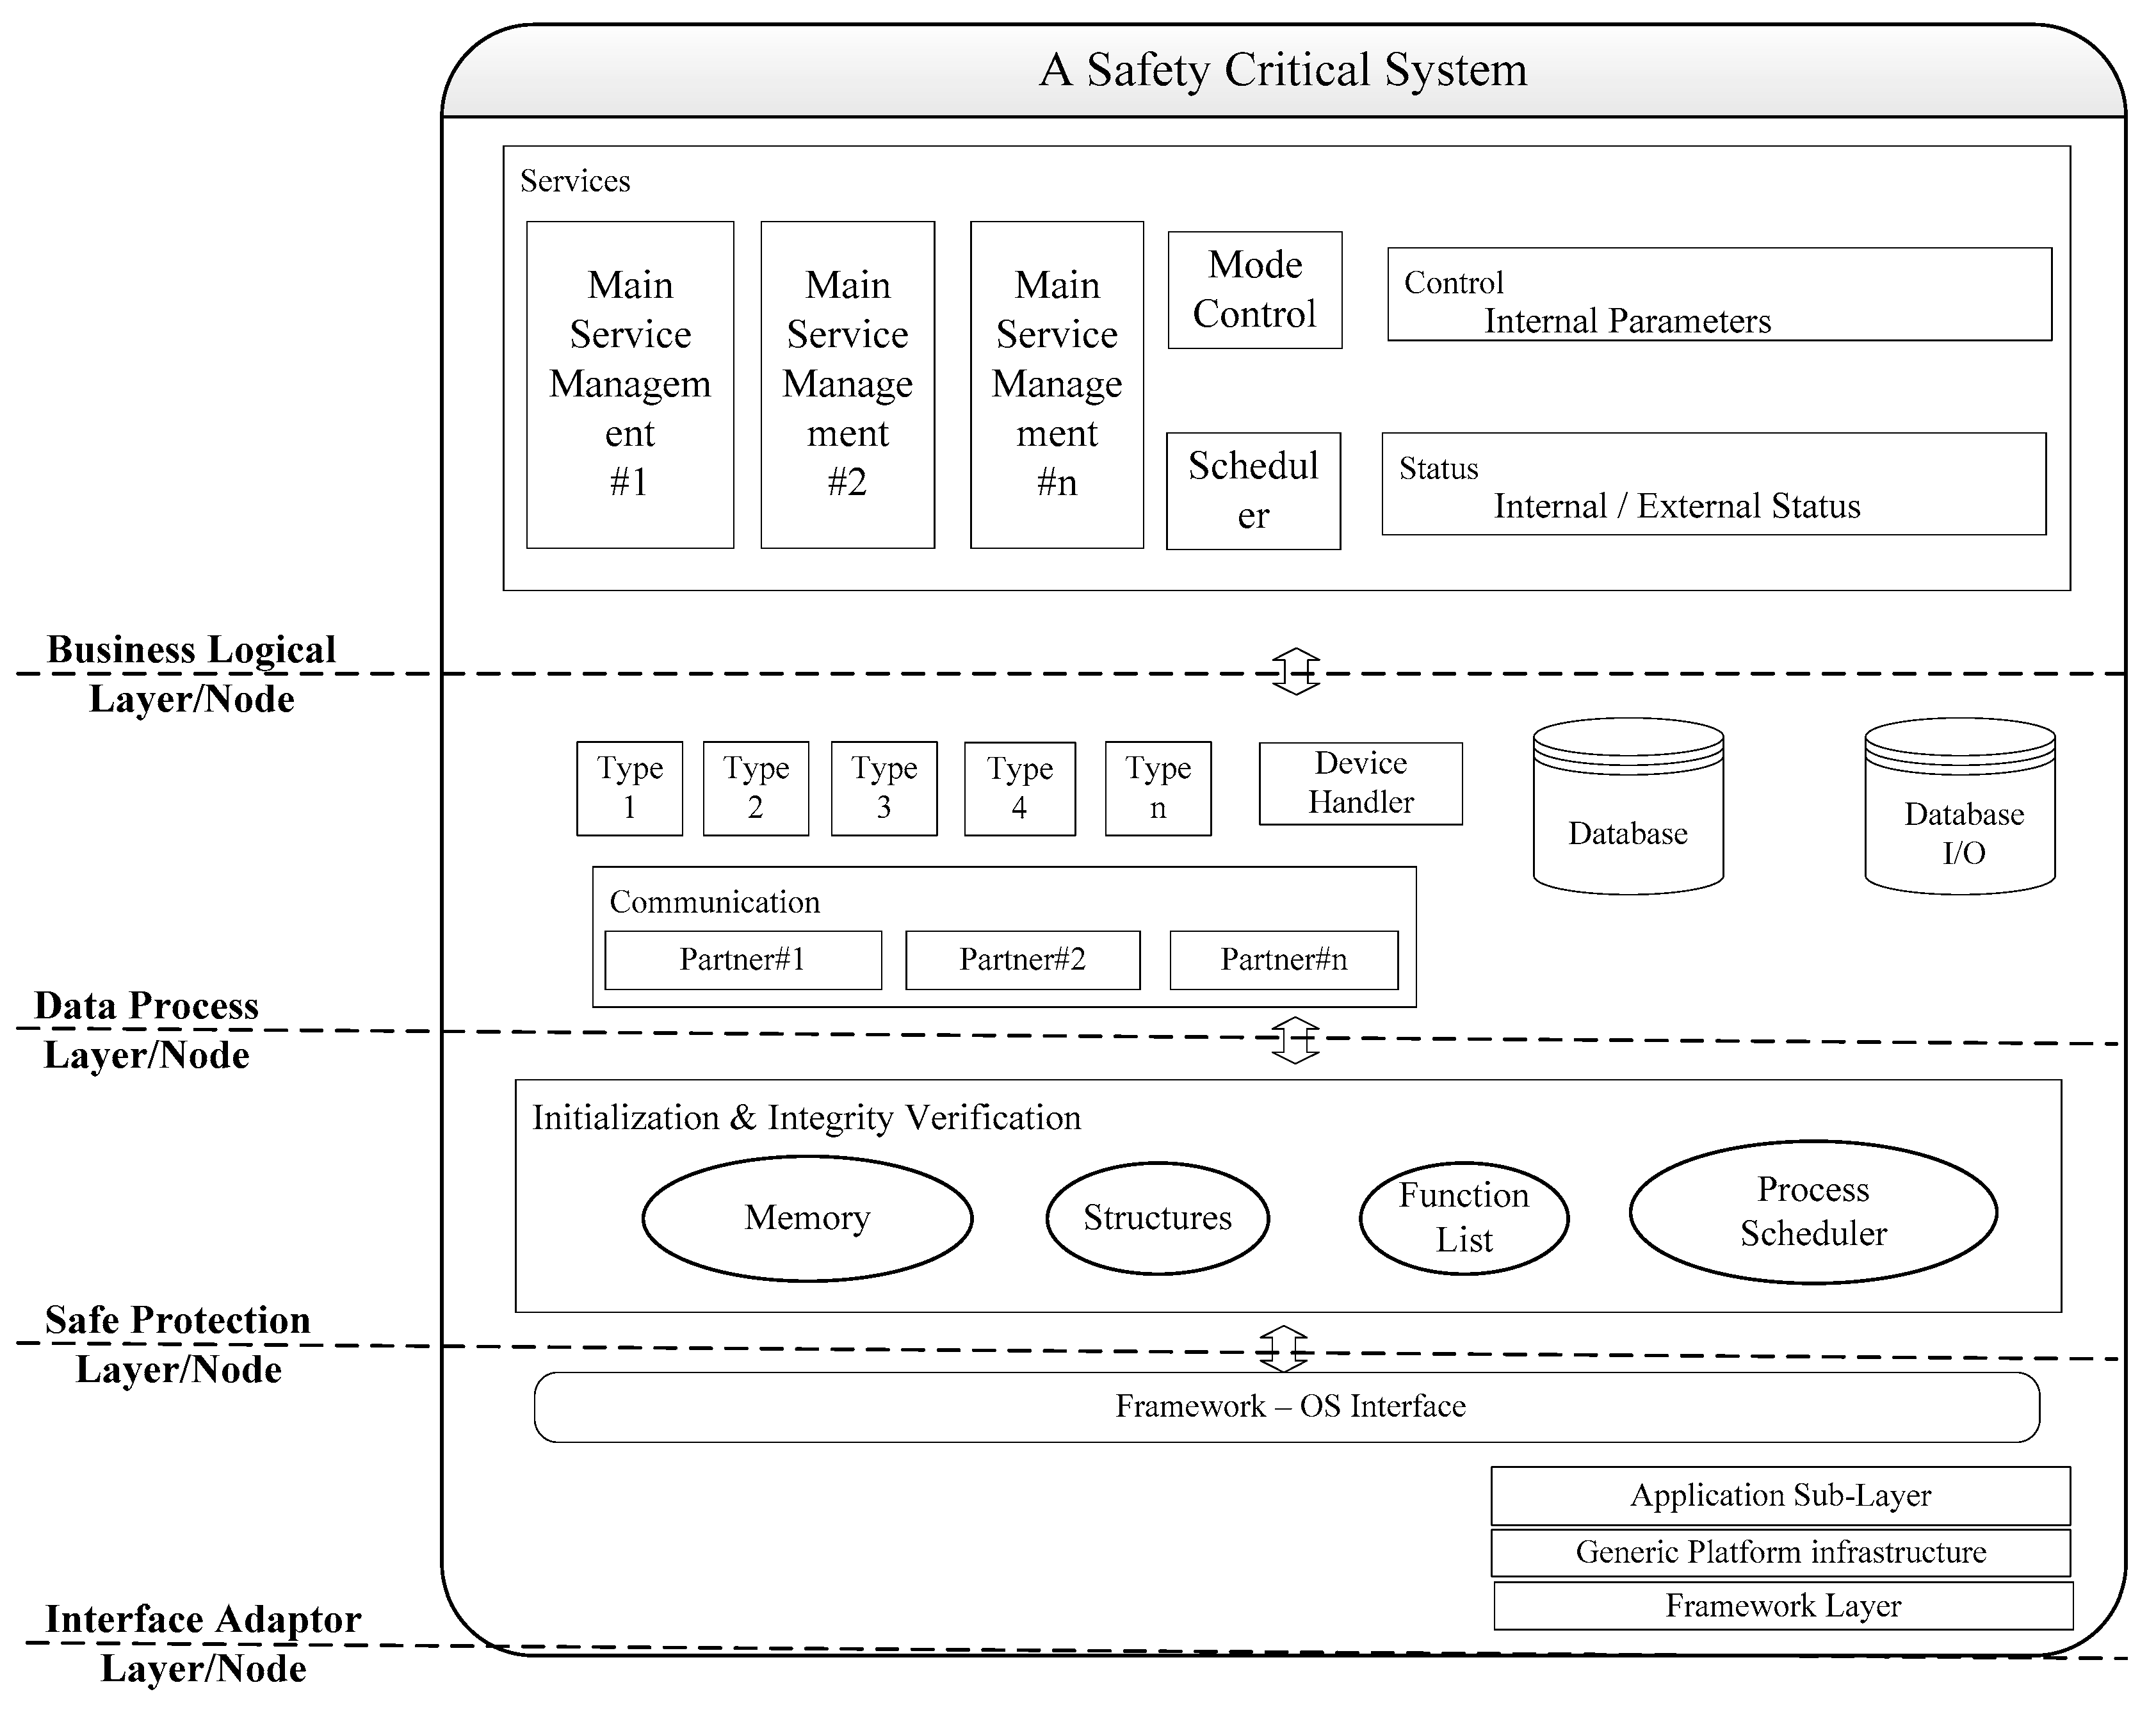
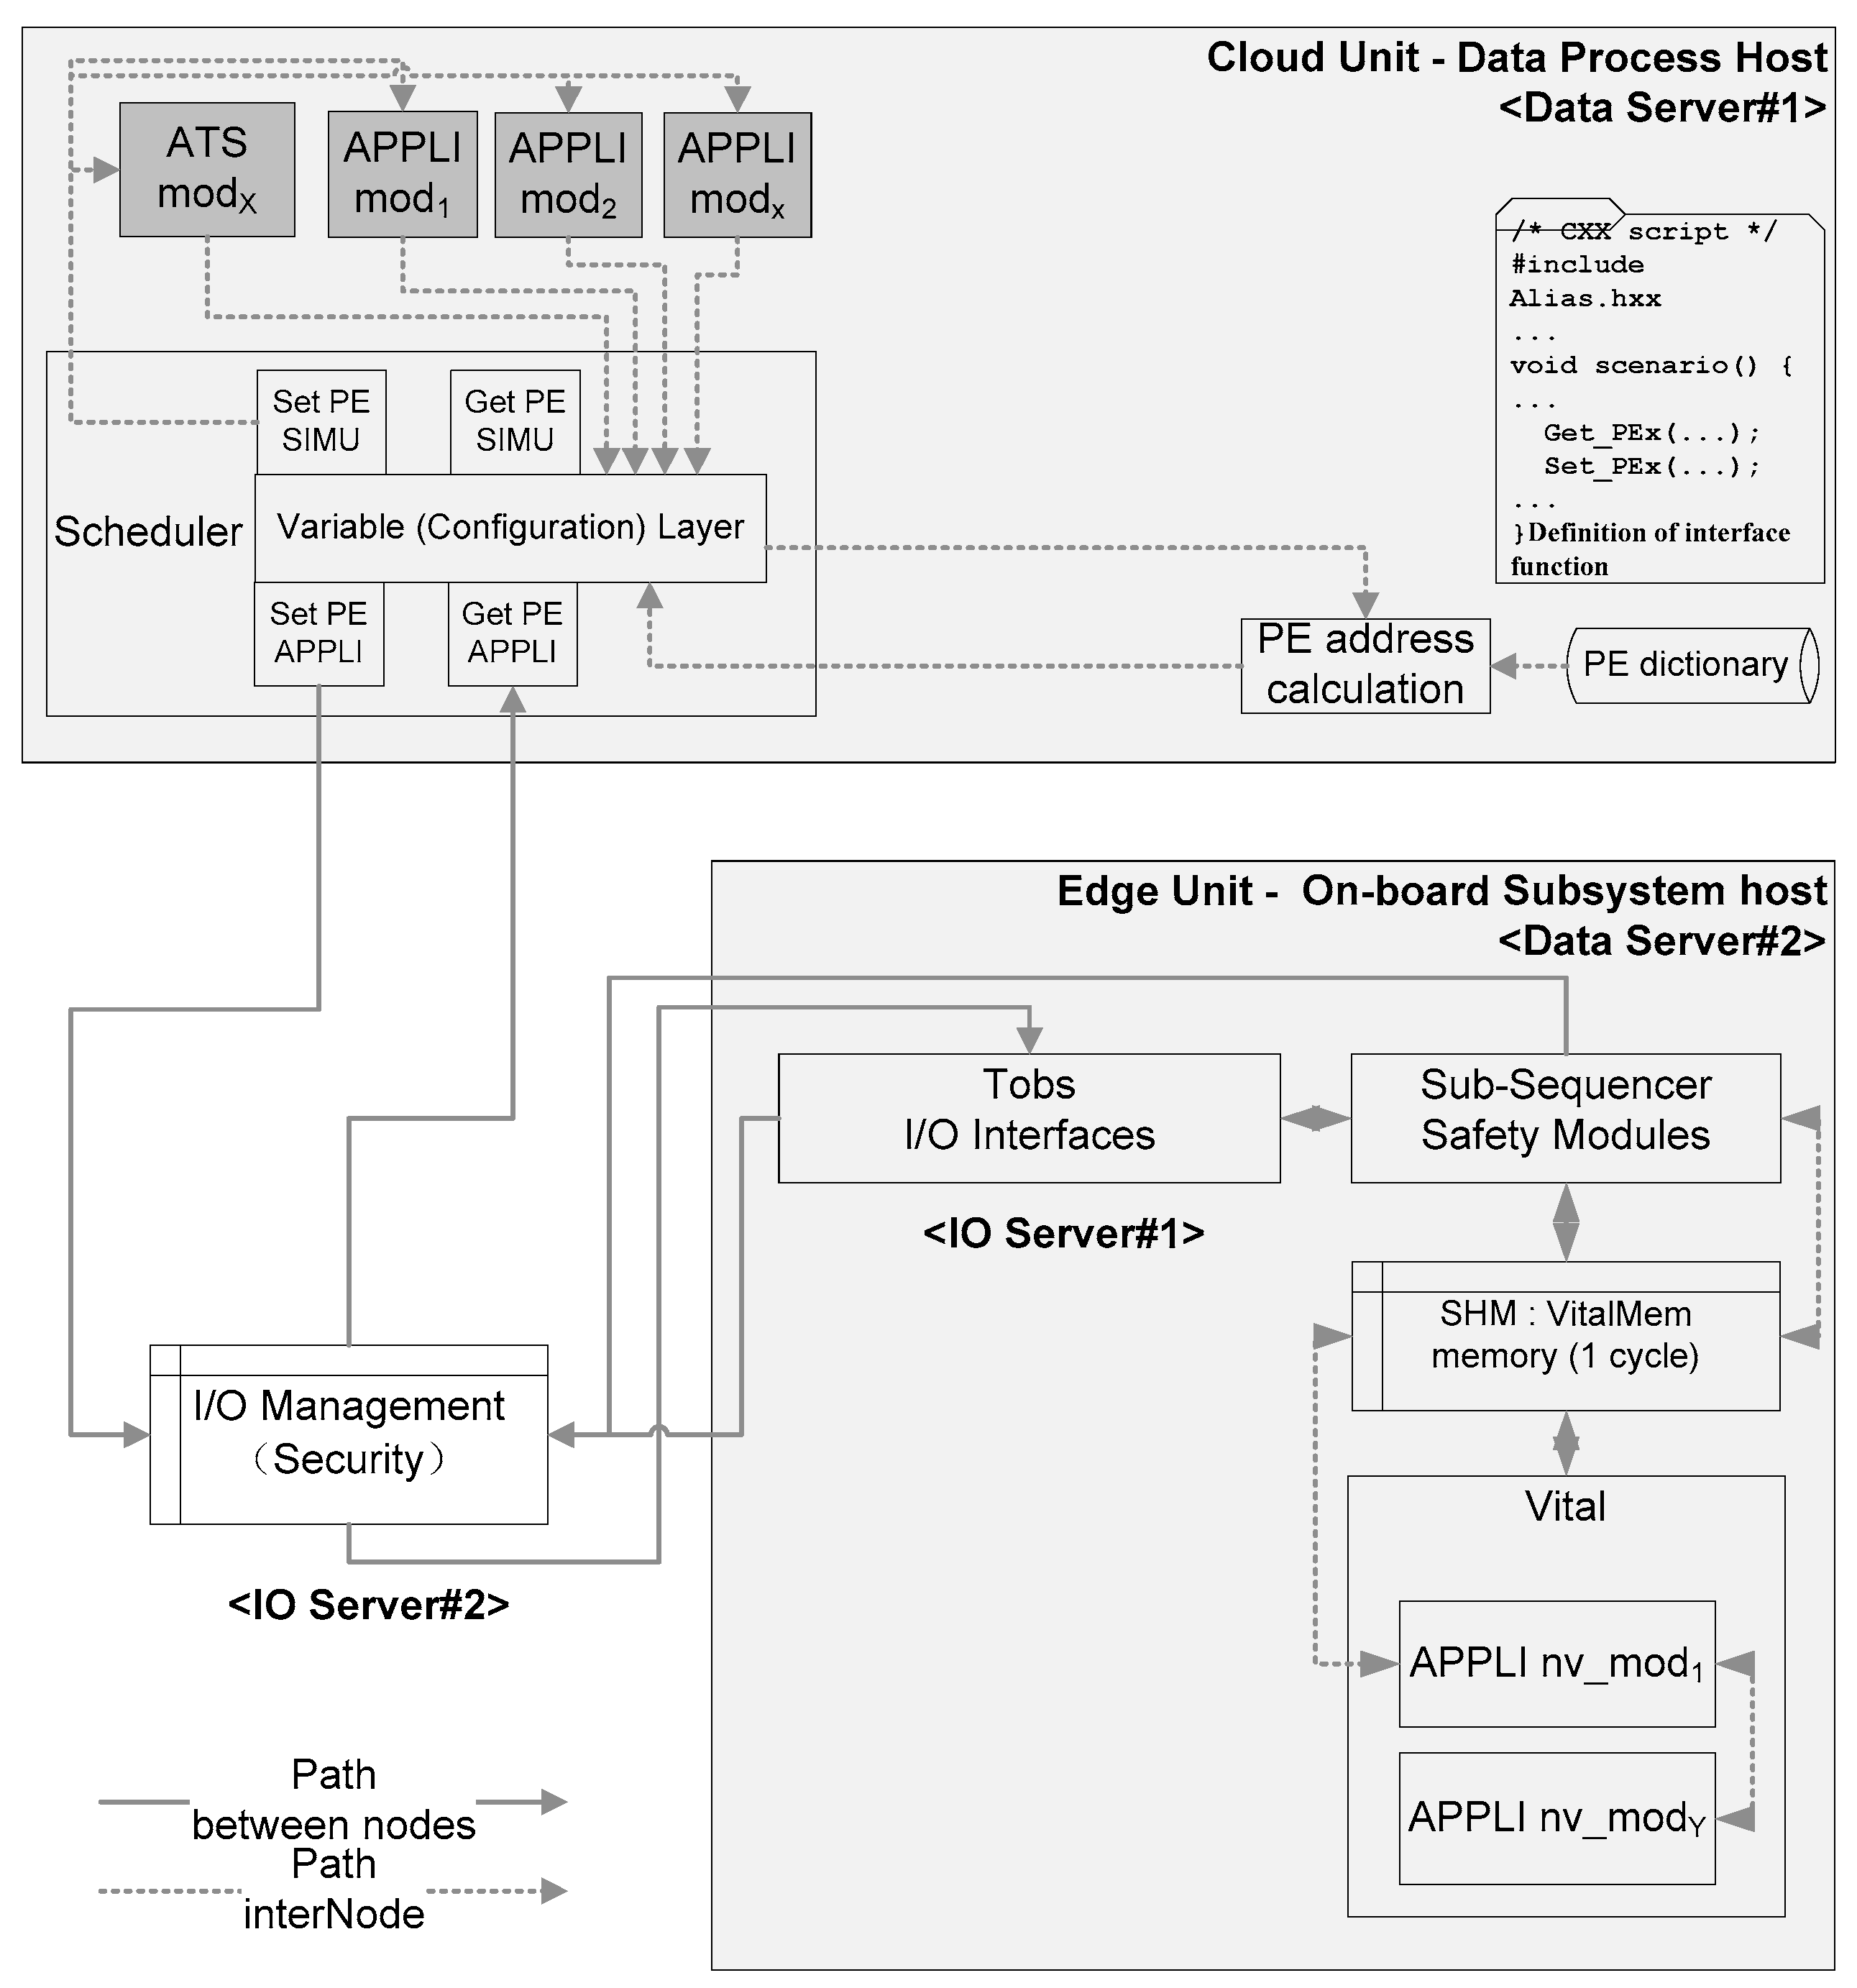
2.1. Hierarchical Architecture of Computing Units

Based on actual business requirements, we transform a typical safety-critical system into an abstracted, hierarchical architecture of computing units. According to the functional deployment, a typical safety-critical system is composed of business logic units, safety protection logic units, data storage units, and external interface adaptors, as shown in Figure 1.
Figure 1 shows a typical safety-critical train control system in the railway transit industry. From the top down, it contains all necessary functions, including the 2-out-of-3 main processors with a scheduler engine on the top, data management modules, system parameters for applications and operating systems, and hardware drivers for all peripheral equipment. The safety-critical system in Figure 1 can be abstracted into four layers, which are defined as nodes. Each layer (node) has several processing units (e.g., “services” in Figure 1 “business logic layer”), which are defined as computing units. There are several modules in a unit (e.g., “Mode Control” in Figure 1 “services” unit), which are defined as components. Based on the above, the computing unit architecture can be generalized as a hierarchical architecture with topological connections between nodes and components, as shown in Figure 2.

2.2. Object Definition and Analysis

For Figure 2, a symbol list is established, and the concept definitions with descriptions are given, as shown in Table 1.
Definition 1 (Node and Computing Unit). 
Set computing unit C = C a ,   C b , C c C n , then
N C = n 1 ,   n 2 , n 3 n m ,
is a dataset of the unit  C , and we call  N C  a node. The node is composed of software-computing units corresponding to a layer in Figure 2’s hierarchy. For instance, in Figure 2, there are four nodes:  n 1 ,  n 2 ,  n 3 , and  n 4 , and node  n 2  has three computing units:  C c ,  C d , and  C e .
Definition 2 (Computing Unit, Relationship between Computing Units). 
For  C j C ,
E C = { e j 1 , e j 2 , e j 3 , e j i } ,
where  e j i  represents a component, which is responsible for the calculation of specified function items, and represents the  i th component running in computing unit  C j .
Therefore, the architecture in Figure 2 consists of 4 nodes, including 9 computing units, 11 components, and 19 data flow paths. Meanwhile, we can define the starting point of the data flow as the parent component and the ending point as the child component. For example, component e b in Figure 2 is the parent component of the component set { e c , e d 1 , e d 2 , e e } , and component e g is a child component of the component set { e d 2 , e e } .
Definition 3 (Data, Data-Component Relationship). 
Set
D n = { d j 1 , d j 2 , d j 3 , d j i } ,
represents data  d j i    allocated to node  n , where  d j i  represents the corresponding data deployed to component  e j i .  For example,  { d f 1 ,   d f 2 }  in Figure 2 are allocated to components  { e f 1 ,   e f 2 } . And data here represent local variables, static variables, constants, logical macro definitions, and data structures defined in real software components. The relationship between components and data should not be affected by migration strategies because the components–data relationship should be considered as an inherent characteristic brought from business logic requirements.
Definition 4 (path, path attributes). 
Set the data flow in the component as a path. A path refers to a sequence of elements that leads from one point to another within a system or structure. In this context, it represents the data flow or call relationship between functions, which can be recorded as  p ( e j i , e m n ) . It stands for a path starting from  e j i  and ending up with  e m n .
According to the directional graph connectivity property [23], a path can obtain any sub-path, i.e., p p e j i , e m n , r p   s . t .   p j r p e j i , e m n . Similarly, this expression can be deduced, as for p k , l p e j i , e m n , if k j , then m P , s . t .   p m ,   k p e j i , e m n . Furthermore, if i = j , then m P , s . t . p l , m p e j i , e m n .

2.3. Computing-Resources Consumption on Computing Path

If the resource consumption on path p e j i , e m n is denoted as S p ( e j i , e m n ) , then the total cost of all components e and all directed edges f (see symbol in Table 1) from the beginning of the path to the end can be used to obtain the Equation below:
S p e j i , e m n = e j i E p e j i , e m n e j i + f j i F p e j i , e m n f j i .
It can be understood that the required resource S p e j i , e m n for computing e j i , e m n is the sum of resources consumed by all logical operations and data processing e j i E p e j i , e m n e j i and the resources consumed by data transmission within and between all components f j i F p e j i , e m n f j i . Furthermore, if there are n paths from e j i to e m n within the entire topology, the path with the largest resource consumption can be defined as follows:
S p m a x e j i , e m n = max S p 1 e j i , e m n ,   S p 2 e j i , e m n S p n e j i , e m n .
Equation (4) gives the relationship between computing-resource consumption and path. We can see that resources are represented by algebraic symbols, while in the real world, the related studies [7,24,25] have pointed out that three kinds of computing resources are most “key but scarce” in terms of computing, including (1) computing power for high-frequency real-time computing CPU, (2) memory capacity and reading speed for data storage and processing, and (3) data transmission rate in a network environment. They have also pointed out that these three resources have different impacts on system operation, which can be sorted out as follows: network transmission ≥ CPU utilization ≥ memory [20,26]. Therefore, the following definition is proposed regarding the cost under limited resources.
Definition 5. 
Set the resource consumption percentage on node  n  to  R n = ( r n 1 , r n 2 , r n 3 r n m ) , the maximum resource occupancy is  R n = R N C , R N M , R N T ; then, we obtain the following Equation: 
R n = R N C , R N M , R N T   = r n 1 C r n 2 C r n m C r n 1 M r n 2 M r n m M r n 1 T r n 2 T r n m T ,
where  r n i C ,  r n 1 M , and  r n 1 T  represent the CPU peak usage, memory consumption, and network transmission consumption (e.g., network band width) on node  n i , respectively. If the system runs normally, it must be at node  n i ; then, the sum of three types resources of all components on  i  is less than the peak value. Through this, it can be concluded that for  e j i , the resource consumption occupied meets the following requirements:
r n i R N S p C e j i r n i C r n i R N S p M e j i r n i M r n i R N S p T e j i r n i t .
If a component (including data) is added to the node at the moment, the consumption of the adding component will be still below the peak value [27]. Therefore, we can set the newly added component e j i , and its resource consumption corresponding to the CPU, memory, and network communication as  r n i C , r n i M , and  r n i T  respectively, and then, we can obtain Equation (8) from Equation (7):
r n i C + r n i R N S p C e j i r n i C r n i M + r n i R N S p M e j i r n i M r n i T + r n i R N S p T e j i r n i t .
Now, we obtain the component and data migration constraints.

3. Component and Data Migration Model under Limited Resources

From the above analysis, the key to component and data migration is to meet the required constraint defined in Equation (8), which means, the total resource consumption after migration should be less than the available peak resources. More importantly, the resource consumption after migration should be less than the one before migration, which is the purpose of migration. Therefore, the purpose of this section is to calculate the path cost after migration, establish a data migration model, and then push out basic migration guidelines and strategies.

3.1. Component and Data Migration Model

Equation (4) shows that the resource consumption of the data flow path consists of the component logic cost and data-processing cost in the node, the communication consumption between components, and the communication consumption between nodes. For ease of derivation, Equation (4) can be simplified: assume that the original path resource consumption is S , and the path resource consumption after the migration is S , and then the following requirement shall be satisfied:
S S .
The following variables can be defined for better understanding: the communication cost between nodes S n T , the communication cost between components in the node S n T 0 , the logic and data-processing cost of the computing unit S C . Based on this, for n paths between nodes in the topology, it can come up that the resource consumption of each path between nodes is S n T n . And for m paths between the components, the resource consumption between each component is S n T 0 m . After data migration, there are a total of α paths between nodes that have been changed. Among these, β paths between nodes are converted into internal node paths, and γ paths within the nodes are converted into inter-node paths; thus, the resource cost formulas before and after migration can be presented as Equation (10).
S = S n T + S n T 0 + S C   S = S n T + S n T 0 + S C .
Substituting the cost variables above, we can obtain the resources consumed between nodes after migration S n T :
S n T = S n T d S n T n + c S n T n = 1 β n + γ n   S n T = n β + γ n S n T .
Similarly, by substituting the cost variables above, we can obtain the resources consumed in the nodes (between components) after migration S n T 0 :
S n T 0 = S n T 0 + β S n T 0 m = 1 + β m   S n T 0 = m + β m S n T 0 .
Since the difference between pre- and post-migration is only the nodes, and according to Definition 3, data-component binding is fixed before or after migration, we can infer that the total data amount has no change during migration; thus, there are no changes in the logic and data-processing cost, as shown in Equation (13).
S C = S C .
Then, by substituting Equations (11)–(13) into Equation (10), we can obtain the linear relationship between the pre/post-migration and the cost on the overall path:
S = S n T + S n T 0 + S C = n β + γ n S n T + m + β m S n T 0 + S C .
Now, the component data migration objective function under resource constraints is obtained, as shown in Equation (14).

3.2. Objective Function Analysis

Through the derivation of the objective function, two conclusions can be drawn:
(1)
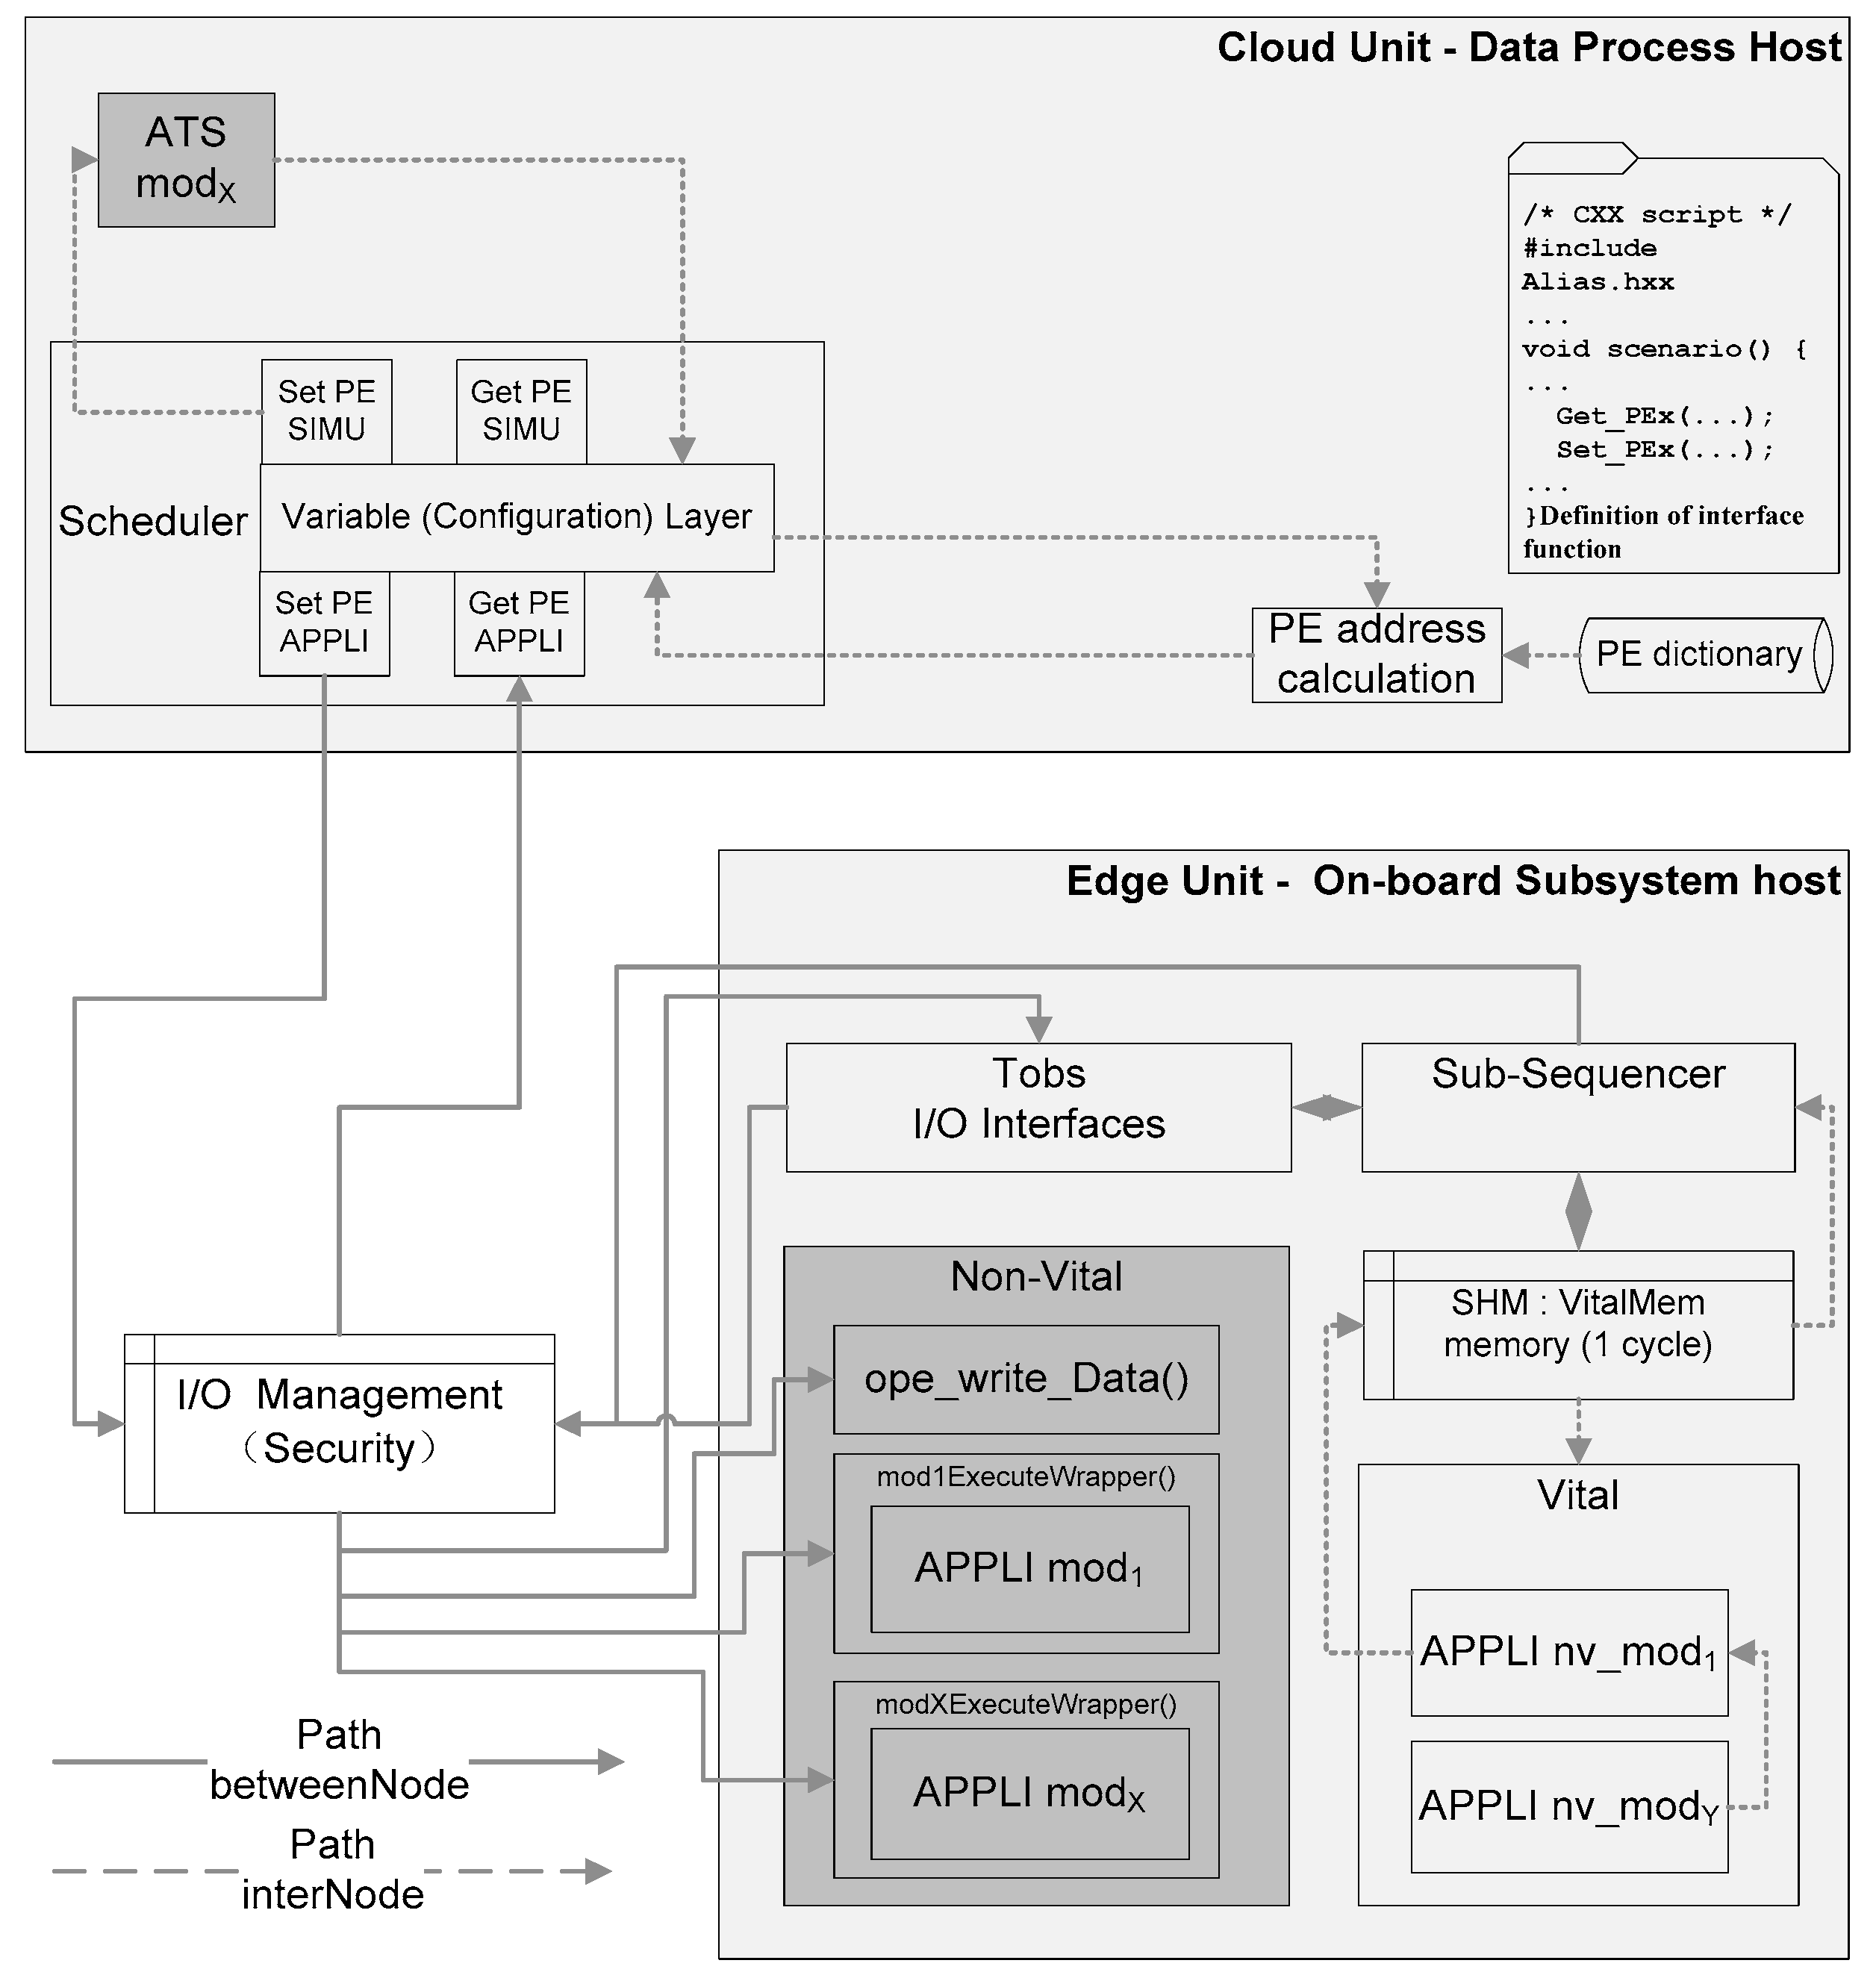
Within limited resources, data should be preferentially moved to nodes with low resource occupancy, which shortens the path. According to Equation (13), if we need to optimize computing resources while the total amount of resources is fixed, a feasible way is to put components and data from the non-critical paths to the critical paths in case the critical path node has sufficient computing resources, and vice versa. In this way, the redundant computing resources can be fully used, and it also reduces the tension of computing resources of non-critical path nodes. The conclusion is consistent with the “High Cohesion” theory in software engineering system design method [28]. A case in point is that in the cloud–edge-computing architecture, a large amount of data and related components can be uploaded onto the cloud platform [29,30] as a non-critical path, while the business parameters with safety-critical but small data can be put on the edge server, with real-time security-logic-computing components, which is a critical path.
(2)
When the path number of internal nodes converted from inter-nodes is greater than the path number of inter-nodes converted from internal nodes, the overall computing resource consumption will be reduced. For example, according to Equation (12), the communication cost of components in the node S n T 0 is an in-line function, its CPU consumption depends on the Interrupt Request (IRQ), and, thus, the assigned time slice from the CPU is extremely low compared to the application-calculated time slice. Similarly, the memory consumption is usually limited within related heaps or stacks, so their S n T resource consumption is minimal. On the contrary, the communication time between nodes, such as the transmission time between different subsystems, often takes up more computing resources. As an example, it is proven that a simplified interface design in distributed architecture has significantly improved computing efficiency [31,32]. This conclusion is consistent with the “Low Coupling” theory in software-engineering system design methods [28].

4. Basic Migration Rules and Strategies

Based on the derivation and analysis of the objective function, this Section summarizes the basic migration rules and then transforms the steps into a specific algorithm.

4.1. Basic Migration Rules

The basic rules for data migration can be summarized as follows:
(1)
According to Equation (9), the original consumption after migration does not exceed the peak value.
(2)
According to Definition 4, all components related to the critical path should be included in the critical path.
(3)
According to Equation (8), the resource consumption after migration should be less than the one before migration.

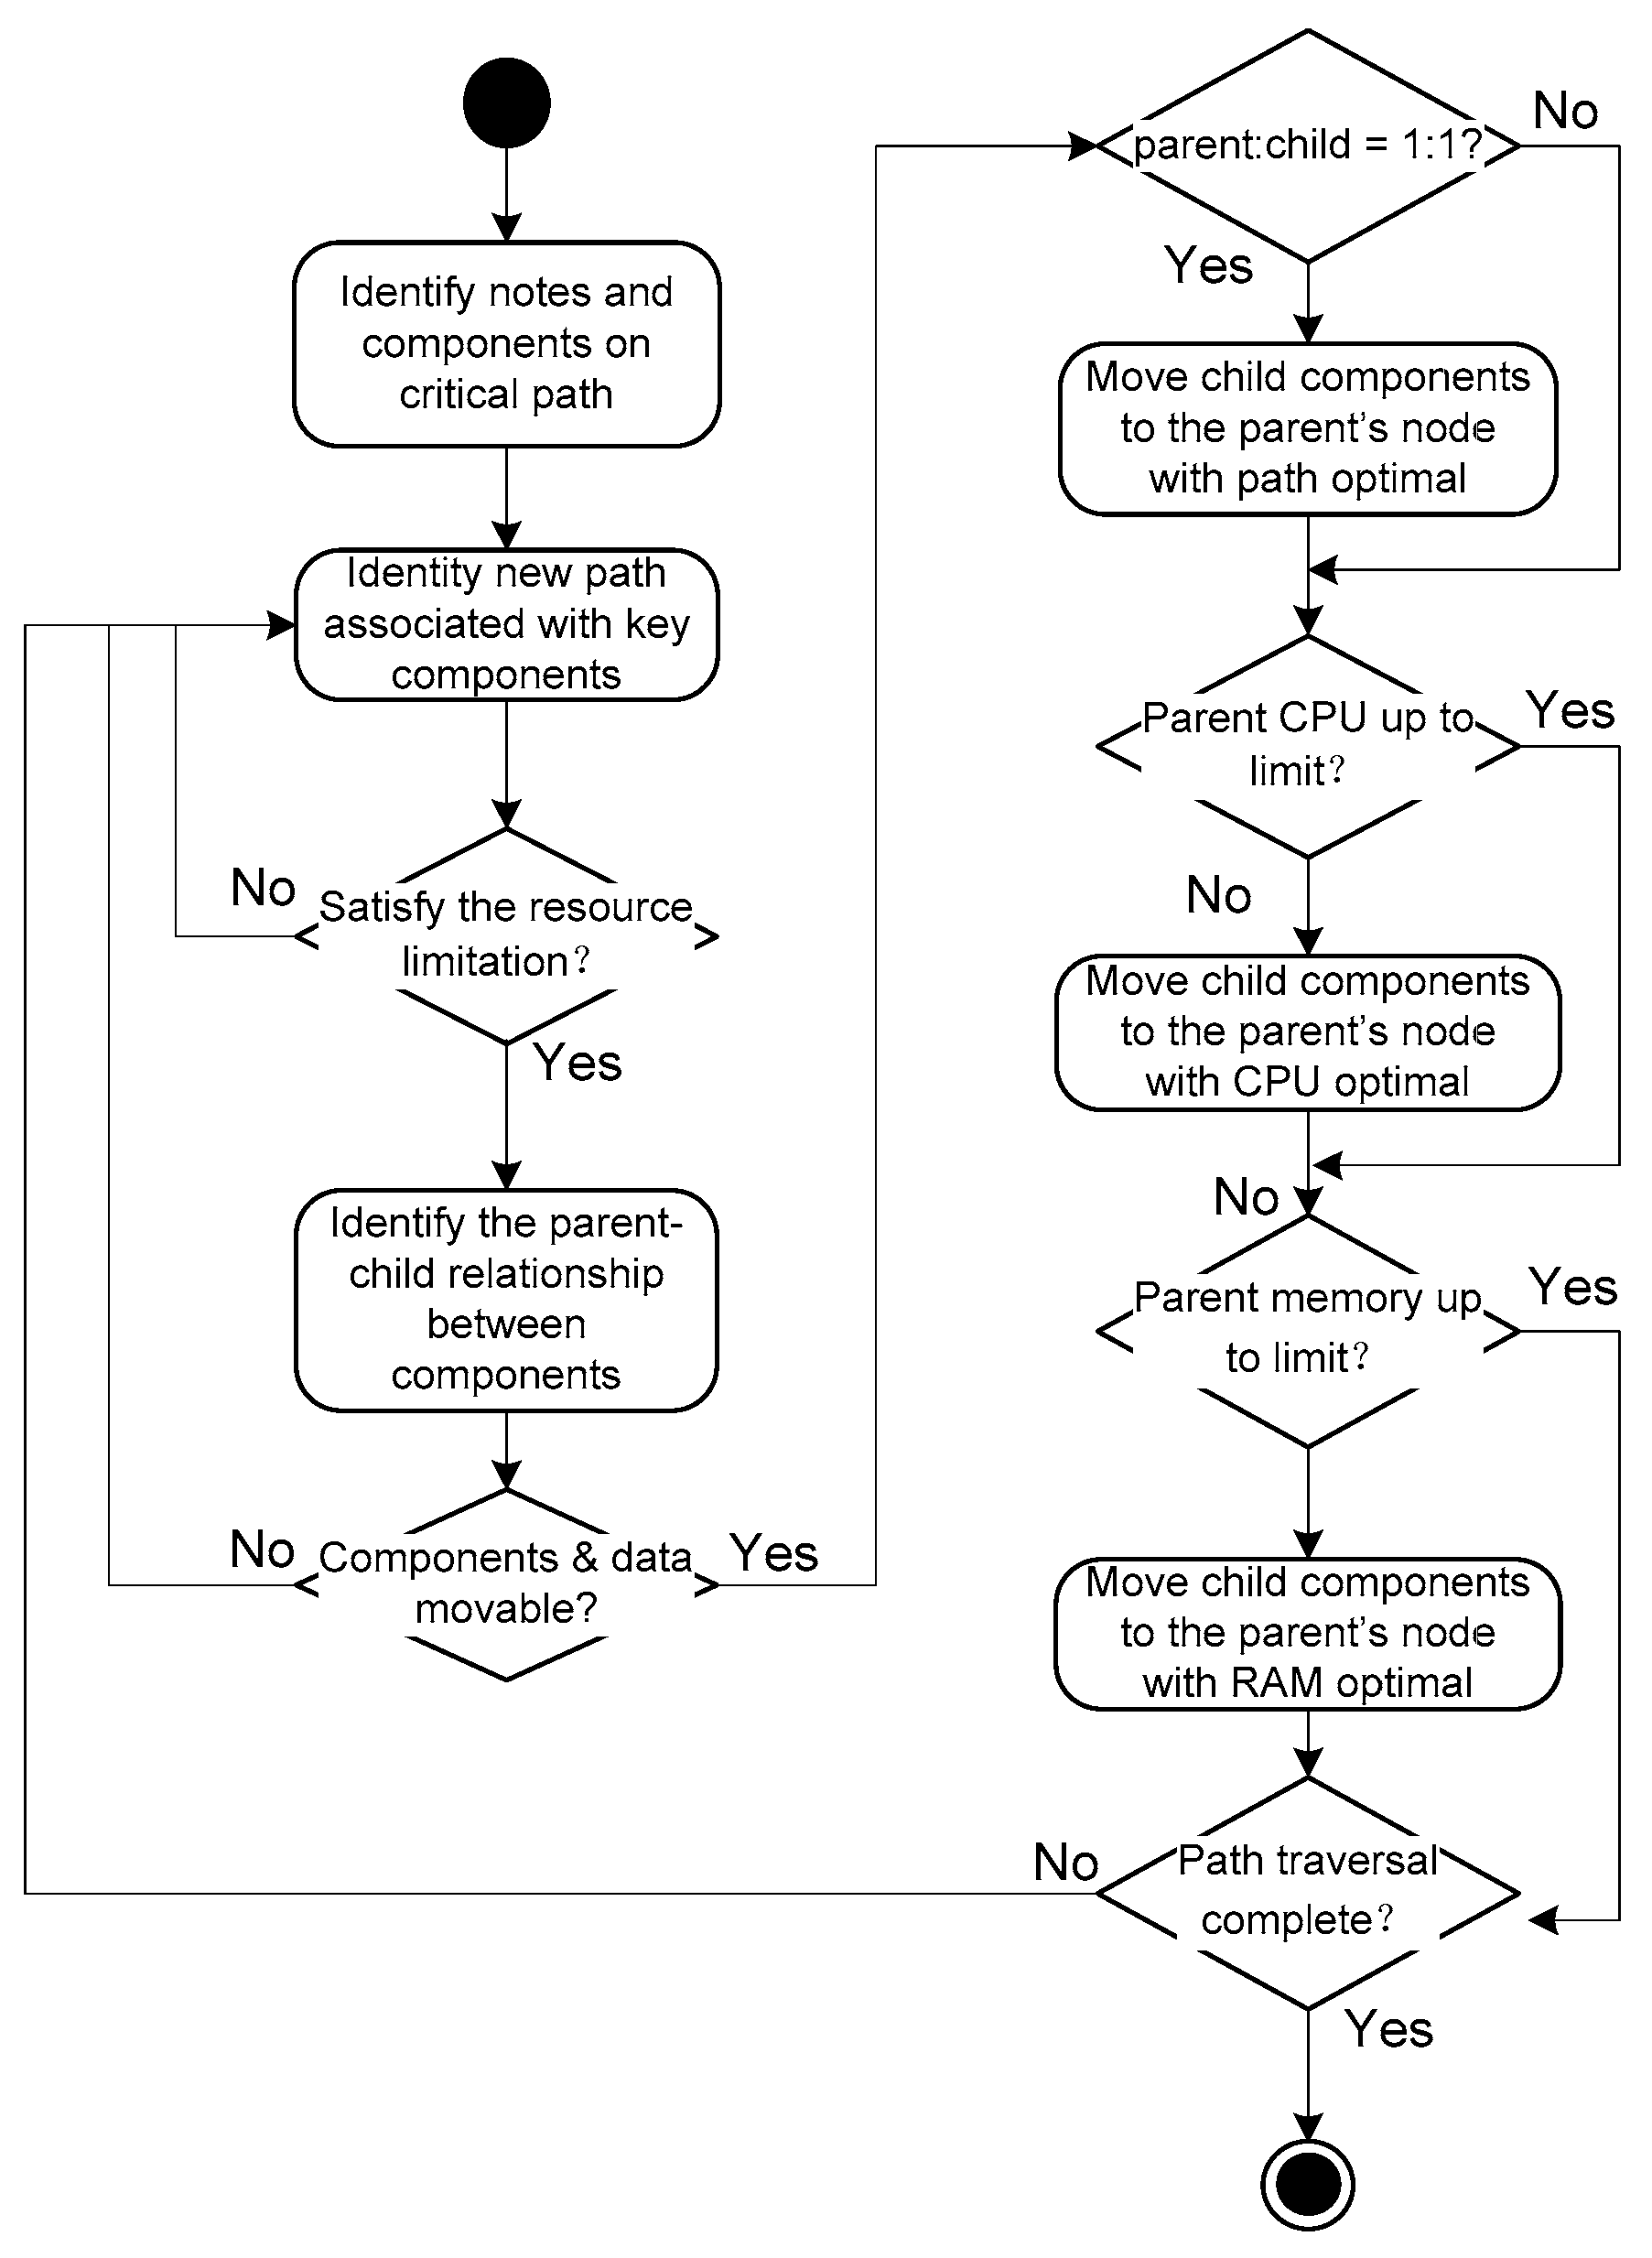
4.2. Migration Strategy

When we review and sort out the derivation steps and formula evolution process, a migration strategy can be assembled as follows:
Step 1: According to sub-equation r n i C + r n i R N S p C e j i r n i C in Equation (8), check the resource utilization rate of the node: If the resource constraints are not reached, migrate the components (with their data) from non-critical path to the parent components which located on the critical path (see Definition 2 for children-parent component);
Step 2: According to Equation (8), preferentially migrate components and data to the nodes with small communication delay and low bandwidth consumption; in particular, ① when a non-critical child component corresponds to a unique key parent component, it shall be migrated to the critical node path where the critical parent component is located and satisfy the condition r n i R N S p T e j i r n i t in Equation (8); ② when a non-critical child component corresponds to two or more critical node parent components, it should be preferentially allocated to the critical node where the critical parent component with the lowest CPU utilization is located and satisfy the condition r n i C + r n i R N S p C e j i r n i C in Equation (8); and ③ if the CPU utilization of the parent components has reached or is close to the upper limit, they should be migrated to the critical node where the parent component with the lowest memory utilization is located and satisfy the condition r n i M + r n i R N S p M e j i r n i M in Equation (8);
Step 3: According to Definition 3, after the new topology is created, the original data d j 1 , i 1 also need to be changed to the new path. For example, the network delay between nodes after migration in Step 2 ① will be converted into communication between components.
Step 4: According to Equations (6) and (9), check the consumption of topology resources, and it should be lower than the resource limitation after migration.
Step 5: Repeat Steps 1 to 4 until all critical paths are traversed.
Based on the strategy, the algorithm flow of component and data migration is proposed, as shown in Figure 3.

5. Practical Analysis and Model Validation

This section first rolls out a system architecture of data-computing and logical–operation collaboration, then optimizes its computing resources by using the migration strategy described in Section 4, and then builds a test environment in the form of cloud–edge architecture, to verify the effectiveness and correctness of the migration algorithm. The overall computing resources (i.e., cloud-edge servers) are intact before and after the experiment in this case.

5.1. Practicability Analysis

A train operation control system of urban rail transits that integrates a large amount of data operation and high-frequency logic operations was treated as an object. It is characterized by not only including line data, vehicle health status, station information, and other data that occupy a large amount of computing resources but also using logic operations with extremely high frequency, such as train positioning, mobile authorization, emergency braking, and other small amounts of data which require high safety and real-time performance. Table 2 provides a detailed list of the data with their features. Meanwhile, because high availability and high reliability requirements must be met in compliance with industry standards, the probability of leading to dangerous outputs is less than 10 9 per hour, and the software- and hardware-upgrading rate is much lower than in other industries. This leads to its computing capacity gradually becoming the bottleneck of the rapidly growing demand from operations. One of the approaches is to use the migration strategy described in this paper, introduce the edge computing mode to take the cloud as the main body of data computing, and take the on-board train control system as the main body of edge computing. In other words, it separates the data computing and logical computing, then allocates relevant components and data to different nodes (sub-systems, business clusters), and utilizes the communication between nodes to coordinate the computing results. In this way, the complementarity of the critical computing paths of the two types of nodes can be used to meet the requirements of real-time and large computing power at the same time, without upgrading the system hardware or software platform.
Figure 4 shows a system architecture before resource optimization and its data flow between components. In the figure, the cloud platform is responsible for data processing associated with upper Human Machine Interfaces (HMI) and management supervision business. The embedded security system, as an edge-computing unit, is responsible for real-time safety protection and all operation-related data. As a controller of edge computing, the edge unit carries a heavy computing load. Literature [33] and [34] put forward a method of computing unloading from the perspective of emergency management and improved genetic algorithm; literature [35,36] raise computing resource allocation methods from the view of computing cache; literature [37,38] provide multi-objective ant colony algorithms in the field of industrial internet in terms of adapting multi-demands of a mobile network; a revised algorithm is raised in literature [39] to reduce the weak correlation rules that generated by the data mining algorithm, so as to relieve the unit’s calculation pressure; literature [21,22], very similarly to the migration strategy’s logic, put forward the critical links definitions with centrality, degree, and neighborhood dimensions and specify a validity measurement that derives from combining the probabilistic and fuzzy set model. In light of the above, studies do provide migration references from different angles. However, according to the safety and real-time characteristics of the rail transit control system, there are strict requirements for logical data cache and functional dynamic allocation, as well as strict constraints on the dynamics of key calculations, especially for the embedded subsystems, where these methods cannot be fully applied.

5.2. Strategy Validation and Data Analysis

According to the above approach, we formulate the steps of the strategy validation to verify its effectiveness and correctness.
(1) Determine the critical path of data computing and logic operation
According to Figure 4, we sort out the system data types and judge whether the data and its operation components belong to the critical path of logical calculation or to the data analysis. The judgment is based on four aspects: application classification, participation in real-time calculation, security protection impact, and data volume, as shown in Table 2.
Table 2 lists 12 types of data that are to be processed by the system, mainly including system intrinsic parameters, application-loading parameters, and specific business data. It can be seen that there is a large amount of line data, passenger information, and alarm information data, which takes up huge computing resources. On the contrary, for the target system, what it might need for those data is probably only a Boolean flag (e.g., normal or abnormal) as the judgment condition for the operation to continue, and such data should be placed on the key path of data calculation. On the other hand, data such as clock, interrupt, frame parameters, and communication configuration parameters belong to the system parameters of the computing unit and cannot be unloaded or migrated; these should be placed on the critical path of logical computing.
(2) Reschedule the critical path according to the system operation topology
While keeping the overall computing resources of the research object unchanged, the data flow of each computing unit is described according to the definition of business requirements, safety interfaces, and data transmission protocols. Based on this, the computing unit is classified into the data-computing class and logic judgment class. An optimized system architecture is proposed based on the migration strategy, as shown in Figure 5.
(3) Software algorithm realization
According to the migration strategy in Figure 3, we further identify the components and data that can be migrated on the critical path. In the phase of detail design and coding, the module collaboration diagram of the migration strategy algorithm is shown in Figure 6.
In Figure 6, the data migration and synchronization module (i.e., redSyncMgr) in the software implementation is the main processor responsible for the entire migration algorithm. It is mainly used to traverse the data ID in the ModuleStaticData container to call the corresponding data processing module and compares it with the predefined VitalStateID to determine whether the current component and data belong to a data class or a logical class. Finally, according to the component interface function (i.e., Module_red), it moves the components according to the data migration strategy in the mode of “Type Copy” (i.e., applicable to nodes on different physical platforms) [25] or “Type Reference” (i.e., applicable to nodes on the same physical platform) [40].
(4) Lab configurations
To verify the effectiveness of the migration strategy, a real embedded vehicle control system was treated as the edge-end object; it plays the role of the logic- and data-computing node before migration and the logic-computing node after migration. As shown in Figure 5, the edge unit has two servers: one for data processing and one for IO interface management. The cloud is adopted in the form of a minicomputer private cloud platform and is the data-computing node after migration. The cloud unit is running on another data server. In addition, one separated IO server which is in charge of IO security is shared with both cloud and edge. The configuration information is given in Table 3 and Table 4.
Note that the IO server#2 in Figure 5 is assigned separately in consideration of cyber security. Physical isolation could be a good way to avoid any attacks from hackers. Encryption techniques, firewall, authentication methods, as well as regular updates and patching can be easily loaded to the IO server, with no influence on the cloud- and edge-computing units.
(5) Result analysis
As illustrated in Figure 7, according to migration strategy steps 1 to 2, the non-vital datasets listed in Table 2 are reallocated to the cloud unit during the validation, including PIS data, Diagnostic data, Line data, External Equipment Status, and PAS data. The features of those data are on the computing large-size path. The vital logic-related data, i.e., OS, Framework, Main Clock, IRQ, DB protection Macro, and CPU and RAM status, are integrated into the edge unit.
According to the migration strategy step 3, communications between five vital computing units are still inter-component; the inter-node communication between the original business-layer data (e.g., PIS, PAS, line data) and the original process-layer data (e.g., Diagnostic, equipment) is ultimately transformed into an inter-component one. In addition, the data exchange of the inter-node interfaces is simplified from the whole data package to a computing result normally presented as qualitative Boolean flags (e.g., True/False, Pass/Fail, 1/0, Healthy/Unhealthy) after judgment from the data process host.
Table 5 illustrates the differences in resource occupancy before and after migration. For each component, the demanded computing resource has no outstanding changes, as there is no functional or algorithm change, but the percentage of resources used by the vital controller (edge unit) has obviously decreased due to migration, and non-vital data calculation is moved to the non-vital controller (cloud unit).
In light of the above, Table 5 and Table 6 and Figure 8 show the changes in various indicators before and after migration.
From this Table, we can see the following:
(1)
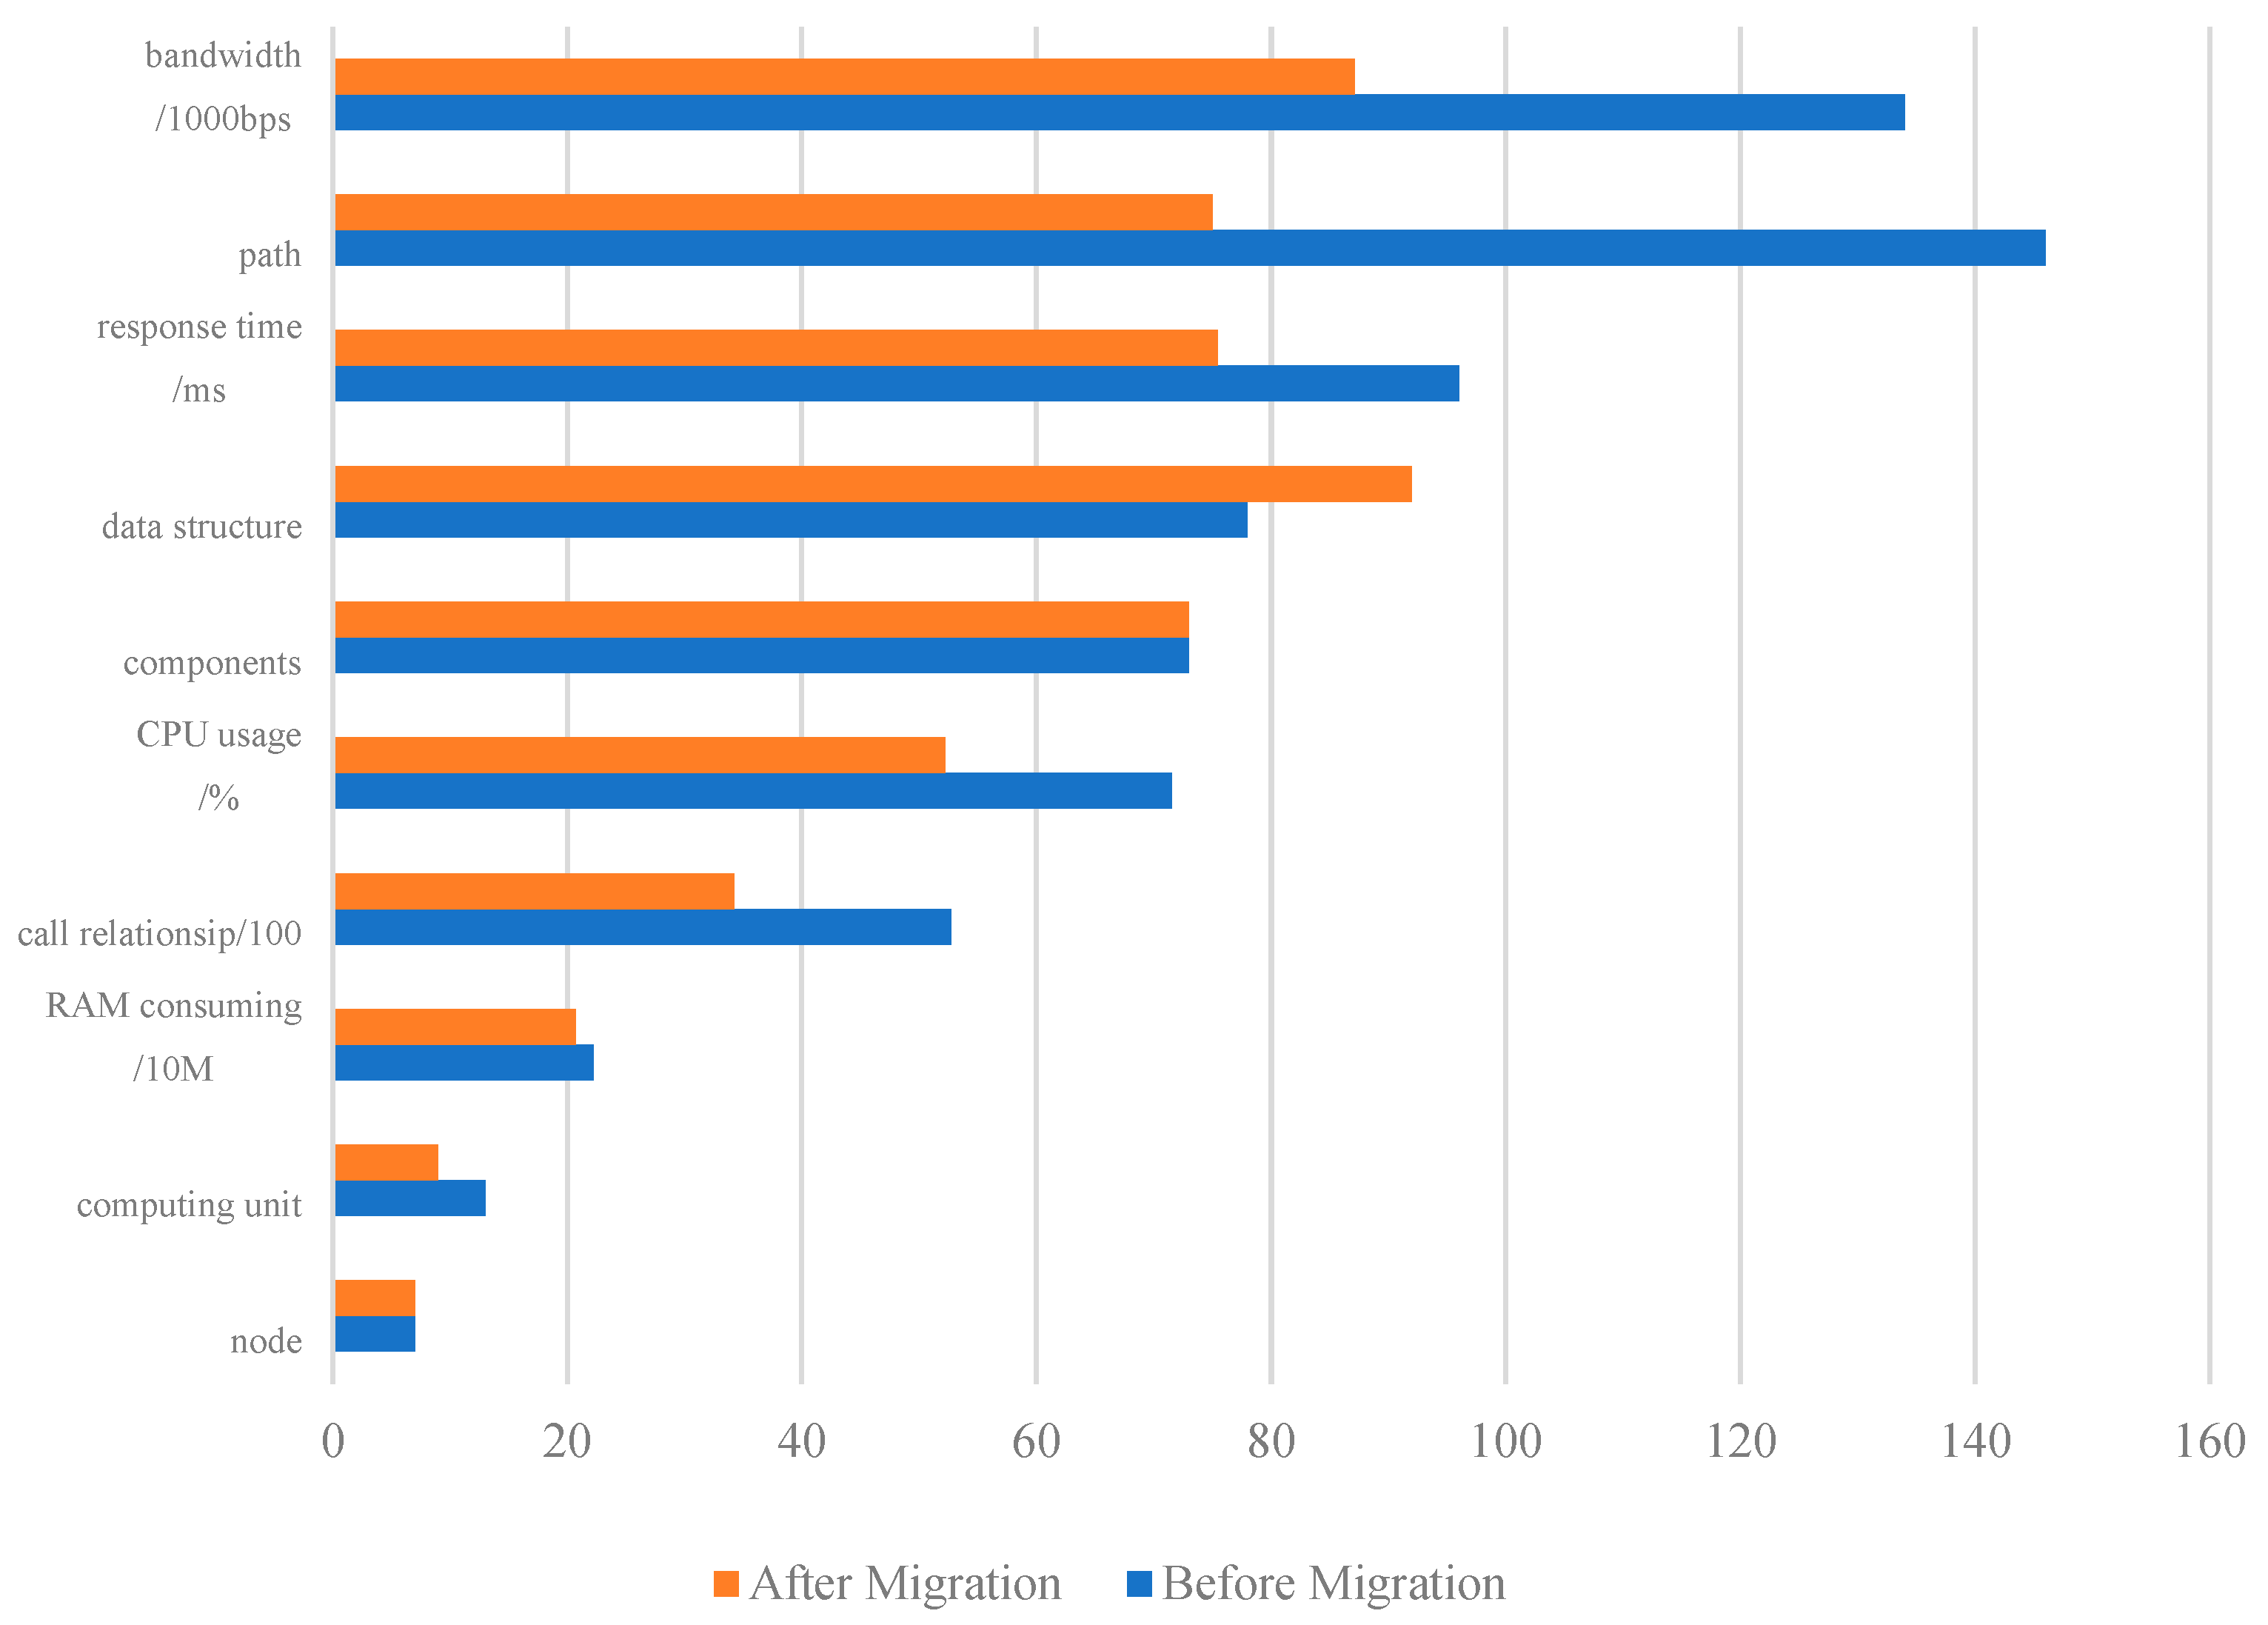
The initial setting of this test is not to change the functional modules, system architecture, and total computing resources; so, the node (i.e., number of subsystems) and components (i.e., number of functional modules) remain unchanged before and after migration;
(2)
Due to the migration and consolidation of components, the number of logical set units of components decreased from 13 to 9. The number of paths (i.e., call relationships including non-critical paths) is reduced from 146 to 75;
(3)
Due to the subdivision of data interface functions after migration, the data structure related to the interface is split from 78 to 92;
(4)
CPU utilization is reduced by 27%, memory usage is reduced by 6.8%, and the network bandwidth is decreased by 35%.

6. Discussion

Through model deduction and validation result analysis, it can be seen that the migration strategy is feasible. In practice, some experience can be drawn from the implementation. Firstly, the components with aggregation or inheriting relationships can be put together in one computing unit. Taking ATS applications as an example, diagnostic data, equipment supervision, and line data which are closely attached to the ATS can be migrated under the condition that the computing capability is sufficient. Figure 9 shows the collaboration of these components.
Secondly, it also can be seen from the validation implementation that there is a prerequisite lying on top of the applicability, which is a good model and structural design of the original software: ① A clear definition of parents–children components makes it possible to move components from/to a critical computing path. For example, the ATS module (Figure 7, in Cloud Unit) is the “parent” of the PIS and PAS module, with an inherited relationship, and aggregation is the relationship between ATS and other modules, such as diagnostic and line data. Thus, these components can be integrated into one computing unit as a form of path. ② The explicitness of the function–call relationship enables the interface simplifying. For example, the vital module DB Macro (Figure 7, in Edge unit) calls the Equip data’s (Figure 7, in Cloud Unit) state by obtaining its result’s flag instead of obtaining the whole data package as a parameter (address or pointer); thus, the cloud unit can take on the calculation and carry out the result before sending, and the inter-node load of the network can be reduced from 26.442 M (Equip data size in Table 2) to 2 bytes. To summarize, the key is that a high-cohesion and low-coupling principle migration solution must be supported by an original design with the same principle.

7. Conclusions

No matter what kind of computing-unit architecture, its computing resources have an upper limit, and there may be resource shortage due to insufficient computing resources or improper unit deployment. This paper studies the migration strategy of computing units and data under limited resources. Through model transformation and derivation, three main parameters that have a significant impact on computing resources before and after migration are identified: communication amount cost between nodes, communication cost of components within nodes, and computing cost of non-critical data. On this basis, the algorithm and implementation of non-computing-critical path components converging to computing-critical path components under resource constraints are proposed. The experiment proves that the migration strategy can well alleviate the computing-resource tension and/or release computing resources. Under the condition of unchanged overall computing resources and unaffected functionality and performance implementation, the migration strategy reduces the CPU utilization by 27%, the memory by 6.8%, and the network bandwidth by 35%.
The proposed strategy has high universality and is applicable to traditional servers and embedded computing unit structures with relatively fixed resources, as well as cloud-platform-computing or cloud–edge-computing architecture. Meanwhile, this strategy does not limit the migration scope of components and data. It can be implemented within or between current service platforms. The migration strategy in this paper is applicable to system software with a clear hierarchical design, low coupling of interface definitions between components and between computing units, and strong cohesion of component functions. In addition, further research is needed on how to generalize this strategy to apply it to all types of programming.

Author Contributions

Conceptualization, L.S., J.Y. and Y.Y.; methodology, L.S. and P.C.; software, J.Y. and P.C.; validation, J.Y. and L.S.; formal analysis, L.S. and P.C.; investigation, L.S. and P.C.; resources, L.S. and P.C.; data curation, L.S. and P.C.; writing—original draft preparation, J.Y., L.S. and P.C.; writing—review and editing, L.S., J.Y., Y.Y. and P.C.; visualization, L.S. and P.C.; supervision, L.S. and Y.Y.; project administration, J.Y., L.S. and Y.Y.; funding acquisition, J.Y. and Y.Y. All authors have read and agreed to the published version of the manuscript.

Funding

This research was funded by the National Key R&D Program of China, grant number 2023YFB4302502, the Shanghai Collaborative Innovation Research Center for Multi-network and Multi-modal Rail Transit, and the Shanghai “Super Postdoc” Incentive Plan, grant number 2023040.

Data Availability Statement

The data used to support the findings of this study are available from the corresponding author upon request.

Conflicts of Interest

Author Pengzi Chu was employed by the company Technology Center, Shanghai Shentong Metro Group Co. Ltd. Author Laiping Sun was employed by the company Shanghai Electric Thales Transportation Automation System Co., Ltd. The remaining authors declare that the research was conducted in the absence of any commercial or financial relationships that could be construed as a potential conflict of interest.

References

  1. Moon, J.; Hong, D.; Kim, J.; Kim, S.; Woo, S.; Choi, H.; Moon, C. Enhancing autonomous driving robot systems with edge computing and LDM platforms. Electronics 2024, 13, 2740. [Google Scholar] [CrossRef]
  2. Xu, L.; Liu, Y.; Fan, B.; Xu, X.; Mei, Y.; Feng, W. An improved gravitational search algorithm for task offloading in a mobile edge computing network with task priority. Electronics 2024, 13, 540. [Google Scholar] [CrossRef]
  3. Siemens. Siemens Transportation develops 5G+cloud signal system solutions, enabling urban rail transit in all directions. Urban Rail Transit 2020, 10, 54. [Google Scholar] [CrossRef]
  4. Meng, C.; Liu, W.; Yang, Q.; Zhao, Y.; Guo, Y. Research on operation optimization of edge data center under the background of ‘multi-station integration’. Adv. Eng. Sci. 2020, 52, 49–55. [Google Scholar] [CrossRef]
  5. Hu, J.; Wang, G.; Xu, X. Task migration strategy with energy optimization in mobile edge computing. Comput. Sci. 2020, 47, 260–265. [Google Scholar] [CrossRef]
  6. Tang, X.; Zhao, Q.; Fu, Y.; Zhu, Z.; Ding, Z. Research of hybrid resource scheduling framework of heterogeneous clusters for dataflow. J. Softw. 2022, 33, 4704–4726. [Google Scholar] [CrossRef]
  7. Sun, D.; Zhang, G.; Yang, S.; Zheng, W.; Khan, S.U. Re-Stream: Real-time and energy-efficient resource scheduling in big data stream computing environments. Inf. Sci. 2015, 319, 92–112. [Google Scholar] [CrossRef]
  8. Yang, S.; Cheng, H.; Dang, Y. Resource allocation and load balancing strategy in cloud-fog hybrid computing based on cluster-collaboration. J. Electron. Inf. Technol. 2023, 45, 2423–2431. [Google Scholar] [CrossRef]
  9. Li, M.; Mao, Y.; Tu, Z.; Wang, X.; Xu, S. Server-reliability task offloading strategy based on deep deterministic policy gradient. Comput. Sci. 2022, 49, 271–279. [Google Scholar]
  10. Liu, H. An UAV-assisted edge computing resource allocation strategy for 5G communication in IOT environment. J. Robot. 2022, 2022, 9397783. [Google Scholar] [CrossRef]
  11. Pu, Y.; Yu, J.; Lu, L.; Li, Z.; Bian, C.; Liao, B. Energy-efficient strategy based on executor reallocation and data migration in storm. J. Softw. 2021, 32, 2557–2579. [Google Scholar] [CrossRef]
  12. Nunome, A.; Hirata, H. Performance evaluation of data migration policies for a distributed storage system with dynamic tiering. Int. J. Networked Distrib. Comput. 2019, 8, 1–8. [Google Scholar] [CrossRef]
  13. Wang, D.; Huang, C. Distributed cache memory data migration strategy based on cloud computing. Concurr. Comput. Pract. Exp. 2019, 31, e4828. [Google Scholar] [CrossRef]
  14. Qiu, S.; Zhao, J.; Yana, L.; Dai, J.; Chen, F. Digital-twin-assisted edge-computing resource allocation based on the whale optimization algorithm. Sensors 2022, 22, 9546. [Google Scholar] [CrossRef]
  15. Xiao, J.; Gao, Q.; Yang, Z.; Cao, Y.; Wang, H.; Feng, Z. Multi-round auction-based resource allocation for edge computing: Maximizing social welfare. Future Gener. Comput. Syst. 2023, 140, 365–375. [Google Scholar] [CrossRef]
  16. Cheng, Z.; Zhang, J.; Song, T.; Hu, J. Contract-based scheme for computational resource allocation in cloud-assisted parked vehicular edge computing. Phys. Commun. 2022, 55, 101916. [Google Scholar] [CrossRef]
  17. Su, Z.; He, G.; Li, Z. Using grasshopper optimization algorithm to solve 0-1 knapsack computation resources allocation problem in mobile edge computing. In Proceedings of the 34th Conference on Control and Decision-making in China 2022, Hefei, China, 21–23 May 2022; pp. 559–564. [Google Scholar] [CrossRef]
  18. Chen, J.; Chang, Z.; Guo, W. Resource allocation and computation offloading for wireless powered mobile edge computing. Sensors 2022, 22, 6002. [Google Scholar] [CrossRef]
  19. Gaurav, B.; Dinesh, K.; Prakash, V.D. BARA: A blockchain-aided auction-based resource allocation in edge computing enabled industrial internet of things. Future Gener. Comput. Syst. 2022, 135, 333–347. [Google Scholar] [CrossRef]
  20. Praveena, A.; Vijayarajan, V. An efficient mobility prediction model for resource allocation in mobile cloud computing. Int. J. Knowl. Based Intell. Eng. Syst. 2021, 25, 149–157. [Google Scholar] [CrossRef]
  21. Kanwar, K.; Kaushal, S.; Kumar, H.; Gupta, G.; Khari, M. BCDCN: A new edge centrality measure to identify and rank critical edges pertaining to SIR diffusion in complex networks. Soc. Netw. Anal. Min. 2022, 12, 49. [Google Scholar] [CrossRef]
  22. Gupta, M.; Srivastava, S.; Chaudhary, G.; Khari, M.; Fuente, J.P. Voltage regulation using probabilistic and fuzzy controlled dynamic voltage restorer for oil and gas industry. International Journal of Uncertainty. Fuzziness Knowl. Based Syst. 2020, 28, 49–64. [Google Scholar] [CrossRef]
  23. Florian, H.; Zoltán, S. Connectivity of orientations of 3-edge-connected graphs. Eur. J. Comb. 2021, 94, 103292. [Google Scholar] [CrossRef]
  24. Pishgoo, B.; Azirani, A.A.; Raahemi, B. A hybrid distributed batch-stream processing approach for anomaly detection. Inf. Sci. 2020, 543, 309–327. [Google Scholar] [CrossRef]
  25. Sun, D.; Zhang, G.; Zheng, W. Big data stream computing: Technologies and instances. J. Softw. 2014, 25, 839–862. [Google Scholar] [CrossRef]
  26. He, Y.; Wang, Y.; Qiu, C.; Lin, Q.; Li, J. Blockchain-based edge computing resource allocation in IOT: A deep reinforcement learning approach. IEEE Internet Things J. 2021, 8, 2226–2237. [Google Scholar] [CrossRef]
  27. Huang, H.; Zhong, Y.; He, J.; Huang, T.; Jiang, W. Joint wireless and computational resource allocation for ultra-dense mobile-edge computing networks. KSII Trans. Internet Inf. Syst. 2020, 14, 3134–3155. [Google Scholar] [CrossRef]
  28. Teig, Ø. High cohesion and low coupling: The office mapping factor. In Communicating Process Architectures 2007; McEwan, A., Schneider, S., Ifill, W., Welch, P., Eds.; Concurrent Systems Engineering Series; IOS Press: Amsterdam, The Netherlands, 2007; Volume 65, pp. 313–322. ISBN 978-1-58603-767-3. Available online: http://www.teigfam.net/oyvind/pub/CPA2007/paper.pdf (accessed on 10 July 2022).
  29. Feng, J.; Yu, F.R.; Pei, Q.; Du, J.; Zhu, L. Joint optimization of radio and computational resources allocation in blockchain-enabled mobile edge computing systems. IEEE Trans. Wirel. Commun. 2020, 19, 4321–4334. [Google Scholar] [CrossRef]
  30. Uchaikin, R.A.; Uchaikin, R.; Orlov, S.P. Optimization-simulation approach to the computational resource allocation in a mechanical engineering enterprise. J. Phys. Conf. Ser. 2020, 1679, 32015. [Google Scholar] [CrossRef]
  31. Han, Q.; Fang, X. Resource allocation schemes of edge computing in Wi-Fi network supporting multi-AP coordination. Comput. Syst. Appl. 2022, 31, 309–319. [Google Scholar] [CrossRef]
  32. Li, X.; Zhou, Z.; Chen, L.; Zhu, J. Task offloading and cooperative scheduling for heterogeneous edge resources. J. Comput. Res. Dev. 2023, 60, 1296–1307. [Google Scholar] [CrossRef]
  33. Zhao, H.; Zhang, Z.; You, J.; Wang, Y.; Zhao, X. Unloading strategy of edge computing in emergency management scenario. Comput. Eng. Des. 2022, 43, 2549–2556. [Google Scholar] [CrossRef]
  34. Zhou, T.; Hu, H.; Zeng, X. Cooperative computation offloading and resource management based on improved genetic algorithm in NOMA-MEC systems. J. Electron. Inf. Technol. 2022, 44, 3014–3023. [Google Scholar] [CrossRef]
  35. Zhang, Y.; Cheng, Y. Joint optimization of edge computing and caching in NDN. J. Commun. 2022, 43, 164–175. [Google Scholar]
  36. Chen, Q.; Kuang, Z. Task offloading and service caching algorithm based on DDPG in edge computing. Comput. Eng. 2021, 47, 26–33. [Google Scholar] [CrossRef]
  37. Huang, Y.; Zheng, C.; Zhang, Z.; You, X. Research on mobile edge computing and caching in massive wireless communication network. J. Commun. 2021, 42, 44–61. [Google Scholar] [CrossRef]
  38. Vimal, S.; Khari, M.; Dey, N.; Crespo, R.G.; Robinson, Y.H. Enhanced resource allocation in mobile edge computing using reinforcement learning based MOACO algorithm for IIOT. Comput. Commun. 2020, 151, 355–364. [Google Scholar] [CrossRef]
  39. Son, L.H.; Chiclana, F.; Kumar, R.; Mittal, M.; Khari, M.; Chatterjee, J.M.; Baik, S.W. ARM–AMO: An efficient association rule mining algorithm based on animal migration optimization. Knowl. Based Syst. 2018, 154, 68–80. [Google Scholar] [CrossRef]
  40. Wang, Z.; Hou, R. Joint caching and computing resource allocation for task offloading in vehicular networks. IET Commun. 2020, 14, 3820–3827. [Google Scholar] [CrossRef]
Figure 1. An example of a computing-unit hierarchical architecture.
Electronics 13 04328 g001
Figure 2. Computing-unit topology diagram.
Electronics 13 04328 g002
Figure 3. Activity diagram of the migration strategy.
Electronics 13 04328 g003
Figure 4. A critical path of components (pre-optimization).
Electronics 13 04328 g004
Figure 5. Optimized critical path of components.
Electronics 13 04328 g005
Figure 6. Class diagram of the migration algorithm on critical path.
Electronics 13 04328 g006
Figure 7. Data re-allocation on critical path.
Electronics 13 04328 g007
Figure 8. Comparison before and after migration.
Electronics 13 04328 g008
Figure 9. Class diagram of business components.
Electronics 13 04328 g009
Table 1. Symbol table of the component topology.
SetInstanceDescriptionExpression in the ModelDefinition
C C Computing Unit C = C a ,   C b , C c C n Definition 1
N n Node N C = n 1 ,   n 2 , n 3 n m Definition 1
E e Element of Computing Unit (component) E ( C ) = e j 1 ,   e j 2 , e j 3 e j n Definition 2
D d Data D ( N ) = d j 1 ,   d j 2 , d j 3 d j n Definition 3
R r Resource, i.e., CPU, RAM, communication consumption R ( N ) = r n 1 ,   r n 2 , r n 3 r n m Definition 5
P p Data flow computing path p e j i , e m n = e j i p a t h e m n Definition 4
F f Edge (data flow) f ( p e j i , e m n ) Definition 2
Table 2. Data type analysis of the validation objective.
No.Data Type *Business
Layer
NOT Participate in
Real-Time Calculations
Low Impact on
Fail-Safe Principle
Data Quantity/BytesBelongs to
Logic Operation
Belongs to Data Computing
1OS parametersxxx0.223 K
2Framework parametersxxx15.012 K
3Main clockxxx0.101 K
4IRQ xxx0.332 K
5Diagnostic parametersx18.556 K
6Com-configuration parametersxxx5.105 K
7GEBR braking ratexx0.214 K
8Data protection macroxx0.101 K
9CPU occupancyxxx0.109 K
10RAM occupancyxxx0.176 K
11Line data128.241 M
12External equipment statusx26.442 M
13PIS data770.009 M
14PAS data14.500 M
* OS: operating system; IRQ: interrupt request; Com: communication; GEBR: guaranteed emergency brake rate; CPU: central processing unit; RAM: random access memory; PIS: passenger information system; PAS: passenger alarm system.
Table 3. Data analysis of the validation objective—edge.
Configuration ItemsOnboard Control System
OS EnvironmentRedHat Linux 5.3
TAS O/S  2.1.0.2
GNU C++ Compiler/Linker 4.4.5-plf2.0
Doxygen/UMLDox 1.7.6.1
HW Configuration1.86 GHz, 4 MB L2 cache, 1066 MHz Front Side Bus
3 GB RAM
160 GB Hard Disk Drive
4 NIC ports2×2 dual ports or 1 × 4 ports Ethernet adapter
2×dual port serial adapters for MPU
Table 4. Configuration analysis of the validation objective—cloud.
Applications
Location
Node
Nr.
Private Cloud
CPUCPU Load
Setting
RAM
Setting
RAM Load
Setting
Hard Disk
Volume
HD Usage
Setting
Shared RAM
Setting
Shared RAM Usage
Setting
AvgPeakAvgPeak
Data Server216-core30%70%32 GB30%70%300 GB×230%2 TB50%
IO Server216-core30%70%32 GB30%70%300 GB×230%
Station (Cloud desktop)68-core30%70%4 GB30%70%1 TB30%
Table 5. Data comparison before and after the migration—detail.
No. *Resident MemoryMigrated?HostPeak Memory ConsumingPeak CPU ConsumingData Transfer Consuming
Before %After %Before %After %Before kbpsAfter kbps
10.223 KNOEdge0.40130.41231.1641.1630.000.00
215.012 KNOEdge1.12901.15162.6253.6430.000.00
30.101 KNOEdge0.86710.80640.8770.9910.000.00
40.332 KNOEdge0.55270.55820.5380.5440.000.00
518.556 KYESCloud2.63452.34722.4561.2210.0016.00
65.105 KNOEdge1.61512.50410.9761.9110.000.00
70.214 KYESCloud0.28890.00960.2430.2110.0016.00
80.101 KNOEdge0.26610.30063.1964.3230.000.00
90.109 KNOEdge0.52120.51752.2232.2220.000.00
100.176 KNOEdge0.52070.57633.3503.0110.000.00
11128.241 MYESCloud2.94271.992116.4259.98932.0017.00
1226.442 MYESCloud3.23642.89116.3213.66720.0012.70
13770.009 MYESCloud5.25634.972420.02513.32166.0012.70
1414.500 MYESCloud2.02311.703111.1156.00616.0012.70
* Consistent with the component sort number in Table 2.
Table 6. Data comparison before and after the migration.
ItemsBefore MigrationAfter MigrationChange Rate
Node770% (−)
Computing unit13930.77% (↓)
RAM consuming (unit:10 M)22.25520.7426.80% (↓)
Call relationship (unit:100 pairs)52.734.235.10% (↓)
CPU usage (/%)71.5352.2227.00% (↓)
Components73730% (-)
Data structure789217.95% (↑)
Response time (ms)96.0375.4821.40% (↓)
Path1467548.63% (↓)
Bandwidth (kbps)13487.135.00% (↓)
Note: “−”, “↓” and “↑” represent the flat, rise, and fall of the corresponding value.
Disclaimer/Publisher’s Note: The statements, opinions and data contained in all publications are solely those of the individual author(s) and contributor(s) and not of MDPI and/or the editor(s). MDPI and/or the editor(s) disclaim responsibility for any injury to people or property resulting from any ideas, methods, instructions or products referred to in the content.

