1. Introduction
Worldwide, stroke has emerged as the foremost cause of both disability and mortality. It now stands as the second leading cause of death globally, affecting both men and women, significantly diminishing their quality of life, and imposing an enormous burden on public health systems. By 2030, it is projected that more than 200 million disability-adjusted life years will be lost annually due to stroke, with approximately 70 million elderly patients and nearly 12 million stroke-related deaths [
1]. A stroke occurs when there is a disruption or reduction in blood flow to various parts of the brain, leading to a potentially fatal neurological condition in which sections of the brain suddenly cease to receive vital oxygen [
2]. Notably, around 11% of individuals succumb to no communicable diseases like stroke each year [
3], making it the leading cause of adult disability and the fifth leading cause of death globally. Alarmingly, approximately 85% of stroke fatalities occur in developing nations, as documented in the extensive dataset from the Harvard Dataverse Repository, encompassing records of nearly 43,000 individuals.
The brain is vital in organizing and storing memories within its intricate network of approximately 1 trillion neurons and glia, residing in a three-pound tissue mass [
4]. There are two primary types of strokes: ischemic and hemorrhagic. Hemorrhagic strokes, though less common, involve the rupture of a blood vessel, leading to bleeding in the brain. Ischemic strokes, the most prevalent variety, result from a blockage or constriction of blood flow to a specific brain area due to arterial restriction or blockage [
5]. Both types of strokes are closely associated with irregular metabolic markers, even though the precise pathophysiology remains elusive [
6]. The inadequacy of current treatments often makes full recovery elusive. Even survivors may contend with permanent damage, an inability to work, diminished social functioning, and other challenging realities [
7]. Thus, this condition places a significant strain on patients, healthcare professionals, and society as a whole.
Early diagnosis is crucial for stroke prevention or rapid medical intervention, as the physical, psychological, and economic effects of long-term stroke-related disability impact not only the affected individuals but also their families and communities [
8]. In industrialized nations, cerebrovascular disease ranks as the leading cause of death and a significant contributor to long-term adult disability, with complex associations with pathological metabolic indicators for both hemorrhagic and ischemic strokes. Given that more than 90% of these risk factors are modifiable, preventive efforts are of paramount importance [
9].
Stroke is a severe medical condition, and there is an urgent need for more effective methods of early detection and treatment. Risk assessment through Machine Learning (ML) techniques is an area ripe for exploration, providing a valuable tool for comparing the performance of different ML methods in prediction [
10]. Utilizing ML techniques, such as linear discriminant analysis, which can uncover specific disease patterns, can save medical professionals time and resources in the diagnostic process [
11]. The scientific community places a strong emphasis on creating predictive models for stroke with the aim of prevention using 100 samples of a standard 12-leads ECG data, considering its significant societal impact.
This study’s primary contribution lies in utilizing various ML models on publicly available datasets. Three distinct models are employed and compared to prior research, providing an in-depth examination of the performance of several ML algorithms in predicting stroke risk and identifying the most effective components. The strength of the ML approach lies in its capacity to handle a vast number of variables by calculating and extracting relevant information for the task at hand [
12]. To facilitate the application of ML models in clinical practice, we selected data that physicians can readily monitor such as BMI, Hypertension, age, Heart disease, smoking status, and Average Glucose Level. This study showcases how the most effective ML methods based on classification algorithms can predict cerebral stroke when dealing with limited and imbalanced clinical data on clinical data with Physiological and behavioral data, while previous studies have primarily employed conventional ML methods to predict stroke and many studies have not utilized Physiological and behavioral data. This study outperforms them by evaluating and comparing classification efficacy across multiple methods and assessing model accuracy through artificial intelligence The key contributions and innovations of this research include the following:
Three different ML models—Random Forest, K-Nearest Neighbor, and Logistic Regression were utilized to detect stroke.
Three different oversampling techniques—Synthetic Minority Oversampling Technique, Adaptive Synthetic Sampling Approach, and Random Over-Sampling Technique were implemented to generate data.
The three models were implanted on the three generated datasets and compared to each other.
The Harvard Dataverse Repository dataset is used to test the proposed model. There is also a full comparison study with other related studies.
Finally, a novel detection framework was proposed to detect stroke efficiently.
The subsequent sections provide a concise discussion of the findings and comparisons, followed by a description of the dataset and an analysis of the methods used in
Section 3.
Section 4 delves into the experimental design and explores the research findings, concluding with recommendations for future research.
2. Related Work and Motivation
Numerous researchers have embarked on predicting strokes by employing ML-based methods. Predicting cerebral stroke has been the focal point of multiple studies, each exploring a diverse array of ML algorithms. Given the intricacy of neurological diagnoses, there has been a collective effort to expedite these diagnoses. In this section, we shed light on their endeavors and associated activities, providing insight into the foundational aspects of this field.
A study improves Random Forest algorithm to enhance the Stroke Predictor (SPR) model, achieving a heightened prediction accuracy of 96.97% on 4799 samples in comparison to existing models [
13]. Different ML models such as Random Forest Classification, K-Nearest Neighbors, Support Vector Machine, and Naïve Bayes Classification, imply multiple physiological factors to predict stroke, and Naïve Bayes emerges as the most effective algorithm, achieving an accuracy of around 82% on kaggle dataset with 5110 sample [
14]. Their objectives encompassed the creation of ML prediction models for stroke disease, tackling the challenge of severe class imbalance presented by stroke patients while simultaneously delving into the model’s decision-making process but achieving low accuracy (73.52%) and high FP rate (26.57%) using Logistic Regression on kaggle dataset [
15]. Particularly, ML methods, including Deep Neural Networks (DNN), have proven instrumental in predicting motor outcomes in the upper and lower limbs six months post-stroke [
16].
Another noteworthy endeavor involved a meticulous review of current state-of-the-art ML approaches for brain stroke, classified based on functionality or resemblance [
15]. A study methodically scrutinizes diverse patient records to enhance stroke prediction and implements different ML-based classification using a dataset encompassing 29,072 patient records but gain 77% accuracy after using neural network [
17]. Besides, A study employs patient physiological data to develop an artificial neural network (ANN) model for stroke prediction, achieving a classification accuracy of approximately 98% through 1000-fold cross-validation in the proposed ANNs methodology [
18]. Acknowledging the challenges of dealing with physiological data that may be incomplete and subject to class imbalances, this study endeavors to develop a hybrid ML approach for precise cerebral stroke prediction [
6].
Further contributions to this field include innovative approaches like Randomized-Hyperopt, a method for optimizing hyperparameters, which particularly targets the Extreme Gradient Boosting algorithm (XGBoost) [
19]. This method meticulously tunes hyperparameters using various techniques, weighing predictive performance and processing time. A study implement SVM models with different kernel on a small dataset (350 samples) and achieve 90% on linear kernel [
20]. Another approach combines a clinical multimorbid index with machine learning to consider the intricate interplay of variables and their dynamic nature [
21]. By amalgamating hypertension occurrence, body mass index, heart disease, average glucose levels, smoking status, prior stroke history, and age, this research contemplates early prediction of stroke disorders [
22].
Throughout these diverse studies, a range of ML techniques, including Logistic Regression (LR), Random Forest (RF), and Decision Tree (DT), have been enlisted to predict the likelihood of a patient experiencing a stroke [
23]. Besides, electronic health records are used in a study to detect Stroke, but the data cannot cover all the risk factors [
24]. Image quality enhancement and the application of ML algorithms for classifying patient images into two-stroke subtypes, ischemic and hemorrhagic, have also been explored to preprocess CT scan data effectively [
25].
In a parallel study, the focus extends to the development of 288 models for predicting stroke recurrence over a span of five years, leveraging patient-level data from electronic health records. The study considers an array of interpretable algorithms, feature selection strategies, prediction windows, and sampling techniques to assess stroke recurrence comprehensively [
26].
Most earlier studies used small datasets to detect stroke. Besides, some studies didn’t include risk factors such as blood pressure, BMI, smoking habits, etc., to detect stroke. A small dataset is not enough to detect Stroke because diseases can be different in certain places, people’s habits, and surroundings.
3. Materials and Methods
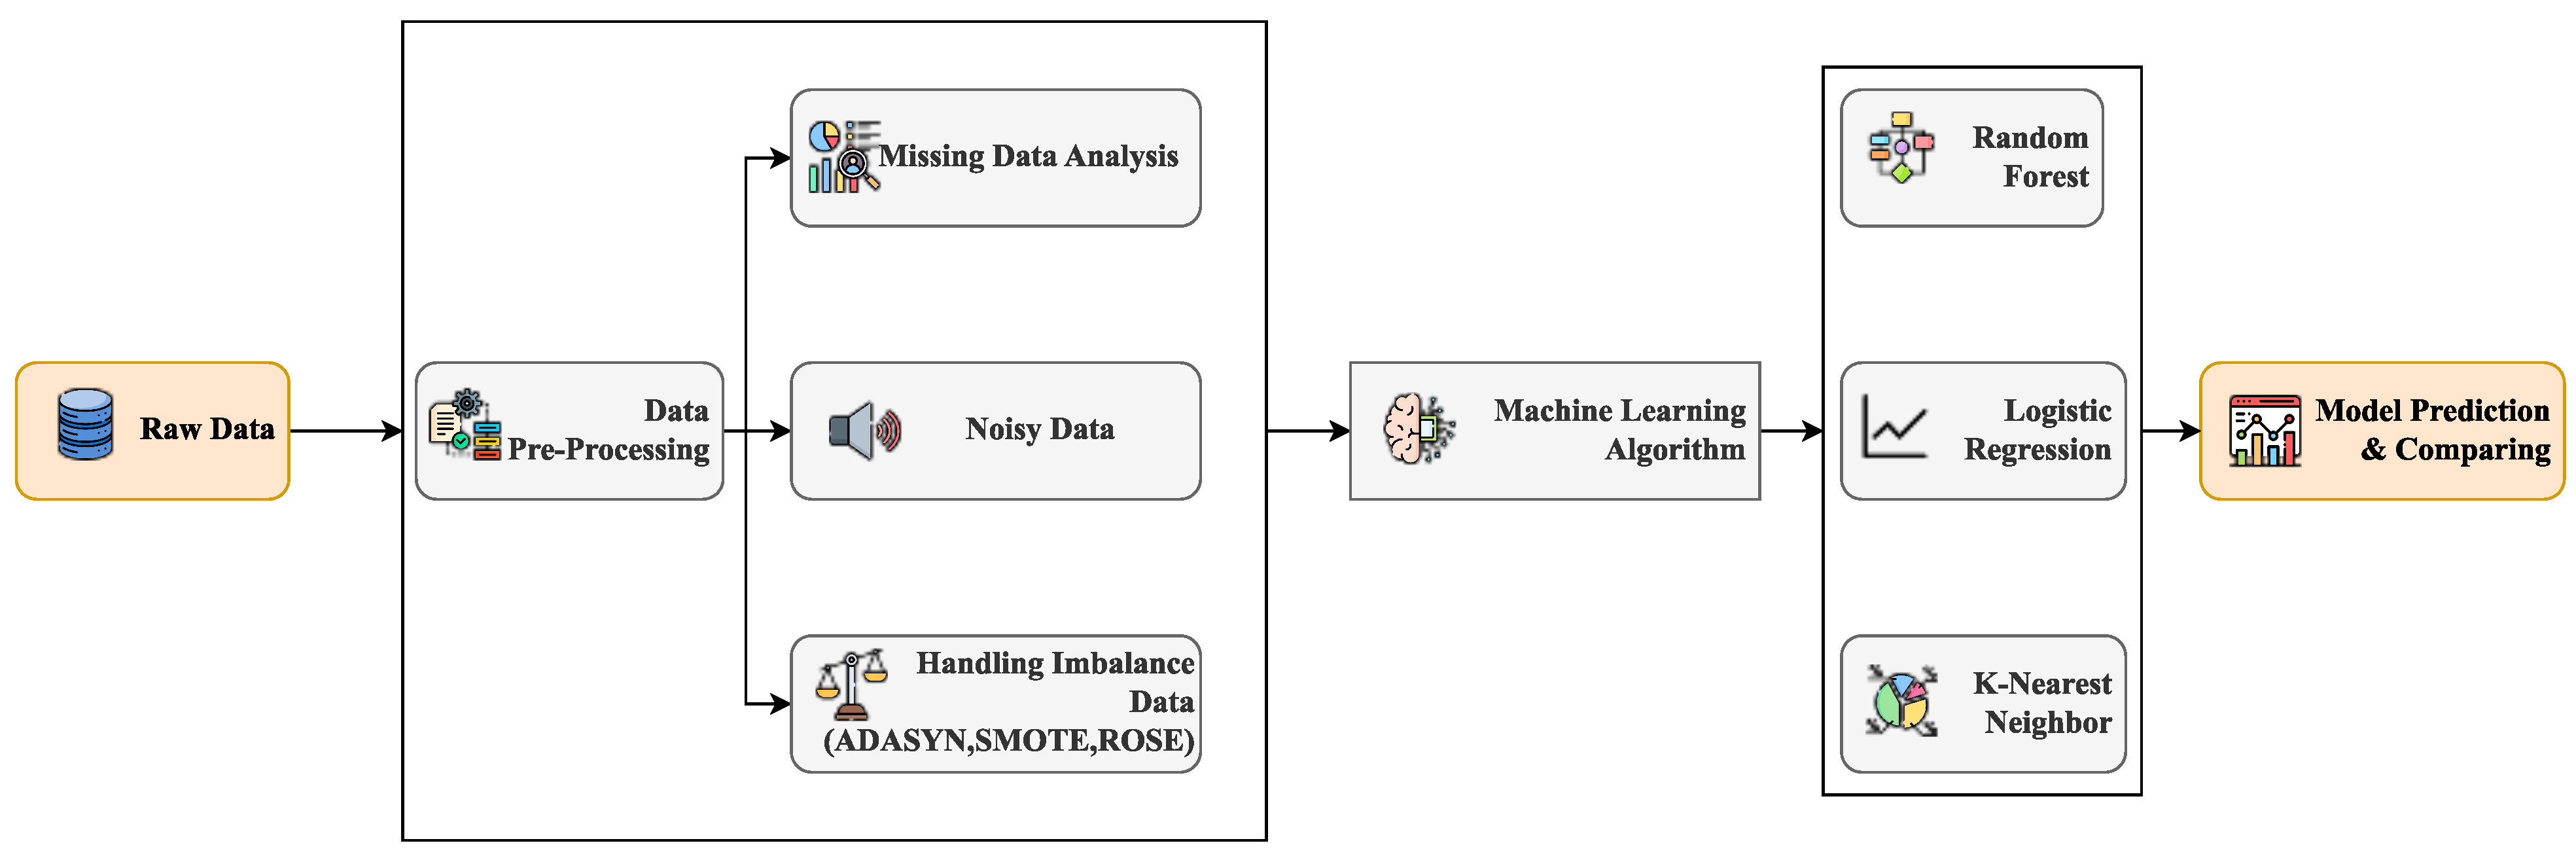
In this research, a diverse set of ML methods and algorithms have been introduced to facilitate the prediction of cerebral strokes. Following thorough data preprocessing, the dataset is optimized for creating predictive models. Constructing these models involves utilizing both ML methods and the refined dataset. Noteworthy techniques involved in this process include KNN, LR, and RF classifiers.
Figure 1 visually outlines the essential steps within this predictive modeling process.
This diagram provides a visual representation of every stage in this research. The removal of redundancies, technically referred to as data duplication or repetitive data, is achieved during the acquisition phase through correlation analysis. Subsequently, the preprocessed data is supplied to various ML algorithms for identification. This process efficiently generates automated systems, reflecting the ongoing evolution of automation technology.
ML is at the forefront of augmenting computational intelligence, ushering in a new era of computer capabilities, while automation continues to evolve and expand rapidly. An array of ML algorithms is harnessed to train models to discern essential characteristics. The proposed prototype unfolds across three pivotal stages: data acquisition, preprocessing, and classification. In the pursuit of exceptional precision, the dataset is thoughtfully partitioned into two segments: the training data, comprising 80%, and the testing data, making up the remaining 20%. The evaluation of the model’s performance is conducted using four well-established performance criteria: Accuracy, Precision, Recall, and F1-Score. Subsequently, employing ML techniques to fine-tune simulations and experiments, the study presents uniquely accurate results visualized through the confusion matrix.
The dataset utilized in this investigation is obtained from the Harvard Dataverse Repository [
27]. In this study, significant emphasis is placed on assessing the patient’s living conditions, medical history, and vital statistics. The dataset encompasses 43,400 samples with 10 features. Notably, the data collection revolves around a specific set of risk variables, including age, sex, hypertension, heart disease, body mass index, smoking status, glucose levels, marital status, occupation, and place of residence. The dataset exhibits an imbalanced distribution, encompassing 42,617 controls and 783 cases, with ages ranging from 0.08 to 82 years and diverse gender representation, including 17,724 males, 25,665 females, and 11 others. In alignment with ethical principles, all participants have provided informed consent, authorizing the utilization of their data for scientific research. To handle missing data challenges, missing data are filled to make sure the study’s results are accurate and reliable. The research is underpinned by a commitment to precision and thoroughness, emphasizing the significance of data acquisition, meticulous preprocessing, and effective classification methodologies.
3.1. Data Analysis
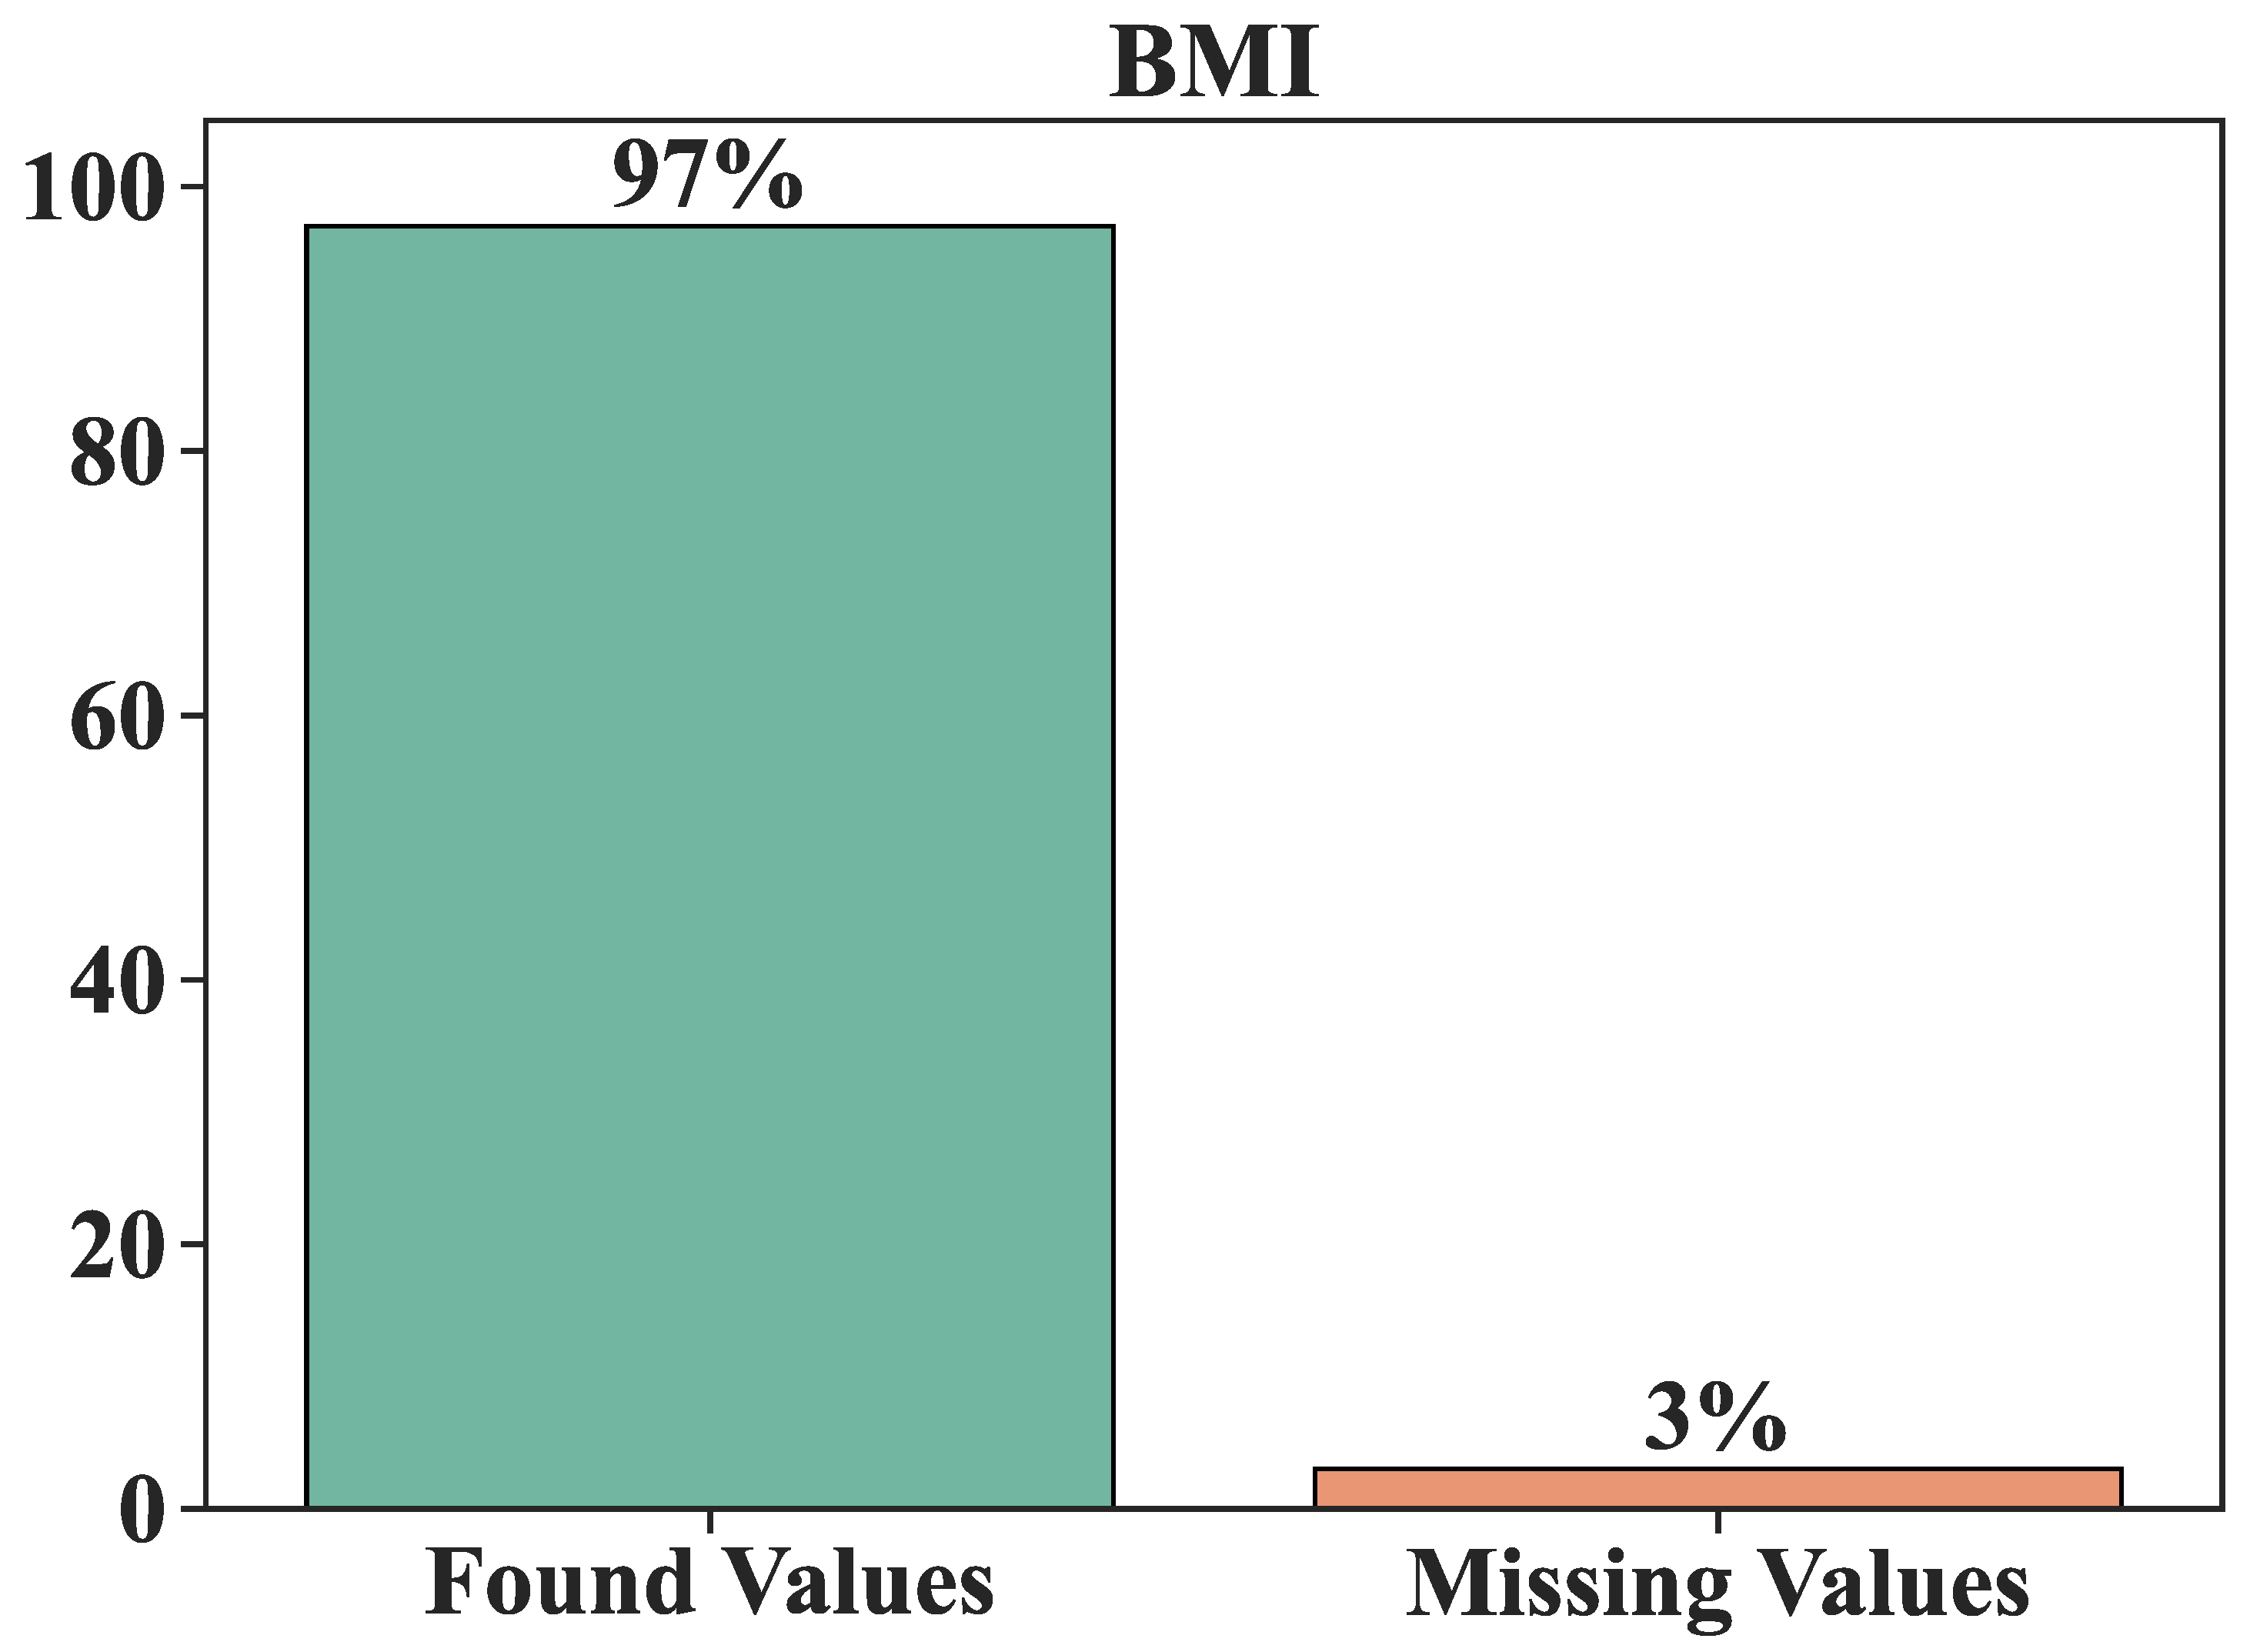
The relationship between body mass index and intermediate glucose level is so minimal that it could be considered negligible. Additionally, it’s crucial to acknowledge that the dataset is incomplete, with 325 data elements missing, encompassing 31% for smoking status and 3% for body mass index (BMI).
Figure 2 visually represents the BMI attributes that entirely lack values. It shows the BMI condition contains a 3% gap in information, necessitating remediation or removal to enhance the overall assessment.
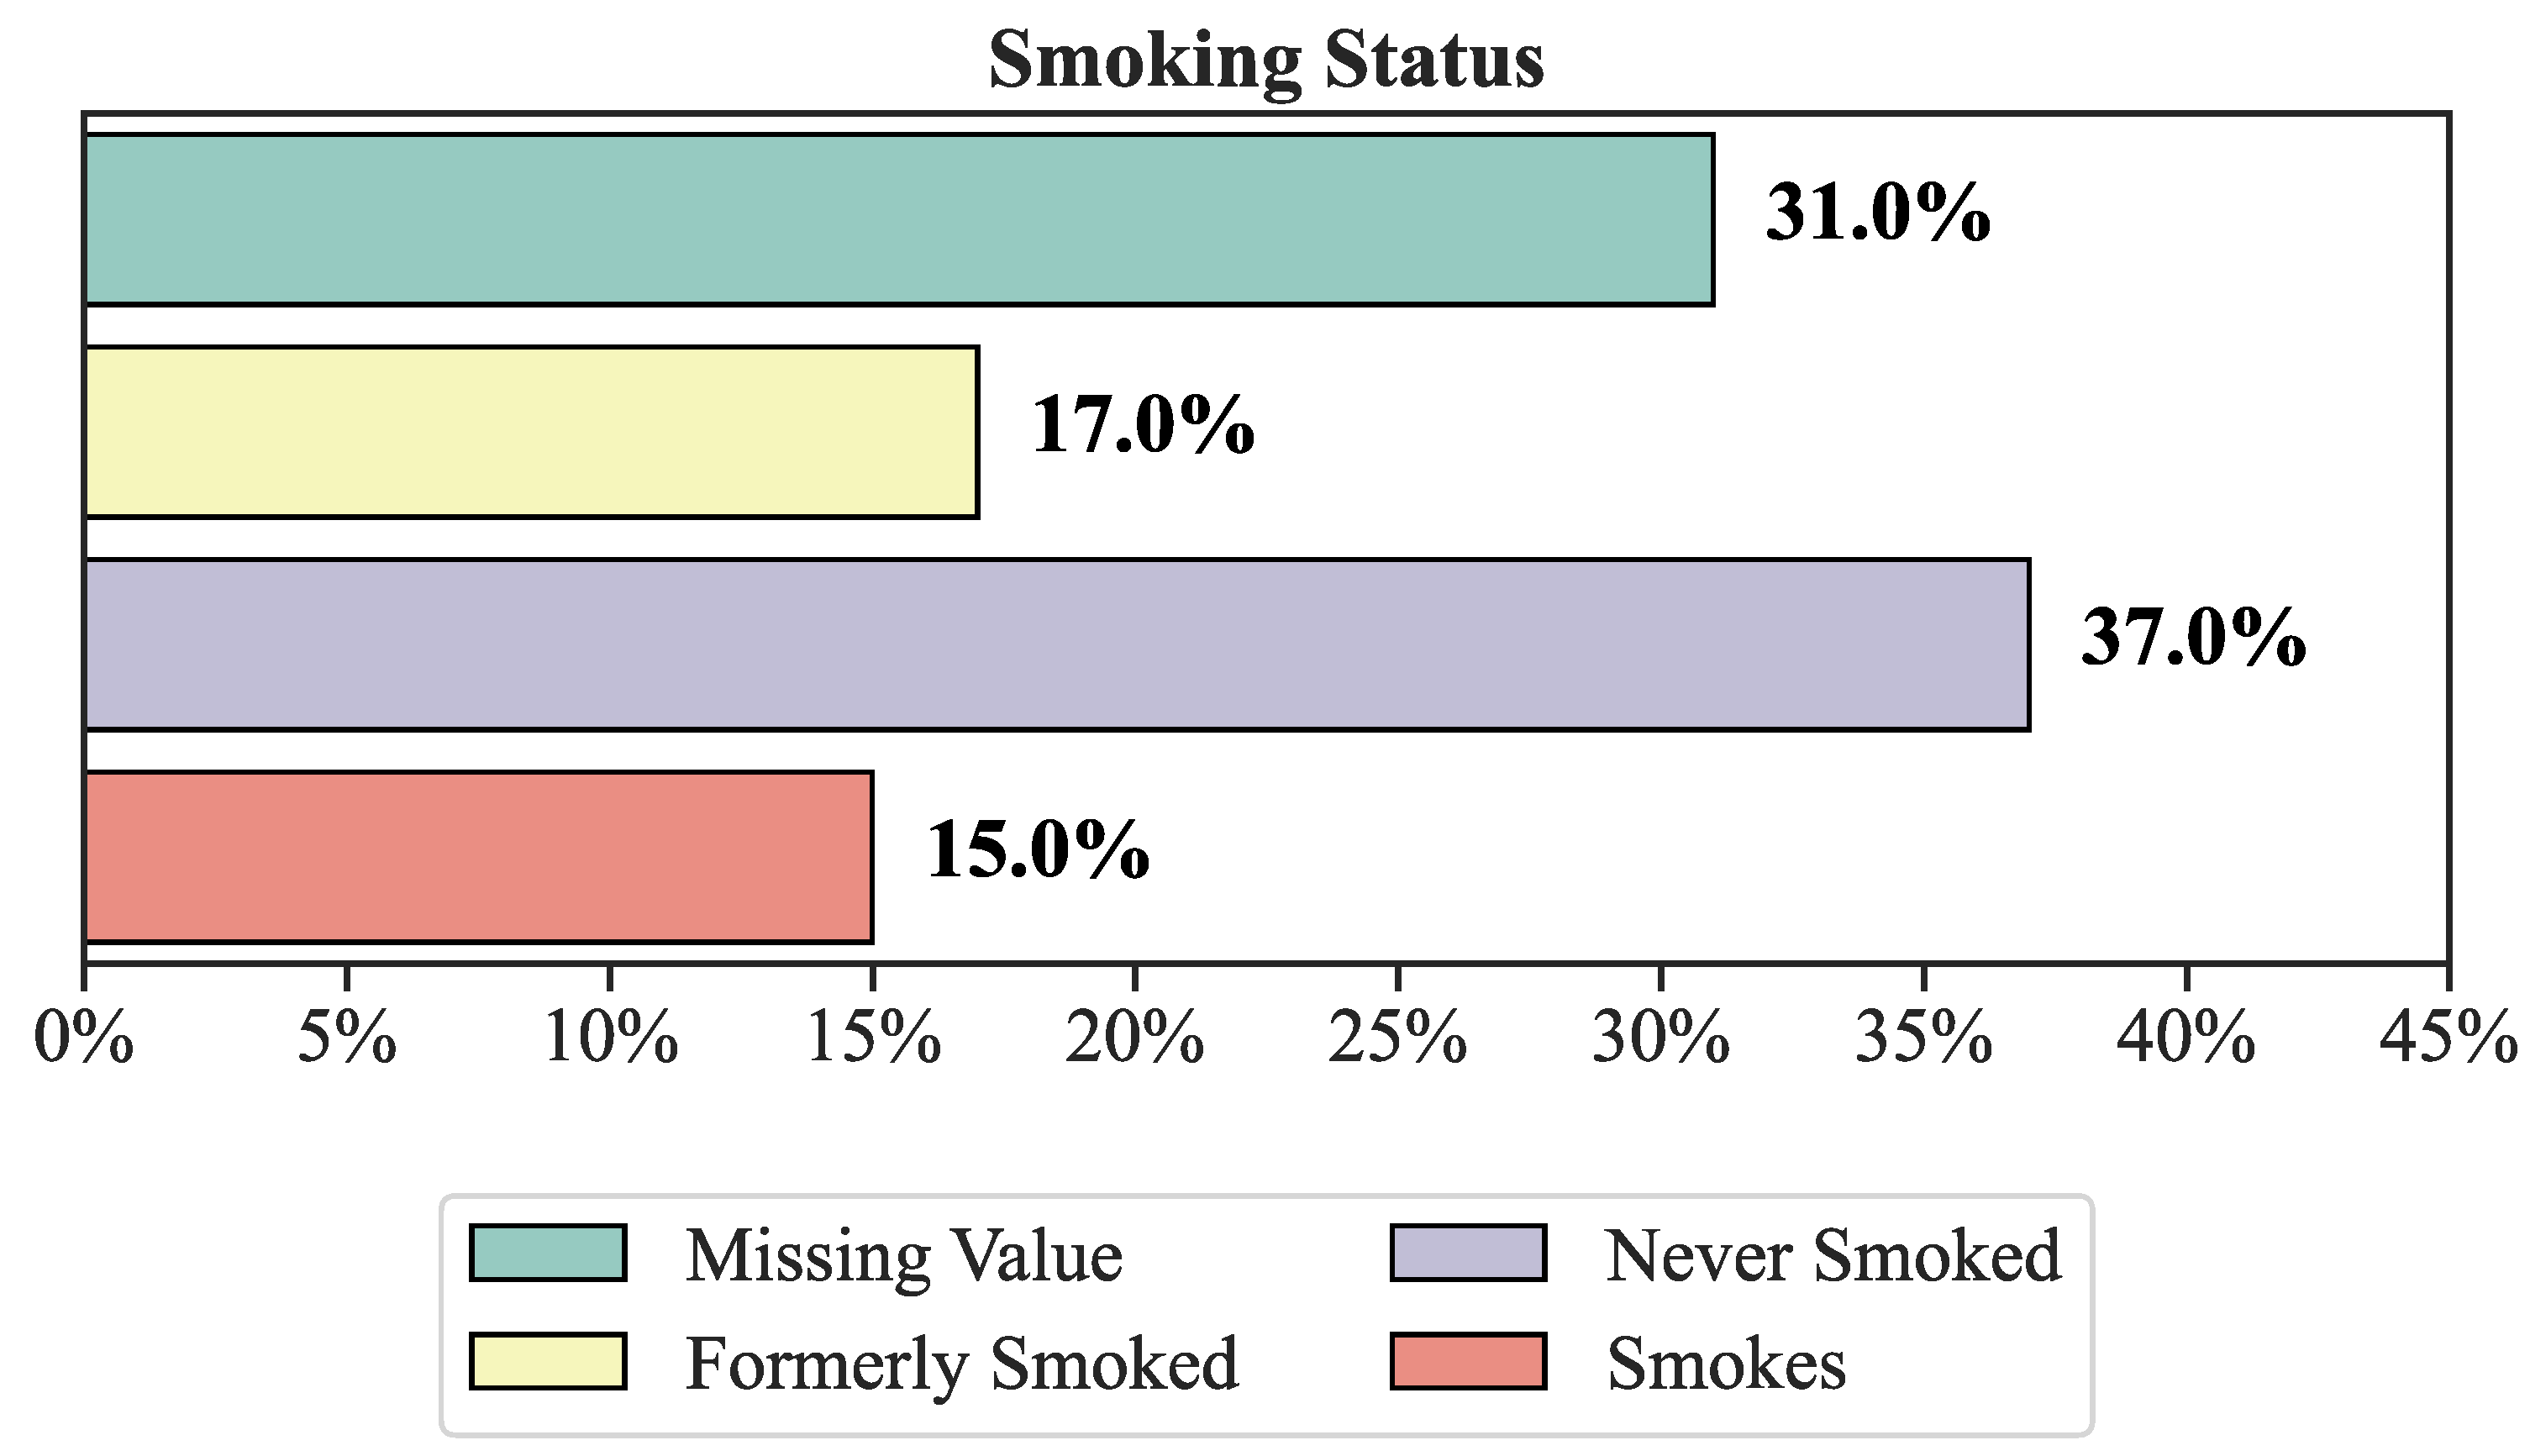
Figure 3 provides an overview of the dataset’s smoking status and current state. Turning to
Figure 3, we observe that 31% of the status information is incomplete, with 17% of individuals being frequent smokers, 37% having never smoked, and 15% maintaining a consistent smoking habit.
3.2. Data Preprocessing
Data preprocessing is a pivotal step in enhancing the quality and utility of the available information. Within the realm of this study, data preprocessing encompasses a multifaceted process that includes data cleansing, encoding, reduction, and transformation, among other crucial procedures. Data cleansing rectifies anomalies, corrects discrepancies, and adeptly addresses noisy data. In this study, missing values are effectively imputed by leveraging the mean of other available values. Subsequently, our dataset is standardized, and label encoding is applied to categorical data. To tackle data imbalance, three oversampling techniques are employed to refine the final output.
3.2.1. Data Encoding
Key factors are integral in both regression and classification research. However, machine learning algorithms inherently recognize only numerical attributes. To harness the full informational potential for machine learning applications, these attributes must be encoded into numeric representations, bridging the gap between data types. Among the various techniques, One Hot Encoding emerges as a popular choice, enabling the comparison of each level of categorical variables against a reference standard. In this study, categorical factors such as gender, marital status, employment, residency status, and smoking habits are subjected to One Hot Encoding. This process transforms a parameter with n values and characteristics into independent components, each with n values, while indicating the presence (1) or absence (0) of the associated category factor in each instance.
3.2.2. Data Generation
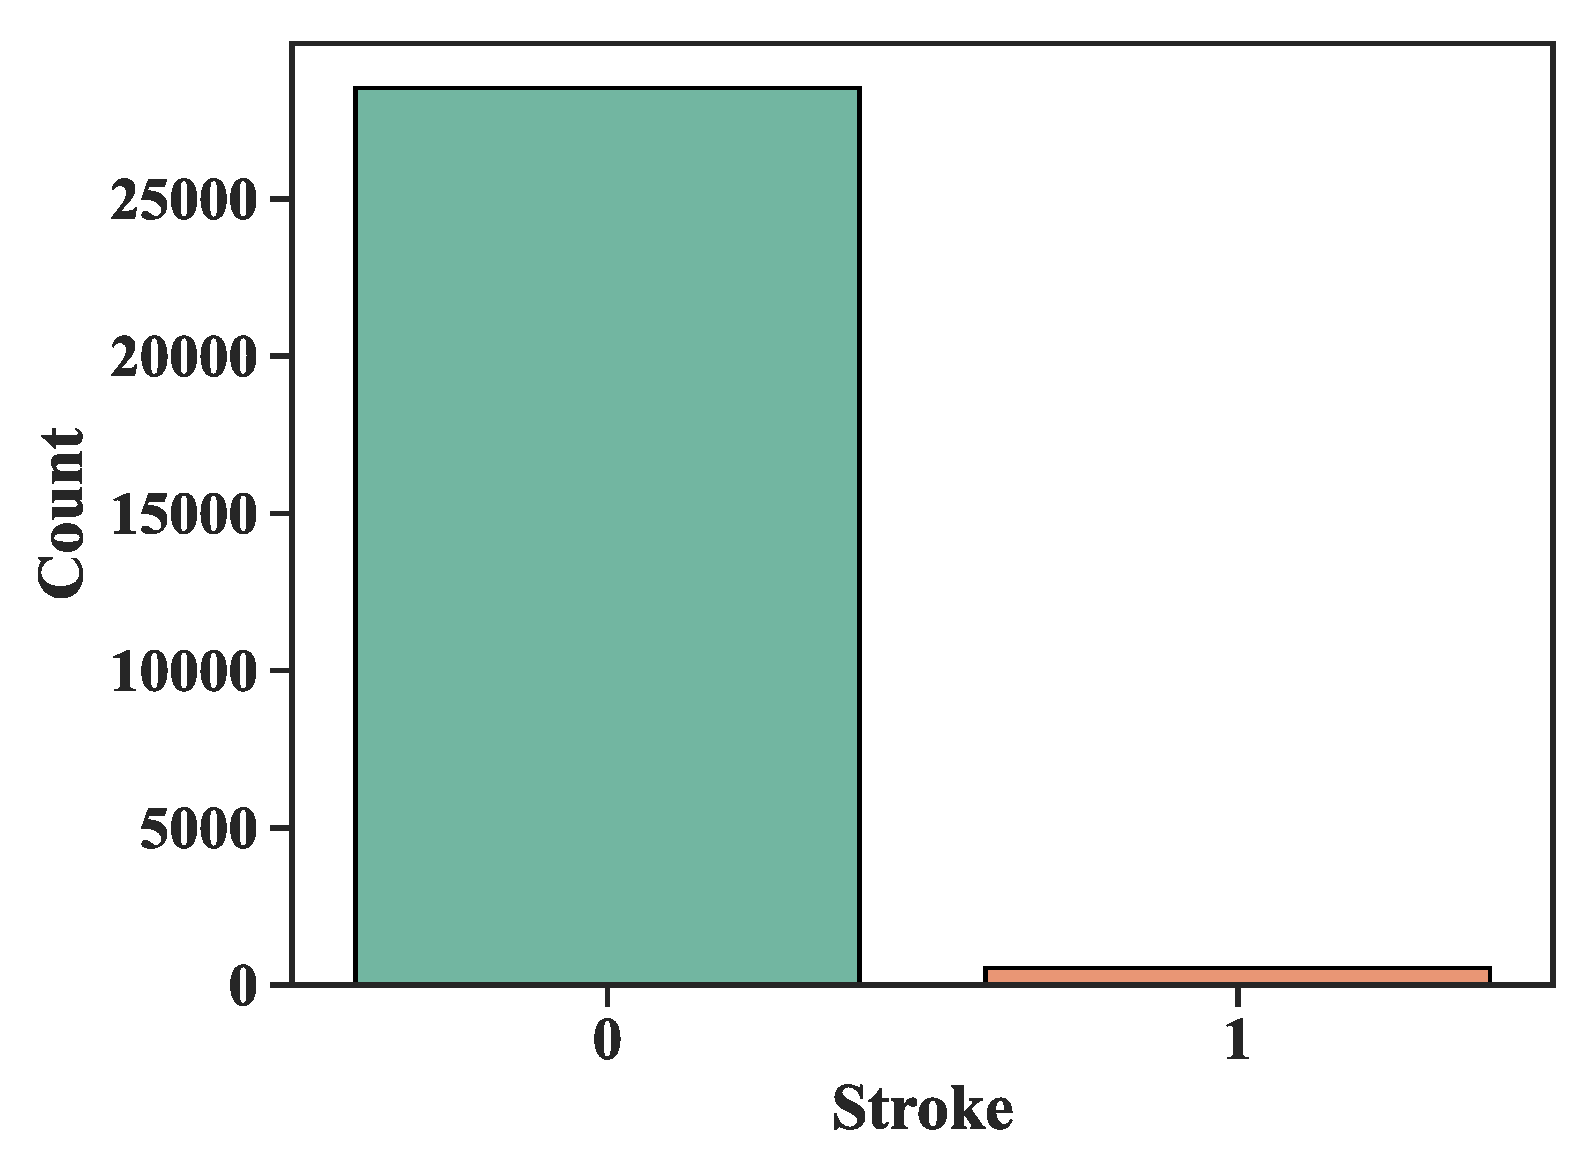
In the realm of ML, the utilization of a substantial volume of datasets is imperative. Many learning algorithms are inherently designed to discern and classify the predominant groups, presenting a formidable challenge in addressing class imbalance. Consequently, cases from minority groups are often prone to misclassification. Specific ML models are particularly sensitive to imbalanced data, underscoring the essentiality of data preprocessing as a prerequisite to model establishment. The dataset is characterized by an imbalanced proportion, with controls (0) representing approximately 98.21% and cases (1) comprising around 1.79% of the total observations.
Figure 4 illustrates the evident disparity in values between the 0 and 1 classes, prominently showcasing the need for the application of oversampling techniques as a means to rectify this imbalance.
Figure 5 shows the data distribution after implementing the oversampling technique. And below are the details of those three oversampling techniques.
Synthetic Minority Oversampling Technique
The Synthetic Minority Oversampling Technique (SMOTE) algorithm is employed to address the underrepresentation of certain groups, thereby optimizing the information available for analysis. This technique leverages linear interpolation to generate synthetic data for the underrepresented group. These synthetic records for each minority class example are meticulously crafted by randomly selecting one or more KNNs. This oversampling process entails the recreation of data, ultimately enabling the fitting of various models.
Adaptive Synthetic Sampling Approach
The Adaptive Synthetic Sampling Approach (ADASYN) algorithm relies on the density distribution to autonomously ascertain the requisite number of synthetic samples to be generated for each minority class instance. A core function of ADASYN in this algorithm is the assignment of weights to diverse minority class samples, enabling the creation of varying quantities of synthetic data for each individual sample. These weights are strategically assigned to facilitate the primary objective of the ADASYN method [
28].
Random Over-Sampling Technique
To ensure a more representative sample, many studies addressing the challenge of oversampling involve the reconfiguration of classes. The Random Over-Sampling Technique (ROSE) introduces two key novel procedures: model estimation and evaluation. ROSE employs a ROC curve to assess the quality of synthetic samples generated by the classifier. Additionally, for our estimates, we utilize either a bootstrap or cross-validation technique. The creation of synthetic cases is accomplished by implementing a smoothed bootstrap approach, enhancing estimator performance, particularly when dealing with a minority class [
29].
3.3. Feature Selection
In this feature selection process, we retain the most significant features while discarding any redundant ones. The dataset, in its original state, harbors a substantial volume of extraneous data that can impede our ability to make accurate predictions. Employing the SelectKBest approach, we discern the most pertinent data, resulting in a selection of 57,048 rows and 20 columns. This strategic reduction not only streamlines processing time but also enhances the overall predictive accuracy. This method for feature selection employs a chi-square
test-based approach. It calculates the chi-square score
for both target features and each non-negative independent feature [
30]. The chi-square (
) is determined by summing the squared differences between the observed (
) and expected (
) values across all instances. The formula [
31] is
3.4. Classification of Stroke Using Machine Learning Models
This section presents the different machine learning algorithms which have been implemented to classify the stokes patients and normal people.
3.4.1. Random Forest
RF is grounded in the collective learning theory. True to its name, RF functions as an ensemble learning method comprising multiple autonomous DTs. The number of DTs, each based on diverse subsets of the provided dataset, plays a pivotal role in enhancing the predictive accuracy of the dataset. Each decision tree is fed with test data, and these trees collectively generate outcomes. The majority vote among these outcomes is harnessed to arrive at a final prediction [
12,
32].
3.4.2. K-Nearest Neighbor
The K-Nearest Neighbor (KNN) method is a case-based learning strategy that remembers every step of the order’s preparation. Finding a small number of delegates to handle all the group preparation information is one way to increase efficiency. Using the training dataset to construct an inductive learning model and then applying this model (representatives) to the classification problem [
22]. When steady modulation evaluations of sample values are deceptive or hard to decide, the necessity to execute discriminant examination leads to the development of the KNN setup [
23], also developed with a combination of several DTs and allows for random variable selection in model construction, making it all stronger for interacting with overfitting in the forecast.
To predict a new record class, the algorithm compares similar records from the training set. If the records have n attributes, the algorithm considers them as a vector in n-dimensional space and predicts the class label based on distance criterion, such as Euclidean distance defined in Equation (
1) [
33].
3.4.3. Logistic Regression
Logistic Regression (LR) is the appropriate method of regression analysis when the dependent variable is categorical (binary). It is a form of predictive analysis similar to other regression investigations. LR examines the natural boundaries of a strategic technique in its regression research. The result of a categorical dependent variable is predicted by two maximum values. Probability values between 0 and 1 are provided, regardless of whether the answer is yes or no, 0 or 1, true or false, etc. [
3,
34]. LR technique produced a 99% accuracy in this study. The equation f LR is defined as:
where
is the success probability and
is the failure probability. The idea of probability, odds, and log odds are used to estimate the values of betas [
35].
4. Evaluation Method
The strength of the relationship between two factors may be evaluated with the help of correlation. The correlation coefficient provides a numerical representation of the extent to which the two variables are comparable [
36]. Pearson’s Product Moment Correlation Coefficient (PPMCC) and Spearman’s Rank Correlation Coefficient (SRCC) are the two correlation coefficients utilized in most applications. This investigation of the relationship between variables centers on the use of PPMC, which is the primary emphasis of this study. Suppose the concept of one attribute is beneficial and identical to the idea of some other attribute. In that case, there appears to be a positive connection between them, which can produce a good Pearson correlation. A positive correlation between the two attributes can be made if this is the case. However, even if the concept of one parameter is optimistic and the trend of another variable is practically negative, there is still the possibility that the two variables have a negative relation [
36].
This is the case regardless of whether or not the concept of the other variable is practically negative. A result is considered a True Positive (TP) if the model correctly predicts the presence of the positive class. Similarly, a True Negative (TN) is an outcome in which the model correctly predicts the class to be negative. A result is said to have a False Positive (FP) classification when the model wrongly predicts the presence of a positive class. A False Negative (FN) is an outcome that occurs when the model wrongly predicts the negative class. In this case, the stroke boundary was employed as a predictor parameter, while the remainder of the area, including its bounds, was used as response variables. Only double characteristics are acceptable for the stroke boundary, with 0 referring to non-stroke and 1 referring to stroke. To train the models, the entire dataset was divided into a training set consisting of 80% of the data and a test set composed of 20% of the data. There have been several formulae that have been used for performance evaluation.
As a performance evaluation tool for ML strategies, this section also analyzes the area Area Under the Curve-Receiver Operating Characteristic (AUC-ROC) curve and the Precision-Recall curve. In the field of clinical epidemiology, ROC analysis is utilized to determine how correctly medical diagnostic tests (or systems) can differentiate between two states, which are often referred to as “diseased” and “non-diseased”. A good model will have an AUC close to 1, indicating a high separability measure. A lousy model will have an AUC that is close to 0, which suggests that it has a weak separability metric.
5. Results and Discussion
The work uses multiple oversampling strategies to illustrate three ML algorithms for imbalanced data analysis and predicting stroke. Dataset sample sizes generated by SMOTE, ADASYN, and ROSE are all considered and compared to one another to conclude the methods’ relative efficacies. RF, KNN, and LR models were implemented to compare the results of the oversampling dataset. The number of instances was increased proportionally using oversampling techniques, including SMOTE, ADASYN, and ROSE. The distributions of the sample ratios for the oversampling data are summarized in
Table 1.
Figure 5 displays what changes were performed to the “Yes” and “No” samples in the dataset following the oversampling steps. Then, the dataset is divided into a training set of 80% and a test set of 20%. RandomizedSearchCV was utilized to validate the ability to predict the models.
As depicted in
Figure 6, the most substantial correlation coefficient is observed between age and hypertension, with a value of 0.26. On the other hand, the weakest significant correlation coefficient is found between BMI and stroke, registering at −0.004. Notably, it is negative but it has statistically insignificant association between BMI and stroke. While the correlation between age and hypertension is of a weakly positive nature, it is still recognized as a valid connection [
36]. A correlation coefficient of 0.25 indicates a significant positive association between age and heart disease. Furthermore,
Figure 6 also reveals that the lowest significant positive correlation coefficient, at 0.23, is observed between age and average glucose level. As illustrated in
Figure 6, each feature exhibits the potential to provide a unique and valuable contribution to the prediction of cerebral strokes.
As depicted in the confusion matrix (
Figure 7), the test data outcomes were evaluated by applying three ML algorithms, RF, KNN, and LR, to oversampled data. The results indicate a significant impact on prediction accuracy when employing oversampling techniques. Detailed performance analysis, as presented in
Figure 7, shows that the prediction model generated using the ADASYN method achieved the highest level of accuracy among the three oversampling approaches.
For all three oversampling strategies, the True Positive and True Negative values in the Random Forest confusion matrix are given more weight than the corresponding False Positive and False Negative values in
Figure 7. The findings demonstrated that the RF, KNN, and KR with ADASYN models are better than the other models available and have the best level of result. Based on the confusion metrics collected during the testing phase, the ranking of the applied models’ performances is as follows: ADASYN, SMOTE, and ROSE. Furthermore, given age, hypertension, heart disease, average glucose level, BMI, and stroke, our suggested model predicts the occurrence of cerebral brain strokes exponentially faster.
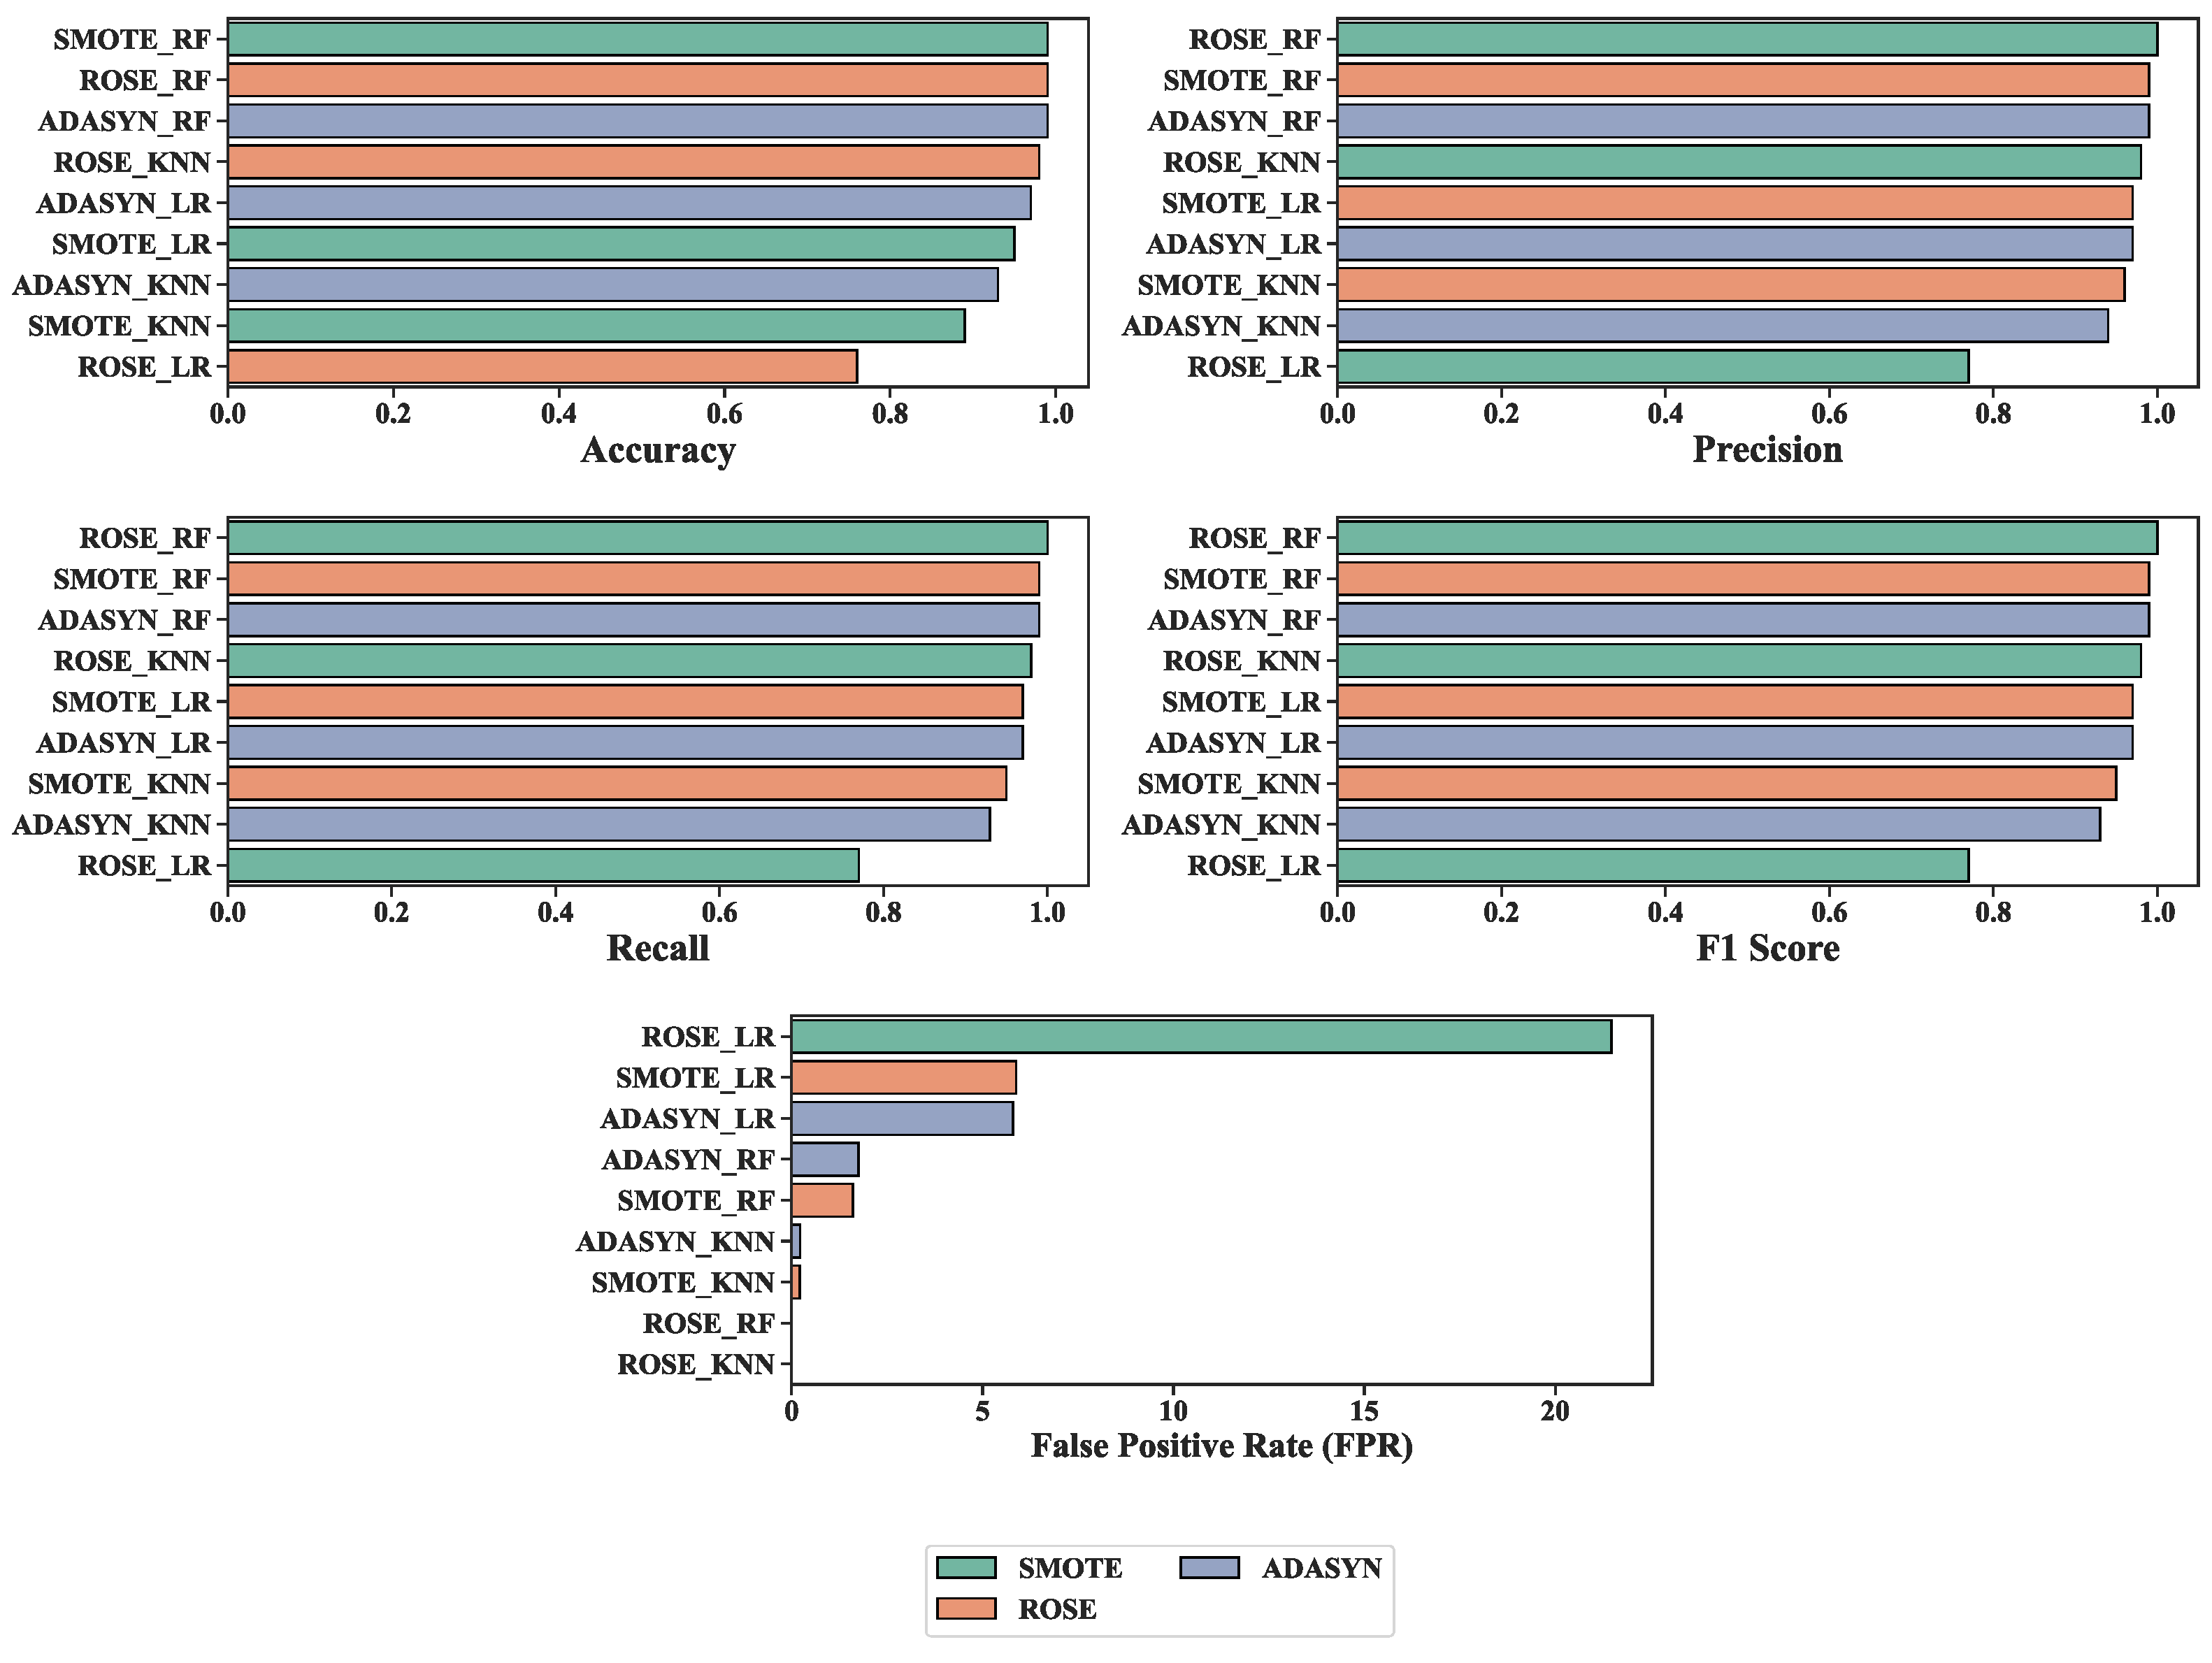
Figure 8 illustrates comparisons between all three methods with three oversampling techniques and the proposed ADASYN_RF with performance accuracy. Overall, the ADASYN_RF has the best accuracy (99%), precision (99%), Recall (99%), and F1-score (99%). Besides, the other models also achieved good accuracy. SMOTE_RF and ROSE_RF have better accuracy (99%) compared with others. Additionally, the ROSE_KNN and ROSE_RF models achieved 0 FPR. Among the oversampling techniques, ADASYN has the highest accuracy score of the three models- RF, KNN, and LR with 99%, 93%, and 97%, respectively. Utilizing the ADASYN method, RF showed superior accuracy compared to the other two algorithms. It achieved 99% accuracy. The accuracy of the different classifiers, namely KNN and LR, is 93% and 97%, respectively, after implementing ADASYN. With SMOTE, the accuracy of KNN and LR is 89% and 95%, respectively. Using the ROSE method, RF has done better than the other algorithms regarding accuracy. And the accuracy rates for SMOTE_KNN and SMOTE_LR are 90.08%, and 90.91%, respectively.
The Recall is one of the critical metrics to consider when analyzing its efficacy. ADASYN_RF has the highest recall score and low FPR (1.75%). On the other hand, the other models also have low FPR.
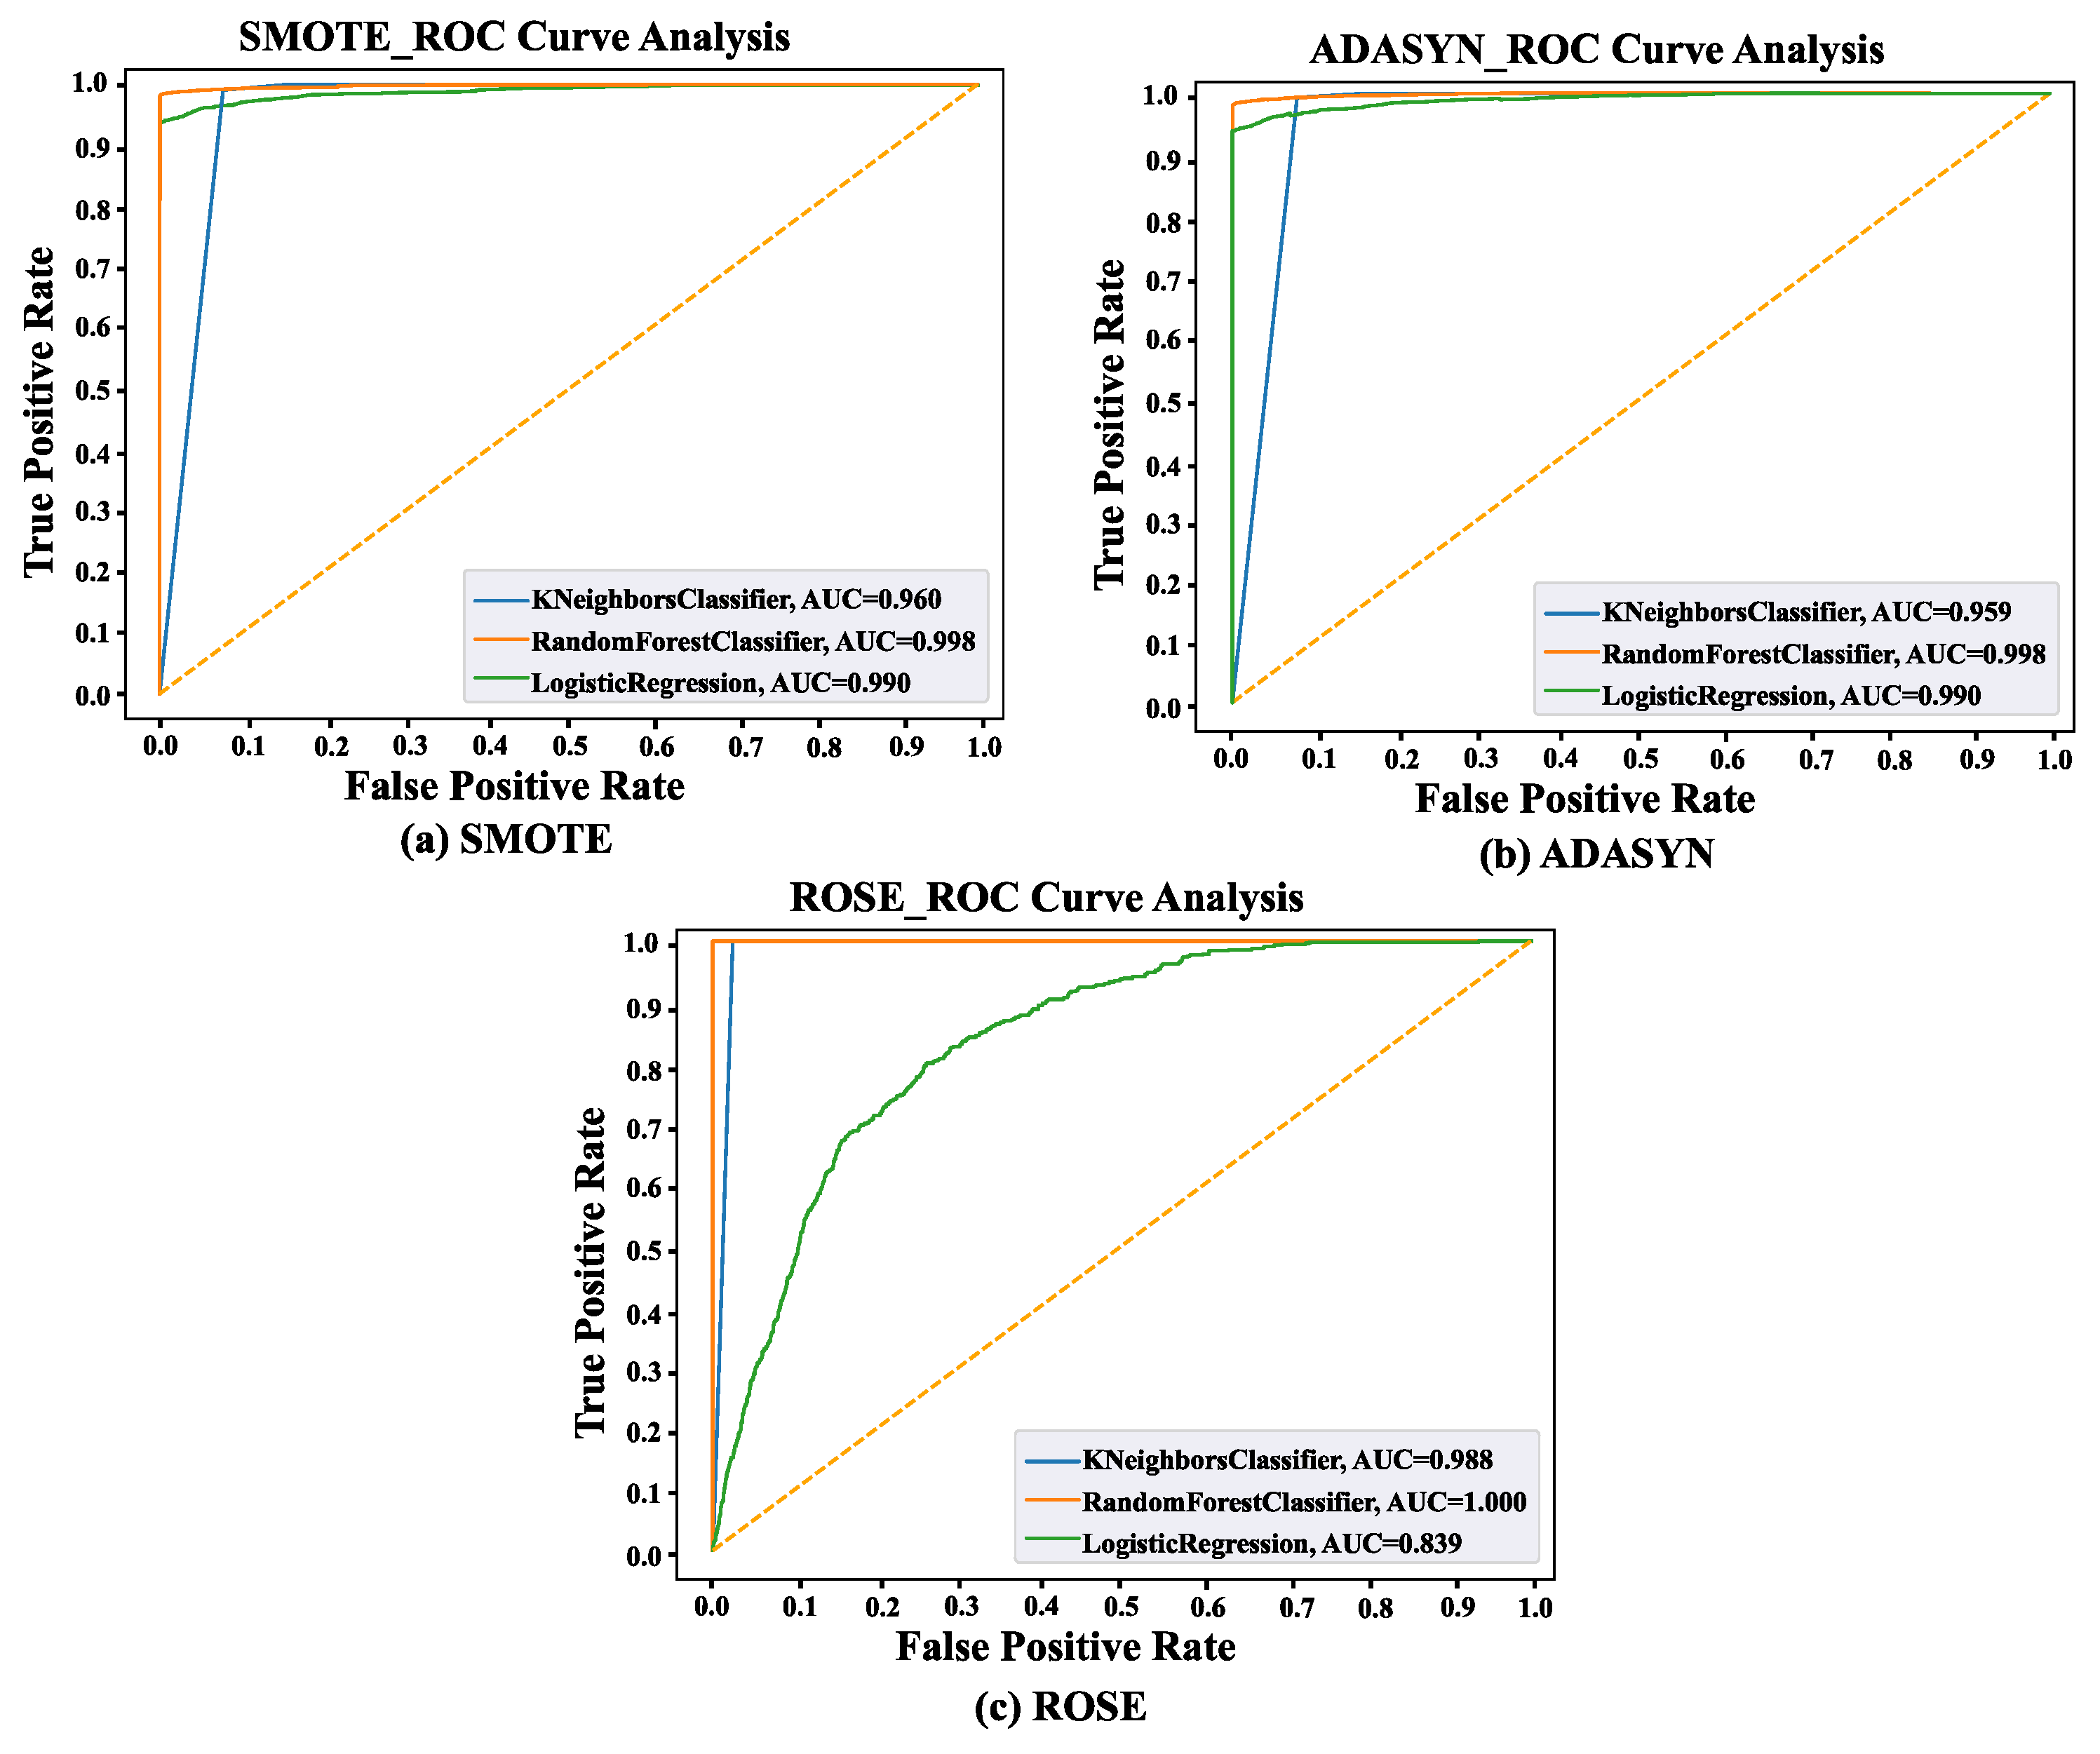
Receiver Operator Characteristic (ROC) curves show model False Positive Rate–True Positive Rate trade-offs. Classifiers perform better when their ROC curves are closer to the graph’s top-left corner.
Figure 9 displays ROC curves for classifiers employing three oversampling techniques. The two-dimensional graph shows the False Positive Rate on the x-axis and the True Positive Rate on the y-axis. The ROC curves of the classifiers have shifted closer to the upper left corner of the graph. According to the examination of the ROC curve, after utilizing SMOTE, RF, KNN, and LR have 99%, 96%, and 99% AUC scores, respectively. On the other hand, 99%, 95%, and 99% AUC scores were obtained from RF, KNN, and LR, respectively, after using ADASYN. Lastly, RF, KNN, and LR got 100%, 98%, and 83% AUC scores from SMOTE data.
Precision-Recall curves also show the model’s true positive rate and positive predictive value trade-offs, as shown in
Figure 10. High precision relates to a low false positive rate, and high Recall relates to a low false negative rate. It describes the best techniques for cerebral stroke prediction. Both high scores show the ability of the classifier to provide accurate results. With the SMOTE technique, the AUC score from the precision-recall curve for KNN, RF, and LR are 96%, 99%, and 99%, respectively. After Using ADASYN, 96%, 99%, and 92% AUC scores were achieved from KNN, RF, and LR, respectively. Lastly, KNN, RF, and LR have obtained 98%, 100%, and 80% AUC scores after implementing ROSE. Overall, using three oversampling techniques, RF provides the highest score compared with other algorithms.
Comparative Study
To evaluate the quality of this study, it’s necessary to assess the other existing works to evaluate its quality. This study was conducted to predict stroke among individuals of varying age, occupation, and socioeconomic status.
Table 2 shows that the present study provides better results than previous studies. With an accuracy of 99%, this study shows sufficient possibility. The assessment is compared in terms of the performance matrix. Following on from the previous work review, the majority of articles’ most common limitations are data and classification precision of models. Common model classification accuracy scores in studies are satisfactory. The primary goal of ADASYN_RF is to increase the percentage of successful minority attack defections while also enhancing overall detection accuracy by handling data imbalance data. Among all the models, our ADASYN_RF algorithm has the best rate of finding threats. Besides, it has improved precision, Recall, and a higher F1-score and lower FPR.
A study achieves 85.82% accuracy using DNN on 85 images (normal and stroke patients). [
11] RSTs-RF [
9], SMOTE-RF [
16], and DNN [
12] approaches obtained around 90% accuracy. According to GB [
3], it evaluated normal and stroke patients and obtained an accuracy of 94.49%. The accuracy of SMOTE_3NN [
6], ANN [
19], and CNN [
8] models is close to the proposed models. WV [
9] achieves 97% accuracy with high FPR. Most studies used RF algorithms, but the current study obtained better results than the other RF models.
We provide a comprehensive comparative analysis of the proposed methods relative to prior studies, emphasizing the distinct datasets and oversampling techniques employed across various methodologies. Compared to prior studies, RF often produces first-rate (estimated 0.99 AUC) predictions for stroke. The dataset is far more extensive than the study above, with 43,400 samples. For ML algorithms, information quantity is the most important aspect. To get the most out of its model, supervised ML needs a ton of labeled data. Another consideration is the reliability of the information being used. The necessity of large training datasets may hamper the precision of ML algorithms in research. ML mistakes can result from low-quality data, such as mislabeled or contradictory information. As well as ADASYN helps to reduce variances of the dataset after the RF model is employed which provides a better result. Oversampling techniques allow for more measuring points and more precise averaging due to more samples. Besides, our study only focused on binary classification, not on multi-class classification and we didn’t cover the types of stroke in this study. In the Future, this study will expand on image data. Hopefully, this research will lead to more widespread use of ML techniques for examining healthcare data.
6. Conclusions
This study proposed an ML technique for combining incomplete datasets, data cleansing, data balancing, absolute data encoding to numerical data, hyperparameter tweaking, and performance assessment. Three different algorithms, RF, KNN, and LR, have been utilized with three oversampling methods- SMOTE, ADASYN, and ROSE. This study demonstrates the ADASYN_RF algorithm’s high efficacy on the cerebral stroke prediction dataset. Besides, AUC can also help determine which kind of categorization is best. Following this procedure, cerebral stroke may more accurately be predicted using ADASYN_RF methods. In addition to the numerous base estimators, we employed AUC-ROC analysis to investigate and identify the best features in the supplied dataset. The receiver operating characteristic (ROC) graph combines the confusion matrix for each threshold based on the number of false positives received. Furthermore, the study employs a distributed ML model to enhance stroke prediction, contributing to advancements in this critical healthcare domain.


 ,
, 


