Abstract
This work aims to conduct an analysis to find opportunities for the implementation of software incorporating the concept of digital twins for foundry work. Examples of implementations and their impact on the work of enterprises are presented, as is a definition and history of the concept of a digital twin. The outcome of this work is the implementation of software that involves a digital copy of the author’s device, created by the “Łukasiewicz” Research Network at the Krakow Institute of Technology. The research problem of this scientific work is to reduce the number of necessary physical tests on real objects in order to find a solution that saves time and energy when testing the thermal expansion of known and new metal alloys. This will be achieved by predicting the behavior of the sample in a digital environment and avoiding causing it to break in reality. Until now, after an interruption, the device often continued to operate and collect data even though no current was flowing through the material, which could be described as inefficient testing. The expected result will be based on the information and decisions obtained by predicting values with the help of a recurrent neural network. Ultimately, it is intended to predict the condition of the sample after a set period of time. Thanks to this, a decision will be made, based on which the twin will know whether it should automatically end its work, disconnect the power or call the operator for the necessary interaction with the device. The described software will help the operator of a real machine, for example, to operate a larger number of workstations at the same time, without devoting all their attention to a process that may last even for hours. Additionally, it will be possible to start work on selecting the chemical composition of the next material sample and plan its testing in advance. The machine learning handles model learning and value prediction with the help of artificial neural networks that were created in Python. The application uses historical test data, additionally retrieves current information, presents it to the user in a clear modern form and runs the provided scripts. Based on these, it decides on the further operation of the actual device.
1. Introduction
A digital twin (DT) is the idea of software or an entire system in which the main and most important feature is the mapping of a physical object in the form of its digital representation in the most comprehensive way possible, containing all possible knowledge about the real object [1]. Such an application includes not only the technical data contained in the specification but also complex behavioral models, thanks to which it is possible to simulate and predict the results of the processes performed [2]. The concept of a DT is very general in its assumptions: it does not specify any method of creating a twin and does not propose the information technologies that can be used, or what the minimum and maximum complexity of the virtually recreated objects, tools or entire structures may be (although ultimately it should be as complex as possible). People interested in the concept are trying to describe and create digital twins in many different industries [3], for example, in the general industry (metal processing, CNC machines), architecture (bridges, tunnels, buildings), automotive and transport (autonomous cars and driver assistance systems, monitoring streets, intersections and tracks) and even medicine (observation of patients’ health and the effect of drugs on the body). In each of these environments, software is created that helps people in, among other things, controlling the parameters of real machines or objects, planning their modification in order to gain energy, time and, as a result, financial gain. Nowadays, such solutions are not surprising, and the creators may not even know about the existence of the applied concepts because the technology offers a wide range of possibilities for applications virtually anywhere. Digital twin technology, due to its dynamic development in recent years, is often presented alongside other new, popular concepts [4] as an element, including Industry 4.0, Smart City, Smart Factory or Internet of Things. This idea also uses increasingly popular technologies used to acquire, process and present data, i.e., Blockchain [1], Artificial Intelligence (AI) and image recognition [5], 5G networks [2] and Virtual and Augmented Reality [3] (VR and AR). The progress achieved in each of the above-mentioned concepts also translates into the improved operation and development of the capabilities of digital twins, which can be considered a great advantage of this cooperation. Authors of scientific articles distinguish concepts similar to digital twins, recognizing that they are often confused with each other, thanks to which the features that will be needed to create DTs have become clearer. Digital Models and Digital Shadow [6], as they are referred to, are distinguished from digital twins by the use of a partly manual data flow; in the case of the former, the exchange of information takes place only at the request of a human, while the latter only during the transfer of data from a real object to digital (data flows automatically in the opposite direction). Based on these differences, we learn that a twin should operate in a fully automated manner. One of the newest and most technically advanced examples of the use of a digital twin is the K-Twin SJ system, which was introduced in South Korea [7]. It is a multi-functional platform for managing dams and watersheds on the 173 km long Sumjin River, which was launched in 2022. The need to create this system resulted from climate change, which in recent years has brought prolonged rainy seasons, leading to two major floods on the Asian peninsula. In order to prevent losses, control water flows and regulate reservoirs, a highly advanced project was created that digitally reproduces 91 elements of water infrastructure. The 3D visualization, analysis and optimization of operation on dams is based on high-precision geospatial data, digital twins of the devices used, historical and real-time data, an advanced drone area monitoring system, the prediction of water behavior using artificial intelligence and analysis of a set of images from industrial cameras. Action scenarios during floods and their probability of occurrence are developed on an ongoing basis. Artificial intelligence analyzes images from drones and cameras to provide early warning of impending difficulties. The efficiency of the system and the quality of prediction were checked on historical flood data from April 2020, confirming a high degree of correct decisions (the Nash–Sutcliffe efficiency coefficient was 0.95). Due to the fact that the system has only been operating for less than a year in real conditions, its real usefulness cannot be assessed yet. However, the level of complexity of all the subsystems and their interconnection makes it an undertaking of the highest scale. Modern machines and devices for collecting data appeared several years ago also in agriculture. Thanks to this, proposals were made to use them to create systems connecting the world of living beings, animals and tools for breeding purposes, as well as for cultivating the land. Some of these examples are just concepts, but it is worth paying attention to a few of those that have actually been implemented. Due to tasks that are more complex than just real-time resource monitoring, the following digital twin implementations are worth mentioning [8]:
- DT of a stand-alone unit for growing fish and vegetables using the aquaponics method—This running prototype of the twin uses information about the temperature, light intensity, pH and salts dissolved in the water to create a simulation of how the fish should be fed, all in order to find the optimal behavior of the entire system. This is conducted by determining the ideal changes in fish weight and aquatic plant growth to maximize the finished products while finding water savings, minimizing waste production and maintaining quality standards and secondary production goals.
- DT of bee families—a twin introduced to monitor nectar, prevent pests and maintain health among individuals. It is based on GPS data with sensors of the humidity, temperature inside and outside the apiary and the weight of new creatures in the hatchery. Beekeepers monitor the hives in real time, make decisions about interaction, remotely determine food doses and identify anomalies, hygiene and the colony life stages. At the same time, they minimize contact between bees and humans, without interfering with natural processes.
- DT tractors—Modern tractors are equipped with modern and autonomous interfaces with which they can be integrated to achieve even greater benefits. This twin was introduced to actively monitor the device’s health and prevent faults. In this way, downtime is minimized, which significantly determines the size of the harvest, and therefore the farmers’ earnings.
Summarizing the presented examples of current implementations of digital twins, it can be established that they work mainly using object modeling and analysis of historical and real-time data. At the same time, the analyzed articles showed that DTs are currently most often used for monitoring real parts of a system, predicting errors and failures, integrating several existing technologies and conducting process simulations in order to gain energy or time by finding the optimal parameters and predicted behaviors.
The aim of the scientific work is to reduce the number of necessary physical tests on real objects in order to find a solution that saves time and energy when testing the thermal expansion of known and new metal alloys. The new materials are tested to avoid the failure of the foundry machines using parts made from the new material, by predicting the break moment using a learning algorithm. This will be achieved by predicting the behavior of the sample in the digital environment and avoiding causing it to break in reality. Until now, after an interruption, the device often continued to operate and collect data even though no current was flowing through the material, which could be described as inefficient testing. The expected result will be based on the information and decisions obtained by predicting values with the help of a recurrent neural network. Ultimately, it is intended to predict the condition of the sample after a set period of time. Thanks to this, a decision will be made, from which the twin will know whether it should automatically end the work, disconnect the power or call the operator for the necessary interaction with the device. The described software will help the operator of a real machine, for example, to operate a larger number of workstations at the same time without devoting all their attention to a process that may last even for hours. Additionally, it will be possible to start work on selecting the chemical composition of the next material sample and plan its testing in advance. The application we are creating will be an example of a digital twin, which means that it has several functions, such as simulating the behavior of a real device, performing two-way data exchange between the real and digital counterpart and additionally serving as a convenient interface for data management and review of historical information and the current parameters.
2. Materials and Methods
The research problem of this scientific work is to reduce the number of necessary physical tests on real objects in order to find a solution that saves time and energy when testing the thermal expansion of known and new metal alloys. This will be achieved by predicting the behavior of the sample in the digital environment and avoiding causing it to break in reality. Additionally, it will be possible to start work on selecting the chemical composition of the next material sample and plan its testing earlier. In order to ensure its greatest universality, it was decided to implement a web application, available on various devices anywhere in the production hall that have access to the Internet, but also outside it, e.g., during remote work. Thanks to this, the end device does not need much computing power because it only serves as an interface for calling calculations on the server. Additionally, the created software, after its integration with a production machine, may ultimately become a fully automatic and independent system that only needs to be supervised from the outside and not actively controlled, as is currently the case. To sum up, the created project will consist of several separate elements: a user interface available in a web browser, a server managing calculations and responsible for communication, a set of scripts solving current production problems and a database of information collected, so far in the form of files with little popularity.
2.1. Data Analysis for Algorithms
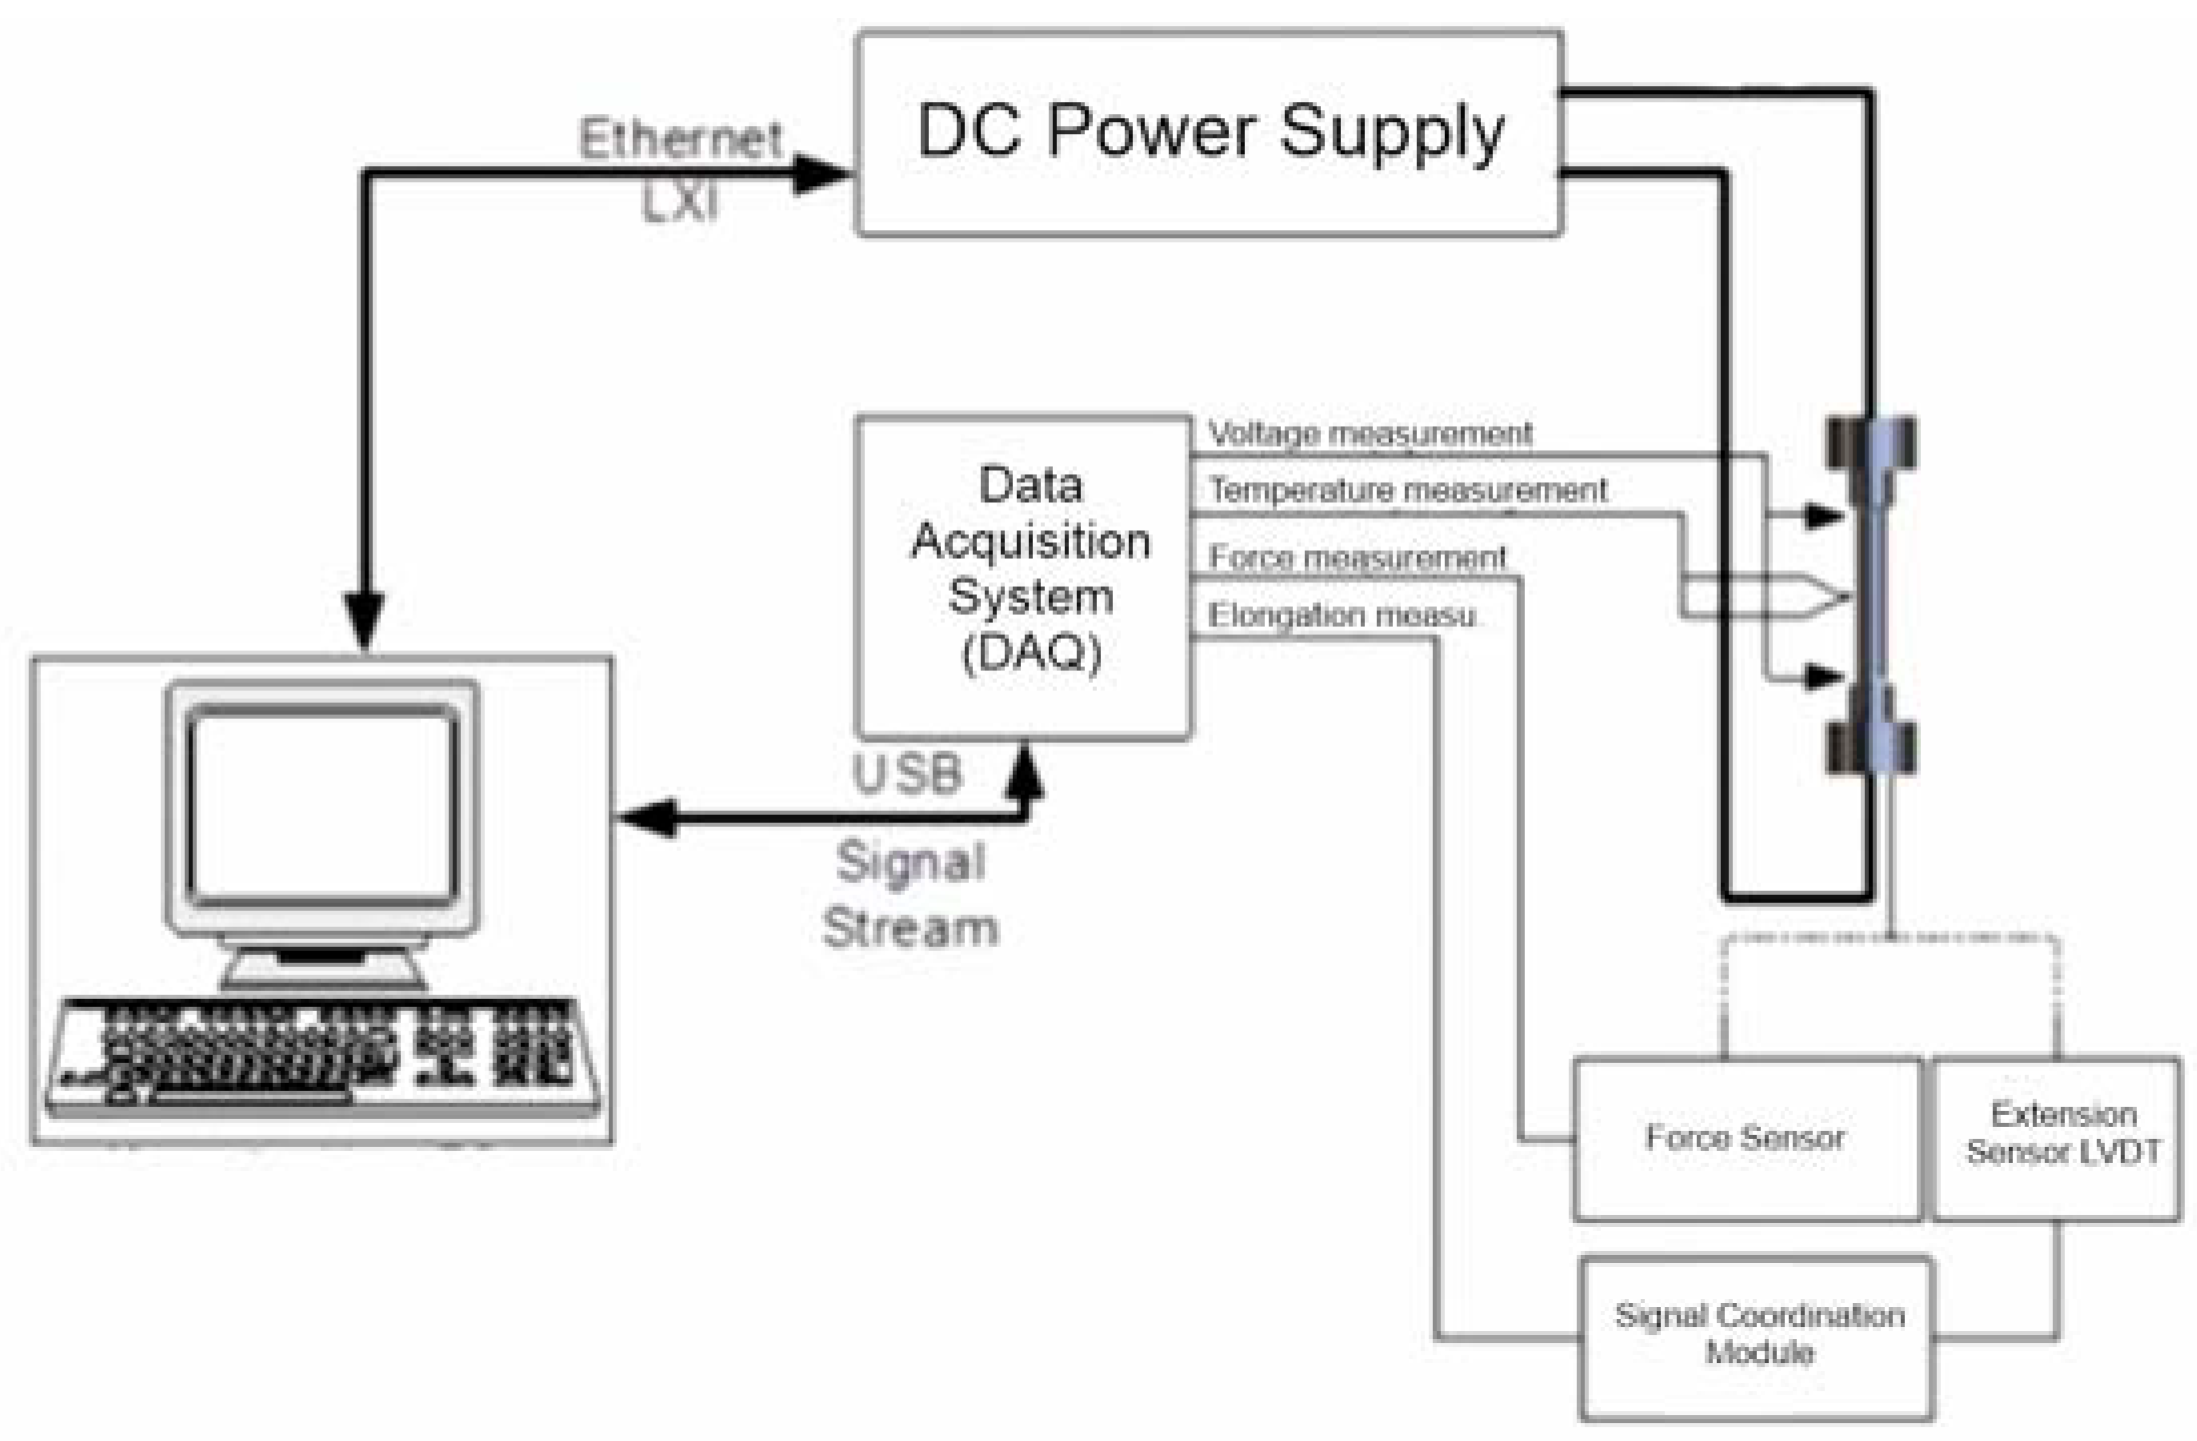
The data used in this work come from an original device located with the Łukasiewicz Research Network at the Krakow Institute of Technology for testing the resistance to thermal fatigue of metallic materials. The diagram of this device included in the documentation is shown in Figure 1. The test is carried out by measuring the forces acting on the frame during the cyclic heating and cooling of metal samples due to a current passing through them. The measurements begin with the initial configuration of the device, during which the maximum and minimum temperature limits to be reached by the sample (the available range from 0 to 1000 °C allows testing most popular iron alloys) and the current with which the equipment will operate (currently up to 330 A, with the possibility of increasing this value to 1000 A) are selected.
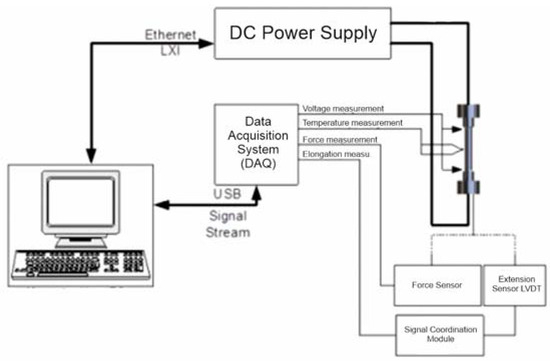
Figure 1.
Diagram of the measurement structure (with elements of the power supply subsystem).
This process is quite labor-intensive because its time can be counted in hours, depending on the metal alloy used and the experiment parameters. The test begins and ends as a result of the operator’s intervention, and the sensors placed in the machine record eight values at second intervals with high accuracy, even up to the ninth decimal place, which are sent to the computer via an NI cDAQ data acquisition system and saved as files with the extension .tdms. They can be read without specialized software, but using a free extension to the popular Microsoft Excel spreadsheet, and then we can save the section of data we are interested in in the form of a classic .csv file, thanks to which the user can read the following information:
- Temperature [°C]—current sample temperature,
- Resistance [Ω]—sample resistance value in a given second,
- Voltage [V]—value of the current measurement at both ends of the sample,
- Current [A]—information about the current stage of the cycle (if 330 A, the heating process is maintained; if 10 A, cooling is in progress),
- Force [N]—which the sample exerts on the material on the machine arms,
- Elongation [mm]—the length by which the sample shrank or expanded in the last second,
- Cycle number—iteration of the entire cycle (heating and cooling) current for a given second,
- Test time—in seconds, point at which the remaining data were downloaded from the start of the test.
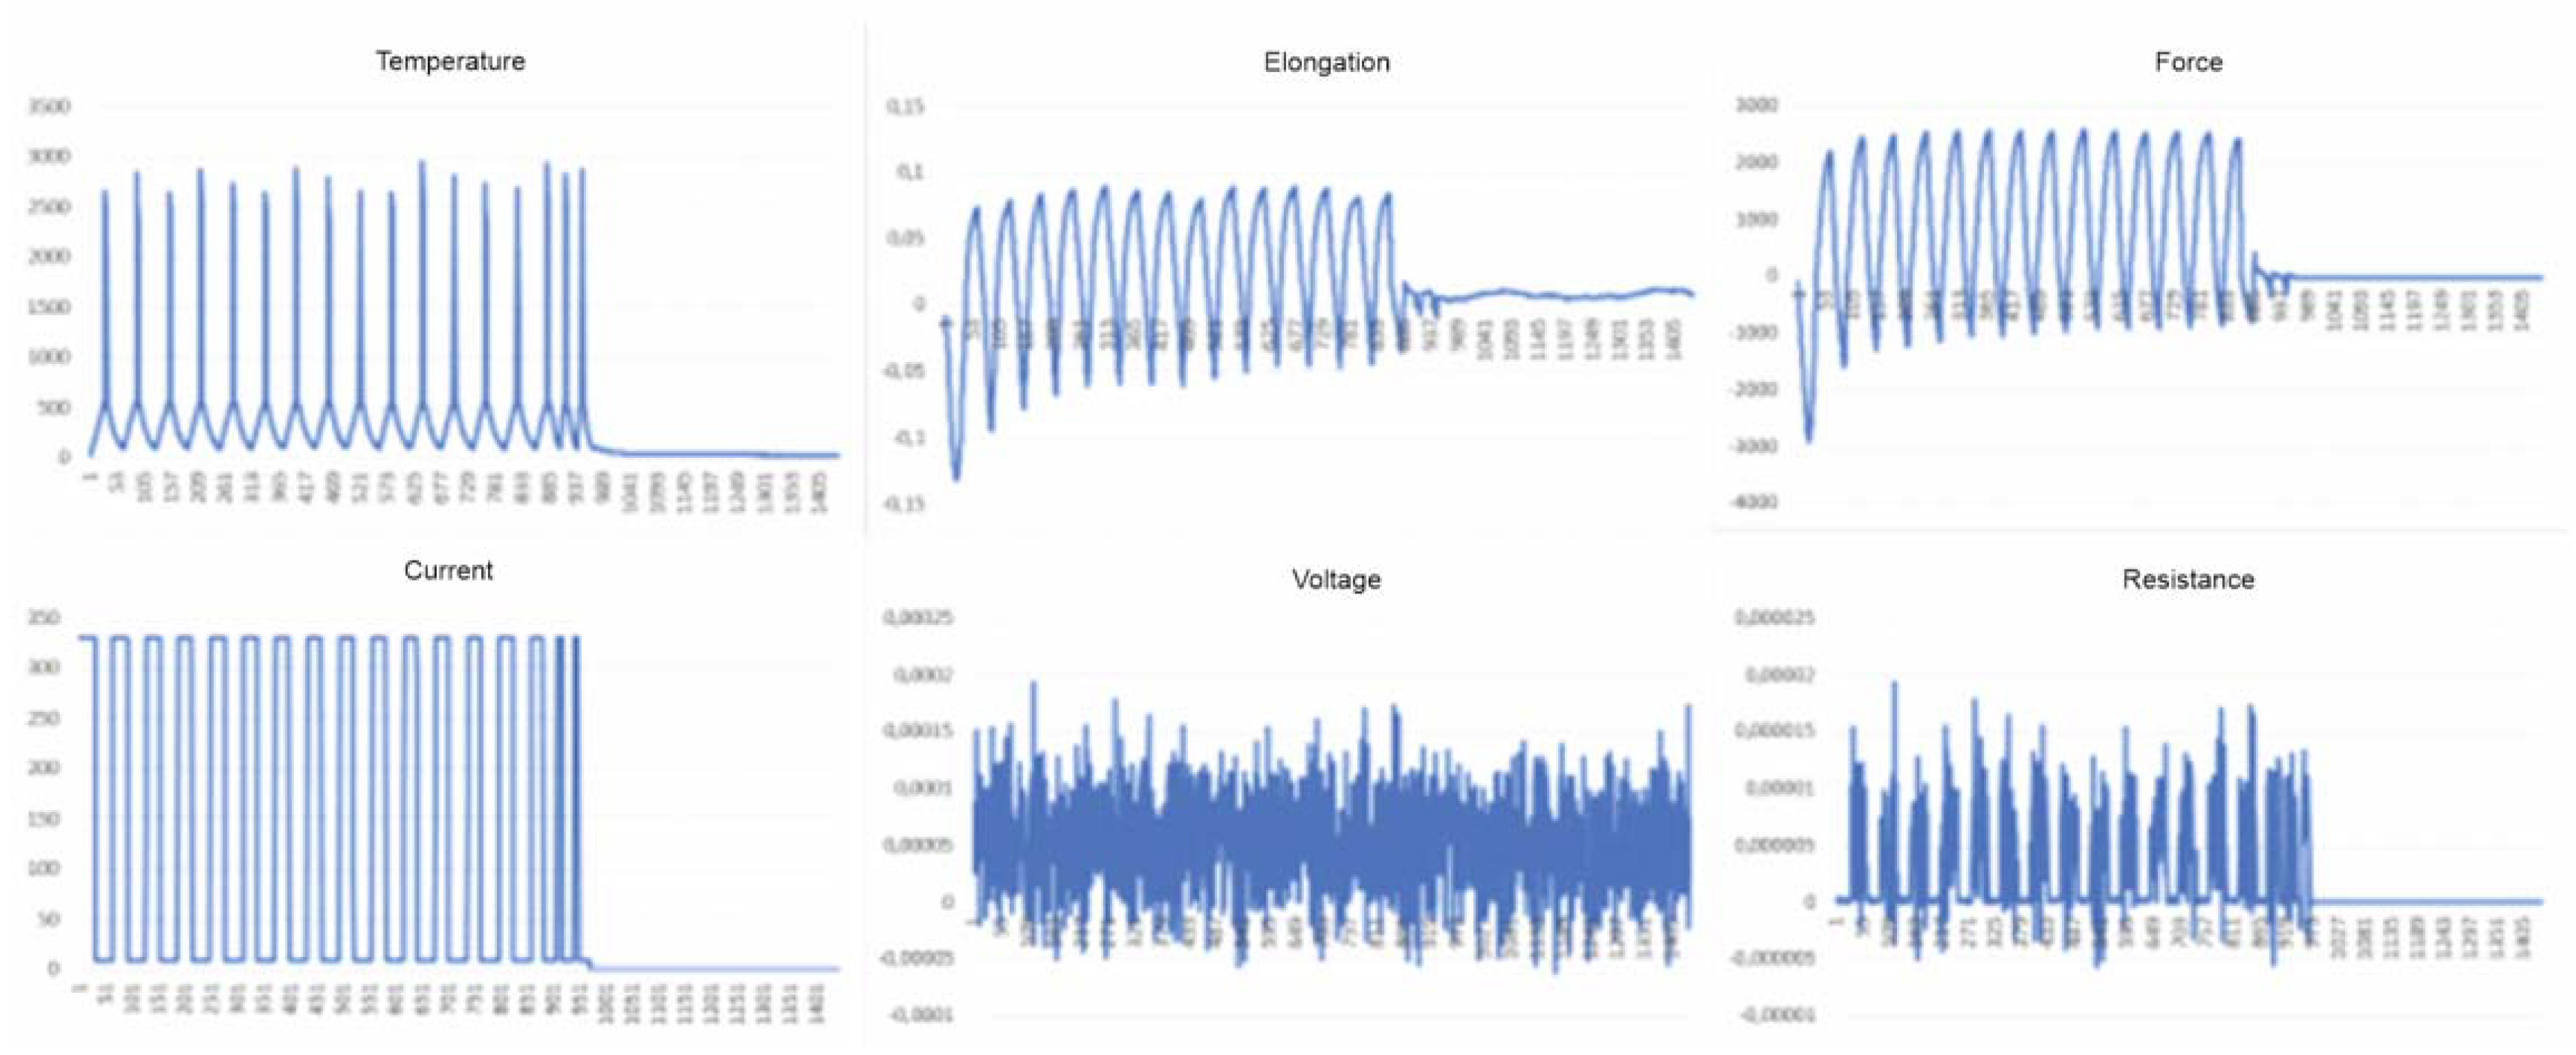
The columns contain data reflecting the mechanical properties of the sample in subsequent test cycles (Figure 2), and also show a certain tendency just before the material breaks. Additionally, taking into account that these data constitute time series, several features were obtained that allow the appropriate selection of the type of neural network that can be used to analyze variability and perform regression.
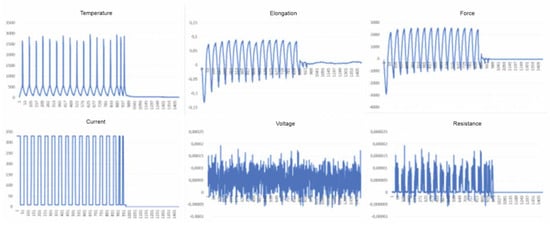
Figure 2.
Columns containing information on the tested sample with a visible moment of rupture and change in the appearance of the graph just before it.
2.2. Prediction Algorithms
When looking for a way to predict values, you need to start the process by finding correlations between data. When analyzing the data and the goal we want to achieve, the following techniques were considered:
- Classic method of time-series analysis with autocorrelation (e.g., ARIMA) [9],
- Dynamic time transformion/Dynamic Time Warping (DTW) [10],
- Artificial neural networks (e.g., RNN, LSTM) [11,12].
Due to the fact that the project should focus on the programming side, and the fact that a way is sought to modernize the use of machines that have been in use for many years, the last of the mentioned methods was chosen, which is modern and has been growing in popularity in recent years due to its implementation in various areas of artificial intelligence. Sequentially arranged data that show, second by second, the changes occurring in the tested metal sample are the correct input element for the recurrent network, which will look for the answer to the question “what will be the subsequent numerical values achieved by the material?” An important feature of recurrent networks is a kind of “memory”, which is actually another input source to the neuron containing information on the previous element in the examined sequence. This structure of the node means that recurrent neural networks (RNNs) are used for tasks related to, among other things, analyzing numbers in series, finding points creating a trajectory in two- and three-dimensional spaces, defining the subsequent image pixels that will begin to smoothly change its color by interpreting the words of a natural language in sentences, as well as numbers showing certain trends over the analyzed period, e.g., company quotations on the stock exchange. The type of recurrent network selected for the project is the Long Short-Term Memory (LSTM) network. It is a modified approach to a recurrent network due to its expanded memory cell. It can store more information than the single value before the one currently being analyzed in the series. In LSTM, these are data strings of a user-selected length, as well as data that were analyzed even several network nodes earlier. Forget Gate is a characteristic element of the node for the LSTM network, which decides whether and how much previous information will be taken into account in the next stage of network training, and which should be hidden from the emerging model.
2.3. API and UI
Programming began with selecting the most appropriate programming language. The current solutions allow for the integration and interoperability of program subsystems using universal interfaces, such as the stateless application programming interface (REST API—Restful Application Programming Interface). The correct implementation of such an interface must meet six rules that will additionally organize the created code [13]. The whole thing was complemented by the non-relational MongoDB database, which works great with the selected languages due to storing data in the form of Javascript Object Notation (JSON) files. It does not require defining strict models in which the information is stored, so the application remains flexible in terms of the various data received, e.g., after adding new sensors or trying to implement other devices performing work in a foundry. It is also very fast in terms of queries, and has support for many libraries for the most popular programming languages. In order to make it easier and faster to implement some of the system’s functionalities, each of its components uses publicly available and free libraries containing ready-made solutions and components often used by programmers. Thanks to this, it was not necessary to write code responsible for, among other things, reading and writing files with different extensions. Python scripts use many very helpful libraries, which made it possible to actually implement the machine learning elements. When presenting the results from the scripts, not only text files were used but also graphic charts composed and saved using the MatPlotLib library created for data visualization. The Angular Material component library, created by the global corporation Google, was used to create the user interface. It ensured reliability, the uniform and modern appearance of most front-end applications, the responsive behavior of elements, useful for using the application on devices of various sizes, as well as messages for the user informing the, about the successes and errors of the application, as well as side navigation on the created screens. The method of displaying the recipient information is complemented by further component packages, i.e., AG Grid Angular and NG2 Charts. The former allows you to quickly create lists and tables with data with integrated sorting, rearranging and filtering options. The next one is a package based on the popular Chart.JS library for presenting data in charts, in the case of this work, linear ones. The programming interface was prepared in the server part with the help of the Express framework, which provides a set of minimalist functions for building REST API interfaces. The mongoose library is responsible for communication with the database, with the help of which the schemas according to which the saved objects were created were saved. If it were not for the csv-parser and multer function sets, it would not be possible to operate the code on .csv, .txt and .png files. The process of creating the application itself was also supported by the Morgan library, which provided information on the API queries. To run the application, you need at least one device on which the server part will be run and on whose disk some information will be stored. The rest are located in the database, which was launched in the cloud version during the creation process. However, there is nothing stopping them from being located in the local database instance. The same device, if it has a graphical interface, can also run a website with a front-end application in a browser. The implementation details, depicted graphically, can be found in Figure 3.
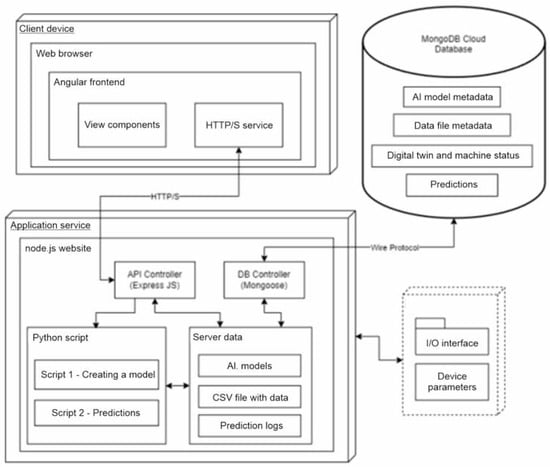
Figure 3.
UML deployment diagram of the created application.
3. Results
The aim of the developed solution was to assess how the created digital twin of the machine testing resistance to thermal expansion would contribute to solving the problem of sample breakage or not.
The first step in achieving the results is selecting the type of material that will be analyzed from the selection list saved in the database, and then placing this data on the server by sending a file in .csv format. Thanks to this, when you go to the script launch screen for creating a new model, the latest resources will be available. The completed form will be sent to the server, where the Python script will be run. The training phase of the artificial neural network itself may last up to several hours depending on the selected parameters and the number of lines in the provided file, which is why the models have been divided according to the type of material, which is to ensure their repeated use for samples behaving similarly during heating and cooling, most often belonging to one type of material, in this case a type of cast iron (e.g., ordinary gray, gray vermicular, gray ductile). Running the prediction script is completed by selecting the sample type, narrowing down the available lists of values, then indicating the parameters of the artificial neural network that will be delivered to the script and finally selecting one of the previously created models. When the prediction is completed, information on its results is sent to the user and will also be saved in the table with the execution history. On the history screen, you can also check the results in a graphical version. The data prediction code performs this in about one or two seconds, but there are also delays resulting from the time of running the code in the Node environment, as well as data transfer, so in a real case, using the created interface, the results will be possible to read after about five or six seconds. After completing the execution of the code written in Python, the server reads its results from the logs saved to the text file, and then issues a decision according to the formula to suggest stopping the operation of the device or continuing it.
3.1. Implementation of Scripts Using Artificial Intelligence
The implementation of LSTM artificial neural network layers in the Keras framework requires appropriate data preparation to start training. They must take the form of a three-dimensional array described as follows: [Samples × Timesteps × Features], where:
- Samples—time frames with the data currently taken into account, e.g., one hundred seconds
- Timesteps—data in specific seconds, i.e., subsequent lines of the .csv file
- Features—individual data of each row that we want to use to fit the model.
At the same time, in addition to the strict layout of the input data, the array cannot have components with arbitrary lengths because by downloading too much or too little data when adjusting the weights on its nodes, it will not be able to correctly calculate the error gradient, and there is a possibility of the phenomenon of “exploding” gradients or their “ fading away.” This will only be noticeable during the training phase, often already during the first epoch, when the current error value will be described as NaN (Not a Number). If the data are cyclical, it is recommended to create time frames of a maximum of a few such cycles; in the case of the code created in this project, the results were obtained with a frame length of approximately five cycles. Nor can one expect correct results in predicting values that are too forward-looking, but one cycle length can be safely considered to be very likely to be obtained and present satisfactory results.
However, before such a structure is created, there is a phase of data pre-processing, in which they are read from the .csv file, making sure that the characters separating the decimal part and subsequent columns are correctly distinguished, the numbers are not rounded or shortened (in the case in question, the smallest changes in values are important) and that non-numerical values that we do not want to analyze will be recognized. Subsequently, the values are standardized using the imported library function according to Formula (1).
where:
z = (x − u)/s
- z—is the new value,
- x—currently read from the data table,
- u—average value,
- s—standard deviation.
Then, we determine which data we will treat as input and which column as output. The code you create takes the extension as a target and the remaining columns as input. Next comes the definition of the model. Both what is just being created and what is being loaded have the same set layers. First, there is an LSTM network layer with eight hidden states, passing the entire sequence of hidden states to the next layer (thanks to the return_sequences parameter). The next layer has only two hidden states and returns only the last hidden state. The network is closed with a Dense layer, thanks to which we receive a single value at the network output. The activation function used in the network is “relu” (Rectified Linear Unit), which is the most frequently used function in artificial intelligence models. When completing the network configuration, it was decided that the most frequently chosen “Adam” optimizer would be used to improve the learning process, and the error determining the quality of the model would be of the Mean Square Error (MSE) type. Depending on the script, the training result of the previously selected model is loaded or a new one is generated thanks to the provided number of epochs, and the input data set is divided into training and testing in the proportion 80:20. By contacting the representative of the “Łukasiewicz” Research Network at Krakow Technical Institute, who provided the data used in this work, as well as the documentation on and diagram of the device, a condition was also established that would determine whether the application decided that the actual test should be interrupted or could be continued because sample rupture would not occur within the prescribed time. For this purpose, the difference between the average value of the data from the file taken into account when predicting the value and the average value among the prediction results is calculated. If they differ by at least ten percent, a suggestion is made to discontinue the further operation of the device; otherwise, the inquirer is informed that the sample will probably not be damaged within the expected period.
3.2. Results Analysis
In order to check the effectiveness and repeatability of the obtained results, three models were made based on three sets of data, selecting different parameters of the network itself. Their characteristics are presented in Table 1 in order to clearly compare their properties. Then, two processes were run for each of them to predict the results of the sample continuity test, to check whether they could predict both possible results, regardless of the data set used during their training.

Table 1.
A summary of the models used when testing the prediction capabilities implemented in the digital twin.
Initially, the number of epochs for training the C model was 25, and the process of its creation took over two hours. However, another training period was carried out for the same parameters and data, changing only the number of epochs to eight. This was due to the fact that in the graph presenting the changes in the learning error during the creation of the neural network model, subsequent epochs from about the eighth epoch did not bring a significant improvement in the quality of the model (Figure 4). An additional advantage of this test is confirmation of the repeatable operation of the code thanks to the comparable values at subsequent stages of the process.

Figure 4.
Comparison of the change in learning errors during subsequent training of a model with the same parameters.
For the main application test, two data files were prepared to check the results. The first one is file 1, used to create model A, the data of which have been slightly modified. The entire test lasted less than two hours, but before the measurement was stopped, the sample was interrupted 20 minutes earlier. Therefore, unnecessary data were removed, as well as an additional hundred seconds to check whether the generated neural networks could predict the actual effect. Ultimately, we obtained a file containing data collected for approximately 1.5 h. Further in the work, it will be marked as Test File 1—PT1. The next data are the original version of the information used as input to the C model, i.e., file 3, which will be referred to in the text as Test File 2—PT2. It includes a six-hour test that did not end with the interruption of the sample, which was subjected to subsequent tests at a later time. This and extended information about the data used in the test can be found in Table 2.
Table 2.
A summary of data files used when testing the prediction capability implemented in the digital twin.
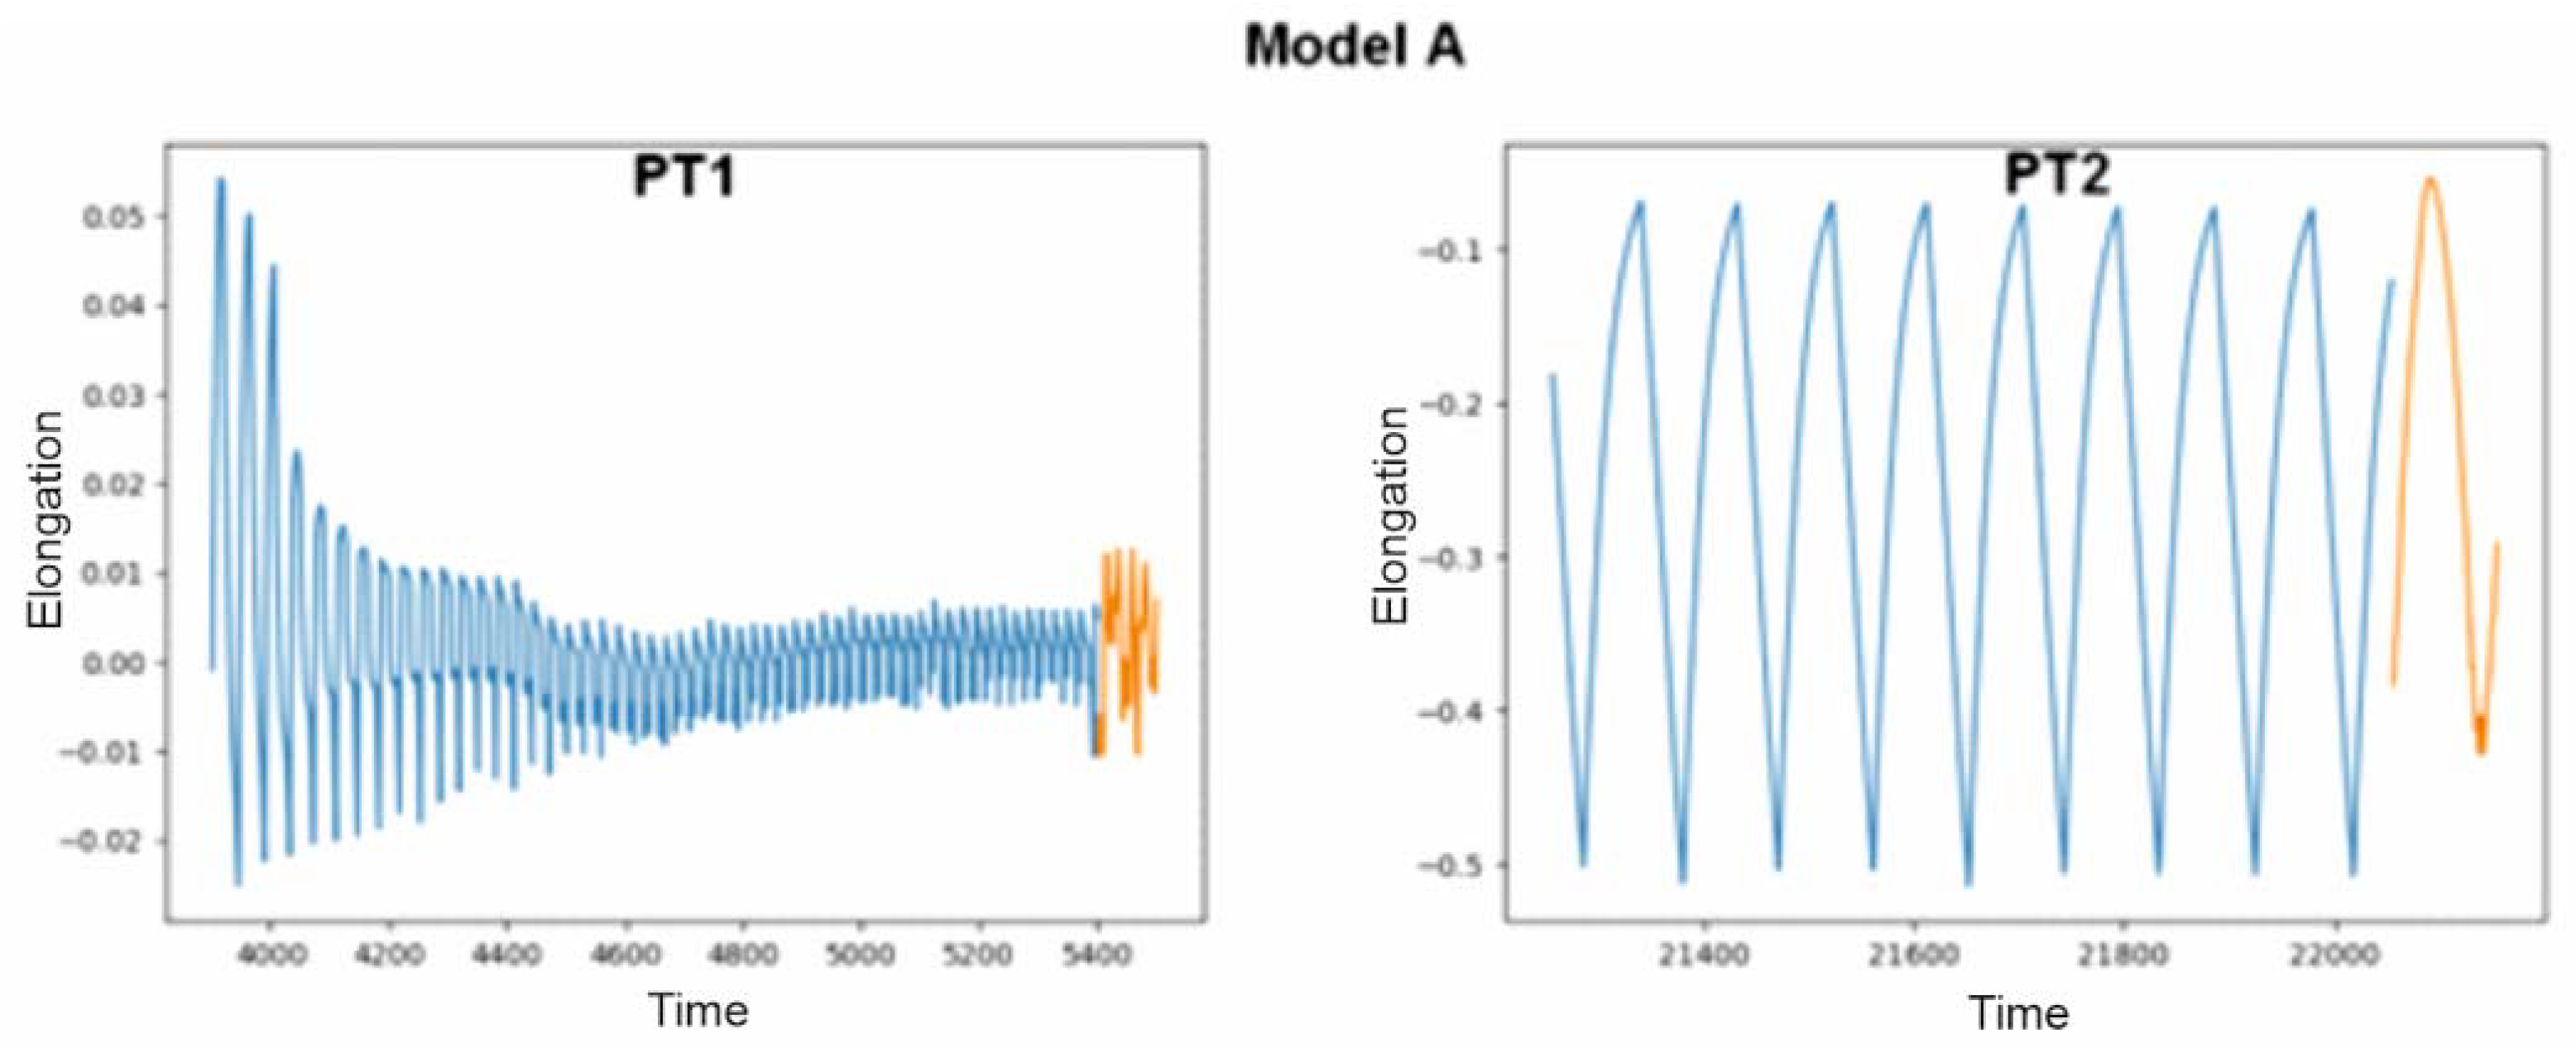
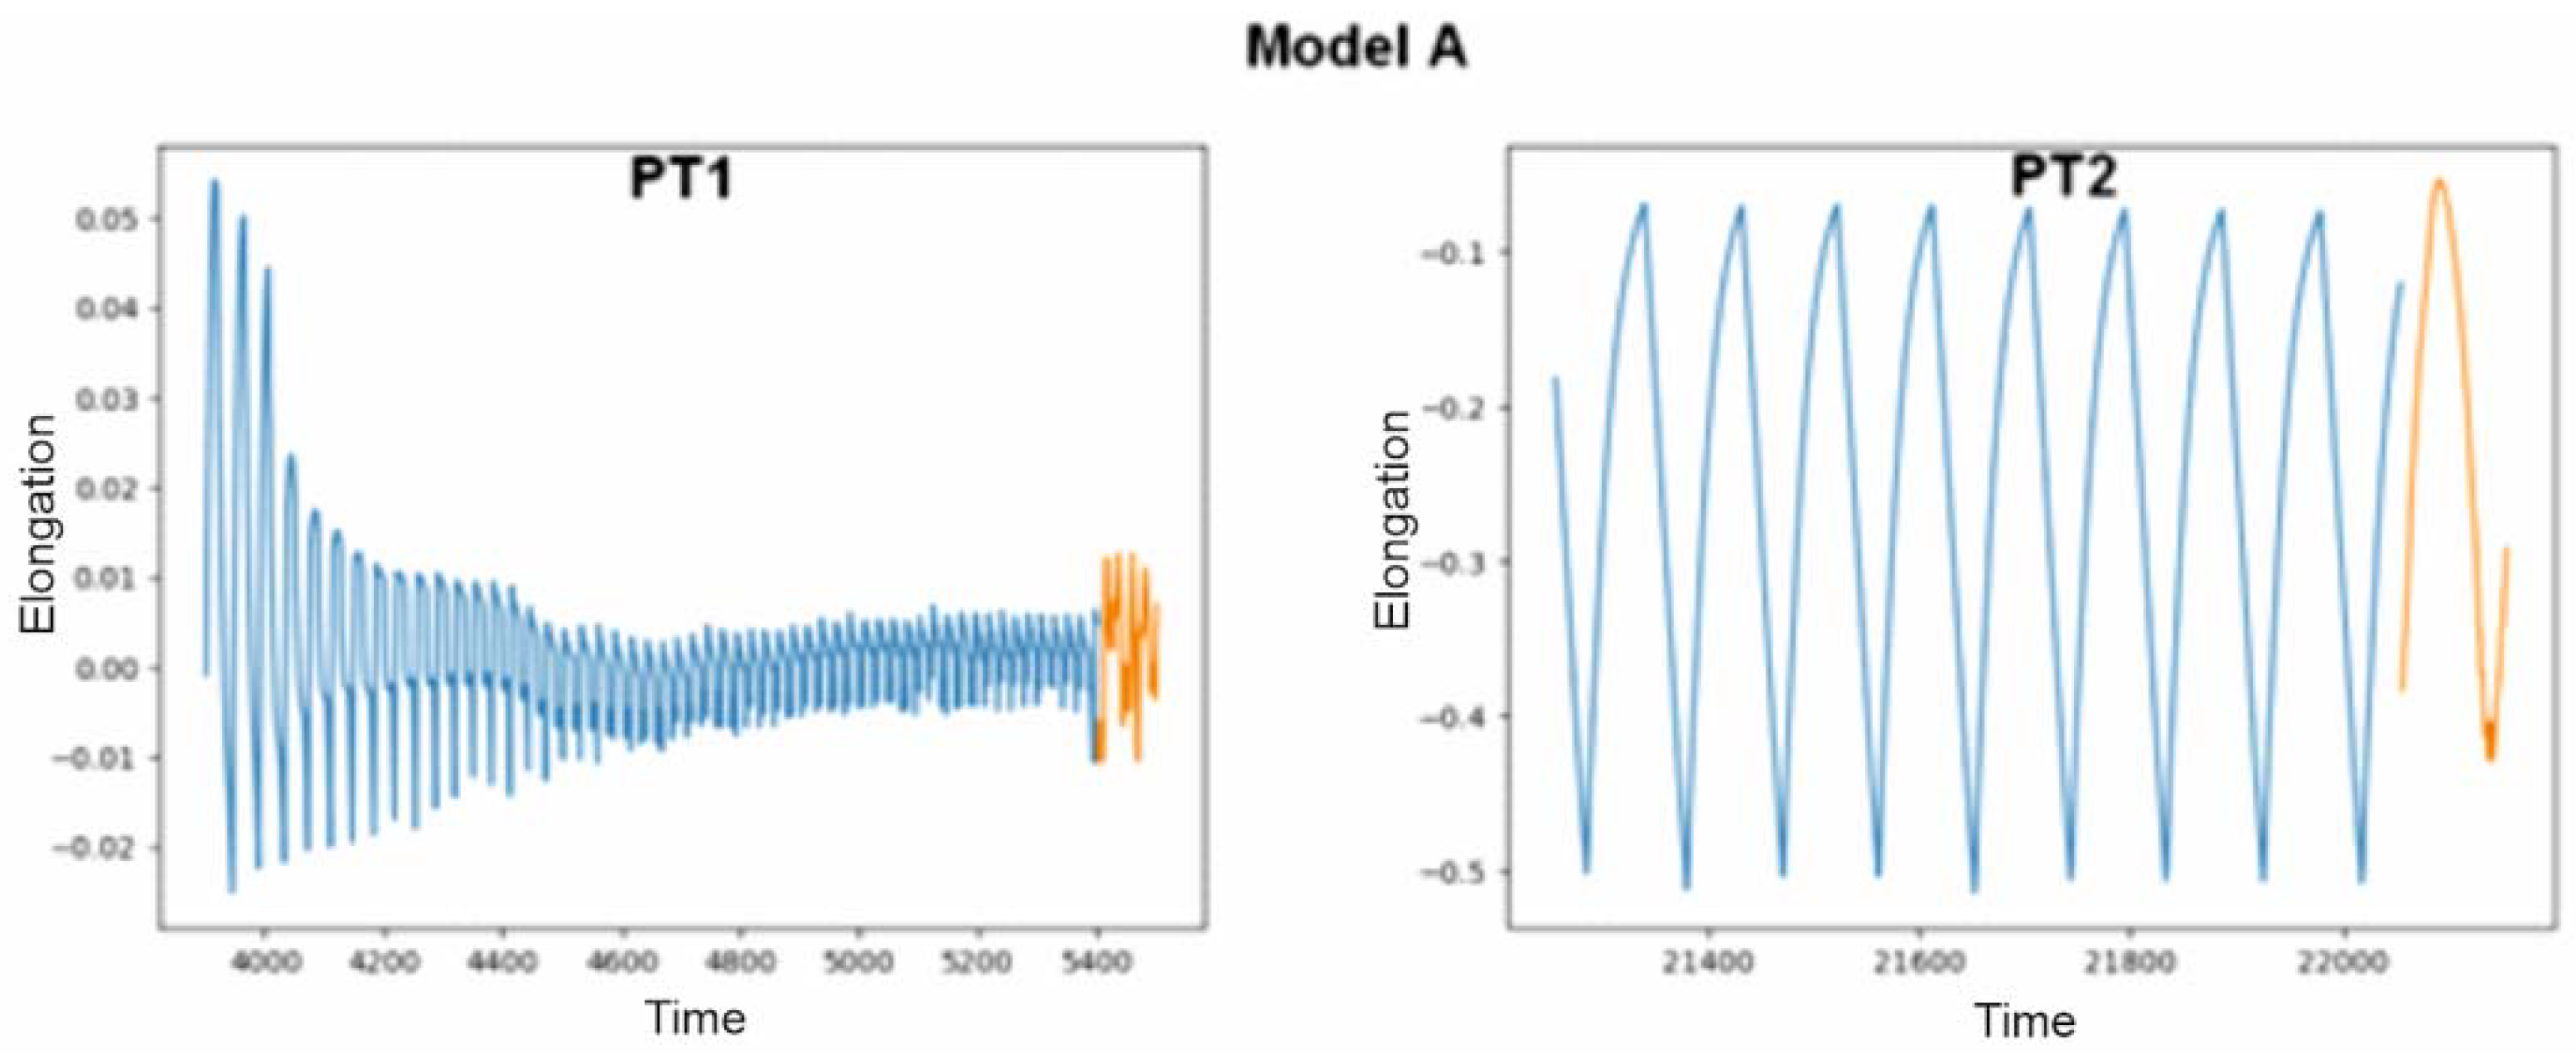
The model marked with the letter A, in combination with the PT1 file, i.e., the one on which it was based before its modifications, predicted correctly, with the result being sample interruption. The second test showed that interruption did not occur and would not occur in the next hundred seconds in the future. The course of the last elongation of the sample during the last five hundred seconds is marked in blue in the graph presented in Figure 5. Orange denotes the data that have been generated by artificial intelligence. Even though the graphs do not connect and are shifted on the axis, the condition for stopping the device that was adopted takes into account only the average difference in average values, not specific values, so we consider them correct.

Figure 5.
Predicted values produced by model A on text files PT1 and PT2.
The effects of the prediction script using model B, which did not see the data from the test data package during the learning phase of the artificial neural network, are shown in Figure 6, and again the values obtained are correct. Similarly to model A, it predicted that the sample from the PT1 file would break in the future, and that the sample whose breakage had not been observed would not break further (PT2 file).
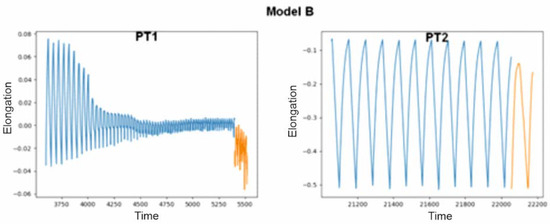
Figure 6.
Predicted values produced by model B on test files PT1 and PT2.
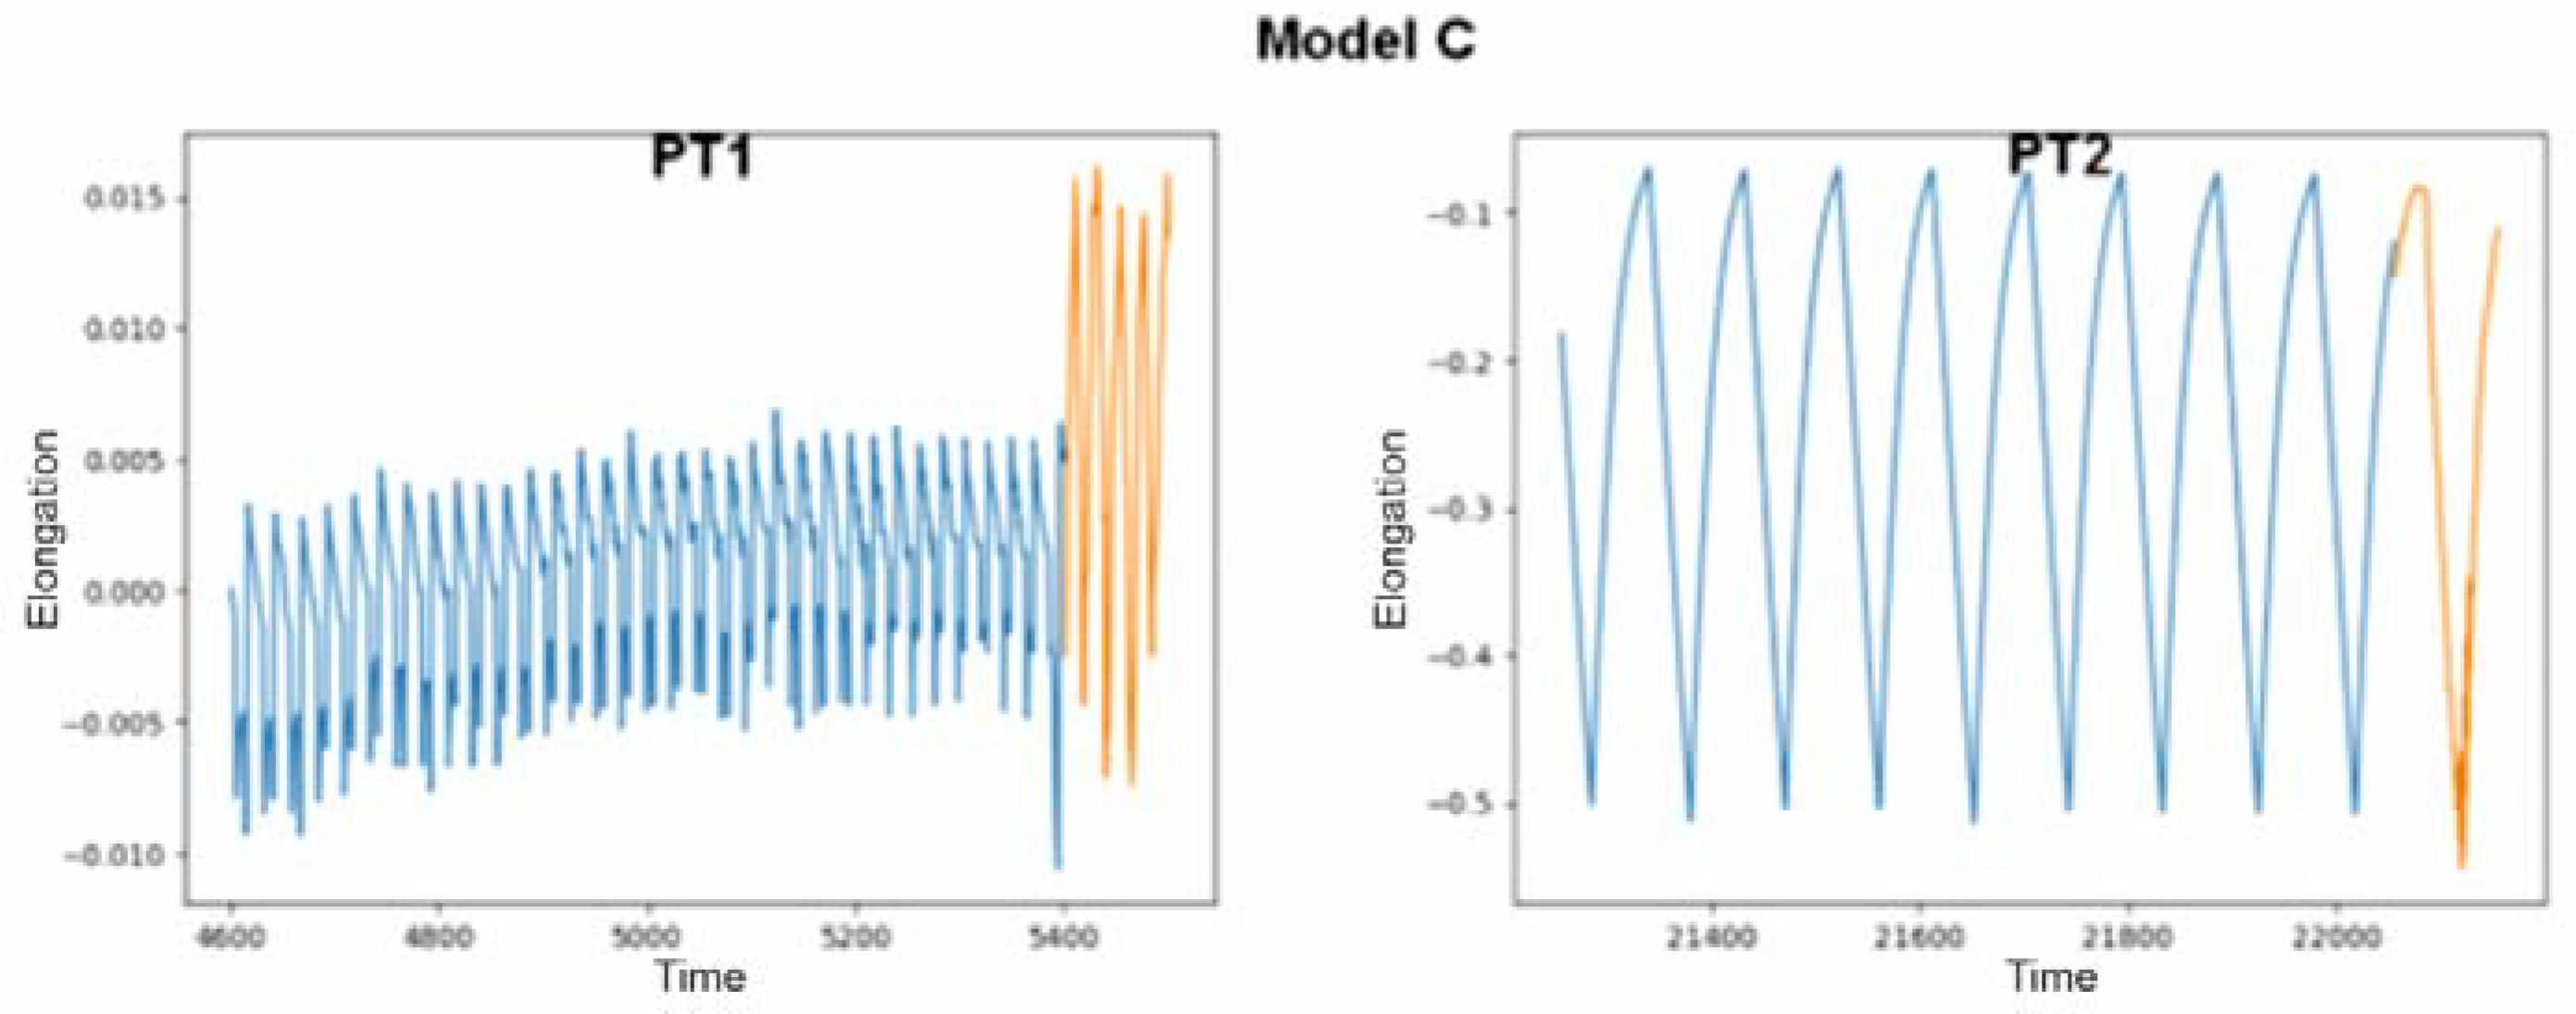
The last model tested again achieved only correct results for both of the provided data sets. It was prepared using input data from the PT2 file, but according to the examples presented, this did not prevent it from making predictions based on other data. Its results, marked with two colors, as in the previous figures, are presented in the charts in Figure 7.
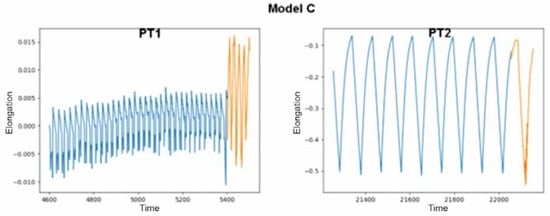
Figure 7.
Predicted values produced by model C on test files PT1 and PT2.
Even though the generated data combined with the provided data did not always create a continuous graph, they presented satisfactory results. You cannot expect perfect results because predictions are always subject to error. In this case, it was a difference in the scale not the shape (tendency) of the data in the new cycles calculated.
4. Discussion and Conclusions
Currently, many enterprises have decided to improve their market standing by modernizing their existing equipment or searching for new operating parameters. The machines used in foundries also need such changes, so various types of ready-made and specially created software are tested. The described case of a device for testing the thermal expansion of metal samples and the proposed implementation of its digital twin only confirms that a gain in time and energy is possible. Instead of many minutes being wasted when the device is idle or the next cycle is interrupted, you can find out about the probable situation in a few seconds, and reach a decision that will make the process more automated. This is due to the latest technologies, the development of which has significantly accelerated in recent years. Using complex algorithms, precise sensors and high computing power, humans are able to improve the efficiency of even simple classic industrial tools. After analyzing the requirements of the application, which were fully met, the created system uses several programming languages and many libraries containing useful code, and also provides a universal interface, creating a multifunctional program that is easy to expand with new purposes in future, which will be suggested in more detail in the next body of work. The artificial neural network made predictions that thus far have been made using classic time-series analysis methods, and its results turned out to be sufficient and satisfactory. Using this solution reduces the real tests to one test. The test parameters are previously determined during tests using a digital twin.
Author Contributions
Conceptualization, methodology, validation, formal analysis, investigation, resources, D.W.-K., A.L. and K.J.; software, A.L., data curation, all authors; writing—original draft preparation, all authors; writing—review and editing, all authors; visualization, all authors; supervision, all authors. All authors have read and agreed to the published version of the manuscript.
Funding
This research received no external funding.
Data Availability Statement
The raw data supporting the conclusions of this article will be made available by the authors on request.
Conflicts of Interest
The authors declare no conflict of interest.
References
- Akash, S.S.; Ferdous, M.S. A Blockchain Based System for Healthcare Digital Twin. IEEE Access 2022, 10, 50523–50547. [Google Scholar] [CrossRef]
- Fahim, M.; Sharma, V.; Cao, T.-V.; Canberk, B.; Duong, T.Q. Machine Learning-Based Digital Twin for Predictive Modeling in Wind Turbines. IEEE Access 2022, 10, 14184–14194. [Google Scholar] [CrossRef]
- D’Amico, R.D.; Erkoyuncu, J.A.; Addepalli, S.; Penver, S. Cognitive digital twin: An approach to improve the maintenance management. CIRP J. Manuf. Sci. Technol. 2022, 38, 613–630. [Google Scholar] [CrossRef]
- Lei, Z.; Zhou, H.; Hu, W.; Liu, G.-P.; Guan, S.; Feng, X. Toward a Web-Based Digital Twin Thermal Power Plant. IEEE Trans. Ind. Inform. 2022, 18, 1716–1725. [Google Scholar] [CrossRef]
- Azangoo, M.; Sorsamäki, L.; Sierla, S.A.; Mätäsniemi, T.; Rantala, M.; Rainio, K.; Vyatkin, V. A Methodology for Generating a Digital Twin for Process Industry: A Case Study of a Fiber Processing Pilot Plant. IEEE Access 2022, 10, 58787–58810. [Google Scholar] [CrossRef]
- Fuller, A.; Fan, Z.; Day, C.; Barlow, C. Digital Twin: Enabling Technologies, Challenges and Open Research. IEEE Access 2020, 8, 108952–108971. [Google Scholar] [CrossRef]
- Wu, Y.; Zhou, L.; Zheng, P.; Sun, Y.; Zhang, K. A digital twin-based multidisciplinary collaborative design approach for complex engineering product development. Adv. Eng. Inform. 2022, 52, 101635. [Google Scholar] [CrossRef]
- Park, D.; You, H.J. A Digital Twin Dam and Watershed Management Platform. K-Water Research Institute. Water 2023, 15, 2106. [Google Scholar] [CrossRef]
- OVHcloud, Co to Jest API REST? Available online: https://www.ovhcloud.com/pl/learn/what-is-restapi/ (accessed on 4 September 2023).
- Shumway, R.H.; Stoffer, D.S. ARIMA Models. In Time Series Analysis and Its Applications; Springer Texts in Statistics; Springer: Cham, Switzerland, 2017. [Google Scholar] [CrossRef]
- Yadav, M.; Alam, M.A. Dynamic time warping (DTW) algorithm in speech. Int. J. Res. Electron. Comput. Eng. 2018, 6, 524–528. [Google Scholar]
- Sherstinsky, A. Fundamentals of Recurrent Neural Network (RNN) and Long Short-Term Memory (LSTM) network. Phys. D Nonlinear Phenom. 2020, 404, 132306. [Google Scholar] [CrossRef]
- Christos, P.; Sjoukje, O.; Ioannis, N.A. Introducing digital twins to agriculture. Comput. Electron. Agric. 2021, 184, 105942. [Google Scholar]


Disclaimer/Publisher’s Note: The statements, opinions and data contained in all publications are solely those of the individual author(s) and contributor(s) and not of MDPI and/or the editor(s). MDPI and/or the editor(s) disclaim responsibility for any injury to people or property resulting from any ideas, methods, instructions or products referred to in the content. |
© 2024 by the authors. Licensee MDPI, Basel, Switzerland. This article is an open access article distributed under the terms and conditions of the Creative Commons Attribution (CC BY) license (https://creativecommons.org/licenses/by/4.0/).