1. Introduction
In the continuously evolving landscape of new energy societies, electricity users are increasingly demanding detailed and refined management of their power consumption devices. To meet this challenge, Dr. Hart proposed a method called Non-Intrusive Load Monitoring (NILM) [
1]. Unlike traditional intrusive load monitoring methods, NILM utilizes the total load information of electricity users. By inferring the power usage behavior of each appliance, it avoids the cumbersome process of installing sensors on each device. This approach offers numerous advantages, such as reduced installation costs, minimal interference with user privacy, and ease of operation [
2,
3,
4], making it the mainstream method for analyzing electricity consumption behavior. However, to understand and apply the NILM method more deeply, it is beneficial to fully utilize Advanced Metering Infrastructure (AMI) data. AMI not only provides information about the total load of users but also offers more detailed and real-time electricity usage data, thereby enhancing the accuracy of appliance monitoring. Through precise analysis of AMI data, we can gain a more accurate understanding of the energy consumption patterns and usage of each device, further optimizing energy management strategies. Additionally, integrating the NILM method with demand response technology allows for flexible adjustment of electricity demand during peak periods, achieving intelligent energy dispatching. For emerging electricity demands like electric heat pumps and electric vehicle charging, the NILM method can also support their integration, ensuring efficiency and sustainability in energy usage. Overall, the application of the NILM method in power management, particularly in combination with AMI data and demand response technology, will propel the forefront of energy management and provide electricity users with more intelligent and efficient consumption solutions. By adopting this comprehensive approach, a more holistic understanding of every aspect of the power system can be achieved, laying the foundation for sustainable and intelligent energy management goals.
The process of NILM involves four crucial steps to accomplish load identification effectively. The first step is event detection. In the initial models of load identification, this is primarily achieved by setting relevant thresholds based on changes in load information such as current, voltage, and active power. This allows for the detection of related load events. [
5]. However, these methods can be cumbersome when setting thresholds, as different types of equipment exhibit varied fluctuations during load-switching events. Determining reasonable thresholds usually requires manual setting, which is time-consuming and labor-intensive, hindering the load identification task. Therefore, Dr. Yang [
6] proposed using zero-crossing detection, current similarity detection, and threshold assessment to evaluate load-switching events, improving the success rate of event detection. Furthermore, Kotsilitis proposed a novel approach in his work [
7] to calculate the slope coefficient of relevant load data, detecting load-switching events by the degree of change in the slope coefficient. In addition to these methods, improvements in event detection methods for load identification tasks include using the transient response of active power [
8], introducing multi-head attention mechanisms [
9], and a deep dictionary learning model based on adaptive window changes [
10], which have significantly improved the accuracy of load identification tasks, although some methods still struggle with detecting minor and short-term load changes.
After the initial event detection of transient events is completed, it is necessary to preprocess the data that may have load state changes and extract relevant features. NILM is then conducted by associating different feature changes with different load-switching events. Scholars have proposed using features like current, voltage, peak current, root mean square, and even V-I trajectory curves for load identification tasks [
11,
12,
13]. Researchers from Zhejiang University [
14] suggested using the Fast Fourier Transform (FFT) for further frequency domain transformation of features before extraction. Additionally, there are one-dimensional and two-dimensional load features like recurrence plots [
15], equivalent impedance analysis of voltage and current data [
16], and time-frequency multi-feature fusion of time-series images [
17]. Various directions of research have continuously improved models in the data preprocessing and feature extraction aspects of load identification tasks.
The final step in the load identification task involves feeding the extracted features into relevant deep-learning networks to complete the task. With an increasing number of deep learning models being employed in load identification tasks, such as CNN, KNN, multi-task neural networks like SAMNet, Temporal Convolutional Networks (TCN), and Random Finite State Machines, various deep learning models have been researched for their application in NILM tasks [
18,
19,
20,
21,
22]. As models continue to be optimized and improved, new improved models are continually being applied to NILM tasks: Dr. Himeur [
23] proposed an improved K-Nearest Neighbors algorithm based on histograms (IKNN) to enhance load identification performance; Dr. Yang [
12] introduced a transfer learning method that converts voltage-current (V-I) trajectories into visual representations through color coding; Mr. Kaselimi [
24] proposed the use of attention mechanism to improve the s2p learning model; [
25] and adaptive context-aware bidirectional deep learning models considering non-causal and seasonal factors have also been developed. However, while computing related load features, these models have not effectively excluded irrelevant features, leading to redundancy in the model training phase, thereby reducing model efficiency and hindering the load identification tasks.
The various load identification methods discussed above consider different aspects in each segment and make corresponding improvements. However, some aspects are still not sufficiently addressed, such as in the feature transfer phase. The aforementioned load identification models all use effective features but do not specially handle redundant features. This results in a bloated model structure, where many features are ignored and left unprocessed, leading to decreased computational efficiency and impacting the efficiency of load identification. This paper proposes a NILM method that incorporates feature dimensionality reduction and DB-LSTM to address these aspects. Considering that sensors and other data collection devices are widely installed in load identification tasks, models that require high hardware specifications are not suitable. Therefore, this paper proposes the use of Dense Bidirectional LSTM networks, which enhance both global and dynamic local features. By stacking LSTM units and combining them with dense skip connections, additional channels for signal transmission are provided, thereby strengthening feature propagation, reducing the number of parameters, and lowering computational complexity. This approach decreases computational demands on devices, aiming to enhance the efficiency of the model in load identification tasks. Below are the specific research works of this paper:
To address the difficulty in effectively monitoring load-switching events in load identification problems, a bilateral sliding window CUSUM algorithm is proposed. This algorithm dynamically monitors types of data such as load power, voltage, and current in the input load monitoring devices to identify the operational status of electrical equipment in real time.
Existing methods extract a variety of features from multiple domains. However, due to the large number of extracted load features, potentially beneficial features for load identification tasks might be overlooked, resulting in longer computation times and increased computational demands on devices. Therefore, this study considers using Kernel Principal Component Analysis (KPCA) for data dimensionality reduction of the extracted load features, thereby obtaining more relevant feature data for load identification tasks.
Considering that existing methods already account for the time-related aspects of load operation data but suffer from overly complex models that only utilize effective features without special handling of redundant ones, this leads to bloated model structures. Many features are ignored and left unprocessed, thus reducing computational efficiency and impacting load identification efficiency. To enhance the efficiency and accuracy of load identification, this paper proposes the use of Dense-LSTM networks. By employing stacked representation learners, both global and dynamic local features are enhanced. The interconnection of various modules within the LSTM network model ensures that the extracted features are transmitted to each layer, enhancing the reuse of effective features, reducing data redundancy, and decreasing the number of parameters to improve load identification efficiency.
2. Bilateral CUSUM Event Detection Method Based on Median Filtering in Sliding Windows
In non-intrusive load identification tasks, it is often necessary to collect and obtain data from actual field operations. Relying on data sets from intrusive load identification is very time-consuming and labor-intensive, making it costly for load identification tasks. Therefore, it is essential to utilize non-intrusive load identification methods for event detection, feature extraction, data processing, and load identification of electrical devices to accomplish the task. A crucial issue is how to effectively detect load events from the load data obtained from electrical users. Existing load identification methods can be categorized into two types based on the method of identifying changes in the state of electrical devices: event-based load identification methods and non-event-based load identification methods. Non-event-based methods, also known as blind source separation methods, mainly include hidden Markov models, stochastic finite state machines, and others. Event-based methods can be referred to as rule-based load identification methods or change point detection-based load identification methods. These methods typically involve unidirectional scanning of load data. However, such methods often fail to detect local data changes or sudden load-switching events, resulting in the oversight of some electrical device status changes. Therefore, effectively monitoring related event changes becomes a challenge. This paper proposes an event detection method based on bilateral CUSUM and median filter denoising in sliding windows to determine the occurrence of load-switching events in electrical devices within the input data for the non-intrusive load identification model.
2.1. Bilateral Cumulative Sum Event Detection Method Using Sliding Windows
In existing non-intrusive load identification models, some utilize cluster-based methods or hidden Markov models, which are non-event-based. These models are effective in identifying switching events of electrical devices from large amounts of load data. However, they often fail to monitor short-term load-switching events of electrical devices, especially when there is no historical data for newly connected devices in the power system, leading to decreased identification capability under short-term load changes. Event-based methods for detecting load-switching events excel in real-time monitoring of load data fluctuations and observing the load behavior of electrical devices, thereby swiftly detecting the occurrence of switching events in these devices.
The Cumulative Sum (CUSUM) algorithm, derived from the likelihood ratio model, is a control chart model that continuously accumulates the difference between the data to be tested and the standard data in the input model. This process analyzes fluctuations in the data, amplifies related fluctuations, and thus detects the occurrence of switching events in electrical devices. Taking the active power consumption of electrical devices as an example, when there is a load-switching event in the electrical devices, the active power data collected by relevant sensors may exhibit either abrupt or gradual changes. Subsequently, transient events can be determined through algorithms. However, it still faces challenges in detecting short-term changes and local anomalies.
To address these issues, scholars have further proposed the bilateral CUSUM (Cumulative Sum) event detection method using sliding windows [
26]. This method is a statistical approach for real-time monitoring of abnormal changes or events in time series data. Unlike the traditional CUSUM method, the bilateral CUSUM with sliding windows introduces the concept of a sliding window to adapt to short-term changes and local anomalies that may occur in the system or process. In this approach, instead of applying the CUSUM algorithm to the entire load data sequence, a fixed-size window is deployed over the entire load data sequence, and the CUSUM algorithm is applied only within this window. This is more beneficial for detecting the occurrence of switch-on and switch-off events in electrical devices. Its working principle is as follows:
Firstly, introduce a period of time series data
, Its expression is
. Assuming that an electrical device switching event occurs at a certain moment
δ, the expressions for the statistical functions
and
can be set as:
In the formula, and represent the positive and negative offsets of the current detection point after removing the influence of noise values.
The expressions for
and
are:
where
represents the average data value under normal conditions; And
represents various types of noise that exist during the data collection process; When the amplitude of the change in active power is less than
, it will be ignored. In addition, due to a certain time delay between the occurrence and detection of events throughout the entire process, this time delay is set to
, Therefore, the following sliding window bilateral CUSUM event detection process can be obtained:
Firstly, when there is no transient event of the electrical equipment in the overall data, the overall value of 0 remains basically unchanged as the average of the statistical function, and no event detection is performed;
Secondly, if a transient event occurs, numerical accumulation is performed in statistical functions and based on the rise and fall of the data, until the threshold is reached, which is considered a transient event. If the cumulative threshold does not reach the threshold, d is applied to the time delayed data, that is, , until the value exceeds the threshold, which is considered a transient event.
The sliding window bilateral CUSUM method can effectively detect local changes in load data, thereby detecting the occurrence of related load-switching events and achieving more accurate load identification.
2.2. Data Denoising with Median Filtering
In load identification tasks, it is crucial to collect effective and accurate load data such as current, voltage, power, and sensor measurements related to the load in the power system. However, these data often contain various interferences, such as Gaussian noise.
Moreover, during event detection tasks, load data is highly susceptible to noise from measurement devices, communication interference, and other external factors, leading to unnecessary fluctuations and disturbances in the data. Additionally, the power system experiences various sudden events, such as equipment switching and fault recovery, which can cause dramatic changes in load data, thereby reducing the accuracy.
Therefore, this paper proposes the use of median filtering technology for denoising filtering [
27]. Median filtering is a nonlinear signal processing technique based on the theory of order statistics. It is an effective noise reduction technique for on-site data collection, also known as a nonlinear filter or a statistical order filter. The principle of median filtering is to take each load data point of an electrical device as the center and convert this point into the median value of all data points within a certain neighborhood window [
28].
For data requiring noise reduction, median filtering can effectively accomplish this task and better preserve the edges of the signal, maintaining the complete structure of the data, unlike linear filtering methods that may blur the data waveform by treating edge data as noise points. Additionally, median filtering possesses the advantages of simplicity in computation and ease of application in hardware, making it more suitable for the denoising task in the scenario presented in this paper compared to other filtering methods. The specific process is as follows:
Assuming a load data sequence of electrical equipment is , when performing median filtering on this set of time series data, a window of length needs to be set, and the value of is , where is a positive integer. Taking a certain moment as an example, taking a total of a points before and after as window, where is the center point of all data in this window, and arranging the aforementioned points and according to their size, taking the value, and defining it as the output value of the median filter in this window.
This article proposes a double accumulation and CUSUM event detection method using sliding windows based on median filtering to effectively detect the switching of electrical equipment. After preliminary noise reduction of load data using median filtering technology, it can effectively reduce the interference of noise on load events by detecting whether switching events have occurred.
3. Non-Intrusive Load Monitoring Method Incorporating Feature Dimension Reduction and DB-LSTM
In existing load identification tasks, models process the raw steady-state or transient features extracted from the operation of electrical devices. This processing may involve time-frequency domain transformations or other feature extraction methods to obtain higher-dimensional relevant features. However, among these features, some may be highly beneficial for load identification tasks, while others may have little or no use. Therefore, selecting relevant and beneficial features becomes a noteworthy research problem.
3.1. Feature Dimension Reduction Method Based on Kernel Principal Component Analysis
In non-intrusive load monitoring tasks, the model performs a sequence of operations, encompassing event detection, feature extraction, data preprocessing, and load identification, in order to accomplish the task of load identification. However, the data input into the model is often voluminous and complex, containing both beneficial load feature information and other redundant information not useful for load identification. Therefore, selecting relevant data features becomes an important research issue.
Some scholars have proposed using Principal Component Analysis (PCA) [
29] to perform feature dimension reduction analysis on load data during the switching events of electrical devices in non-intrusive load identification tasks. However, traditional PCA is a linear feature processing method and is less sensitive to changes in data involving randomness and occasional events, such as the switching of electrical devices, which have nonlinear relationships. Therefore, its feasibility in non-intrusive load identification is not high.
However, the more recently proposed KPCA method can greatly improve this issue. Firstly, KPCA is a method of performing principal component analysis on nonlinear data. By exploring additional mapping forms in high-dimensional space, this method effectively captures the nonlinear correlations between input features. Consequently, it selects features more conducive to the load identification task, extracts more crucial information, achieves feature dimensionality reduction, and establishes a more precise model. This, in turn, reduces computational complexity, improves computational efficiency, and lessens hardware requirements. The KPCA method includes multiple kernel functions, such as linear kernels, radial basis function (RBF) kernels, etc. Among them, the Gaussian kernel function is one of the most common and effective kernel functions in RBF kernels, and its mathematical expression is as follows:
where
and
represent the input electrical equipment load data, while
represents a parameter of the shape of the kernel function. Due to the selected load device data in this paper being a type of nonlinear and complex data, among various kernel functions in KPCA, RBF kernel is highly effective in capturing nonlinear relationships within the data. It achieves this by mapping the data into a high-dimensional space and generating additional nonlinear structures. This further processes the data. Since the RBF kernel allows for the adjustment of the kernel’s width through parameter ‘
‘, it diversifies the function, making it more adaptable to different data forms, thereby enhancing the effectiveness of data analysis and optimizing the algorithm.
3.2. DB-LSTM Non-Intrusive Load Identification Model
Various deep-learning methods have already been applied to non-intrusive load identification tasks. However, issues such as model complexity and high computational demand still exist. Additionally, some types of LSTM models tend to overlook the connections between load data of the same electrical device over different lengths of time [
30,
31]. This type of data connection is crucial for users who can collect or store long-term load data and should not be ignored. The DB-LSTM network addresses this by analyzing data across different time scales using densely connected LSTM modules, thus achieving more accurate load identification.
To overcome the shortcomings of existing methods, this paper introduces a novel long-term temporal model for non-intrusive load identification, namely the Dense-LSTM network. This network utilizes a stack of representation learners to enhance both global and dynamic local features. By integrating various modules within the LSTM network model and establishing interconnections between layers, features extracted can be propagated throughout each layer, ensuring the effective reuse of valuable features, reducing data redundancy, and minimizing the number of parameters. Additionally, short-term and long-term time analysis patterns are established to facilitate the learning of temporal relationships in load data. Furthermore, forward and backward bidirectional learning is conducted based on the current target point, capturing a broader range of load information and comprehensively improving the efficiency of load identification.
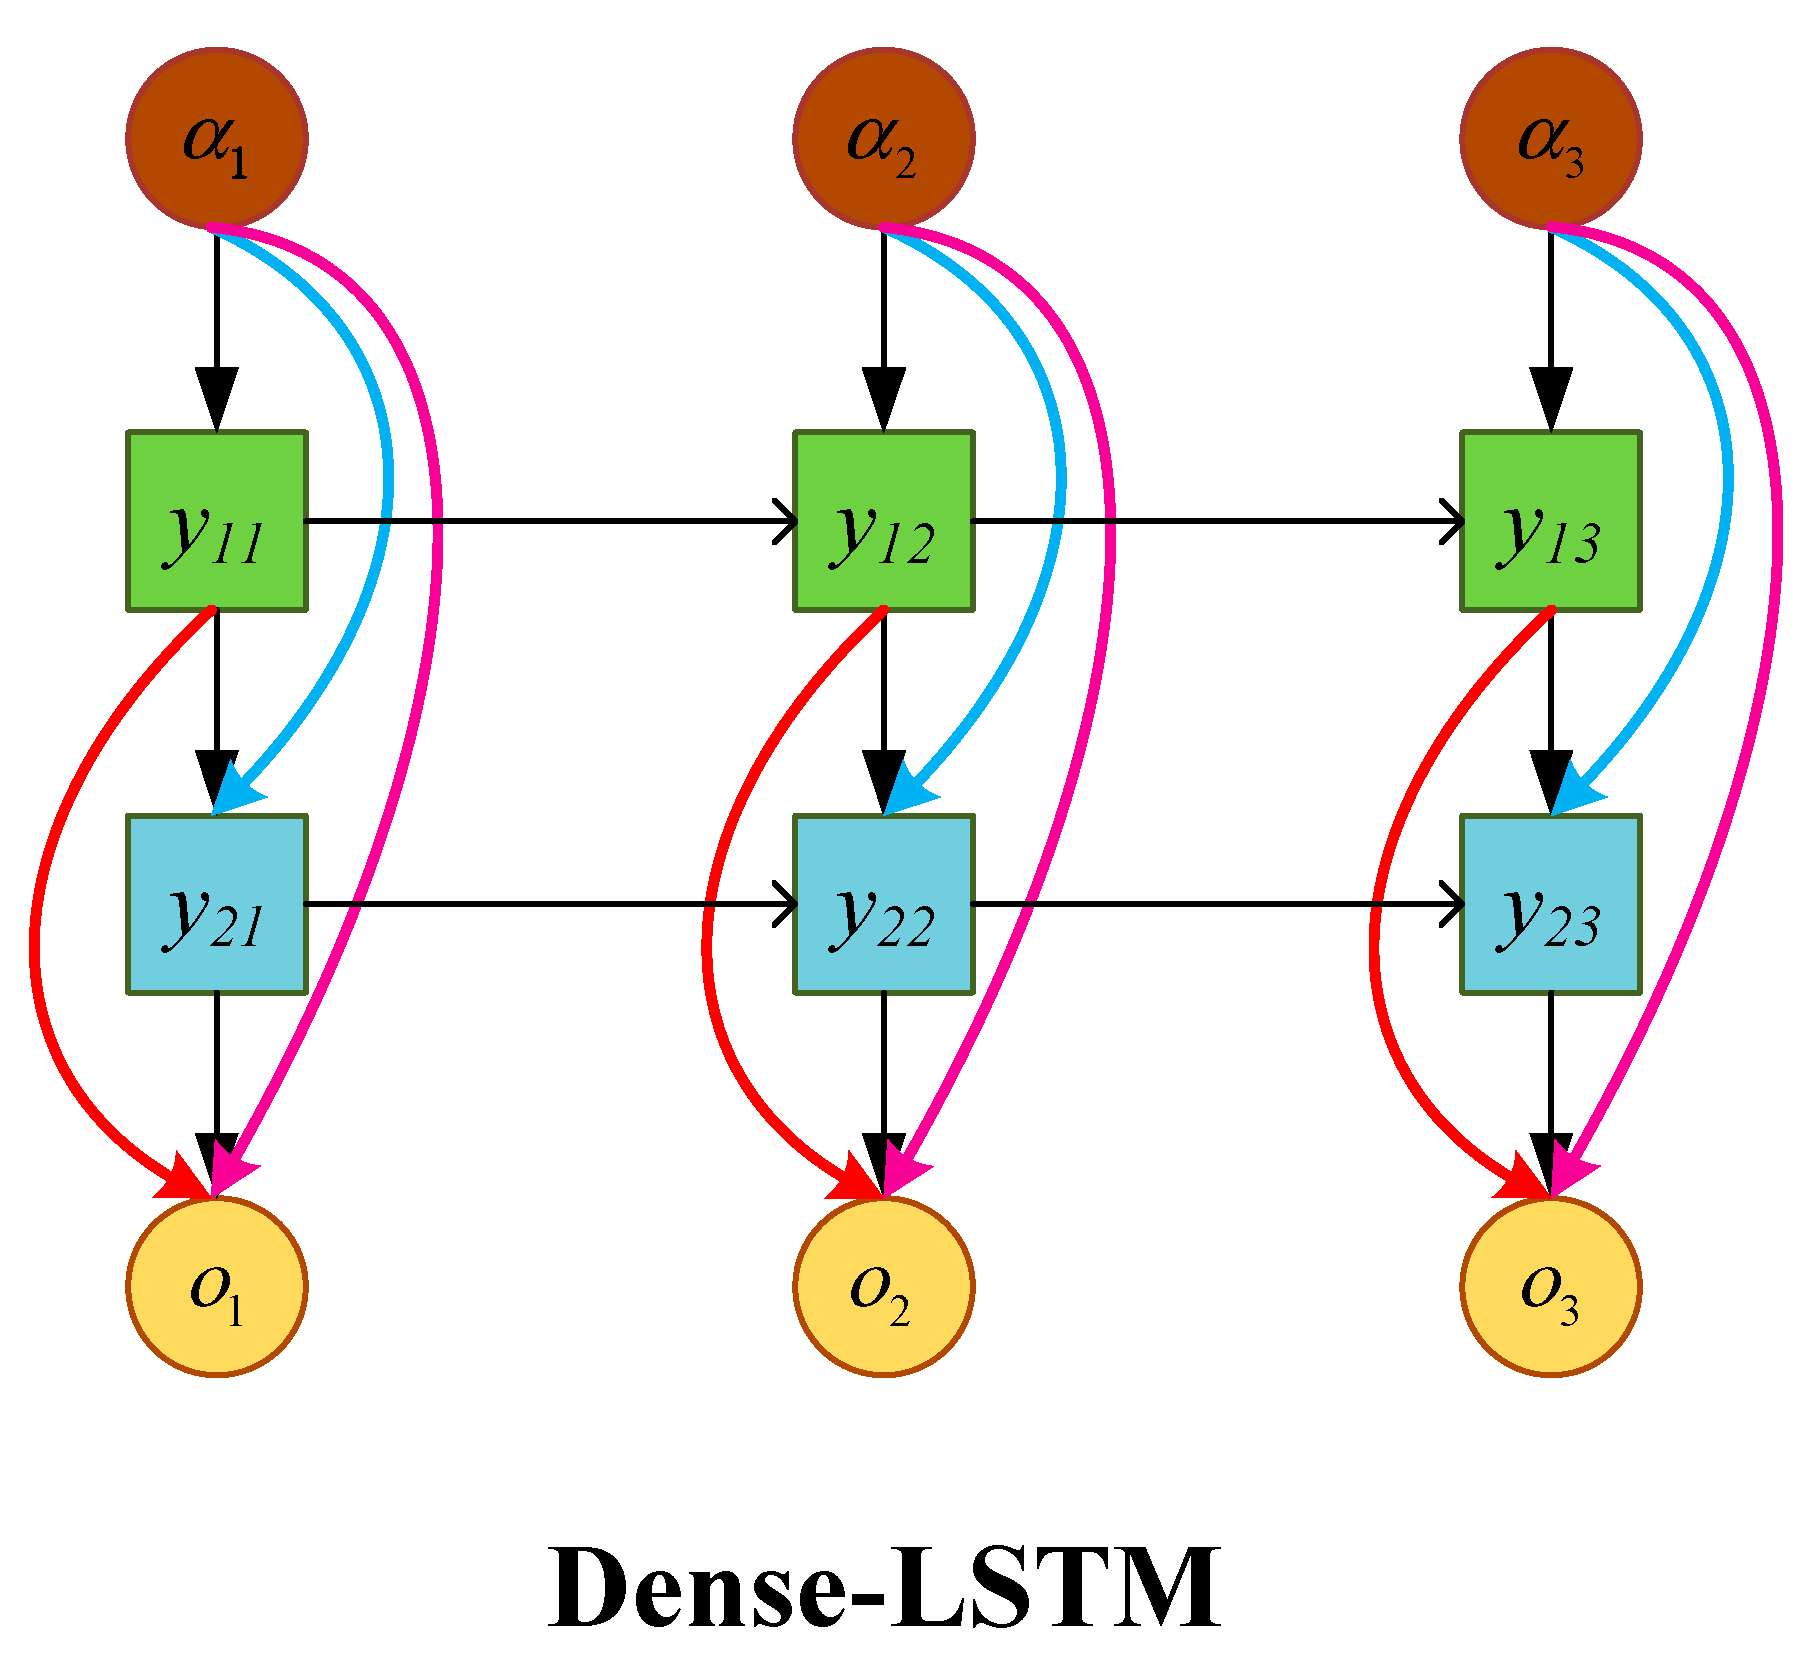
Following the concept of densely connected networks, the LSTM network is further expanded into a densely connected form. This involves using skip connections within the densely connected network blocks, as shown in
Figure 1, where
represents the densely connected module at the
time step in the
layer, with various colored lines indicating the connections between different dense layers.
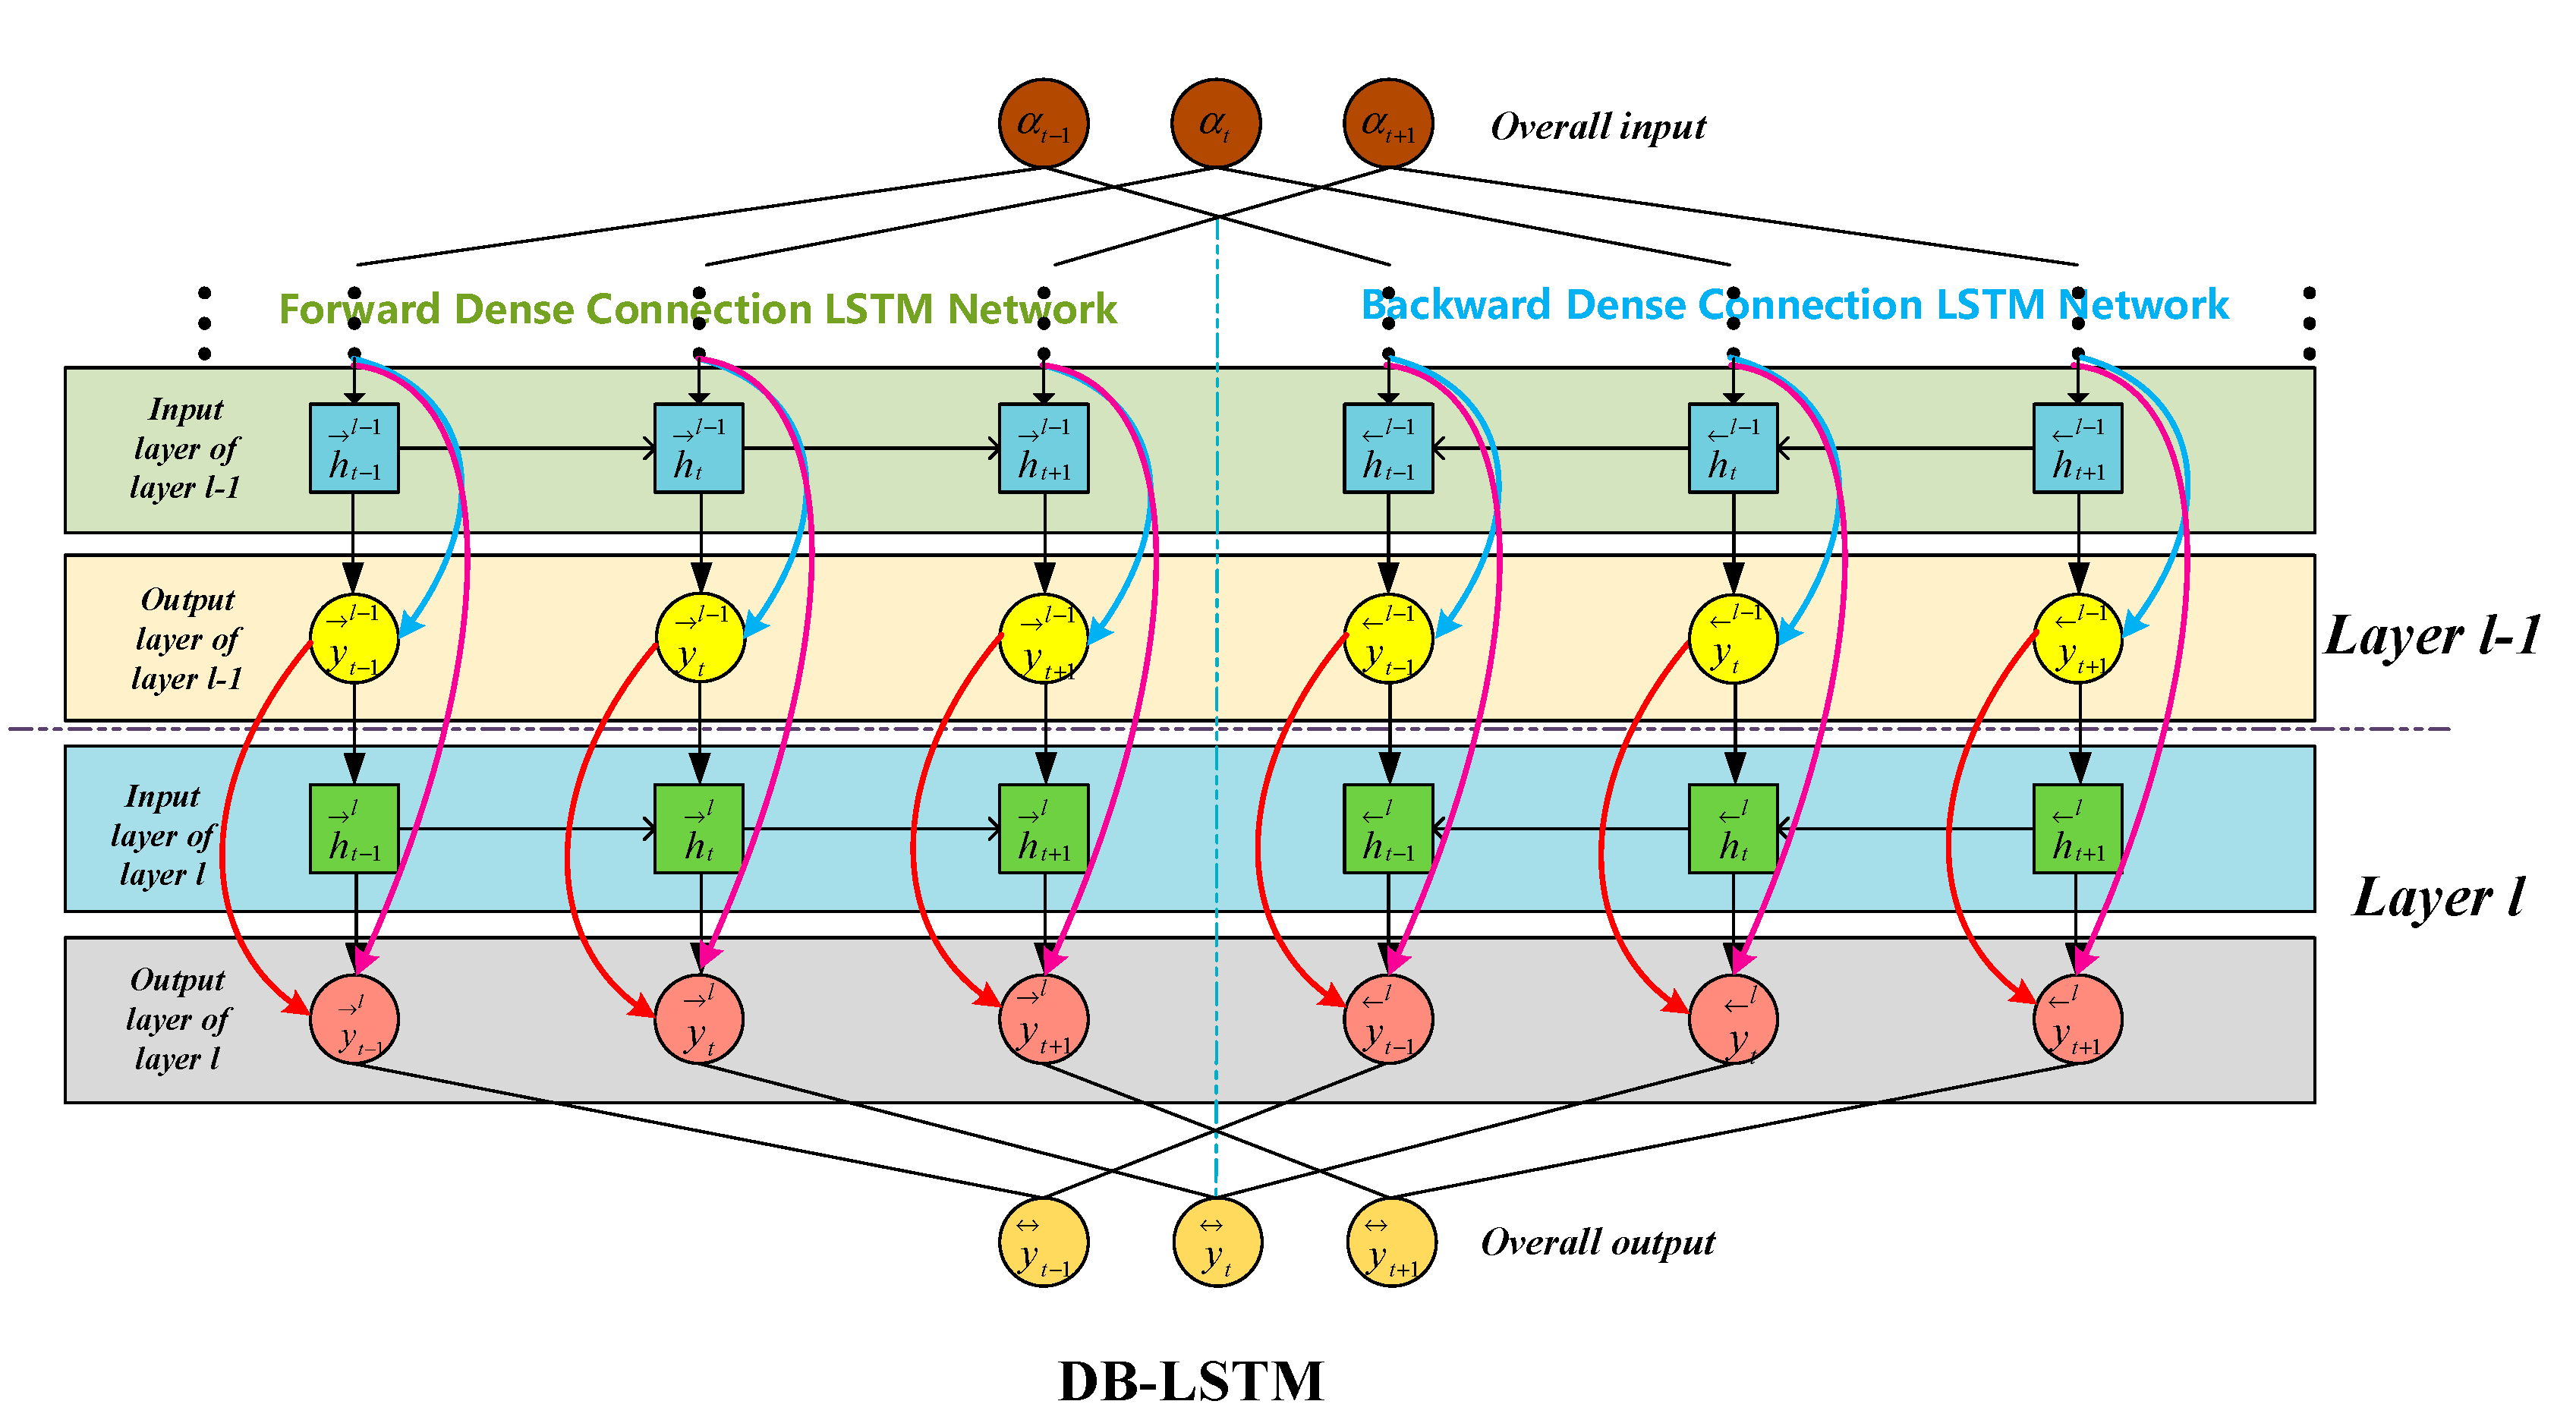
The DB-LSTM network models the related temporal patterns of the switching actions of electrical devices through the aforementioned structure. It takes full advantage of the dense connection modules and bidirectional time feature detection to reduce computational complexity and enhance event detection capabilities. The main feature of the entire DB-LSTM network is that it not only achieves inter-layer connectivity but also cross-level connections across multiple layers. Its structure is shown in
Figure 2. This structure effectively reduces the gradient explosion problem commonly found in traditional LSTM networks. Additionally, by facilitating communication across multiple levels, it enhances effective feature reuse.
In this DB-LSTM model,
refers to the output of the
-th LSTM module, and the specific calculation formula is as follows:
The
and
in Formula (6) represent the output of the
-th step in the two-way directions of the module in that group, respectively.
indicates that these two outputs are directly linked to each other.
and
respectively represent the direction of output
. The output
calculation method for the
-th time step of the LSTM module’s
-th layer is as follows:
Among them, refers to the set of features extracted by multiple modules before this layer module.
Using expression
to represent the
-th layer in the DB-LSTM network, where
is the input to each layer of the LSTM:
Merge the output of the previous LSTM layer with the input feature of the -th time step.
To obtain a comprehensive overall temporal correlation feature of load data, this paper represents the last output of the DB-LSTM network as
, where
is the sampling stack,
is the primary network, and
and
represent the weights of the SRL and DB-LSTM backbone networks, respectively. And use the cross entropy function to calculate the loss:
Finally, merge the scores generated by the network model modeling with the fusion layer and use a multi-scale sliding window to fuse all outputs into scores, the fusion formula is:
In the formula, represents the starting time step of the sliding window, and represents the number of time steps.
3.3. Non-Intrusive Load Identification Model Incorporating Feature Dimension Reduction and DB-LSTM
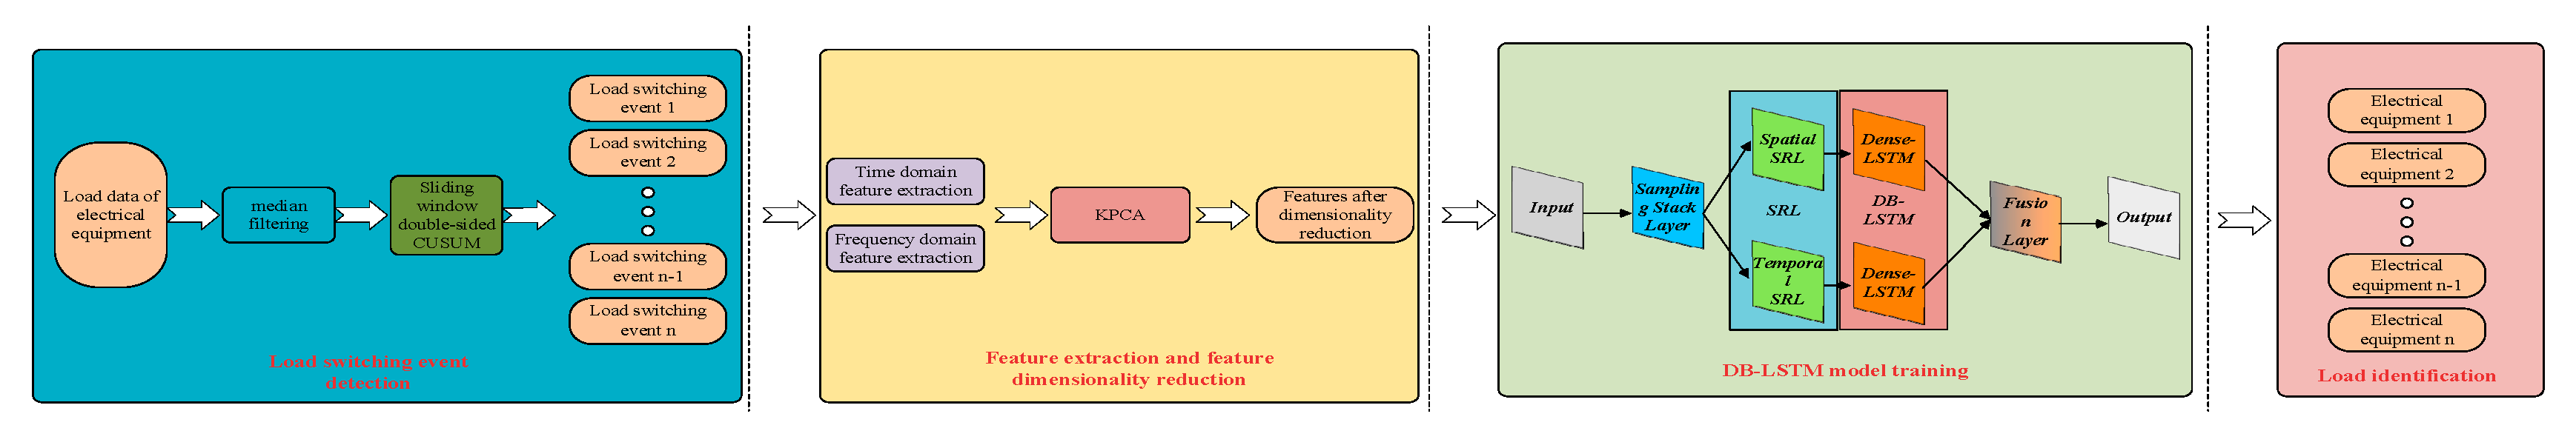
The illustration in
Figure 3 outlines the specific procedure of the KPCA-DBLSTM non-intrusive load identification model proposed in this paper.
Step 1: Collect aggregate data through sensors or other devices.
Step 2: Perform denoising on the data using median filtering.
Step 3: Detect events in the data using a sliding window’s bilateral cumulative sum (CUSUM).
Step 4: Extract features from the detected data, focusing on multi-dimensional characteristics.
Step 5: Employ the KPCA technique for data dimension reduction, extracting features that are more effective for load identification tasks.
Step 6: Input the processed data into the DB-LSTM network for load identification.
Step 7: Obtain the results of the load identification and output relevant information.
5. Results
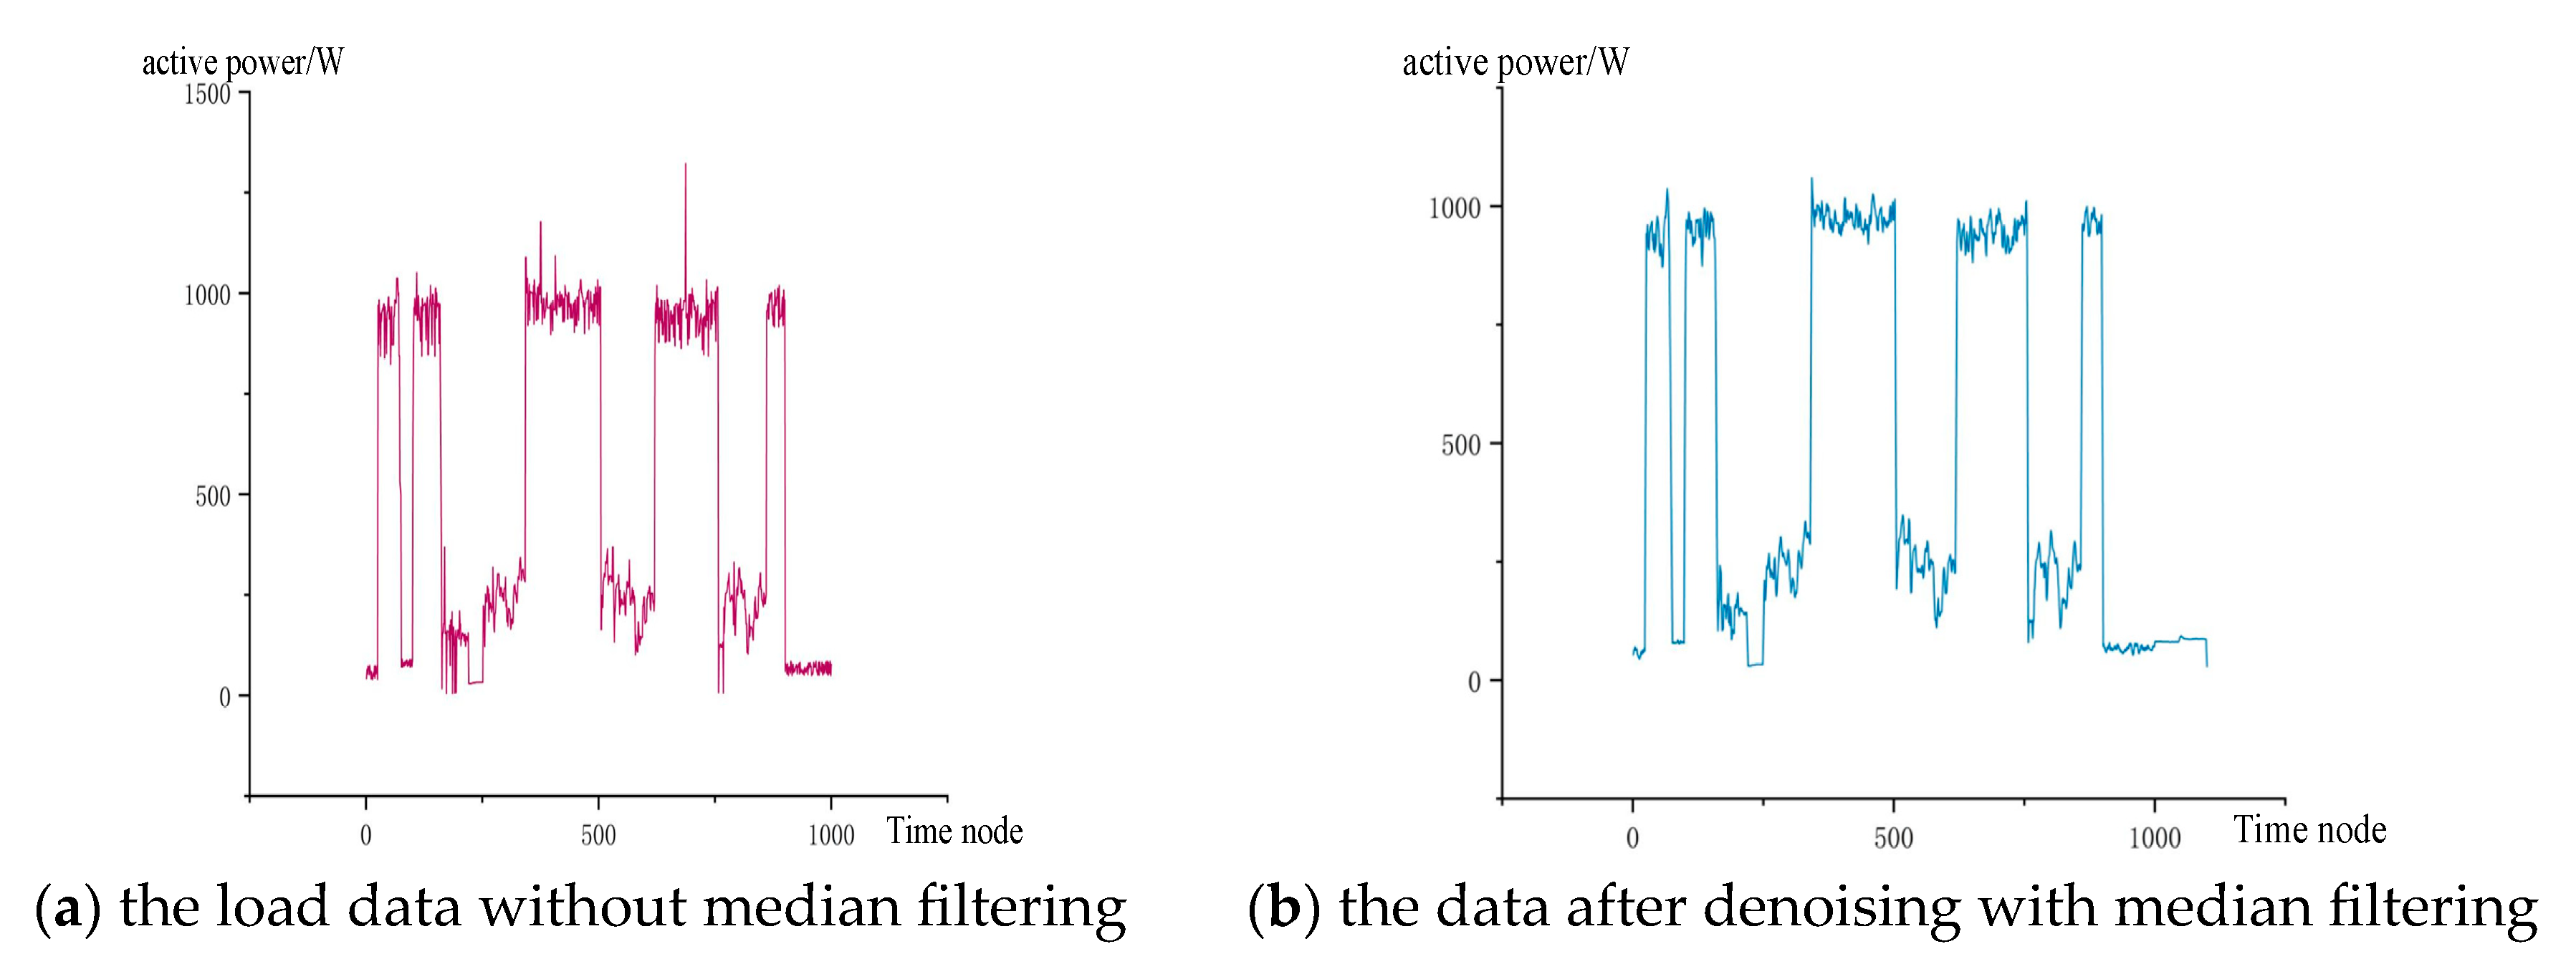
The effectiveness experiment of the median filtering method was conducted first. The intuitive filtering effect is shown in
Figure 4, where (a) represents the waveform of the load data without median filtering, and (b) represents the waveform of the load data after median filtering. It is apparent that after median filtering, the significantly prominent data in the load data has reduced, making the overall waveform smoother without losing the general fluctuation pattern. It retains the overall information regarding load changes. According to
Table 2, it is evident that this does not affect the load identification effect. On the contrary, the accuracy of load identification has slightly improved.
In addition,
Table 2 shows the comparison of three metrics between the LSTM, CNN, HMM models, and the proposed KPCA-DBLSTM model under two conditions: with and without median filtering. According to the data in
Table 2, the load data after median filtering, when input into the model, does not decrease the overall recognition rate. Instead, it leads to different degrees of improvement in the three evaluation metrics. Firstly, there is an improvement of 1.2% to 2.6% in the
Acc metric, and the
MAE metric also shows a slight improvement. Finally, the
metric exhibits an improvement ranging from 1.3% to 4%. In this experimental part, the KPCA-DBLSTM model proposed in this paper achieves optimal performance across all three evaluation metrics. From the comprehensive performance in the above table, it can be observed that the median filtering event detection method employed in this paper has the potential to improve the load identification efficiency of multiple models to varying degrees. However, there is a certain degree of variation in the improvement among different models. This is because, although median filtering can effectively reduce the impact of various factors such as noise and outliers, it is difficult to avoid filtering out the special feature information contained in some extreme values. Consequently, while the method can enhance accuracy in the subsequent identification of relevant models, it does not lead to a significant increase in accuracy.
Next, this paper conducted experiments to validate the effectiveness of feature dimensionality reduction methods, and the results of three evaluation metrics can be obtained from
Table 2. In this experiment, to verify the effectiveness of the feature dimensionality reduction methods, only changes were made in the feature processing part. Specifically, the results of the three metrics after feature computation with and without feature dimensionality reduction methods were compared.
From the results in
Table 3, it can be observed that the feature dimensionality reduction method has a certain effect on the improvement of load identification accuracy. Firstly, there is a noticeable improvement of 3.7% to 5.4% in the
metric, and the
metric also shows a slight improvement. Finally, the
metric exhibits a relatively stable improvement ranging from 3.5% to 3.8%. This indicates that feature dimensionality reduction techniques effectively eliminate load features that are ineffective or have minimal impact on the load identification task. This makes the model calculations lean towards load features that are more beneficial for load identification, resulting in an increase in relevant evaluation metric values. However, after analyzing the data in the table, it was found that there is a disparity in the improvement of accuracy among different models. This is because, during the process of feature dimensionality reduction, different models emphasize the extraction of different types of features. As a result, the applicable features vary, leading to such issues in accuracy enhancement.
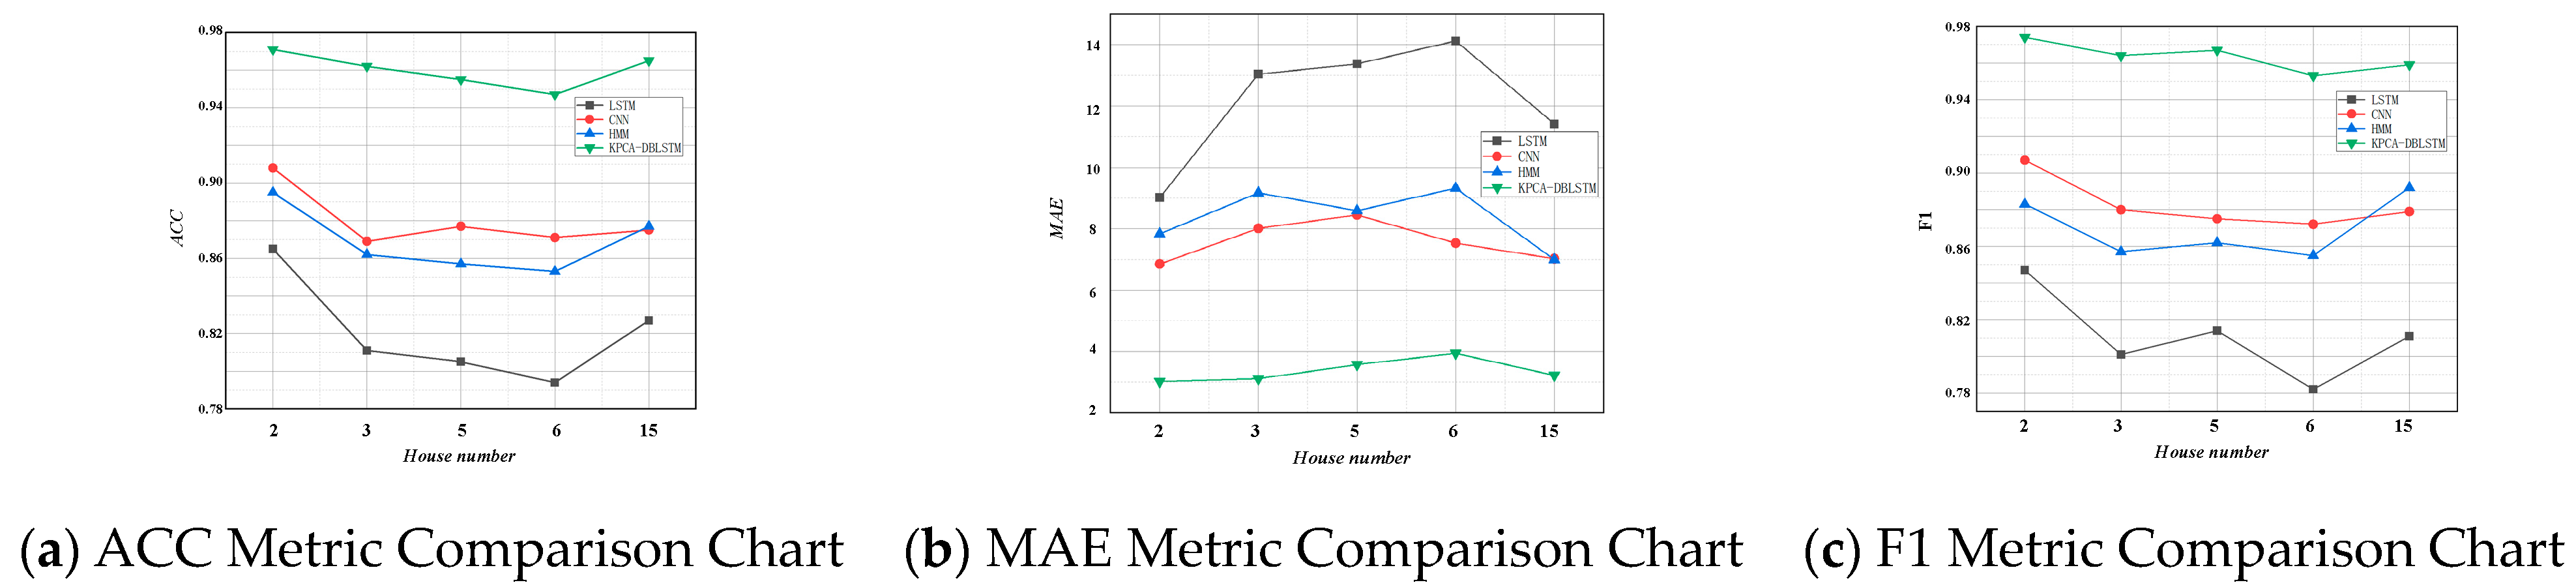
The final step involves a comparative experiment to validate the model’s generalization performance. This paper verifies the generalization capability of the proposed model by comparing untrained data from HOUSE2 with data from HOUSE3, 5, 6, and 15.
Figure 5 illustrates the comparative results of three metrics across multiple load identification models.
Through the comparison of the three indicators in
Figure 5a–c, the results indicate that the proposed KPCA-DBLSTM model in this paper exhibits a significant advantage across multiple scenarios and various metrics. For the
metric, the KPCA-DBLSTM model proposed in this paper shows a 7.6–15.1% increase compared to other models in different scenarios. Under the
metric, there is an optimization ranging from 3.8% to 10.18%, and finally, the
metric shows an improvement of 6.7–17.1%. The comparison of these data effectively demonstrates the overall effectiveness of the non-intrusive load identification model proposed in this paper.
Furthermore, during the process of validating the generalization performance of the KPCA-DBLSTM model in different household data situations, there is a certain fluctuation in the accuracy. For instance, in the trained data of HOUSE2, the model performs the best, while the load identification results for data from other households (HOUSE3, 5, 6, and 15) show varying degrees of decrease. This is attributed to the fact that although different households may adopt similar electrical devices, their electricity consumption behaviors, power consumption, and other relevant load characteristics differ from those in HOUSE2, which was part of the training data. Therefore, while still effective in identification, there is a potential decrease in load identification accuracy.
6. Discussion
In this paper, a non-intrusive load identification method based on DB-LSTM, considering feature dimensionality reduction, is proposed. Through experimental comparisons, the model introduced in this paper optimizes and improves the load identification task in various stages, such as event detection, data processing, and load identification. The median filtering method helps mitigate the impact of extreme data on experiments, feature dimensionality reduction concentrates computational resources on aspects beneficial to load identification, and the DB-LSTM network effectively reduces model complexity and hardware requirements for load identification devices through the multiple reuse of features.
The proposed model facilitates the simplification of load identification procedures in real-world scenarios, enhancing computational speed and, consequently, improving the efficiency of analyzing electricity consumption behavior. This leads to a more convenient and accurate execution of load identification tasks, providing power users with more authentic and effective electricity consumption data. It assists users in optimizing their electricity consumption habits intelligently.
However, the computational process of the proposed method remains relatively extensive and cumbersome, requiring a complete workflow for load identification tasks. This imposes higher computational demands on load identification devices, potentially limiting the widespread deployment of this technology, especially in cost-sensitive or resource-constrained environments. Therefore, further research is needed to explore ways to enhance the computational capabilities of load identification devices, such as simplifying algorithmic processes, reducing computational complexity, and lowering device computational requirements.
For instance, more efficient feature selection and dimensionality reduction techniques could be investigated, or lighter network structures could be developed. Model compression and quantization techniques could also be explored to reduce the size and computational demands of the model, making it more suitable for operation on resource-constrained devices. This could further facilitate the interoperability between edge devices and cloud devices, leveraging the advantages of the simplified network in DB-LSTM to reduce hardware requirements for edge detection devices installed in homes. This, in turn, addresses the current challenge of the limited installation of load identification devices due to cost issues and contributes to the further development of smart grids, promoting advancements in intelligent electricity usage.


