Abstract
Three-dimensional(3D) shape measurement using point clouds has recently gained significant attention. Phase measuring profilometry (PMP) is widely preferred for its robustness against external lighting changes and high-precision results. However, PMP suffers from long computation times due to complex calculations and its high memory usage. It also faces a 2π ambiguity issue, as the measured phase is limited to the 2π range. This is typically resolved using dual-wavelength methods. However, these methods require separate measurements of phase changes at two wavelengths, increasing the data processing volume and computation times. Our study addresses these challenges by implementing a 3D shape measurement system on a System-on-Chip (SoC)-type Field-Programmable Gate Array (FPGA). We developed a PMP algorithm with dual-wavelength methods, accelerating it through high-level synthesis (HLS) on the FPGA. This hardware implementation significantly reduces computation time while maintaining measurement accuracy. The experimental results demonstrate that our system operates correctly on the SoC-type FPGA, achieving computation speeds approximately 11.55 times higher than those of conventional software implementations. Our approach offers a practical solution for real-time 3D shape measurement, potentially benefiting applications in fields such as quality control, robotics, and computer vision.
1. Introduction
The increasing need for precise inspection of complex shapes has heightened the importance of 3D shape measurement technology [1,2]. Over the years, various profilometry methods using structured light projection have been studied for 3D shape measurement. These methods include Moire Profilometry (MP), Modulation Measuring Profilometry (MMP), Computer-Generated Moire Profilometry (CGMP), and Phase-Differencing Profilometry (PDP) [3,4,5,6,7,8]. Among these, Fourier Transform Profilometry (FTP) and phase measuring profilometry (PMP) are the most widely used methods [9,10]. FTP enables high-speed 3D shape measurement but is limited by the use of a single frame, which restricts its ability to measure complex shapes. To overcome this limitation, PMP, which uses multi-frame phase-shifted fringe patterns, is widely employed due to its robustness against changes in external lighting and its ability to obtain high-precision shape data [11,12]. However, PMP requires extended computation times due to complex calculations and high memory consumption. Additionally, PMP is limited by 2π ambiguity, where the measured phase is only expressed within the 2π range, restricting the measurement range [13]. Due to the 2π ambiguity, using fringe patterns with a short period increases measurement resolution but narrows the measurement range, while using fringe patterns with a long period widens the measurement range but lowers the resolution. To overcome these limitations and retrieve the absolute phase from the measured phase confined within the 2π range, phase unwrapping is an indispensable and crucial step. This process is broadly categorized into spatial phase unwrapping (SPU) and temporal phase unwrapping (TPU). SPU methods, such as quality-guided SPU [14], diamond (rhombus)-type SPU [15], and curtain-type SPU [16], resolve the 2π ambiguity by leveraging the spatial continuity and quality of the phase data. On the other hand, TPU methods, including gray code TPU [17], dual-wavelength (heterodyne) TPU [18], phase-coding TPU [19], phase shift-coding TPU [20], and fringe amplitude-encoding TPU [21], rely on the temporal sequence of phase data to unwrap the phase. In this study, we used the dual-wavelength method, which is effective in scenarios requiring high-precision measurements. However, this approach requires measuring the phase changes at two wavelengths separately, doubling the data processing volume and necessitating the combination of the results from the two phases, significantly increasing computational load.
To overcome these drawbacks, research has focused on accelerating the PMP calculations using GPUs. In a Zhang et al. study, a 2 + 1 phase-shifting algorithm was used to achieve 25.56 fps at 532 × 500 pixels, realizing real-time 3D shape measurement using a GPU [22]. Nguyen et al.’s study proposed a CPU and GPU hybrid architecture real-time 3D measurement system that relies on combining three grayscale phase-shift fringe patterns into a single color image [23]. It achieved a processing speed of 45 fps at 640 × 480 pixels using four fringe frequency phase unwrappings. Generally, high-performance GPUs are used to accelerate PMP, but their high power consumption and heat generation make them unsuitable for embedded systems.
Therefore, this paper presents a 3D shape measurement system using a System-on-Chip (SoC)-type Field-Programmable Gate Array (FPGA) [24], which can process complex computations in parallel, effectively enhancing the speed of systems requiring high-speed computations [25,26,27]. Among these, the SoC-type FPGA, with its CPU and FPGA combination, allows for an integrated software and hardware design, making it an effective solution for an embedded system [28]. Furthermore, we implemented an algorithm using PMP with dual-wavelength methods, which enables 3D shape measurement through high-resolution images. The algorithm is accelerated by implementing it on hardware using high-level synthesis (HLS) on the SoC-type FPGA combined with a software system to create a 3D shape measurement system. This confirms that multiple high-resolution images can be processed normally on the SoC-type FPGA, and that computation is effectively accelerated while maintaining measurement accuracy.
This paper has the following structure. Section 2 explains the principles of phase measurement methods. Section 3 describes the structural and operational principles of the 3D shape measurement algorithm accelerator. Section 4 details the SoC-type FPGA-based 3D shape measurement system. Section 5 discusses the experimental setup and results. Last, Section 6 summarizes the research findings and concludes the paper.
2. Principles of Phase Measurement Methods
2.1. Phase Measuring Profilometry (PMP)
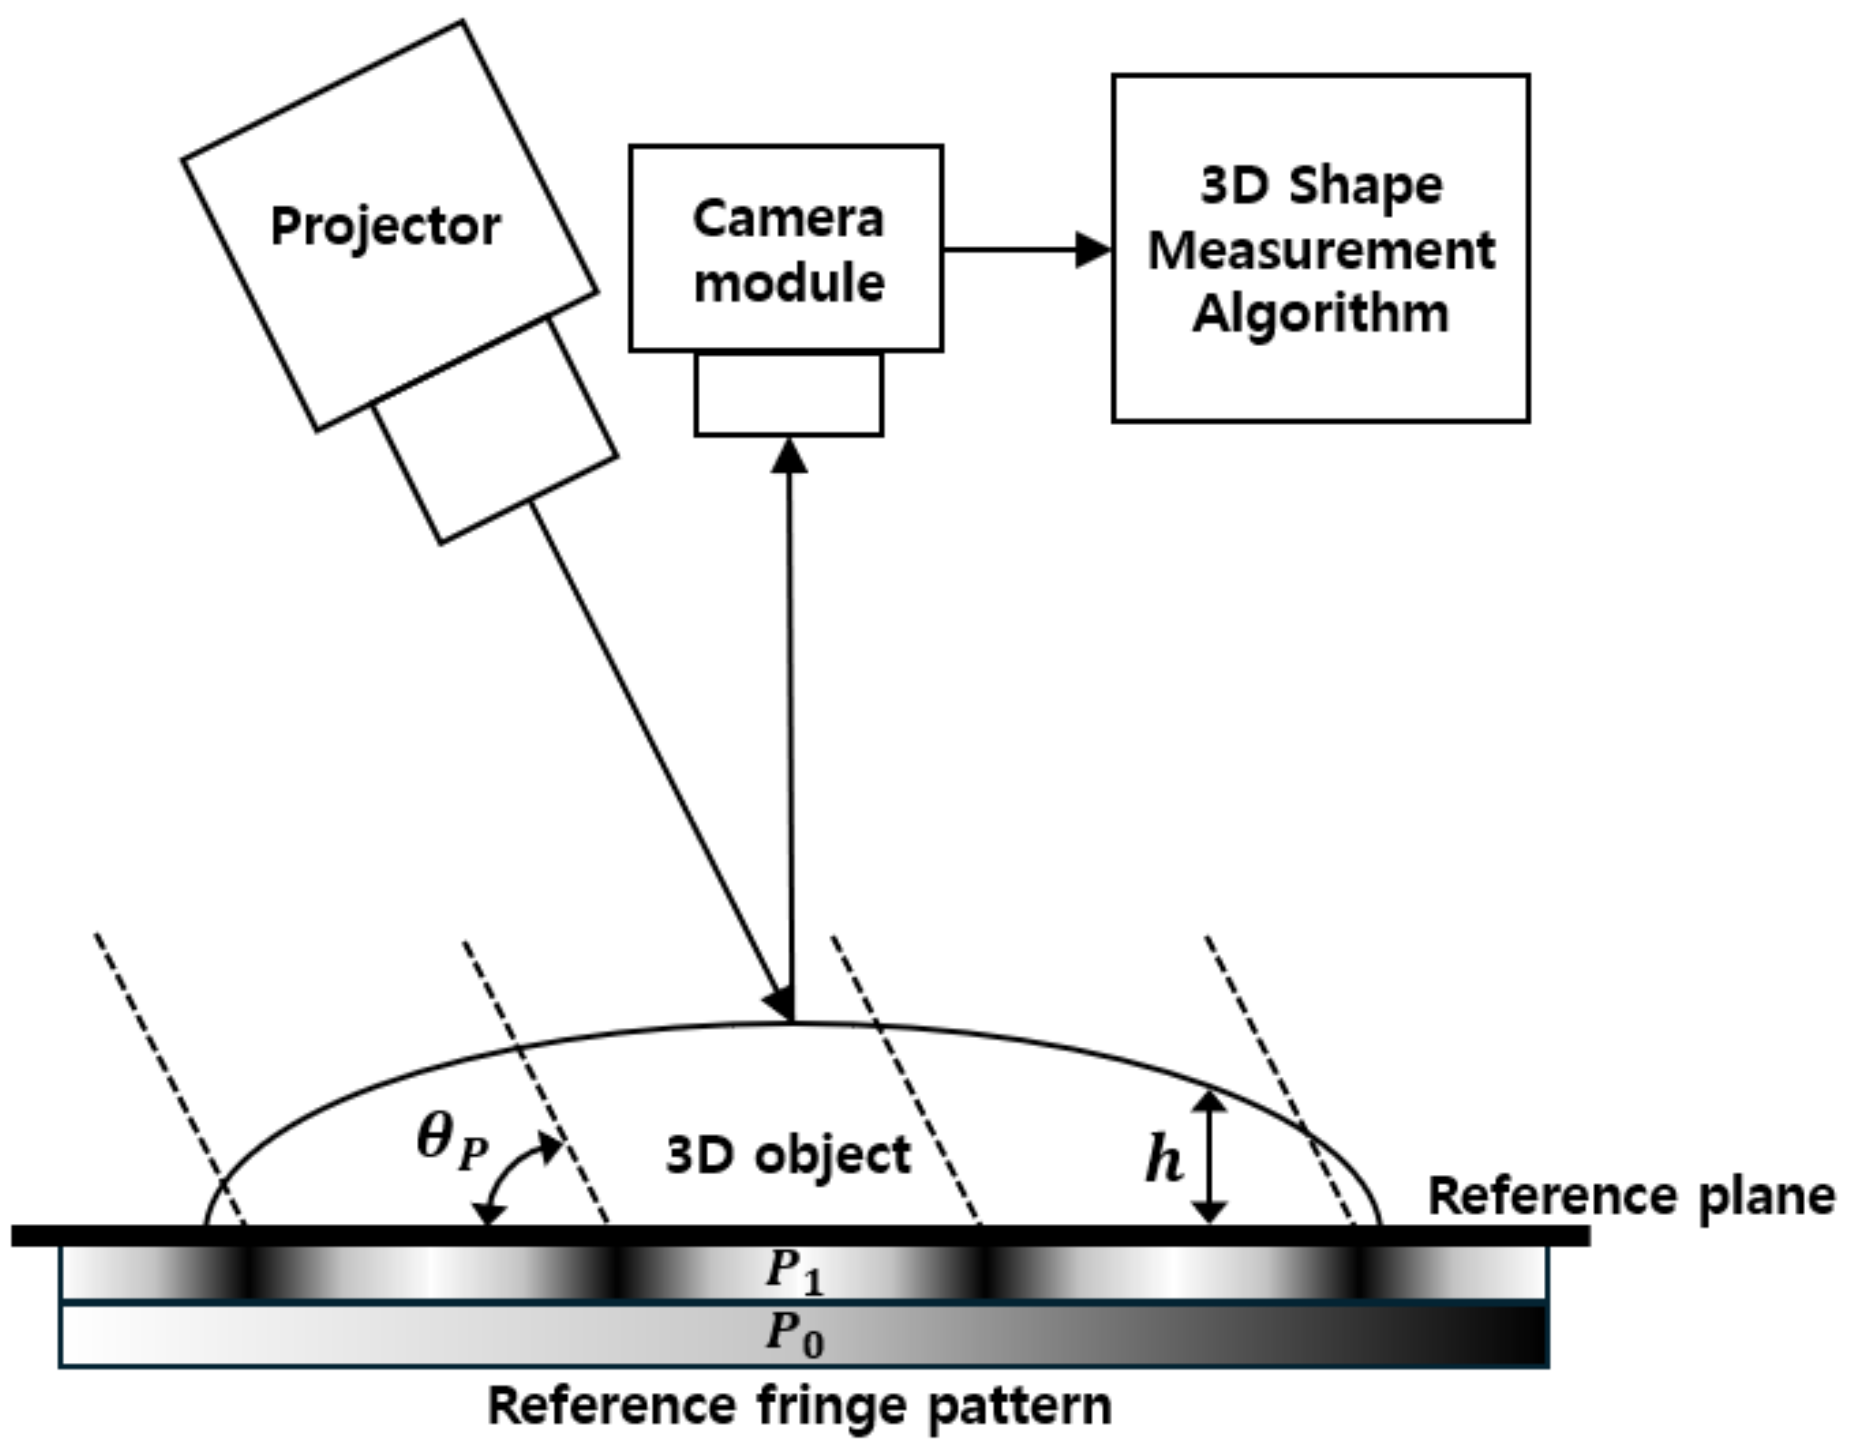
PMP is a method for measuring height by projecting fringe patterns onto an object and analyzing the phase information obtained [29]. Figure 1 illustrates the optical geometry of PMP. is the angle between the reference plane and the fringe pattern projection axis, is the period of the fringe pattern, and represents the object’s height from the ground [30].
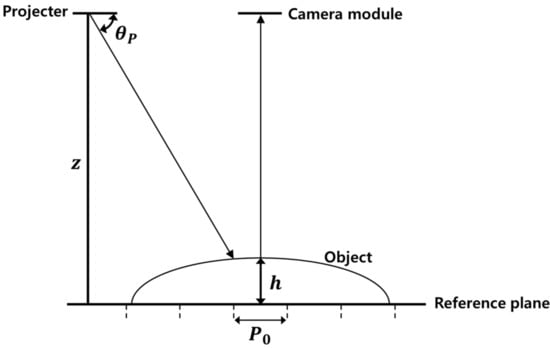
Figure 1.
Optical geometry of the phase measuring method.
The height of the object at coordinates can be calculated using Equation (1).
Here, is the phase value of the reference plane at coordinates , and 0~2π represents the wrapped phase. is an integer and represents the 2π ambiguity. Since the resulting phase image from the measurement is a wrapped phase 0~2π, calculating allows for obtaining accurate depth information. The parameters and are determined based on the system environment and calibration is required. Furthermore, the relative height at coordinates can be determined using the phase difference . When the fringe pattern is projected onto the reference plane, its intensity image is expressed using Equation (2).
Here, is the background intensity image, is the fringe modulation, and is the phase value at coordinates . Equation (2) contains three unknowns: , , and . Therefore, at least three different phase-shifted fringe-pattern intensity images are required to determine the desired phase value . In this study, a four-step phase-shifting method was used, where the phase shift amount was π/2. The intensity images of the four phase-shifted fringe patterns are represented using Equation (3).
Here, is the sequence number of the four images, is the background intensity image, is the fringe modulation, and represents the phase value at coordinates . Using Equation (3), the phase value is calculated as shown in Equation (4).
2.2. Dual-Wavelength TPU Method
The phase difference is the difference between the phase value of the reference plane and the object to be measured. Since the phase difference repeats every 2π, when it exceeds 2π due to the object’s shape or size, it cannot be accurately calculated. This issue is known as the 2π ambiguity. The dual-wavelength method, which uses two sine wave fringe patterns with different frequencies, solves this problem [31]. Figure 2 shows two sine wave fringe patterns with different frequencies.

Figure 2.
Fringe patterns with different frequencies.
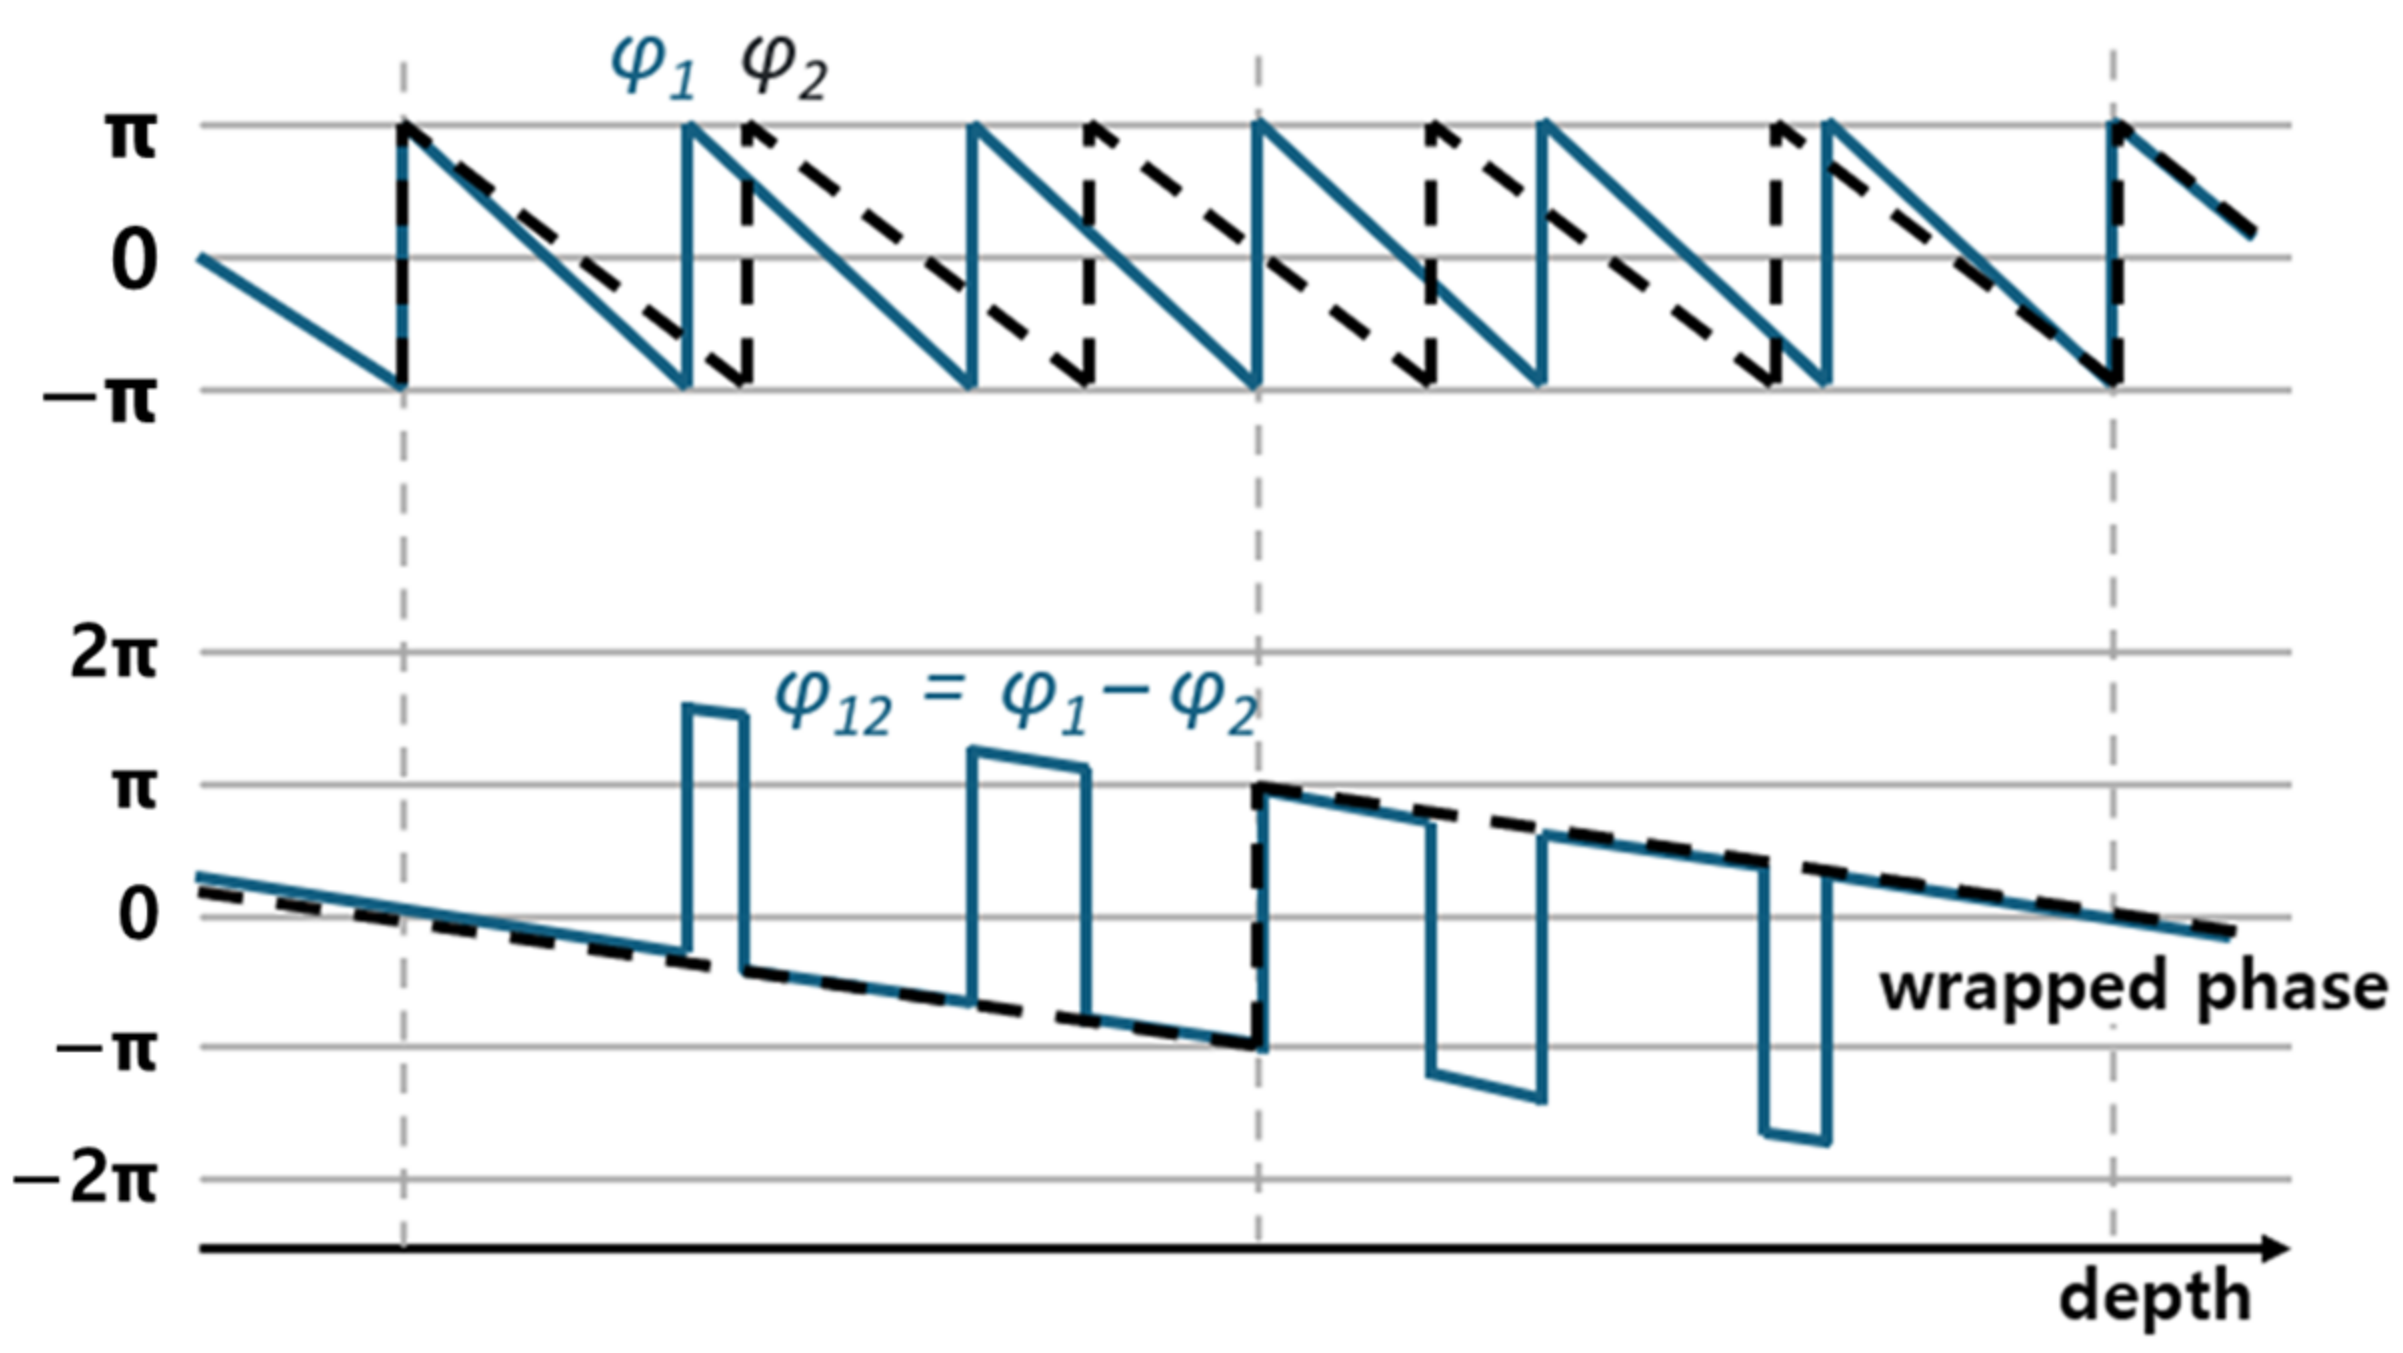
When two fringe patterns with different frequencies are projected onto an object, height information can be obtained using the different frequencies and as shown in Equation (5).
Here, and are the phase information at different frequencies. Using this, the difference between the two phases can be obtained as shown in Figure 3.

Figure 3.
Shape measurement process using the dual-wavelength method.
A new frequency with a wider period is generated after phase unwrapping. This can be expressed using Equation (6). Additionally, the frequency of the fringe and the coefficient are given by Equation (7).
Using the parameters obtained from Equations (6) and (7), the height of the object can be determined as shown in Equation (8).
However, the newly calculated height information has a low measurement resolution due to the use of a wider frequency. By using the previous fringe pattern with a narrower frequency range, height information with a higher resolution can be obtained. This can be expressed using Equation (9), and the coefficient can be calculated as shown in Equation (10).
3. The 3D Shape Measurement Algorithm Accelerator
3.1. The 3D Shape Measurement Algorithm
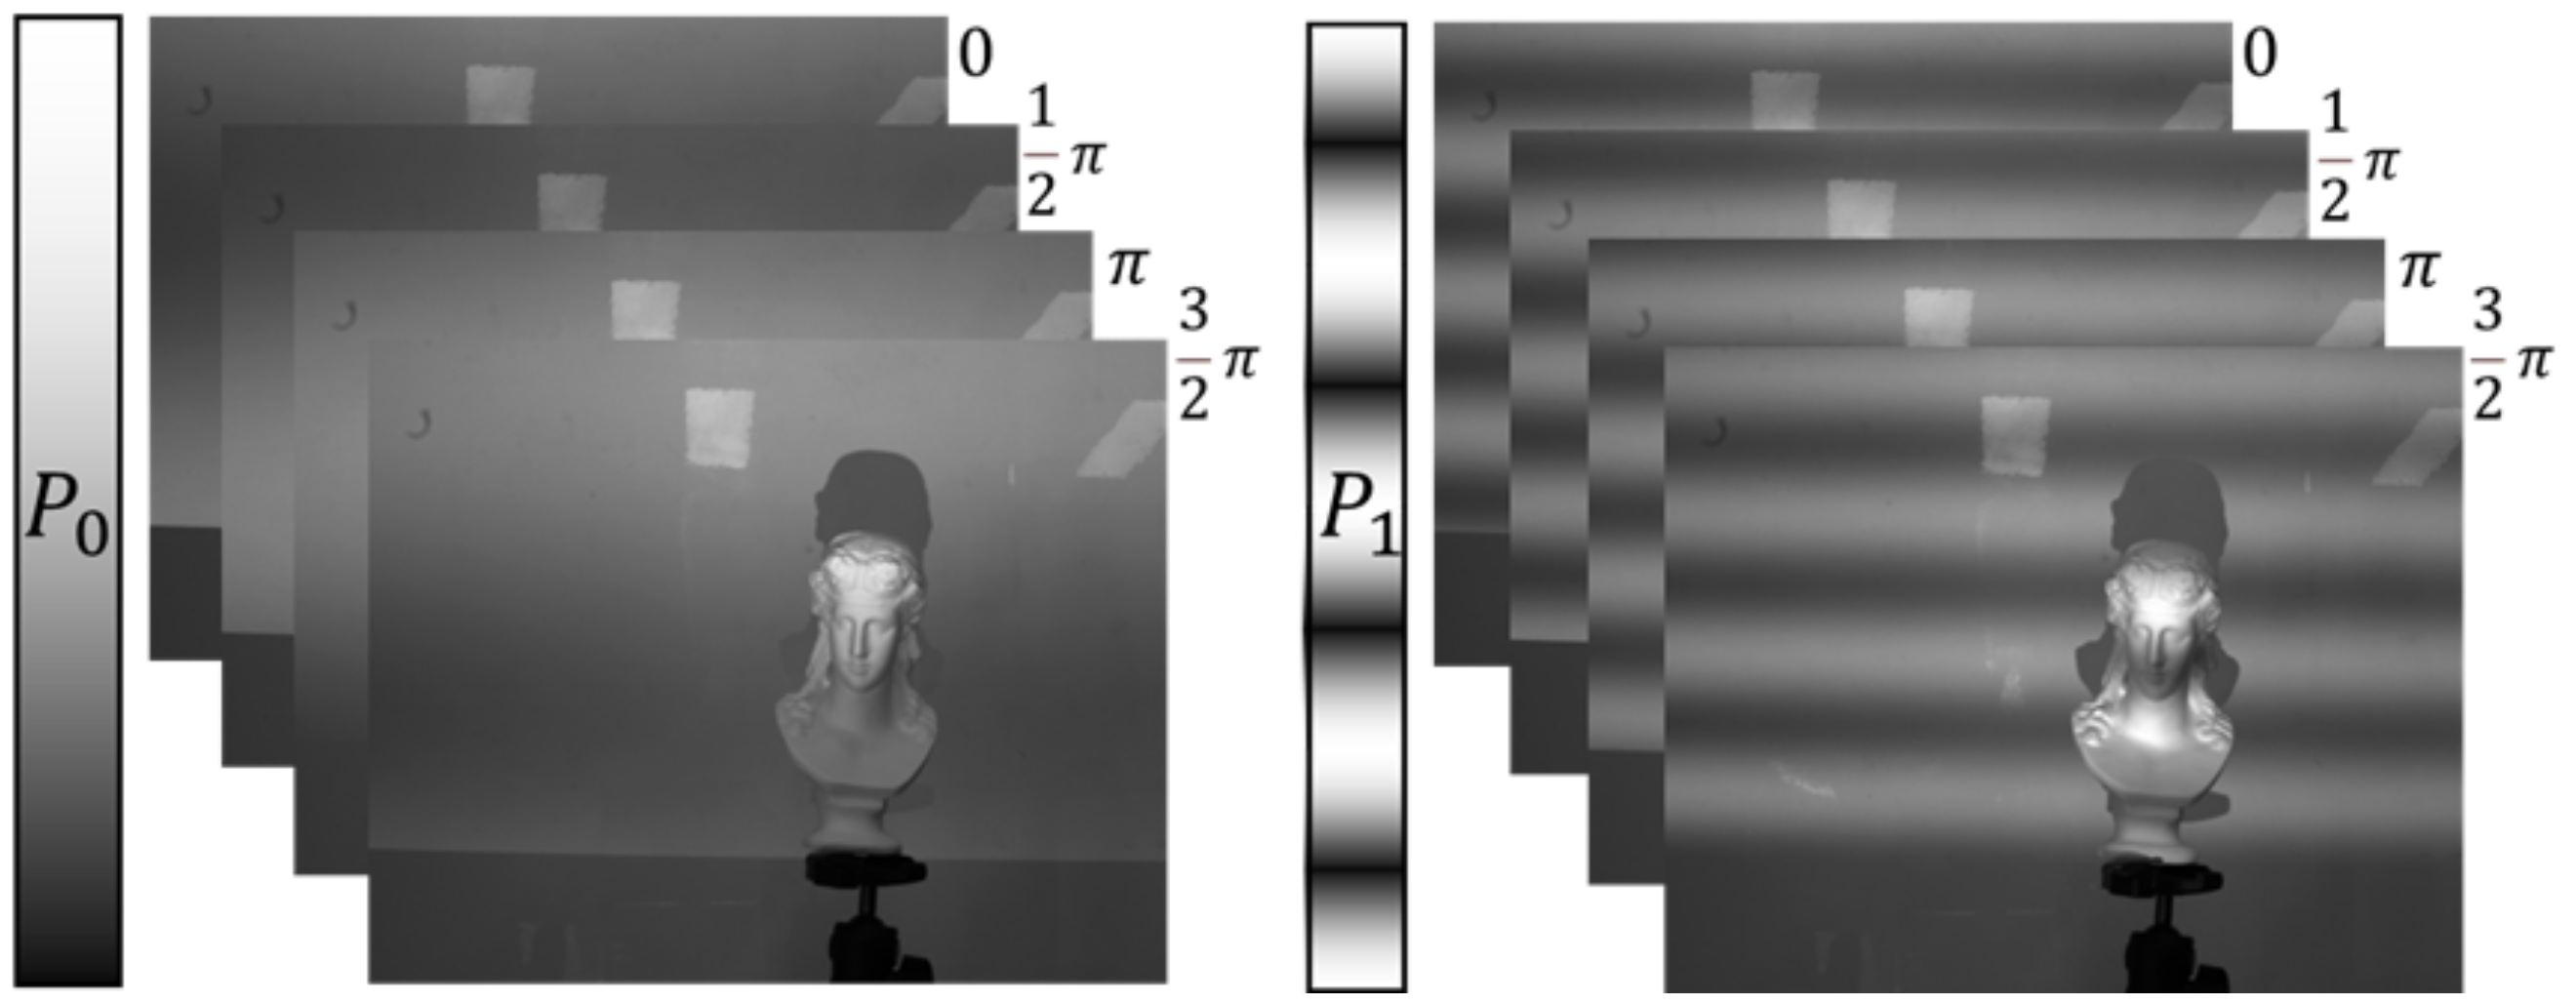
This study implemented a 3D shape measurement algorithm based on PMP using the dual-wavelength method. Figure 4 shows the process of acquiring image data used in the 3D shape measurement algorithm. Figure 5 shows the image data obtained through this process. The projector and camera were positioned on the reference plane facing the object. The projector projected the fringe pattern onto the object, and the camera simultaneously captured the pattern on the object. The projector projected fringe patterns with a period and fringe patterns with a shorter period , phase-shifted by π/2 four times each. This produced a total of eight image datasets which were input into the 3D shape measurement algorithm, and the 3D coordinates for each pixel in the image data were output.
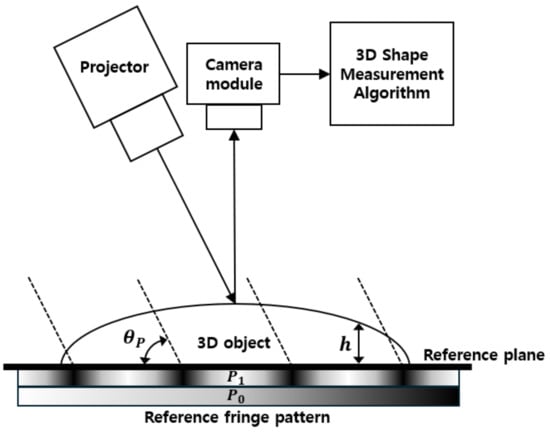
Figure 4.
Flowchart of the 3D shape measurement system.
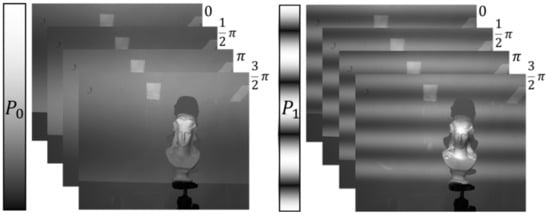
Figure 5.
(Left) Four images with long period patterns projected. (Right) Four images with short period patterns projected.
To enhance the measurement range or resolution of the 3D shape measurement algorithm, using higher-resolution images increases the computational load, thereby extending the processing time. This study proposes an accelerator for the 3D shape measurement algorithm using a SoC-type FPGA to address this issue.
3.2. Structure of the SoC-Type FPGA-Based Algorithm Accelerator
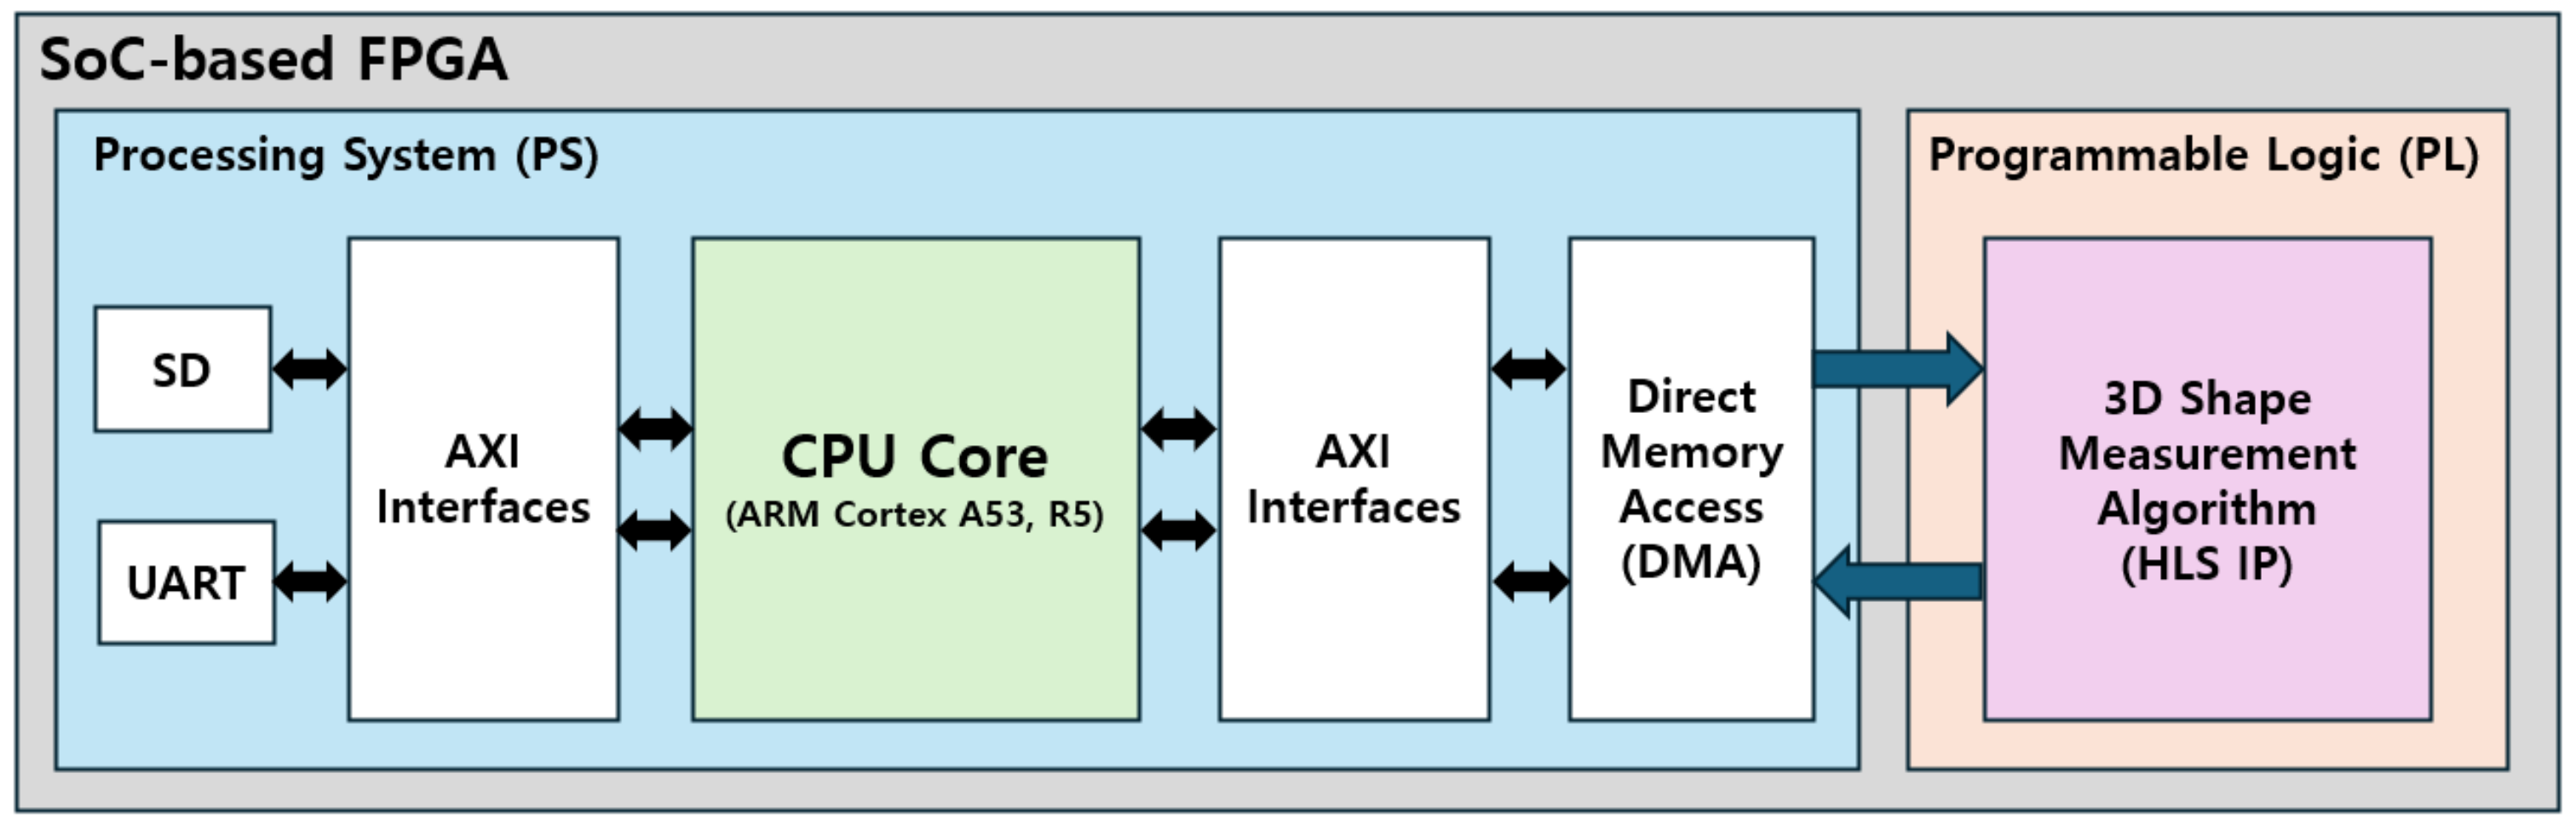
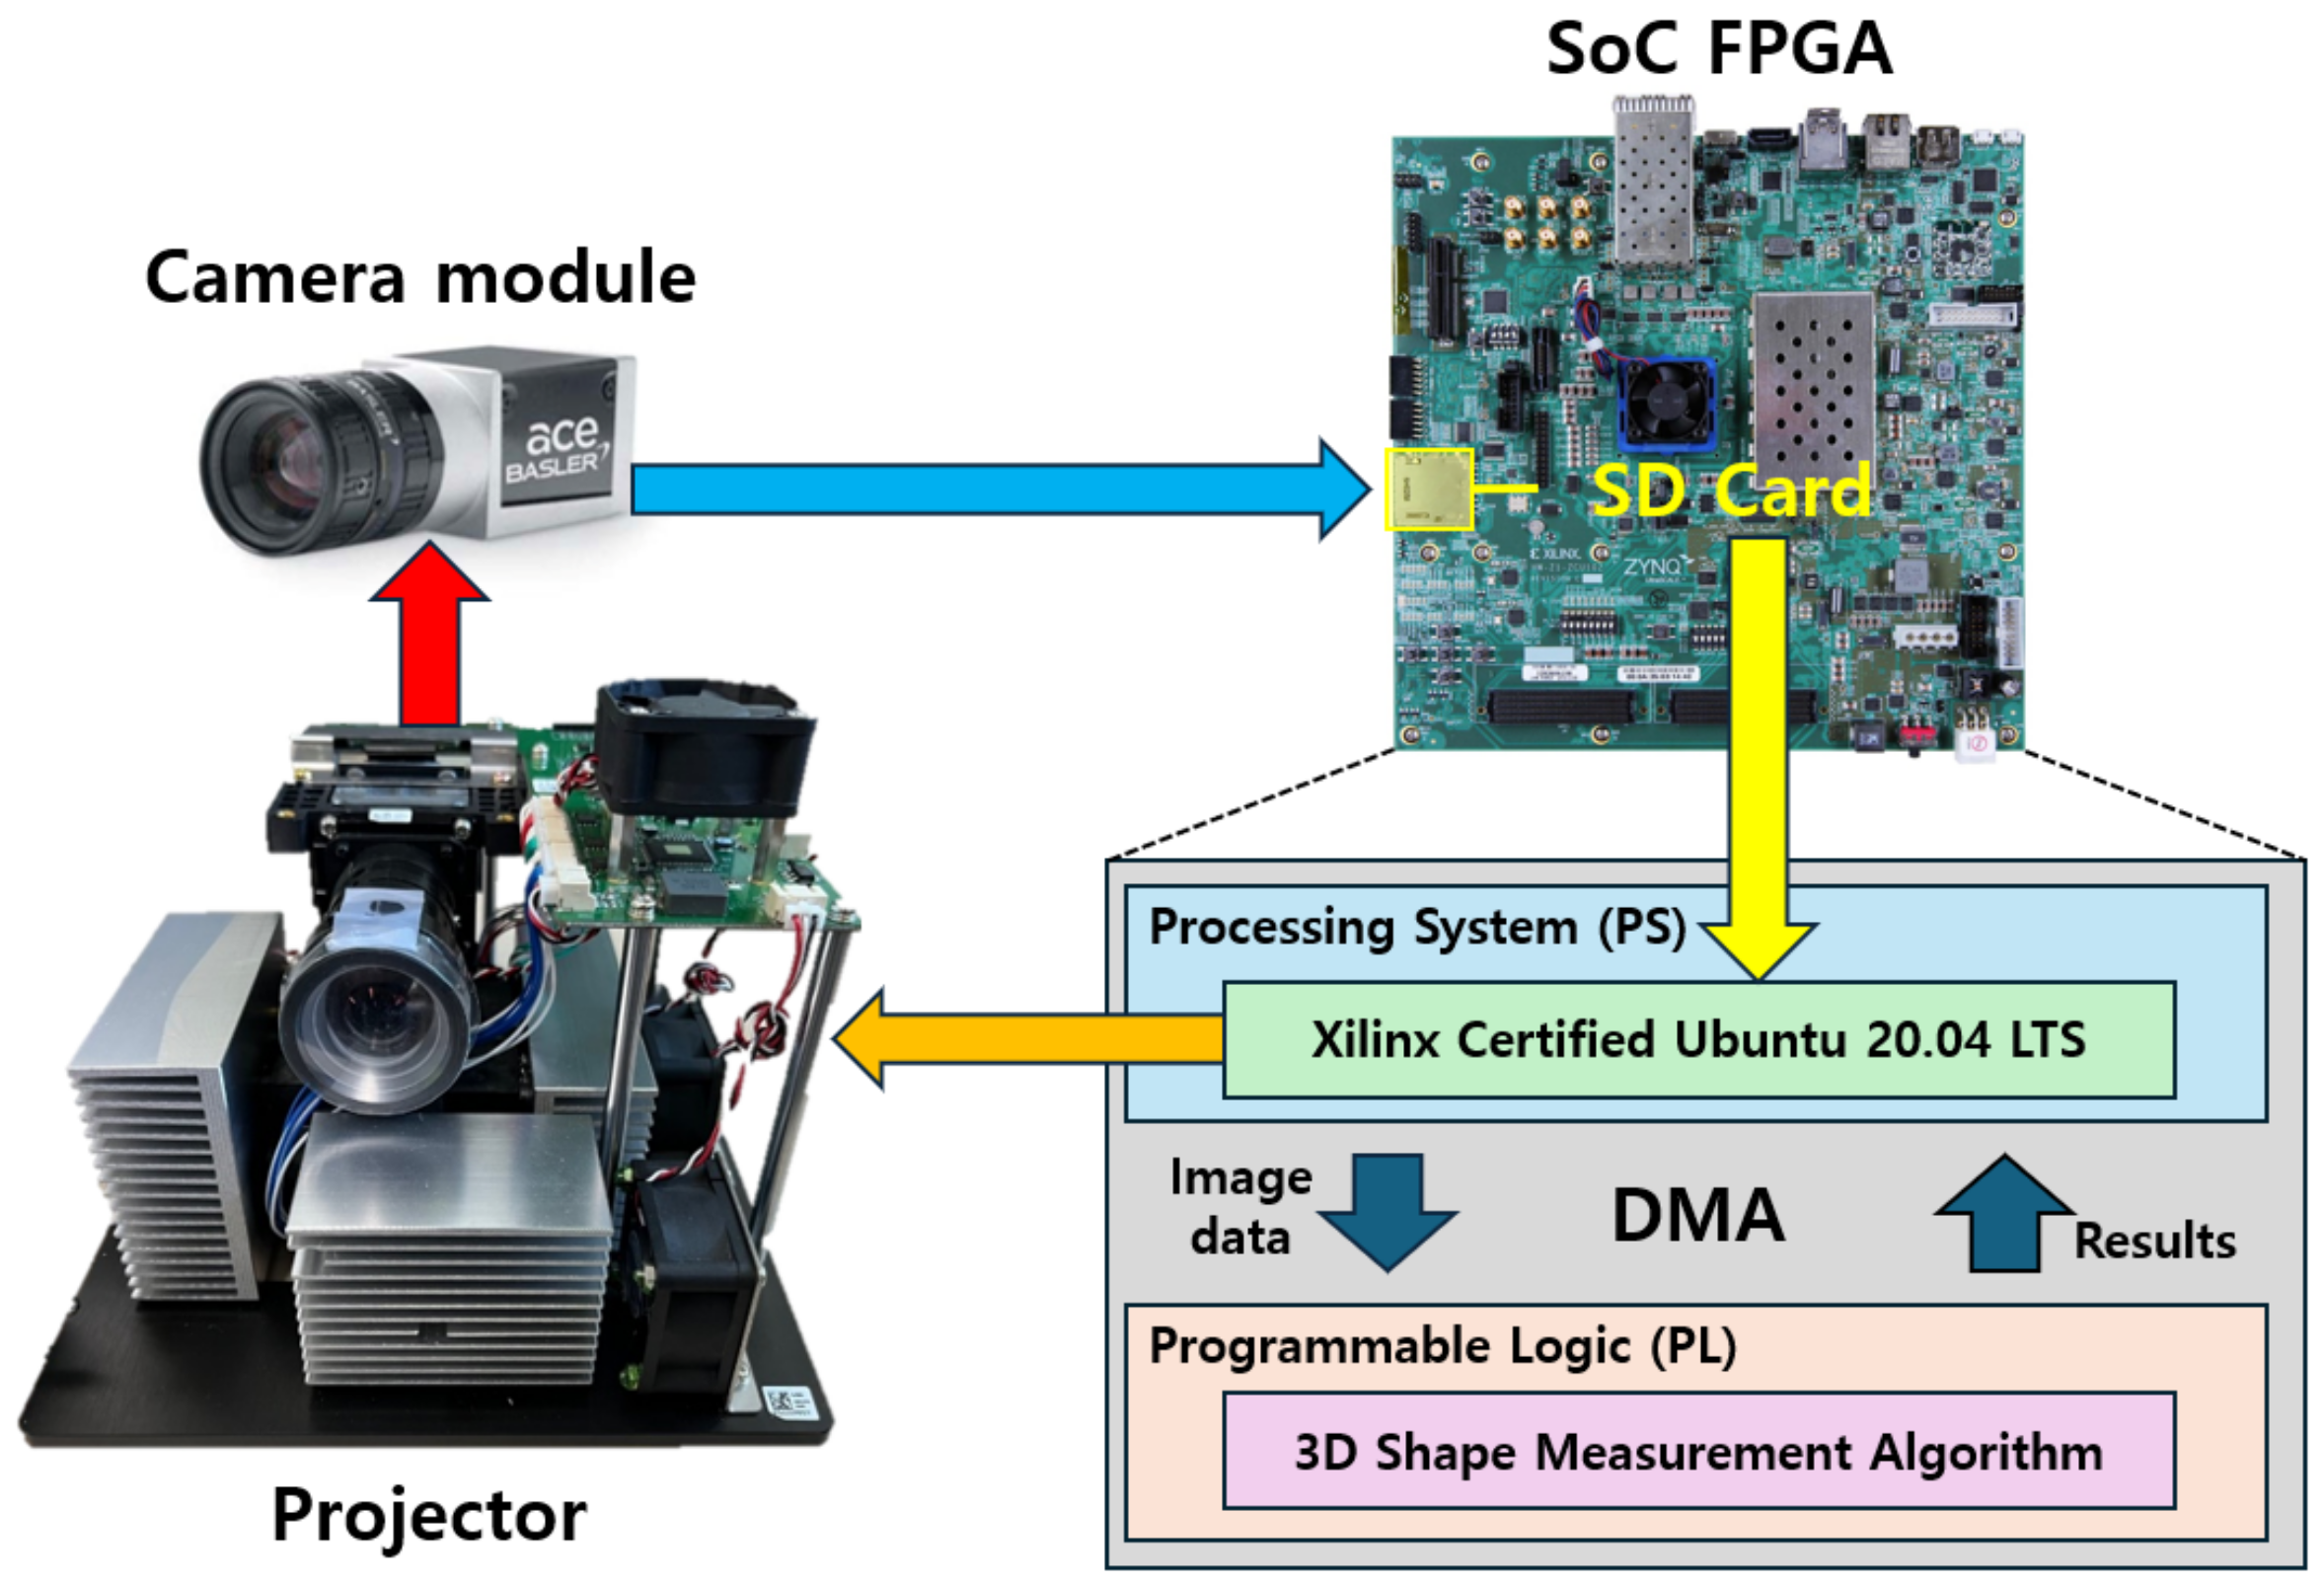
Figure 6 illustrates the structure of the proposed SoC-type FPGA-based 3D shape measurement algorithm accelerator. The accelerator is implemented using Xilinx’s SoC-type FPGA, the ZCU102, and is broadly divided into the Processing System (PS) area and the Programmable Logic (PL) area. The PS area comprises components for running and testing the 3D shape measurement algorithm, while the PL area implements the 3D shape measurement algorithm in hardware. In the PS area, image data used for 3D shape measurement are received from an external memory, such as an SD card, via the Advanced eXtensible Interface (AXI). These image data are transferred from the PS area to the PL area, where the 3D shape measurement algorithm operates. Upon completion of the algorithm’s computations, the results are sent back to the PS area, where they can be verified through UART communication.
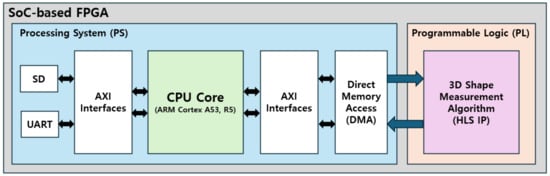
Figure 6.
Structure of the SoC-type FPGA-based 3D shape measurement algorithm accelerator.
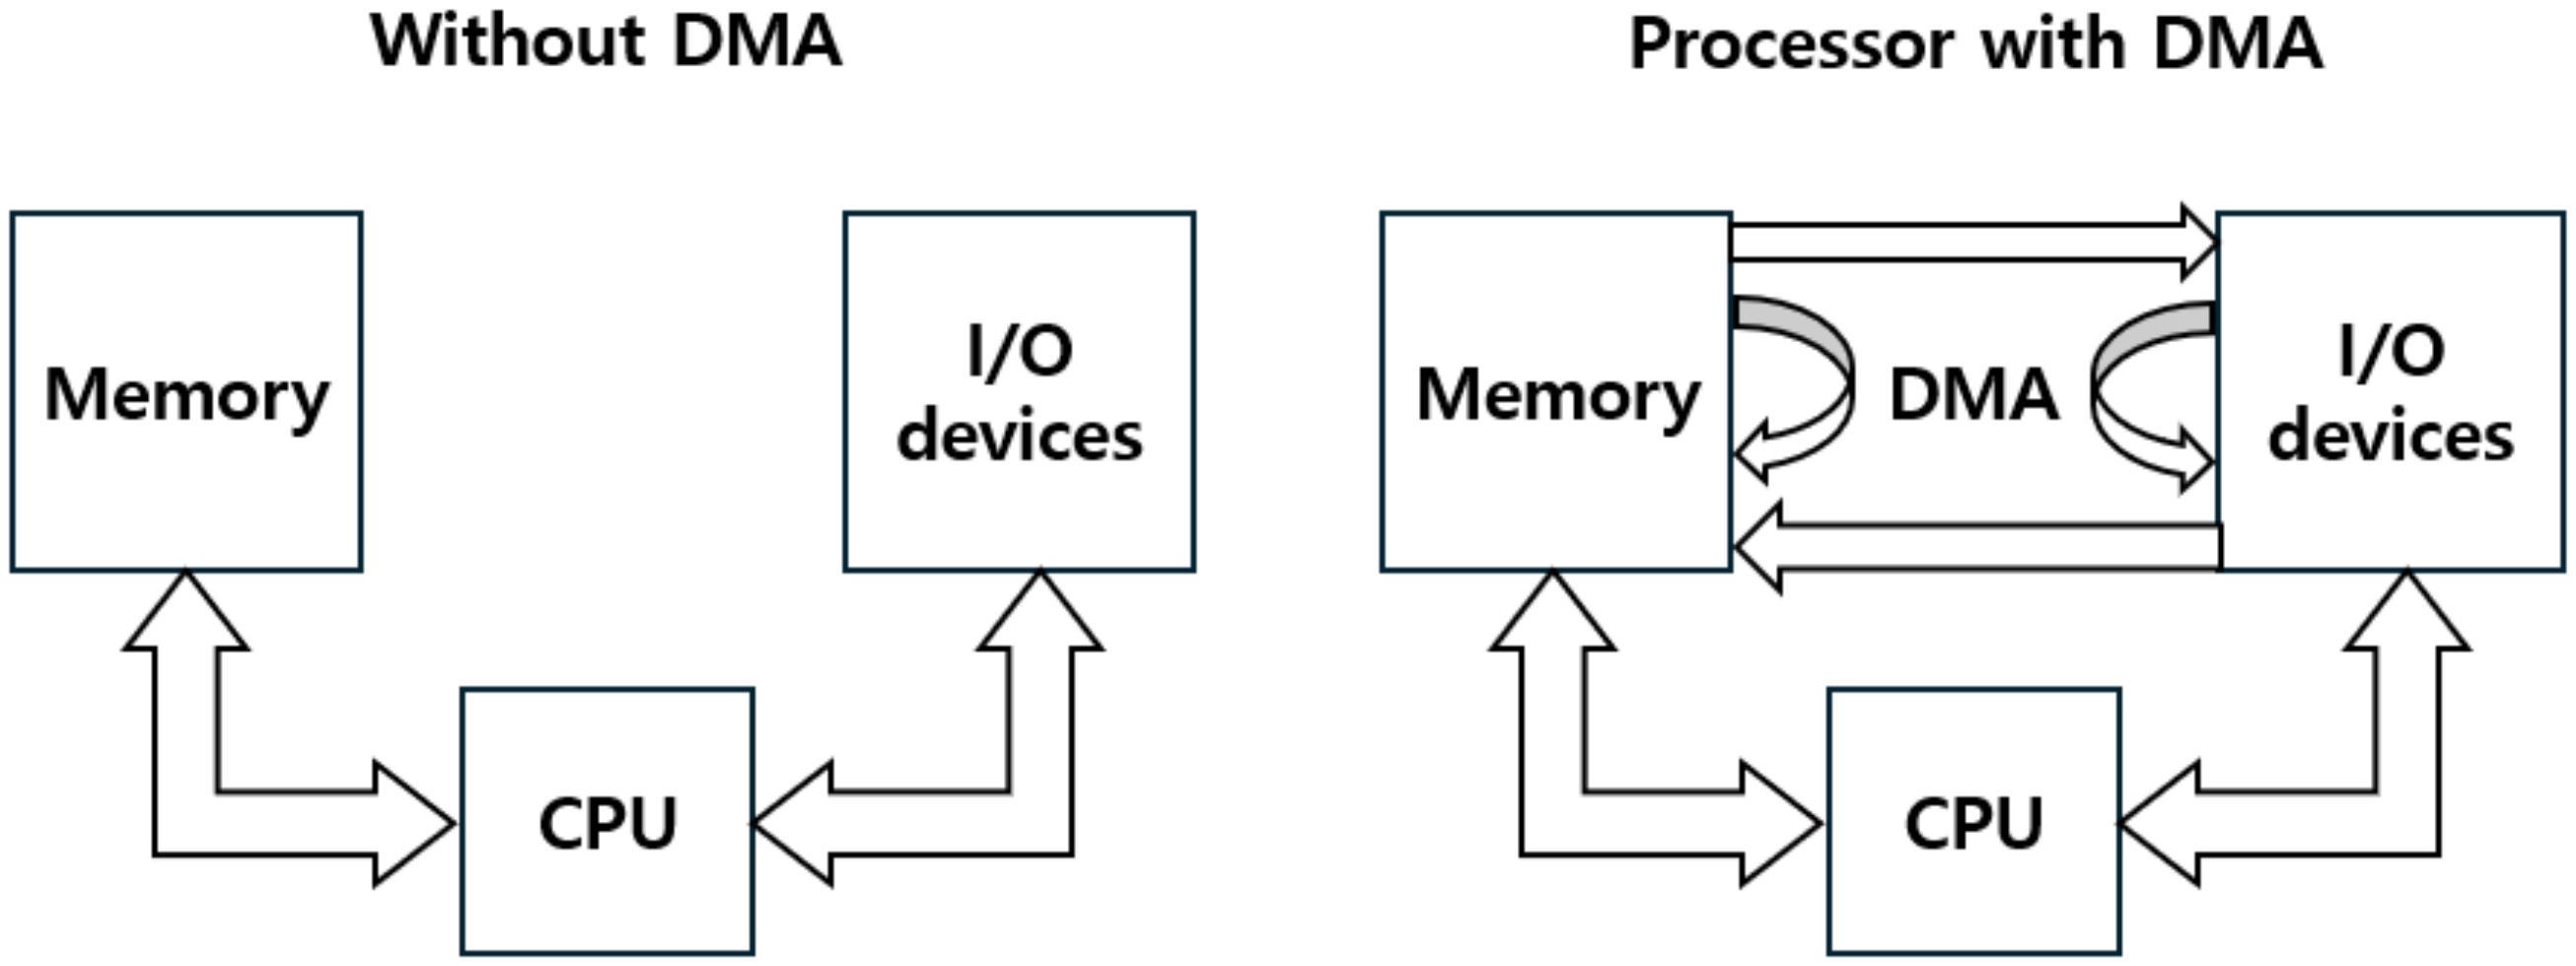
Direct Memory Access (DMA), which facilitates data transfers between memory and hardware devices without direct intervention from the CPU, was used to minimize latency. The left-hand side of Figure 7 shows the data transfer flow before using DMA, and the right-hand side shows the data transfer flow after. Before applying DMA, data transfer from memory to the device requires CPU intervention. However, with DMA, a direct data path is provided between memory and the device, allowing data to be transferred to the device without passing through the CPU. Substituting the CPU’s data transfer tasks with DMA reduces latency and enhances the system’s overall efficiency and performance.
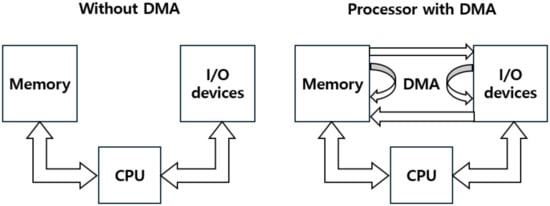
Figure 7.
(Left) Data flow before applying DMA. (Right) Data flow after applying DMA.
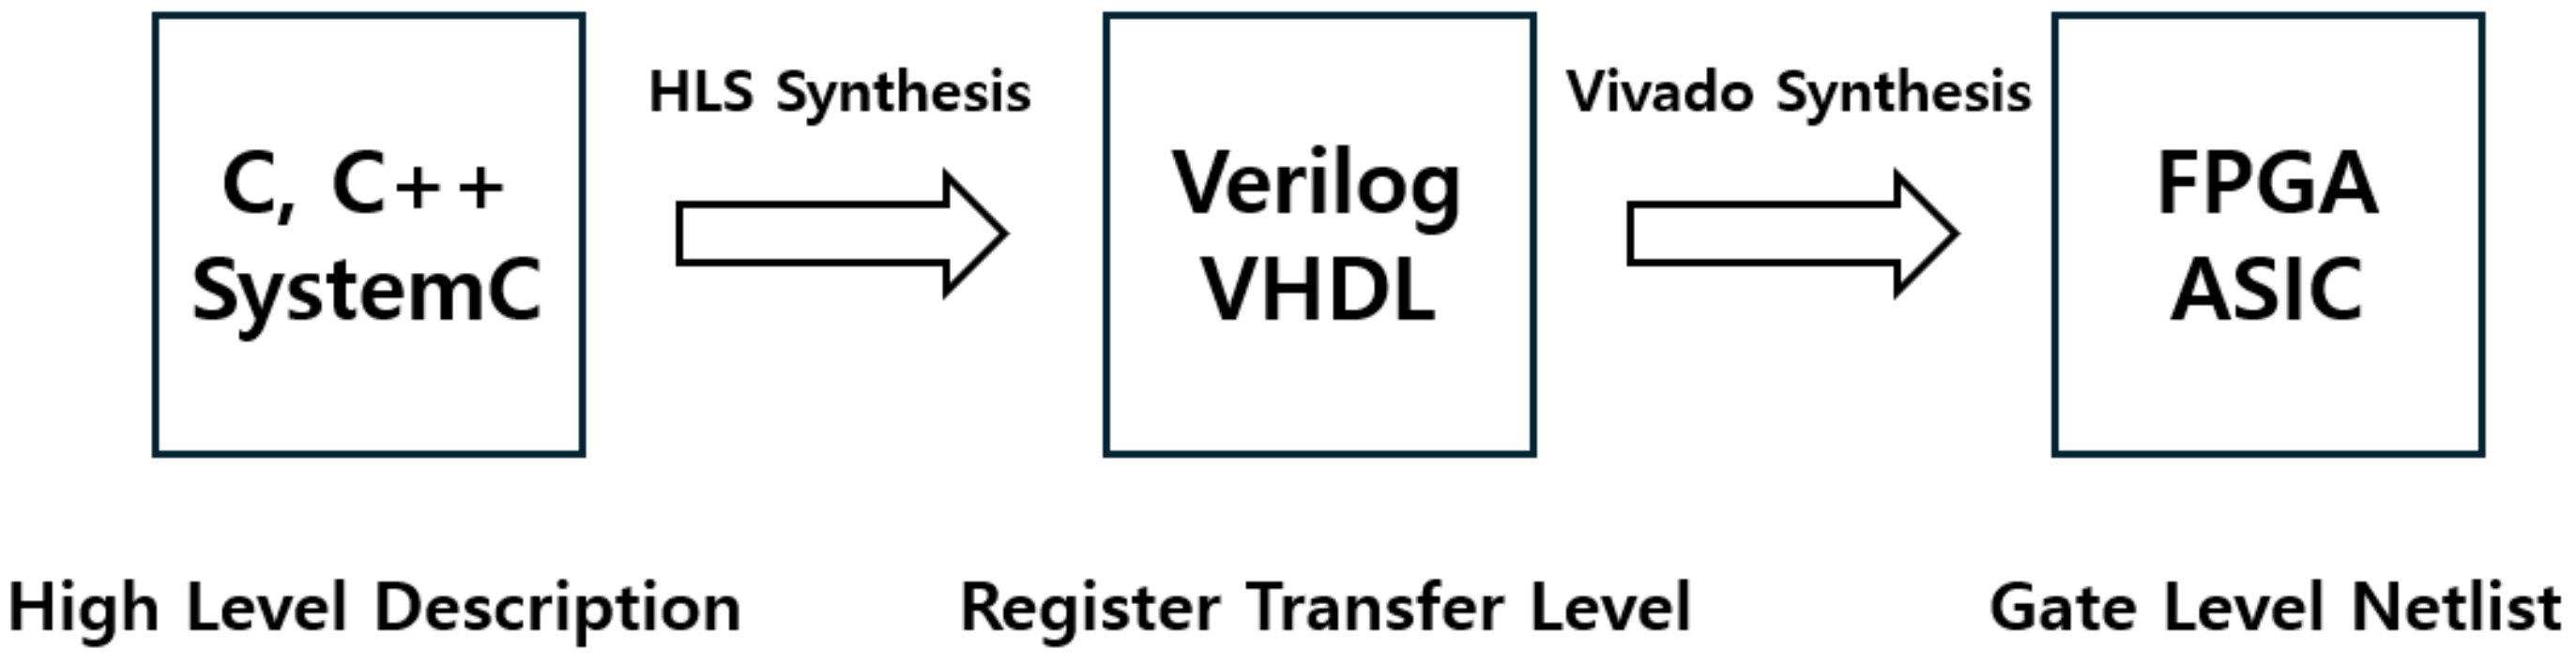
The 3D shape measurement algorithm in the PL area was implemented in hardware using the high-level synthesis (HLS) technique. Pipelining allowed parallel processing for computing each pixel, thereby accelerating the computation speed. HLS is a technology that converts algorithms written in high-level programming languages such as C, C++, or SystemC into hardware description languages like Verilog or VHDL. Figure 8 illustrates converting an algorithm written in a high-level programming language into a hardware description language to run on hardware platforms like FPGA or ASIC. Using HLS, the conversion from High Level Description to Register Transfer Level (RTL) allows for rapid prototyping and iterative design. Additionally, the generated RTL code can be verified through Co-Simulation, which ensures that the RTL conversion is performed correctly. Co-Simulation validates the consistency and correctness of the design by comparing the C/C++ model extracted during the HLS phase with the final RTL code.
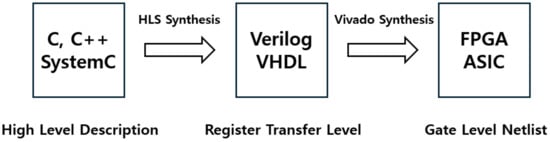
Figure 8.
Algorithm conversion flowchart.
4. SoC-Type FPGA-Based 3D Shape Measurement System
4.1. Design of the SoC-Type FPGA-Based 3D Shape Measurement System
The SoC-type FPGA ZCU102 board allows for the integrated design of hardware and software and can install a Linux-based operating system by inserting an FPGA-specific boot image into an SD card. This study employed the Xilinx Certified Ubuntu 20.04 LTS version of the operating system, which supports operations on the ZCU102 board. Xilinx Certified Ubuntu integrates the operating system with the hardware platform, enabling control of the hardware platform within the operating system. We created a hardware platform based on the 3D shape measurement algorithm accelerator and constructed a Platform Assets Container (PAC) to combine the hardware platform with the operating system. The projector and camera modules are controlled via the operating system, and image data are designed to be stored on the SD card.
Figure 9 shows the operational flowchart of the SoC-type FPGA-based 3D shape measurement system. When the operating system installed on the SoC-type FPGA sends an operational control command to the projector, it projects the fringe pattern onto the object, which is then captured by the camera module with the image data stored on the SD card. The image data stored on the SD card are transferred from the PS area to the PL area via DMA. Once the 3D shape measurement algorithm completes its operation, the measurement results are sent back from the PL area to the PS area through DMA.

Figure 9.
Operational flowchart of the SoC-type FPGA-based 3D shape measurement system.
4.2. Structure of the SoC-Type FPGA-Based 3D Shape Measurement System
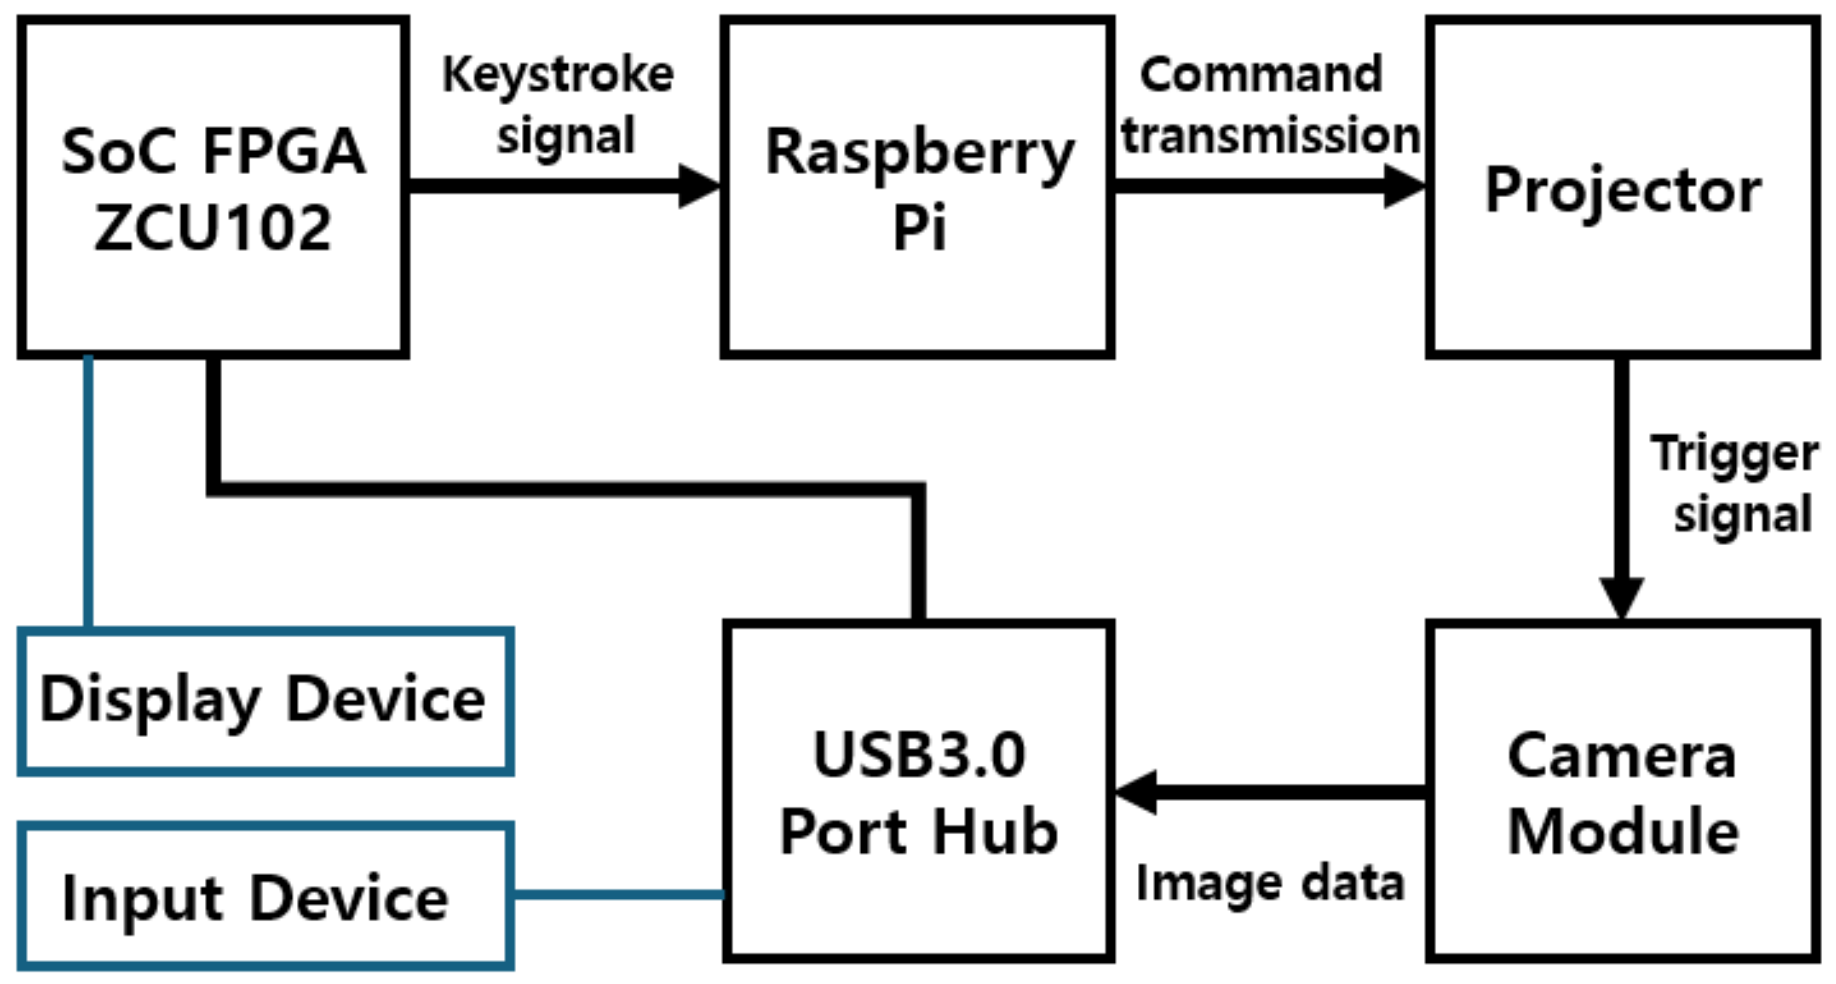
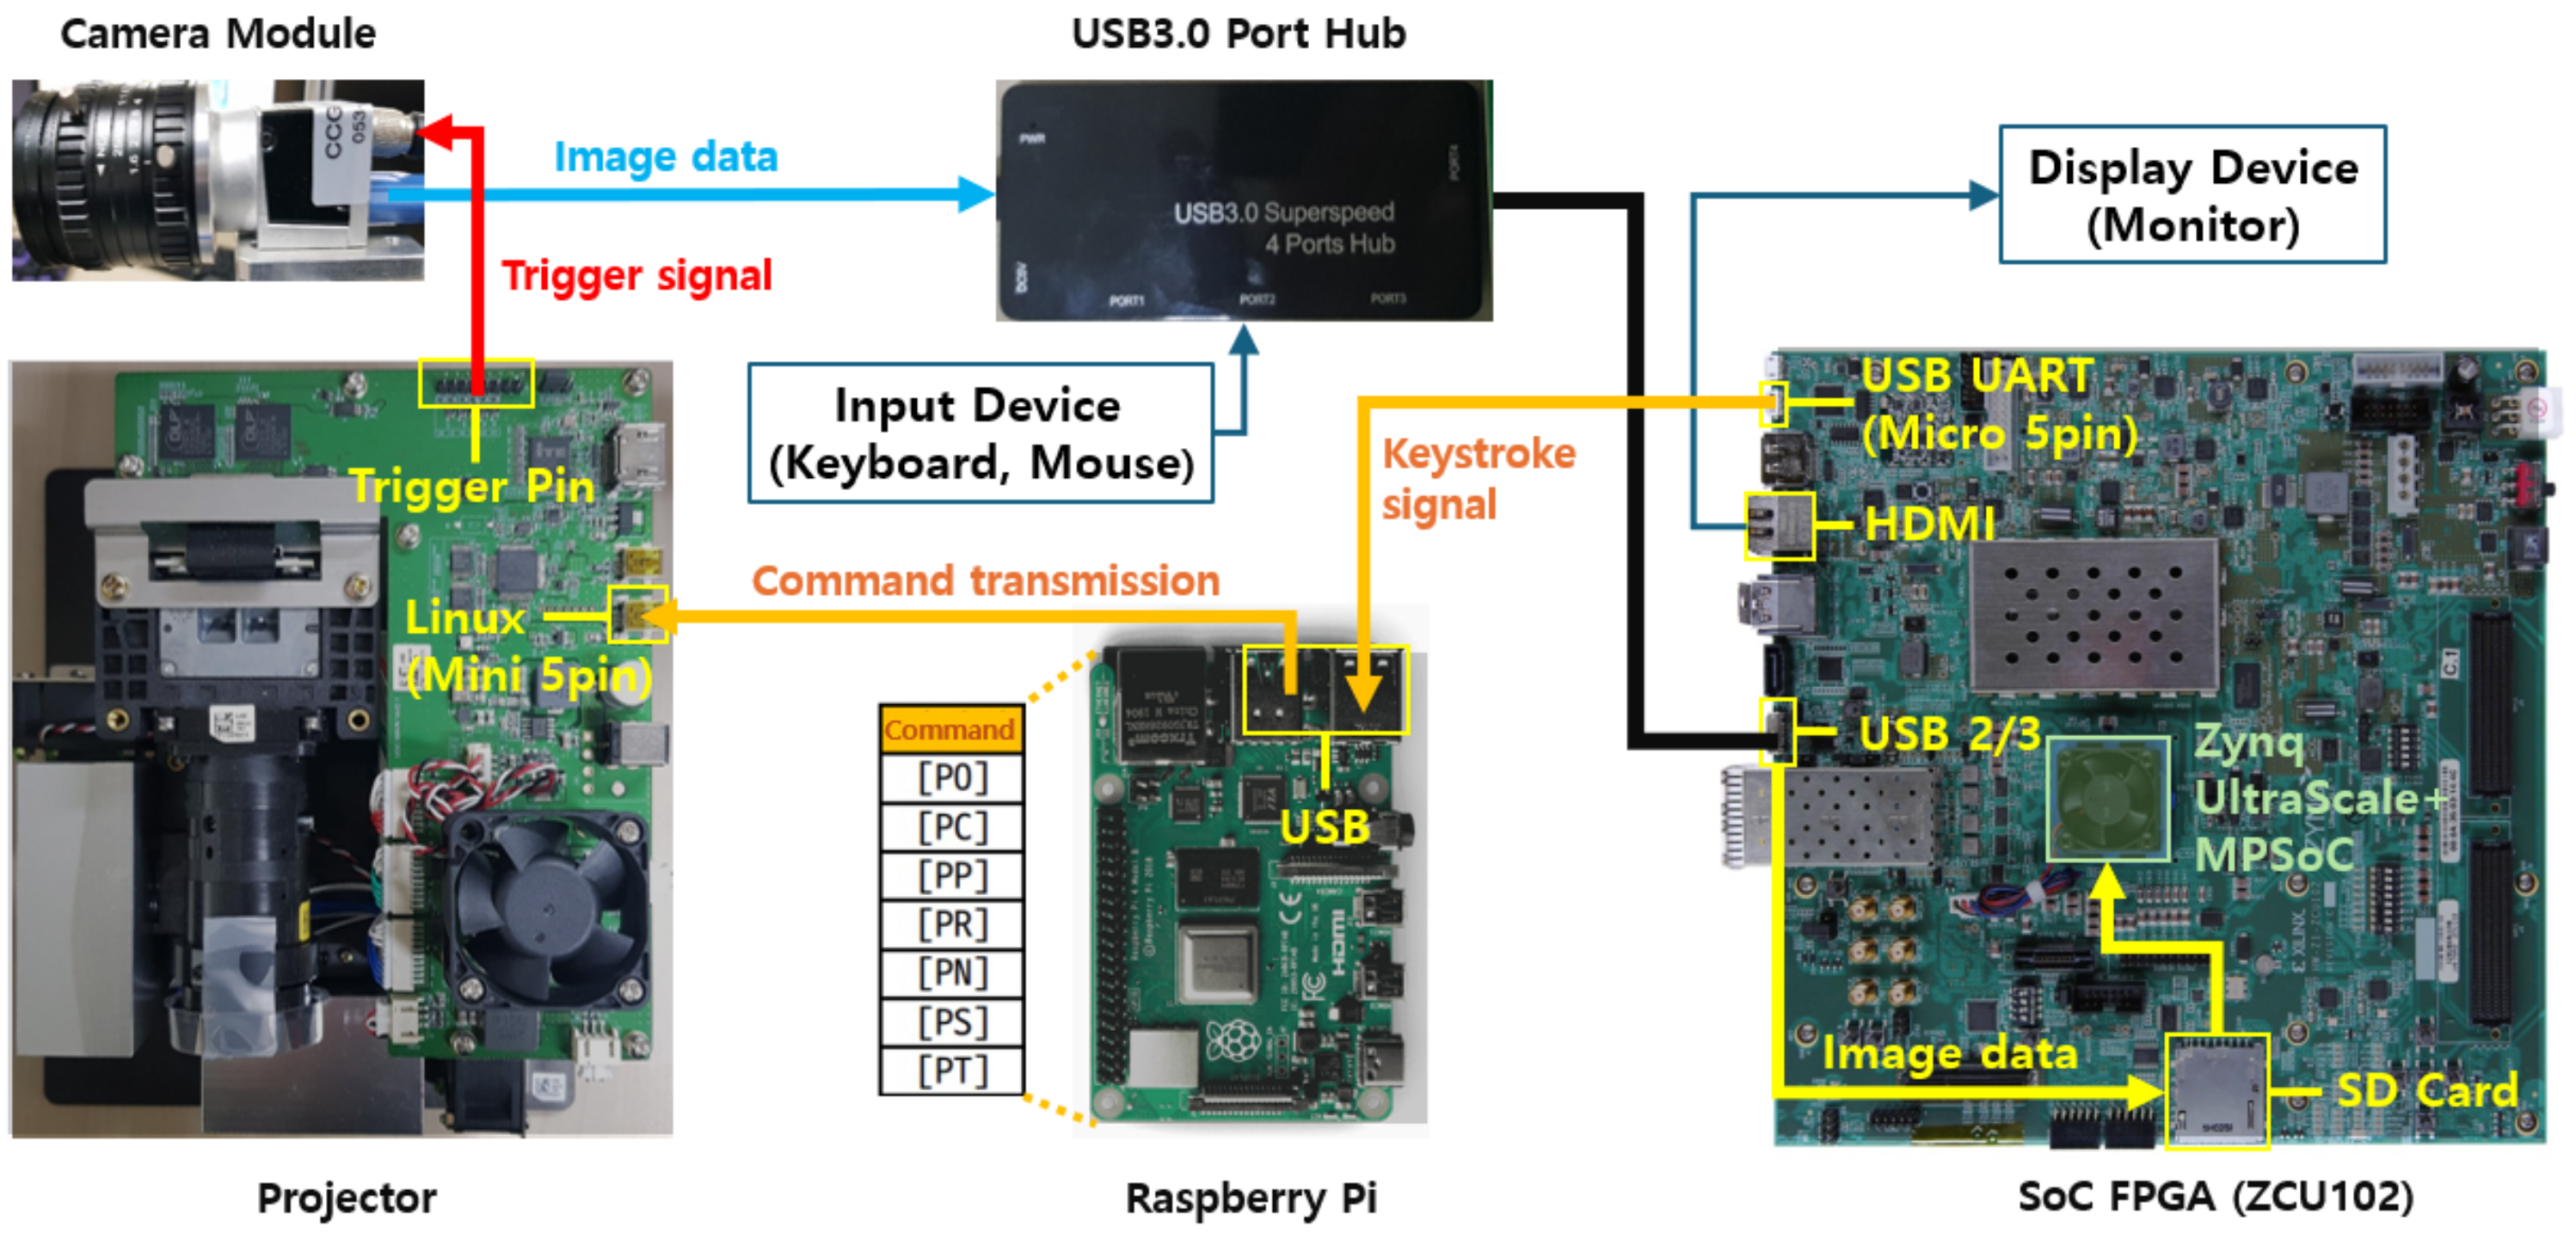
Figure 10 and Figure 11 show the flowchart and detailed structure of the SoC-type FPGA-based 3D shape measurement system. The system comprises a ZCU102 board, a Raspberry Pi, a projector, and a camera module. The input devices are connected to a USB hub and a display device is connected to the HDMI port for system control and monitoring.
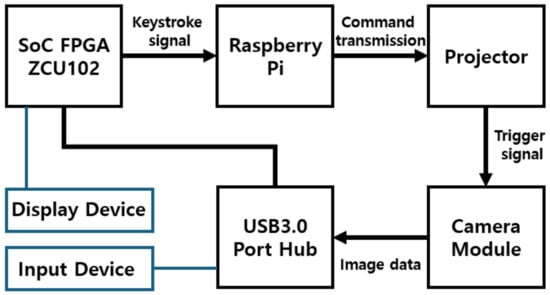
Figure 10.
Flowchart of the SoC-type FPGA-based 3D shape measurement system.
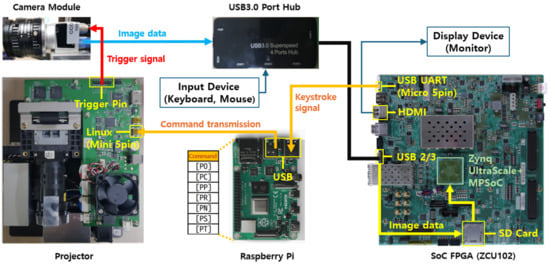
Figure 11.
Structure of the SoC-type FPGA-based 3D shape measurement system.
The Raspberry Pi is used to facilitate the connection between the ZCU102 board and the projector and to transmit keyboard input signals. The USB UART port of the ZCU102 board acts as a slave device, as does the Mini 5-pin port of the projector. Since direct connection between the slave devices (the ZCU102 board and the projector) is not supported, a master device, the Raspberry Pi, is used to connect them in a slave–master–slave configuration. When a button on the input device connected to the ZCU102 board via the USB hub is pressed, the input signal is transmitted to the Raspberry Pi through the USB UART port of the ZCU102 board. The Raspberry Pi then converts the received input signal into a predefined pattern-control command and sends it to the projector, which performs the corresponding action.
The projector and the camera module are connected through trigger pins. When the projector receives a command to project a fringe pattern, it simultaneously sends a trigger signal to the camera module through the trigger pin. The camera module captures images in response to the trigger signal, acquiring image data. The image data acquired by the camera module are transferred to the FPGA via the USB port and stored on the SD card. This process can be monitored in real-time using a display device connected to the HDMI port of the ZCU102 board.
The projector can be pre-configured with patterns and executes them via pattern-control commands to project patterns at desired timings. The projector’s pattern-control commands comprise four bytes and two ASCII characters, including square brackets and case-sensitive letters. To allow for simple control of the projector using button inputs, the Raspberry Pi is designed to detect key inputs from the ZCU102 board, convert them into the corresponding commands, and send them to the projector.
The numeric pad keys 1 to 7 are each assigned a specific command. Table 1 shows the transmitted commands and the corresponding projector actions for each key input.

Table 1.
Projector pattern-control commands and actions.
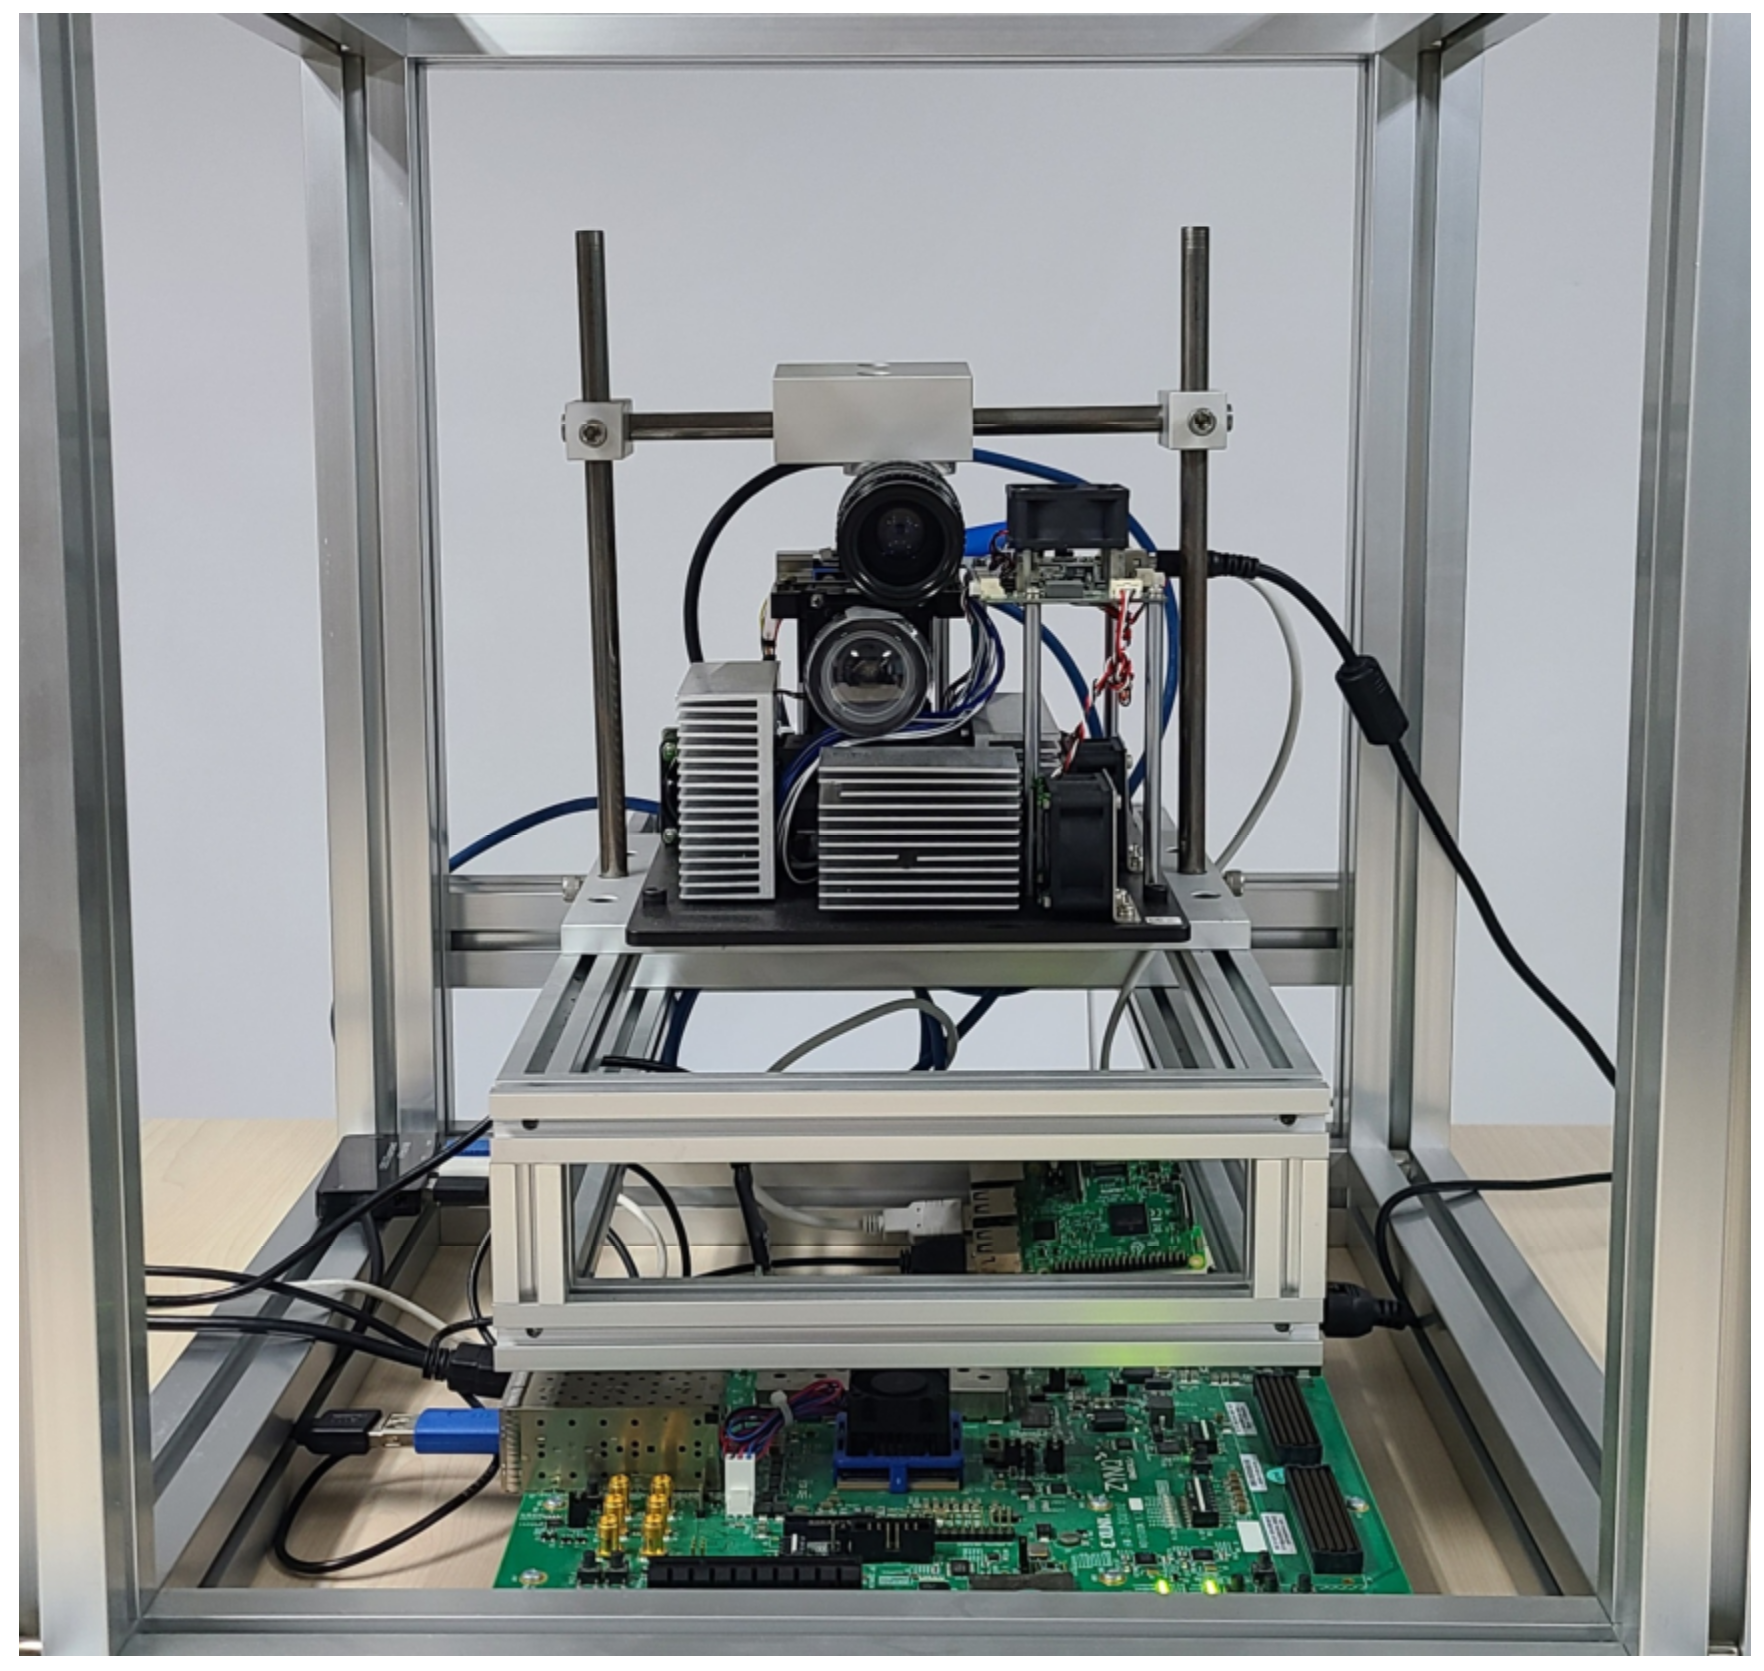
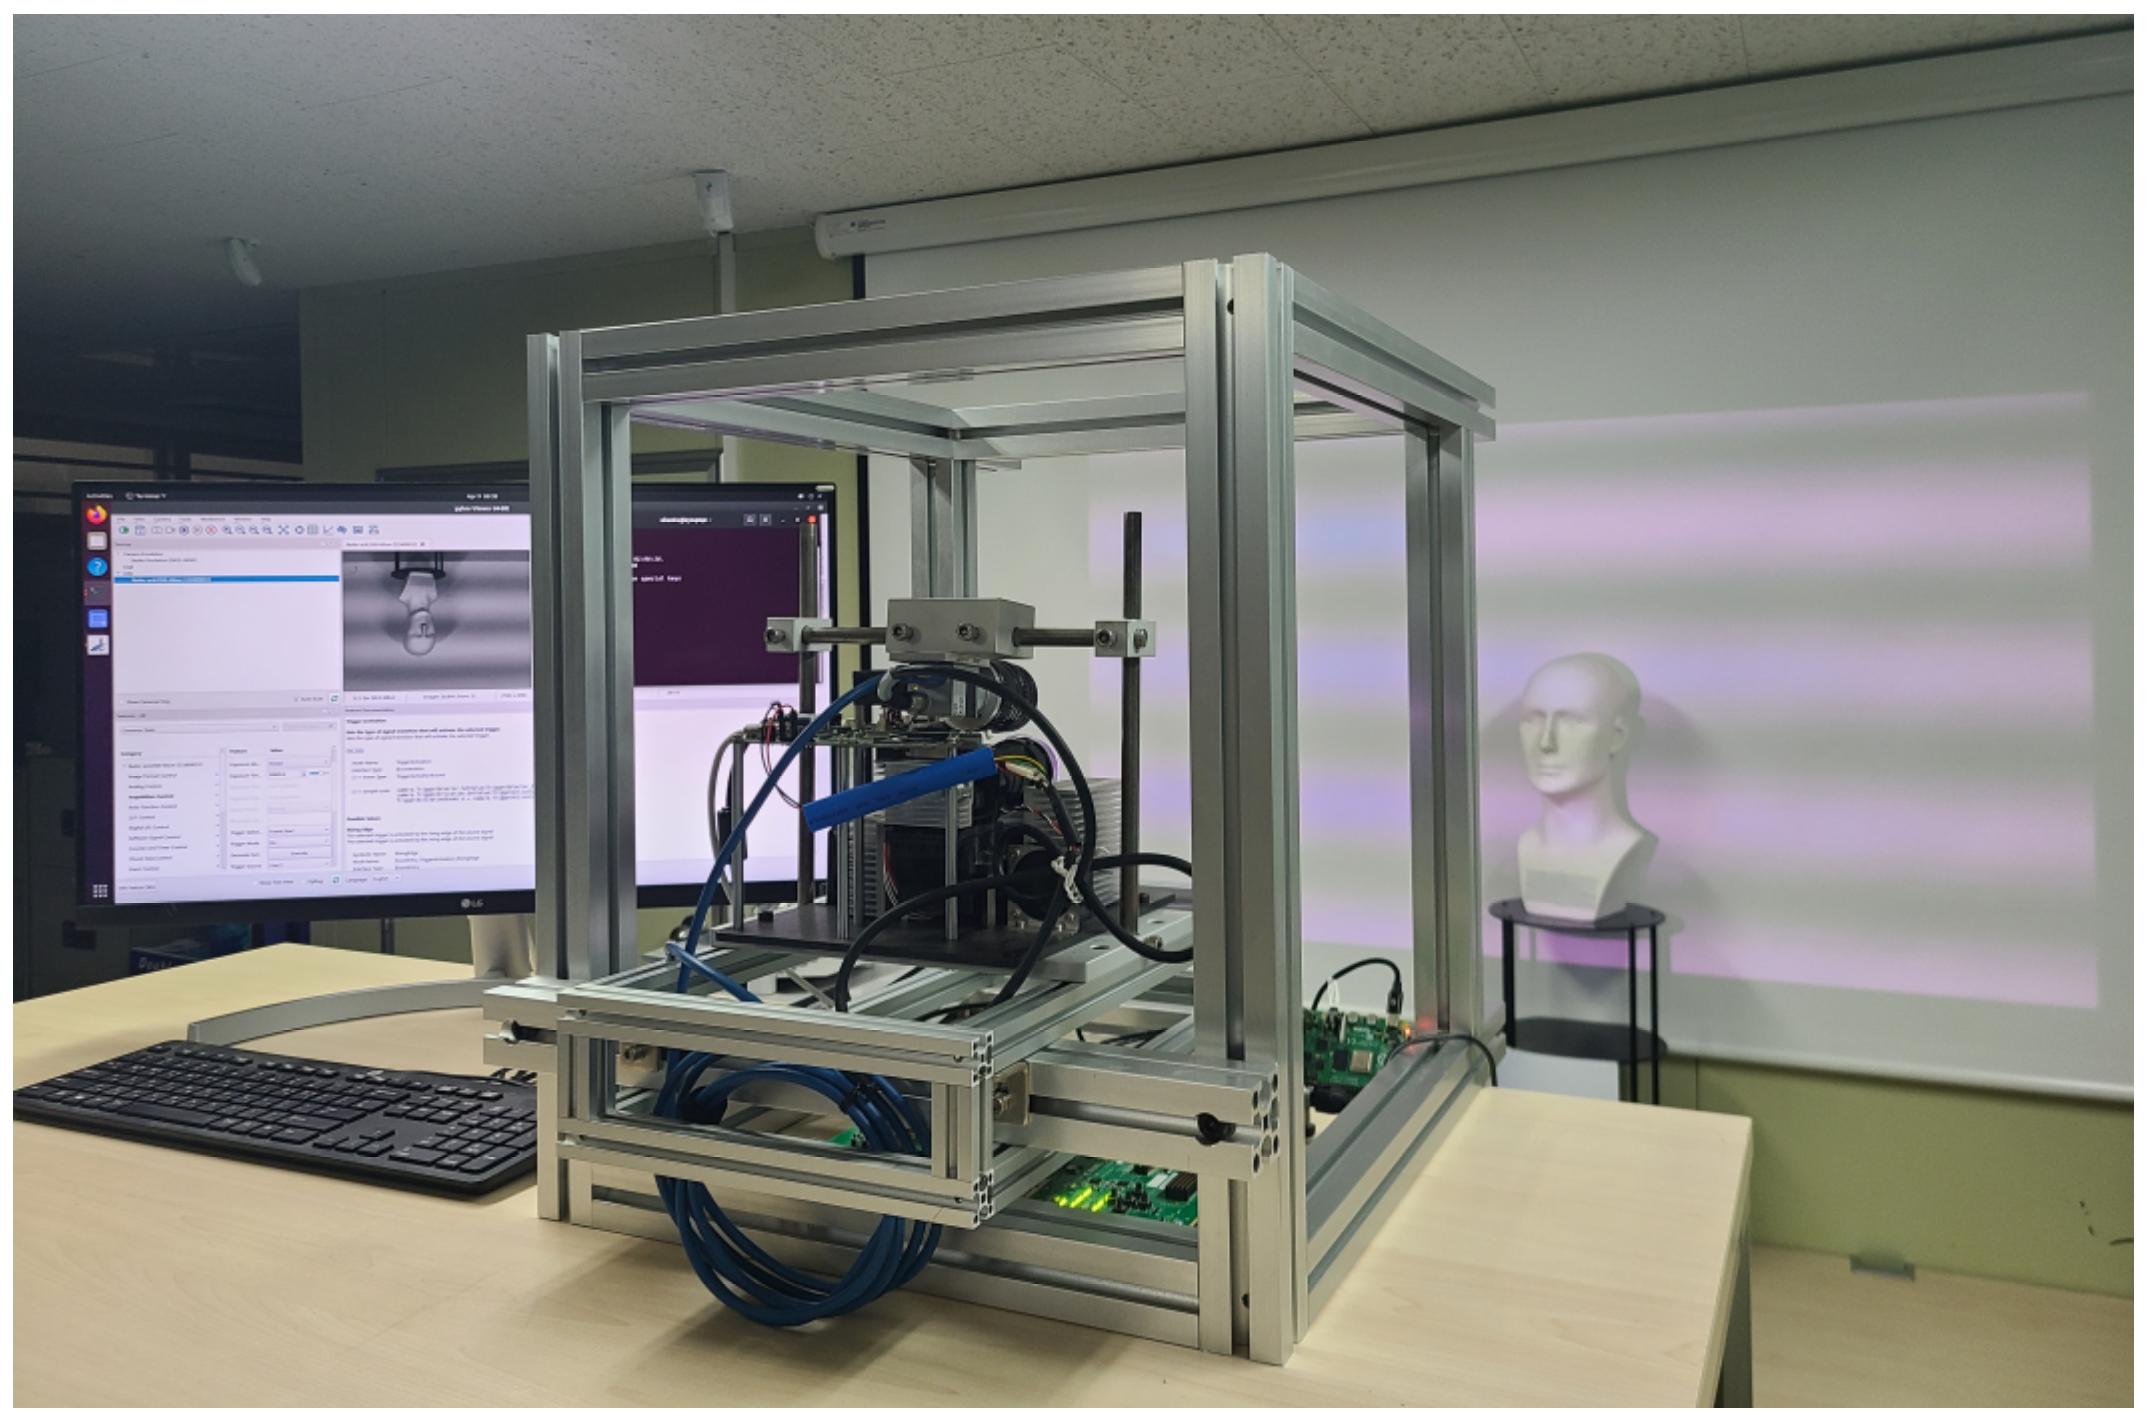
Figure 12 shows the SoC-type FPGA-based 3D shape measurement system implemented in this study. The system is constructed with a rectangular external frame, and the internal frame securely holds the projector and camera module, allowing for installation in all horizontal and vertical directions.

Figure 12.
SoC-type FPGA-based 3D shape measurement system.
5. Experiments
5.1. Experimental Environment and Methods
Figure 13 shows the test environment for the SoC-type FPGA-based 3D shape measurement system. The system operates on the Xilinx Certified Ubuntu 20.04 LTS operating system installed on the ZCU102 board. The test environment for the 3D shape measurement algorithm was set up using Xilinx Vitis. The test utilizes eight images of 2592 × 2048 pixels. The SoC-type FPGA-based 3D shape measurement system calculates the coordinates for each pixel in the image data and outputs the inferred X, Y, and Z 3D coordinates for the entire 2592 × 2048-pixel image. The system’s operation and the computed results are controlled and verified through UART communication via a terminal.
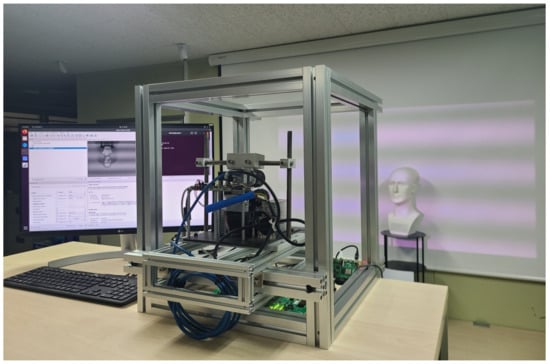
Figure 13.
Test environment for the SoC-type FPGA-based 3D shape measurement system.
The camera module used is the BASLER acA2500-60um, which can capture images up to 2592 × 2048 pixels in size at 60 fps. The projector used is the Texas Instruments DLP4710EVM-LC, which can project images at a resolution of 1920 × 1080 pixels with a maximum brightness of 1800 lumens and a frame rate of up to 120 fps.
5.2. Experimental Results and Performance Evaluation
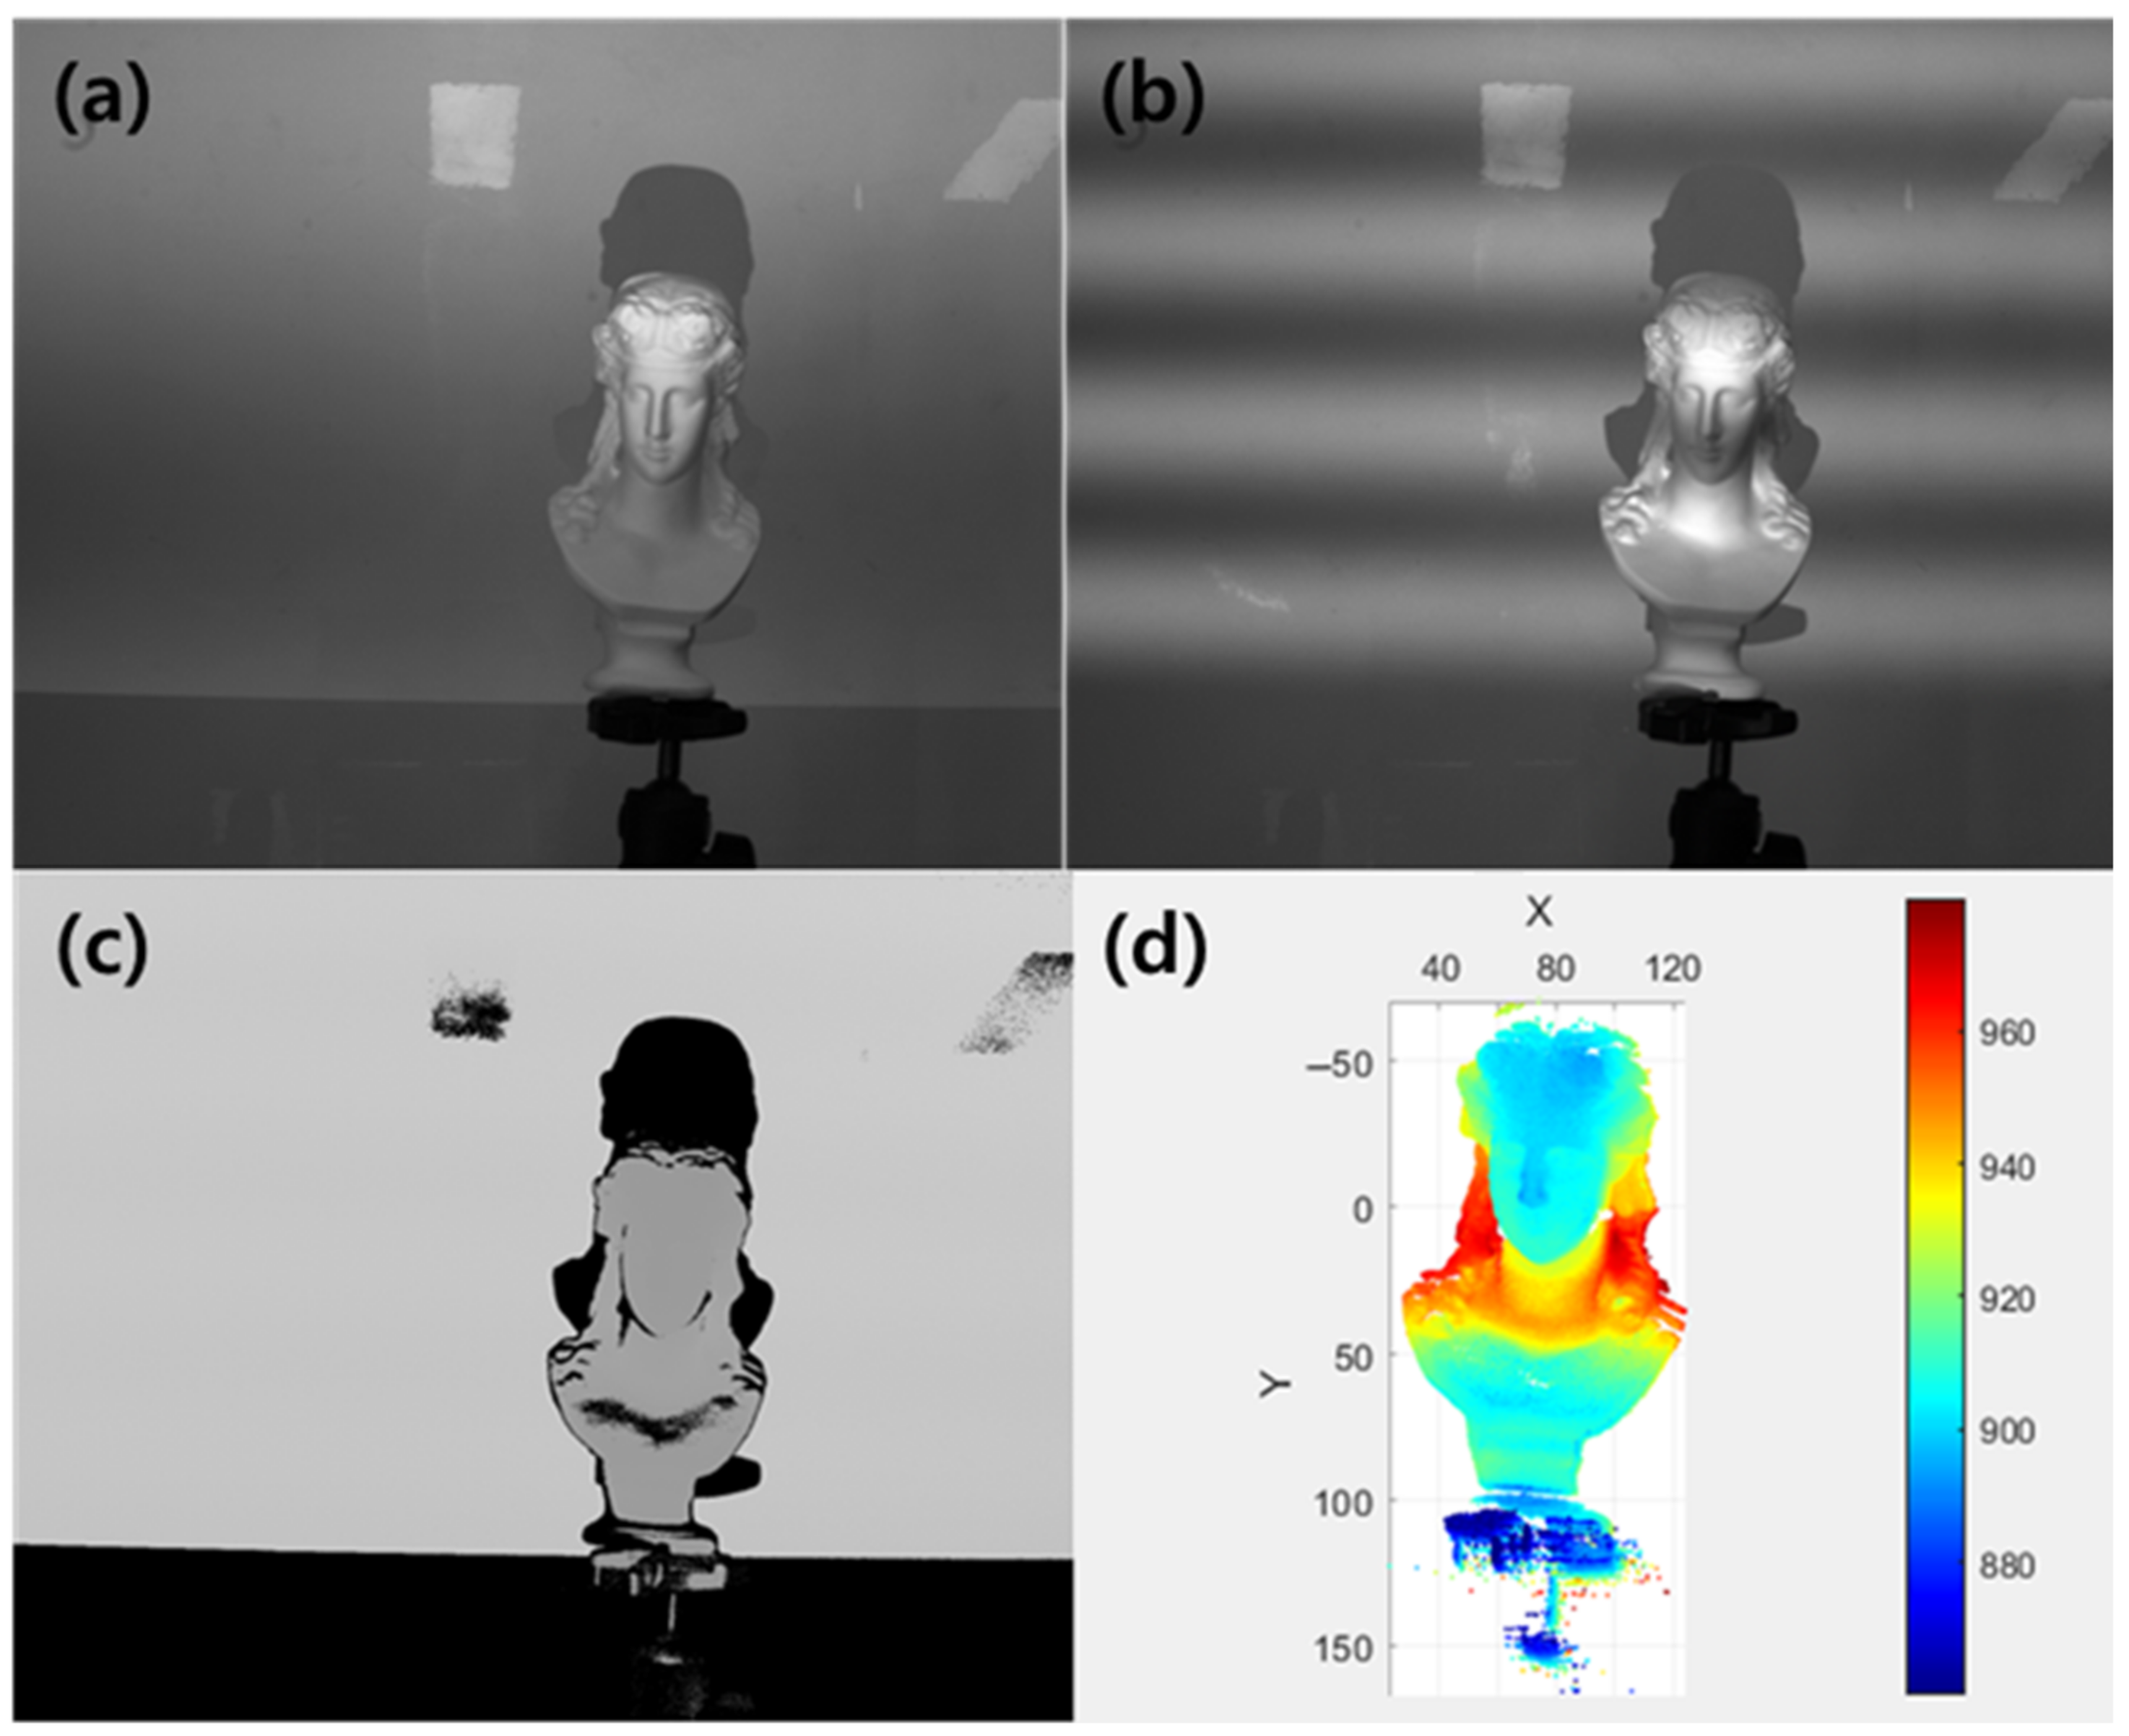
Figure 14 illustrates the results of the 3D shape measurement process implemented in this study. (a) and (b) show the deformed fringe patterns projected onto the object, while (c) represents the absolute phase map calculated using the process described in Section 2.2 of this paper. (d) displays the depth map of the object’s region in the overall 3D point cloud. This demonstrates that the 3D shape measurement of the object was successfully performed using high-resolution images.

Figure 14.
(a,b) Deformed fringe patterns, (c) absolute phase map, (d) 3D point cloud depth map.
The results of running the 3D shape measurement algorithm on both the PC-based system and the SoC-type FPGA-based system were compared. This confirmed that the 3D coordinate data for each pixel and the 3D shape model represented on a 3D graph were identical.
Subsequently, the computation times for the 3D shape measurement algorithm on the PC-based system and the SoC-type FPGA-based system were compared to verify the acceleration results. The ZCU102 board in the SoC-type FPGA-based system operated at a clock frequency of 99 MHz. The CPU models and specifications embedded in the PC-based system and the ZCU102 board of the SoC-type FPGA-based system are shown in Table 2. Additionally, the software configurations and versions of each system are shown in Table 3. The hardware resource usage required to implement the 3D shape measurement algorithm accelerator on the FPGA is shown in Table 4.
Table 2.
CPU specifications of the PC and FPGA systems.
Table 3.
Software and versions used in the PC and FPGA systems.
Table 4.
Hardware resource usage of the FPGA system.
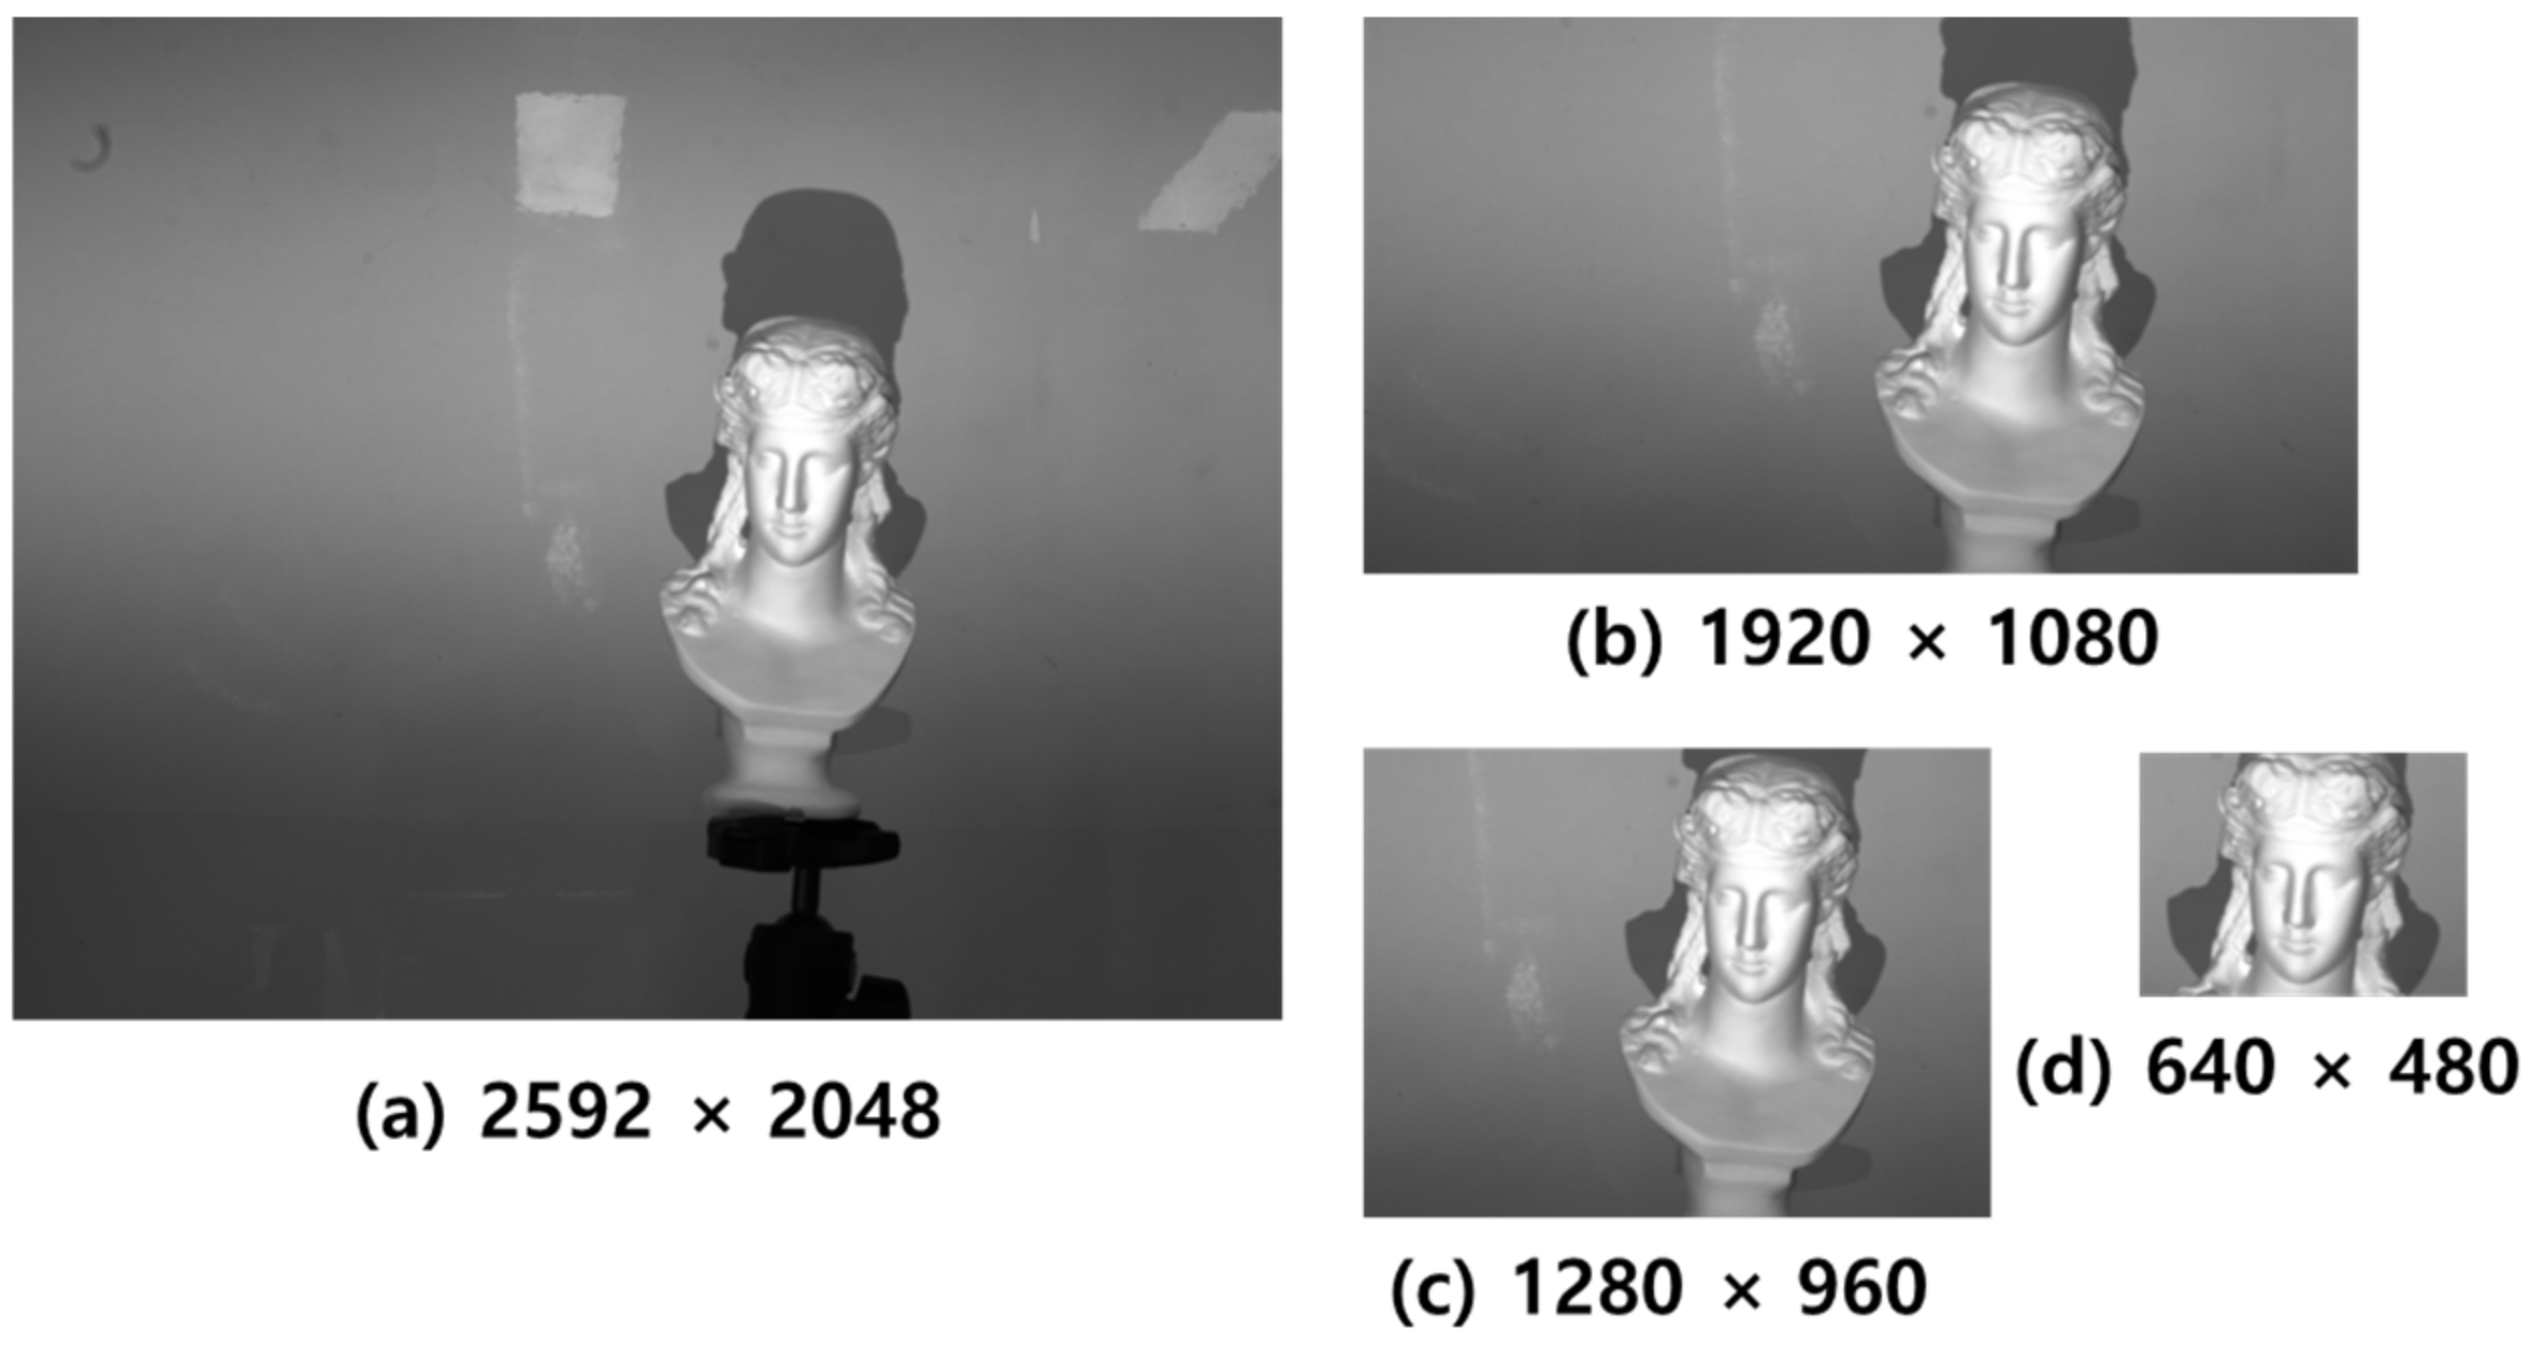
Table 5 shows the computation times for the 3D shape measurement algorithm on both the PC-based system and the SoC-type FPGA-based system. Figure 15 illustrates the images at different resolutions used in Table 5. To evaluate the acceleration based on the resolution and the proportion of the object within the image, images of various sizes were used for testing. For the SoC-type FPGA-based system, the computation time includes the process of transmitting image data from the PS area to the PL area, completing the 3D shape measurement in the PL area, and then inputting the measurement results back into the PS area. For the original image (a), the computation time on the PC-based system was 2622 ms, while on the SoC-type FPGA-based system, it was 227 ms. This indicates that the computation speed of the 3D shape measurement algorithm was accelerated by approximately 11.55 times. Additionally, for the smallest image, the computation time on the PC-based system was 203 ms, while on the SoC-type FPGA-based system, it was 13.2 ms, indicating that the computation speed of the 3D shape measurement algorithm could be accelerated by up to approximately 15.38 times.
Table 5.
Computation times of the 3D shape measurement algorithm.
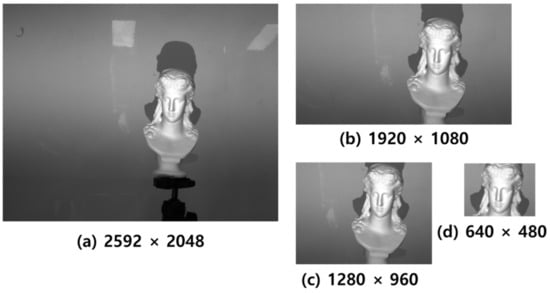
Figure 15.
Resolution variations for speed comparison between the PC-based system and the SoC-type FPGA system.
6. Conclusions
6.1. Summary of Major Findings
Phase measuring profilometry (PMP) is widely preferred for 3D shape measurement due to its robustness against external lighting changes and its high-precision results. However, PMP suffers from long computation times due to complex calculations and high memory usage. It also faces a 2π ambiguity issue, limiting its measurement range. While dual-wavelength methods can resolve this, they significantly increase computation time and data processing volume.
The study addressed these computational challenges by implementing a 3D shape measurement system on a SoC-type FPGA. We developed a 3D shape measurement algorithm based on dual-wavelength PMP and accelerated it through hardware implementation using high-level synthesis (HLS). By using HLS for pipelining, we enabled the parallel processing of pixel computations, significantly accelerating the calculations. We also minimized data transfer latency by using Direct Memory Access (DMA).
The complete system comprises a ZCU102 board, Raspberry Pi, projector, and camera module, with input devices connected via a USB hub and a display device connected to the HDMI port for system control and monitoring. The software system, built on a Linux-based operating system running on the SoC-type FPGA, integrates the FPGA’s hardware capabilities with the software components to create the SoC-type FPGA-based 3D shape measurement system.
The experimental results demonstrate that the SoC-type FPGA-based 3D shape measurement system accurately captures the 3D shape information of objects. Furthermore, the SoC-type FPGA-based system achieved computation speeds approximately 11.55 times higher than those of traditional PC-based systems. These results indicate that our proposed system offers an effective solution for real-time 3D shape measurement, potentially benefiting applications in fields such as quality control, robotics, and computer vision.
6.2. Limitations and Future Work
Despite the promising results, the proposed design has certain limitations. One notable limitation is that the current implementation does not account for commercialization costs, as the development board used in this study is a research-oriented platform. This could impact the feasibility of the system in commercial applications where cost-efficiency is a critical factor.
Future work could involve further refining the system’s design to enhance its performance and reliability in diverse application environments. Additionally, expanding the scope of testing to include various real-world scenarios will be essential in ensuring the system’s robustness and adaptability. As the technology progresses, integrating advanced features such as automated calibration and improved data processing algorithms could further enhance the system’s practical utility.
By addressing these areas, future research can build upon the foundation laid by this study, further advancing the field of real-time 3D shape measurement technologies and broadening its range of potential applications.
Author Contributions
Conceptualization, T.-H.K. and H.L.; methodology, T.-H.K. and S.-H.O.; software, H.L.; validation, T.-H.K. and H.L.; formal analysis, H.L.; investigation, T.-H.K. and H.L.; resources, H.L. and S.-H.O.; data curation, T.-H.K. and H.L.; writing—original draft preparation, T.-H.K. and S.-H.O.; writing—review and editing, T.-H.K. and S.-H.O.; visualization, T.-H.K.; supervision, S.-H.O.; project administration, S.-H.O.; funding acquisition, S.-H.O. All authors have read and agreed to the published version of the manuscript.
Funding
This work was partly supported by the Innovative Human Resource Development for Local Intellectualization program through the Institute of Information & Communications Technology Planning & Evaluation (IITP) grant funded by the Korean Government (MSIT) (IITP-2024-2020-0-01791, 50%). This research was supported by the BB21plus funded by Busan Metropolitan City and Busan Techno Park (50%).
Data Availability Statement
The experimental data used in this study, including the images and 3D measurement results, are available from the corresponding author upon request.
Acknowledgments
The EDA tool was supported by the IC Design Education Center (IDEC), Korea.
Conflicts of Interest
The authors declare no conflicts of interest.
References
- Kim, G.-S.; Park, Y.-C. A Study on the Compensation of Thermal Errors for Phase Measuring Profilometry. JKAIS 2019, 20, 598–603. [Google Scholar]
- Kim, C.-H.; Ha, M.-H.; Yun, S.-C.; Park, T.-H. AI-based Restoration Reflection Region Method for 3D Automatic Optical Inspection. ICROS 2023, 29, 936–944. [Google Scholar] [CrossRef]
- Buytaert, J.A.N.; Aernouts, J.E.F.; Dirckx, J.J.J. Indentation measurements on the eardrum with automated projection moiré profilometry. Opt. Lasers Eng. 2009, 47, 301–309. [Google Scholar] [CrossRef]
- Chang, W.-Y.; Hsu, F.-H.; Chen, K.-H.; Chen, J.-H.; Hsu, K.Y. Heterodyne moiré surface profilometry. Opt. Express 2014, 22, 2845–2852. [Google Scholar] [CrossRef] [PubMed]
- Su, L.; Su, X.; Li, W.; Xiang, L. Application of modulation measurement profilometry to objects with surface holes. Appl. Opt. 1999, 38, 1153–1158. [Google Scholar] [CrossRef] [PubMed]
- Li, C.; Cao, Y.; Chen, C.; Wan, Y.; Fu, G.; Wang, Y. Computer-generated Moiré profilometry. Opt. Express 2017, 25, 26815–26824. [Google Scholar] [CrossRef] [PubMed]
- Zhang, H.; Cao, Y.; Li, H.; An, H.; Wu, H. Spatial computer-generated Moiré profilometry. Sens. Actuators A Phys. 2024, 367, 115054. [Google Scholar] [CrossRef]
- Wei, Z.; Cao, Y.; Wu, H.; Xu, C.; Ruan, G.; Wu, F.; Li, C. Dynamic phase-differencing profilometry with number-theoretical phase unwrapping and interleaved projection. Opt. Express 2024, 32, 527192. [Google Scholar] [CrossRef] [PubMed]
- Takeda, M.; Ina, H.; Kobayashi, S. Fourier-Transform method of fringe pattern analysis for computed-based topography and interferometry. J. Opt. Soc. Am. A 1982, 72, 156–160. [Google Scholar] [CrossRef]
- Srinivasan, V.; Liu, H.C.; Halioua, M. Automated phase-measuring profilometry of 3-D diffuse objects. Appl. Opt. 1984, 23, 3105–3108. [Google Scholar] [CrossRef]
- Koo, J.-M.; Cho, T.-H. 3-D Measurement of LED Packages Using Phase Measurement Profilometry. J. Semicond. Disp. Technol. 2011, 10, 17–22. [Google Scholar]
- Kim, H.J.; Kim, J.S.; Joo, H. 3-Dimensional Shape Measurement System for BGA Balls Using PMP Method. J. Inst. Control Robot. Syst. 2016, 22, 59–65. [Google Scholar] [CrossRef]
- Koo, J.-M.; Cho, T.-H. A 3D measurement system based on a double frequency method using Fourier transform profilometry. J. Korea Inst. Inf. Commun. Eng. 2015, 19, 1485–1492. [Google Scholar]
- Chen, K.; Xi, J.; Yu, Y. Quality-guided spatial phase unwrapping algorithm for fast three-dimensional measurement. Opt. Commun. 2013, 294, 139–147. [Google Scholar] [CrossRef]
- Ghiglia, D.C.; Pritt, M.D. Two-Dimensional Phase Unwrapping: Theory, Algorithms, and Software; Wiley-Interscience: New York, NY, USA, 1998. [Google Scholar]
- Xu, C.; Cao, Y.; Wu, H.; Li, H.; Zhang, H.; An, H. Curtain-type phase unwrapping algorithm. Opt. Eng. 2022, 61, 044103. [Google Scholar] [CrossRef]
- Wu, Z.; Guo, W.; Zhang, Q. High-speed three-dimensional shape measurement based on shifting Gray-code light. Opt. Express 2019, 27, 22631–22644. [Google Scholar] [CrossRef] [PubMed]
- Zhao, H.; Chen, W.; Tan, Y. Phase-unwrapping algorithm for the measurement of three-dimensional object shapes. Appl. Opt. 1994, 33, 4497–4500. [Google Scholar] [CrossRef]
- Zheng, D.; Da, F. Phase coding method for absolute phase retrieval with a large number of codewords. Opt. Express 2012, 20, 24139–24150. [Google Scholar] [CrossRef]
- An, H.; Cao, Y.; Li, H.; Zhang, H. Temporal Phase Unwrapping Based on Unequal Phase-Shifting Code. IEEE Trans. Image Process. 2023, 32, 1432–1441. [Google Scholar] [CrossRef] [PubMed]
- Wang, J.; Cao, Y.; Wu, H.; Wei, Z. Absolute phase retrieval based on fringe amplitude encoding without any additional auxiliary pattern. Opt. Express 2023, 31, 41952–41966. [Google Scholar] [CrossRef]
- Zhang, Z.S.; Royer, D.; Yau, S.-T. GPU-assisted high-resolution, real-time 3-D shape measurement. Opt. Express 2006, 14, 9120–9129. [Google Scholar] [CrossRef]
- Nguyen, H.; Nguyen, D.; Wang, Z.; Kieu, H.; Le, M. Real-time, high-accuracy 3D imaging and shape measurement. Appl. Opt. 2015, 54, A9–A17. [Google Scholar] [CrossRef] [PubMed]
- Kim, T.-H.; Lee, H.; Ok, S.-H. Acceleration of FPGA-based 3D Shape Measurement Algorithm. In Proceedings of the Summer Annual Conference of IEIE, Jeju, Republic of Korea, 26–28 June 2024. [Google Scholar]
- Agrawal, R.; de Castro, L.; Yang, G.; Juvekar, C.; Yazicigil, R.; Chandrakasan, A.; Vaikuntanathan, V.; Joshi, A. FAB: An FPGA-based Accelerator for Bootstrappable Fully Homomorphic Encryption. In Proceedings of the 2023 IEEE International Symposium on High-Performance Computer Architecture (HPCA), Montreal, QC, Canada, 25 February–1 March 2023. [Google Scholar]
- Zhai, J.; Li, B.; Lv, S.; Zhou, Q. FPGA-Based Vehicle Detection and Tracking Accelerator. Sensors 2023, 23, 2208. [Google Scholar] [CrossRef] [PubMed]
- Guo, Z.; Liu, K.; Liu, W.; Sun, X.; Ding, C.; Li, S. An Overlay Accelerator of DeepLab CNN for Spacecraft Image Segmentation on FPGA. Remote Sens. 2024, 16, 89. [Google Scholar] [CrossRef]
- George, A.D.; Wilson, C.M. Onboard processing with hybrid and reconfigurable computing on small satellites. Proc. IEEE 2018, 106, 458–470. [Google Scholar] [CrossRef]
- Wang, Z.; Du, H.; Bi, H. Out-of-plane shape determination in generalized fringe projection profilometry. Opt. Express 2006, 14, 12122–12133. [Google Scholar] [CrossRef]
- Yen, H.; Tsai, D.; Yang, J. Full-Field 3-D Measurement of Solder Pastes Using LCD-Based Phase Shifting Techniques. IEEE Trans. Electron. Packag. Manuf. 2006, 29, 50–57. [Google Scholar] [CrossRef]
- Lee, H.-K. Development of a Novel 3D Sensor System by Fusing PMP and Stereo Vision. Ph.D. Dissertation, Korea Advanced Institute of Science and Technology (KAIST), Daejeon, Korea, 2010. [Google Scholar]


Disclaimer/Publisher’s Note: The statements, opinions and data contained in all publications are solely those of the individual author(s) and contributor(s) and not of MDPI and/or the editor(s). MDPI and/or the editor(s) disclaim responsibility for any injury to people or property resulting from any ideas, methods, instructions or products referred to in the content. |
© 2024 by the authors. Licensee MDPI, Basel, Switzerland. This article is an open access article distributed under the terms and conditions of the Creative Commons Attribution (CC BY) license (https://creativecommons.org/licenses/by/4.0/).