New Evidence on the Influence of Coloured Lighting on Students’ Cognitive Processes
Abstract
1. Introduction
2. Materials and Methods
2.1. Statement of the Problem, Objectives, Questions and Hypotheses
- GO1. To investigate how different configurations of coloured lighting improve specific cognitive processes in primary school students.
- GO2. To assess the effect of “dynamic colour” on students’ cognitive processes in primary school classrooms.
- RQ1. Which configurations of coloured lighting enhance figurative creativity among primary school students in classroom environments?
- RQ2. Which configurations of coloured lighting enhance net attention among primary school students in classroom environments?
- RQ3. Which configurations of coloured lighting enhance impulsivity control among primary school students in classroom environments?
- RQ4. What possibilities does “dynamic colour” offer to enhance students’ cognitive processes in primary classrooms?
- H1. Coloured lighting configurations in primary school classrooms help to enhance students’ figurative creativity.
- H2. Coloured lighting configurations in primary school classrooms help to enhance students’ net attention.
- H3. Coloured light configurations in primary school classrooms help to enhance students’ impulsivity control.
- H4. The use of “dynamic colours” makes it possible to personalise the coloured lighting to adapt it to the different cognitive processes of the students.
2.2. Methodology
- VD1. Net attention. By net attention we mean the ability of an individual student to maintain sustained and efficient focus in performing a task that requires visual discrimination of similar stimuli over a given period of time. Central to its measurement are selective attention and perceptual speed, as well as the accuracy with which a person can identify minute differences between a series of presented visual stimuli.
- VD2. Impulsivity control. This variable refers to the ability of an individual learner to regulate and manage his or her immediate and impulsive responses when presented with a task that requires visual discrimination and sustained attention. This control is manifested in the ability to avoid impulsive errors, such as incorrectly marking pictures, by taking the time necessary to ensure accuracy in identifying differences between visual stimuli.
- VD3. Figurative creativity. This is measured through its four dimensions: originality, elaboration, fluency and flexibility. This variable is intended to measure an individual student’s ability to generate original and useful ideas by interpreting and modifying visual stimuli. This type of creativity manifests itself in the ability to think divergently and to create new forms, images and designs from provided graphic elements. The four dimensions mentioned above which constitute the variable are the very ones that the test we will use establishes as integral to figurative creativity and, therefore, are necessary for its quantification.
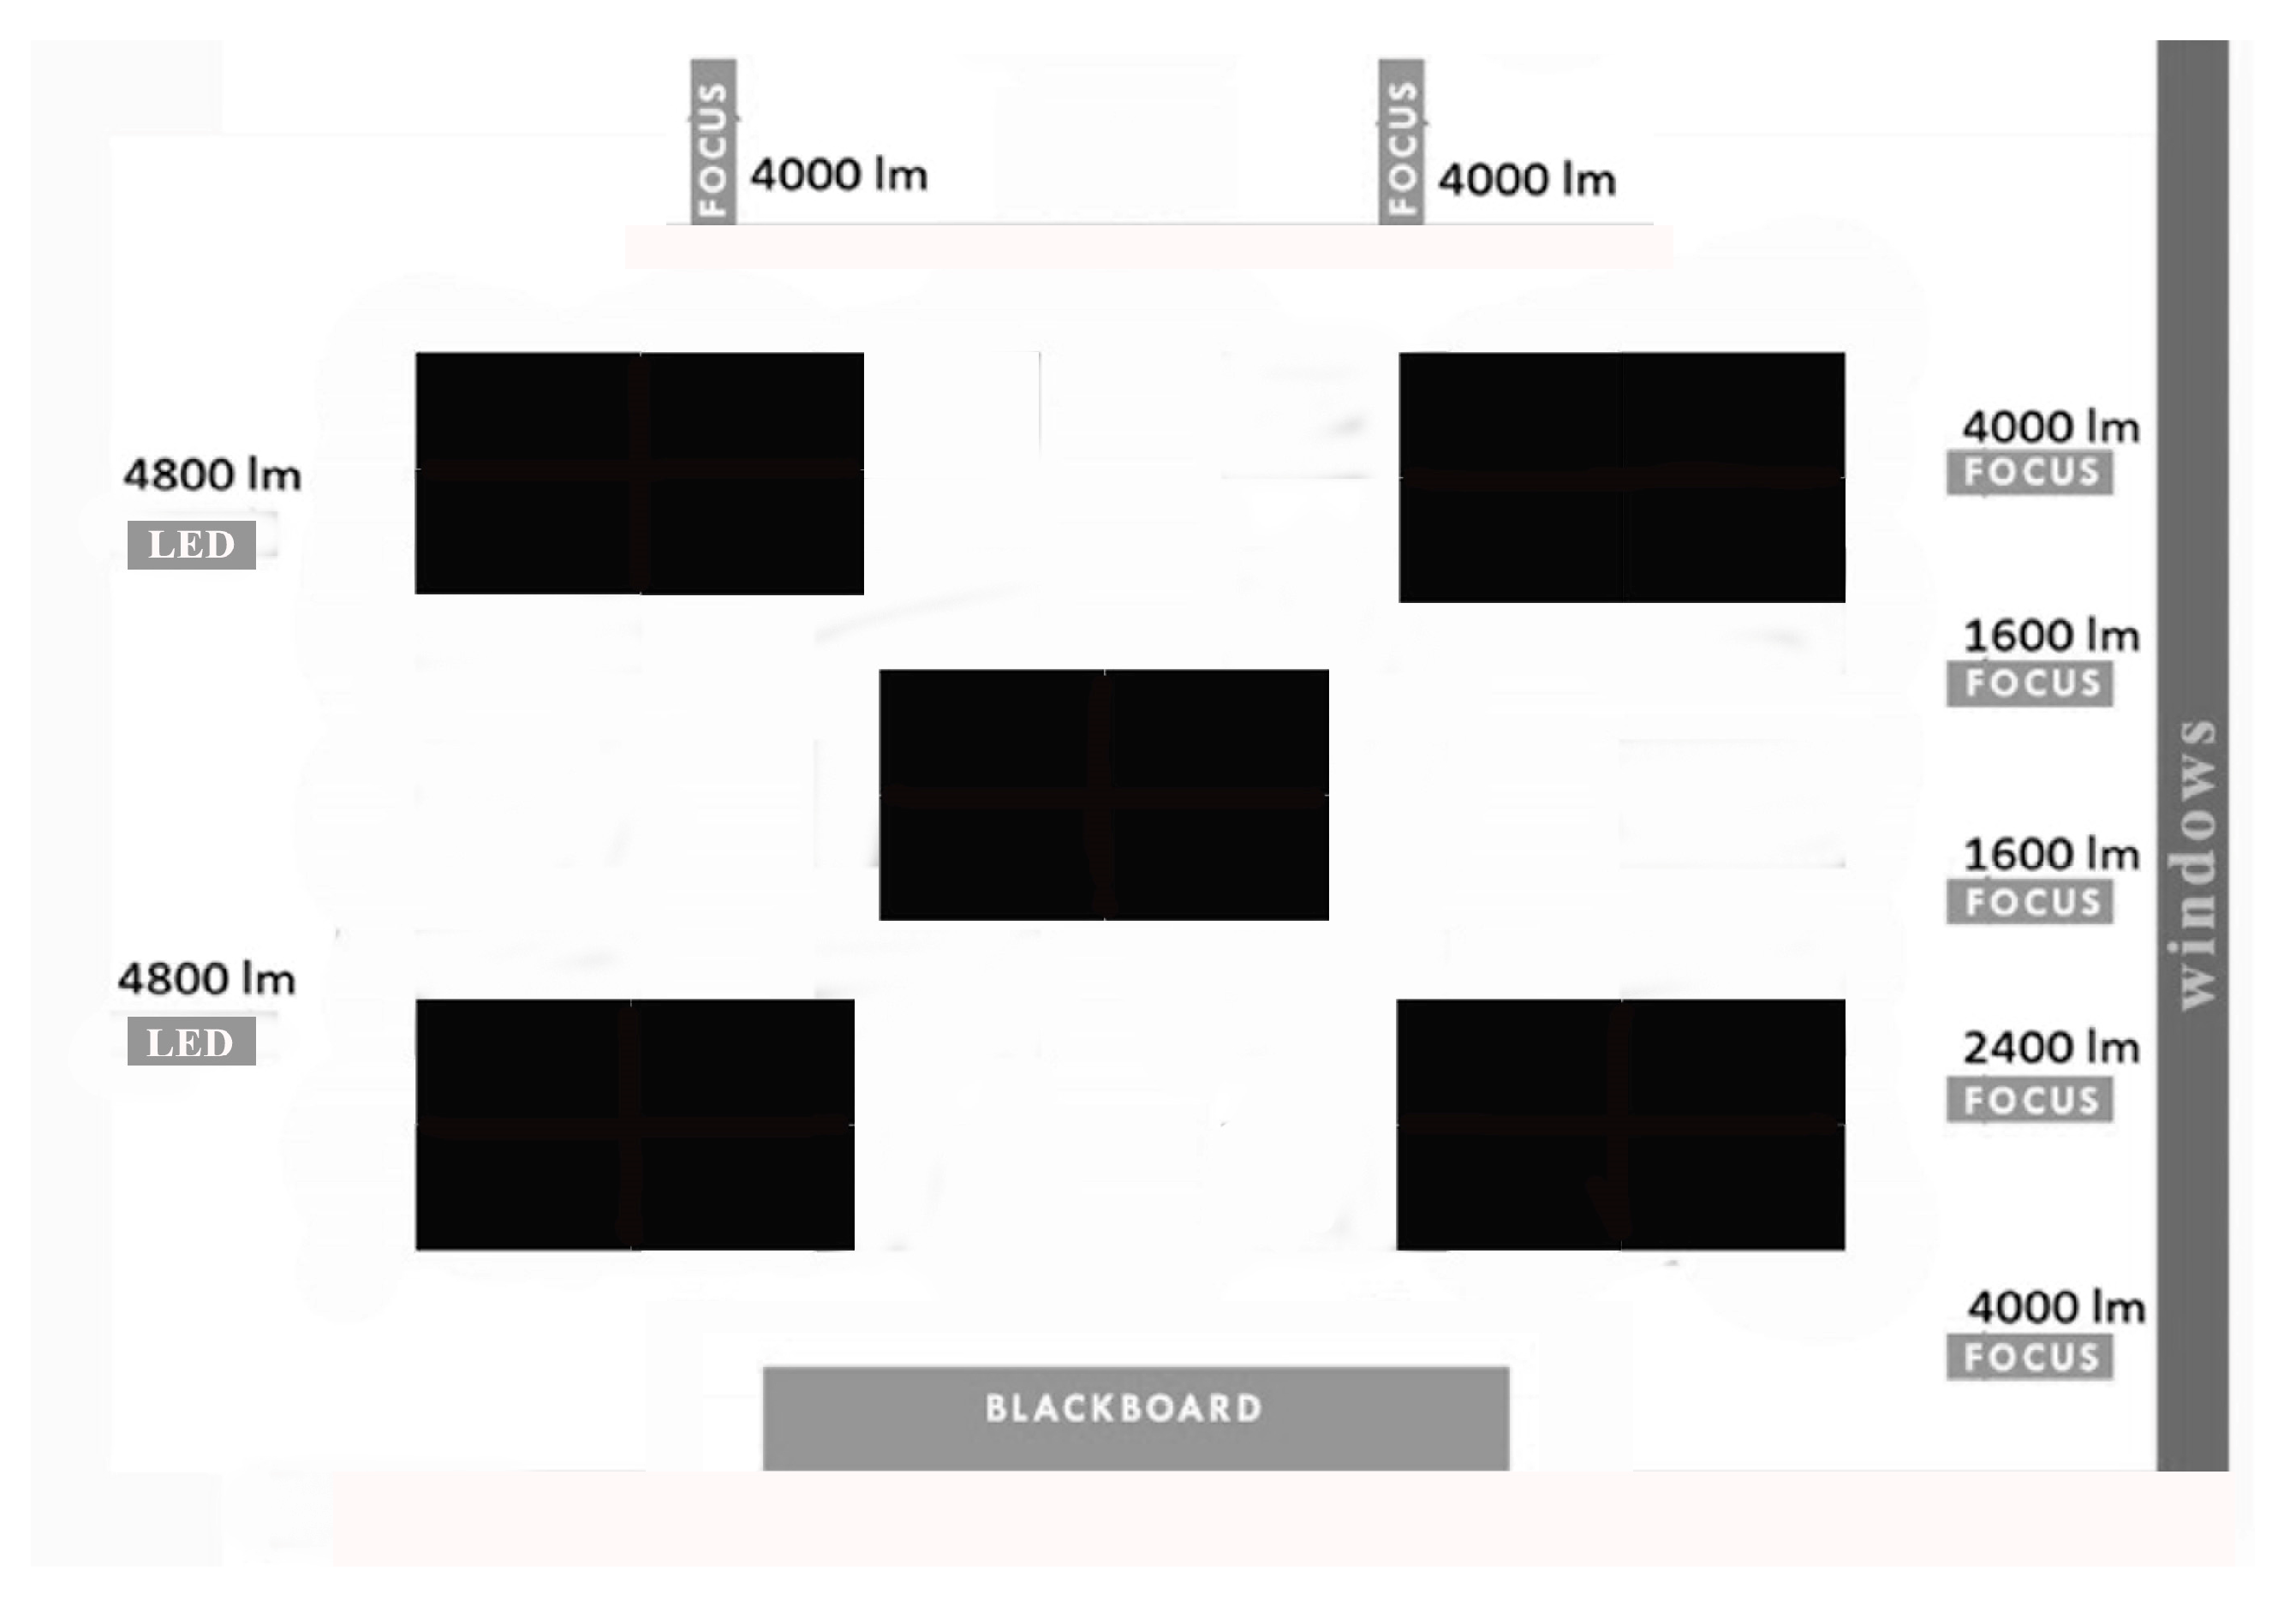
- We aimed to reduce the impact of weather conditions on the lighting conditions, minimising their influence, but without creating a sense of confinement for the students due to a total lack of natural light. To increase the sample size, we tested all students in the experimental group each day, foregoing a counterbalanced design.
- Coloured lights were introduced one month prior to data collection and integrated weekly into the teachers’ regular classroom activities to mitigate potential Hawthorne or motivational effects.
- Memory and learning effects, as outlined by Chacón-Moscoso et al. [35], were addressed by spacing pretest data collection one month after the first light scenario, with subsequent light scenarios spaced two weeks apart. Additionally, to prevent the influencing of students’ behaviour and affective processes, the study’s purpose was not disclosed, and all activities were presented as routine classroom procedures.
- To further avoid memory effects, the order of the “coloured light” scenarios was altered compared to previous research.
2.3. Sample and Context of the Study, Experimental Situation
2.4. Ethical Considerations
3. Results
3.1. Net Attention and Impulsivity-Control
3.1.1. Descriptive Analysis
3.1.2. Variance Analysis
3.1.3. Comparative Analysis
3.2. Originality and Elaboration
3.2.1. Descriptive Analysis
3.2.2. Variance Analysis
3.2.3. Comparative Analysis
3.3. Fluency and Flexibility
3.3.1. Descriptive Analysis
3.3.2. Variance Analysis
3.3.3. Comparative Analysis
3.4. Figurative Creativity
3.4.1. Descriptive Analysis
3.4.2. Variance Analysis
3.4.3. Comparative Analysis
3.5. Extreme Values of the Dependent Variables
4. Discussion
5. Conclusions
6. Limitations and Future Lines of Research
Author Contributions
Funding
Data Availability Statement
Conflicts of Interest
References
- Quiles-Rodríguez, J.; Palau, R. Effects of Classroom Colour on Learning Processes for a Future Smart Classroom: A Systematic Review. In Challenges of the Educational System in Contemporary Society; Antolí, J., Ed.; IGI Global: Hershey, PA, USA, 2023; pp. 222–241. [Google Scholar] [CrossRef]
- Arbona Hidalgo, L. Estudio de la Influencia de la Iluminación en la Percepción de los Estudiantes Universitarios. Ph.D. Thesis, Universitat Politècnica de València, Valencia, Spain, 2021. [Google Scholar]
- Suh, J.K.; Park, E.K.; Iwamoto, D. Color-filtered lighting: Visual and emotional impact in learning environments. Int. J. Arch. Spat. Environ. Des. 2020, 14, 41–55. [Google Scholar] [CrossRef]
- Rajae-Joordens, R.J.E. The Effects of Colored Light on Valence and Arousal. In Philips Research Book Series; Sensing Emotions; Westerink, J., Krans, M., Ouwerkerk, M., Eds.; Springer: Berlin/Heidelberg, Germany, 2010; Volume 12, pp. 65–84. [Google Scholar] [CrossRef]
- Kombeiz, O.; Steidle, A. Facilitation of creative performance by using blue and red accent lighting in work and learning areas. Ergonomics 2018, 61, 456–463. [Google Scholar] [CrossRef] [PubMed]
- Poldma, T. Learning the dynamic processes of color and light in interior design. J. Inter. Des. 2009, 34, 19–33. [Google Scholar] [CrossRef]
- Hogewoning, S.W.; Trouwborst, G.; Maljaars, H.; Poortr, H.; Van Leperen, W.; Harbinson, J. Blue light dose-responses of leaf photosynthesis, morphology, and chemical composition of Cucumis sativus grown under different combinations of red and blue light. J. Exp. Bot. 2010, 61, 3107–3117. [Google Scholar] [CrossRef] [PubMed]
- Johkan, M.; Shoji, F.; Goto, F.; Hahida, S.; Yoshihara, T. Effect of green light wavelength and intensity on photomorphogenesis and photosynthesis in Lactuca sativa. Environ. Exp. Bot. 2010, 75, 128–133. [Google Scholar] [CrossRef]
- Araujo, J.; Rodriguez, M.J.; Postolache, O.; Cercas, F.; Martín, F.F.; Martínez, A.L. Heart Rate Variability Analysis in Healthy Subjects Under Different Colored Ligthing Conditions. In Proceedings of the IEEE International Instrumentation and Measuremente Technology Conference (I2MTC), Dubrovnik, Croatia, 25–28 May 2020. [Google Scholar] [CrossRef]
- Jiang, A.; Schlacht, I.L.; Yao, X.; Foing, B.; Fang, Z.; Westland, S.; Hemingray, C.; Yao, W. Space Habitat Astronautics: Multicolour Lighting Psychology in a 7-Day Simulated Habitat. Space Sci. Technol. 2022, 2022, 1–11. [Google Scholar] [CrossRef]
- Manca, S.; Cerina, V.; Tobia, V.; Sacchi, S.; Fornara, F. The effect of school design on users’ responses: A systematic review (2008–2017). Sustainability 2020, 12, 3453–3490. [Google Scholar] [CrossRef]
- Quiles-Rodríguez, J.; Palau, R. Effects of colored lighting on learning processes: Towards a smart classroom. J. Technol. Sci. Educ. 2024, 14, 484–506. [Google Scholar] [CrossRef]
- Von Castell, C.; Stelzmann, D.; Oberfeld, D.; Welsch, R.; Hecht, H. Cognitive performance and emotion are indifferent to ambient color. Color Res. Appl. 2017, 43, 65–74. [Google Scholar] [CrossRef]
- Godwin, K.; Leroux, A.; Scupelli, P.; Fisher, A. Classroom Design and Children’s Attention Allocation: Beyond the Laboratory and into the Classroom. Mind Brain Educ. 2022, 16, 239–251. [Google Scholar] [CrossRef]
- Barrett, P.; Davies, F.; Zhang, Y.; Barrett, L. The impact of classroom design on pupils’ learning: Final results of a holistic, multi-level analysis. Build. Environ. 2015, 89, 118–133. [Google Scholar] [CrossRef]
- Barrett, P.; Davies, F.; Zhang, Y.; Barrett, L. The Holistic Impact of Classroom Spaces on Learning in Specific Subjects. Environ. Behav. 2017, 49, 425–451. [Google Scholar] [CrossRef] [PubMed]
- Smith, E.E.; Kosslyn, S.M. Procesos Cognitivos. Modelos y Bases Neurales; Pearson Educación: Madrid, Spain, 2008. [Google Scholar]
- Mehta, R.; Zhu, R.J. Blue or red? Exploring the effect of color on cognitive task performances. Science 2009, 5918, 1226–1229. [Google Scholar] [CrossRef] [PubMed]
- Duyan, F.; Ünver, R. A research on the effect of classroom wall colours on student’s attention. A/Z ITU J. Fac. Arch. 2016, 13, 73–78. [Google Scholar] [CrossRef]
- Tuszyńska-Bogucka, W.; Borys, M.; Dzieńkowski, M.; Kwiatkowski, B.; Kocki, W.; Pełka, J.; Bogucki, J. Use of Eye Tracking for Designing of Learning Spaces. ICERI2018 Proc. 2018, 1, 5360–5368. [Google Scholar] [CrossRef]
- Pourbagher, S.; Azemati, H.R.; Saleh Sedgh Pour, B. Classroom wall color: A multiple variance analysis on social stress and concentration in learning environments. Int. J. Educ. Manag. 2020, 35, 189–200. [Google Scholar] [CrossRef]
- Quiles-Rodríguez, J.; Mateo-Sanz, J.M.; Palau, R. How does Coloured Lighting Influence the Affective Processes of Pupils? Interact. Des. Archit. J. 2024, 60, 103–121. [Google Scholar] [CrossRef]
- Mogas-Recalde, J.; Palau, R. Classroom lighting and its effect on student learning and performance: Towards smarter conditions. In Ludic, Co-Design and Tools Supporting Smart Learning Ecosystems and Smart Education: Proceedings of the 5th International Conference on Smart Learning Ecosystems and Regional Development; Springer: Singapore, 2021; pp. 3–12. [Google Scholar] [CrossRef]
- Llinares, C.; Castilla, N.; Higuera-Trujillo, J.L. Do attention and memory tasks require the same lighting? A study in university classrooms. Sustainability 2021, 13, 8374. [Google Scholar] [CrossRef]
- Hviid, C.; Pedersen, C.; Dabelsteen, K. A field study of the individual and combined effect of ventilation rate and lighting conditions on pupils’ performance. Build. Environ. 2020, 171, 106608. [Google Scholar] [CrossRef]
- López-Villanueva, D.; Palau, R.; Santiago, R. ¿Cómo puede la IA ayudar a la personalización del aprendizaje? In Inteligencia Artificial en la Microeducación: Transformando el Aula del Futuro; Muñoz, J.M., Lorenzo, N., Suñé, X., Eds.; Observatorio de Innovación Educativa y Cultura Digital (ODITE): Barcelona, Spain, 2024. [Google Scholar]
- Román-García, M.; Prendes-Espinosa, M.P. El informe del TFM. In Trabajo Fin de Máster en Tecnología Educativa. Orientaciones para la Elaboración y Criterios de Calidad; Prendes Espinosa, M.P., González Calatayud, V., Eds.; Universidad de Murcia: Murcia, Spain, 2018; pp. 59–67. [Google Scholar]
- López Fuentes, R.; Salmerón Vilchez, P. Proceso de Investigación Educativa I: Investigación Experimental. In Innovación Docente e Investigación Educativa. Máster Universitario de Educación Secundaria Obligatoria y Bachillerato, Formación Profesional y Enseñanza de Idiomas; López Fuentes, R., Ed.; Universidad de Granada: Granada, Spain, 2011; pp. 24–40. Available online: https://www.ugr.es/~emiliobl/Emilio_Berrocal_de_Luna/Master_files/Introduccio%CC%81n%20a%20la%20Innovacio%CC%81n%20Docente.pdf (accessed on 5 May 2024).
- Campbell, D.T.; Stanley, J.C. Experimental and Quasi-Experimental Designs for Research; Rand McNally & Company: Chicago, IL, USA, 1966. [Google Scholar]
- Luri, G. La Escuela no es un Parque de Atracciones. Una Defensa del Conocimiento Poderoso; Ariel: Barcelona, Spain, 2020; p. 410. [Google Scholar]
- Toala Ponce, S.R.; Gómez Pinillo, L.Y.; Guevara Heredia, R.N.; Quiñonez Ortiz, E.C. Application of Bloom’s taxonomy to improve teaching-learning. Sapienza Int. J. Interdiscip. Stud. 2022, 3, 176–189. [Google Scholar] [CrossRef]
- Ley Orgánica 8/2013, de 9 de diciembre, de Mejora de la Calidad Educativa. BOE núm. 295. Available online: https://www.boe.es/eli/es/lo/2013/12/09/8 (accessed on 10 April 2024).
- Thurstone, L.L.; Yela, M. Caras-R. Test de Percepción de Diferencias-Revisado, 13th ed.; TEA Ediciones: Madrid, Spain, 2019. [Google Scholar]
- Artiles Hernández, C.; Jiménez González, J.E.; Rodríguez Rodríguez, C.; García Miranda, E. Adaptación y Baremación del Test de Pensamiento Creativo de Torrance: Expresión Figurada. Educación Primaria y Secundaria; Consejería de Educación, Cultura y Deportes del Gobierno de Canarias, Dirección General de Ordenación e Innovación Educativ: Islas Canarias, Spain, 2007. [Google Scholar]
- Chacón Moscoso, S.; Sanduvete Chavez, S. Métodos, Diseños y Técnicas de Investigación Psicológica; Universidad de Sevilla: Sevilla, Spain, 2018. [Google Scholar]
- Reglamento (UE) 2016/679 del Parlamento Europeo y del Consejo, de 27 de Abril de 2016, Relativo a la Protección de las Personas Físicas en lo que Respecta al Tratamiento de Datos Personales y a la Libre Circulación de Estos Datos y por el que se Deroga la Directiva 95/46/CE (Reglamento General de Protección de Datos). DOUE Núm. 119. Available online: https://www.boe.es/doue/2016/119/L00001-00088.pdf (accessed on 10 April 2024).
- Ley Orgánica 3/2018, de 5 de Diciembre, de Protección de Datos Personales y Garantía de los Derechos Digitales. BOE Núm. 294. Available online: https://www.boe.es/eli/es/lo/2018/12/05/3 (accessed on 10 April 2024).
- Muñoz, J.M.; Lorenzo, N.; Suñé, X. Inteligencia artificial en la Microeducación: Transformando el Aula del Futuro. In Inteligencia artificial en la Microeucación: Transformando el Aula del Futuro; Muñoz, J.M., Lorenzo, N., Suñé, X., Eds.; Observatorio de Innovación Educativa y Cultura Digital (ODITE): Barcelona, Spain, 2024. [Google Scholar]
- Shalamanov, V. Implementation of Artifical Dynamic and Biodynamic Lighting System in Training Laboratory. In Proceedings of the 12th Electrical Engineering Faculty Conference (BulEF), Varna, Bulgaria, 9–12 September 2020. [Google Scholar] [CrossRef]
- Choi, K.; Suk, H. Dynamic lighting system for the learning environment: Performance of elementary students. Opt. Express 2016, 24, 907–916. [Google Scholar] [CrossRef] [PubMed]
- Lee, H.S.; Kwon, S.Y.; Lim, J.H. A Development of a Lighting Control System Based on Context-Awareness for the Improvement of Learning Efficiency in Classroom. Wirel. Pers. Commun. 2016, 86, 165–181. [Google Scholar] [CrossRef]
- Sun, B.; Zhang, Q.; Cao, S. Development and Implementation of a Self-Optimizable Smart Lighting System Based on Learning Context in Classroom. Int. J. Environ. Res. Public Health 2020, 17, 1217. [Google Scholar] [CrossRef] [PubMed]







| Natural Light | Green Light | Purple Light | Orange Light | |
|---|---|---|---|---|
| Classroom scenarios | 980 lx | 907 lx | 846 lx | 775 lx |
| 3963 K | 4239 K | 4004 K | 3502 K | |
| Wavelength: maximum values of 660 nm | Wavelength: maximum values of 520 nm | Wavelength: maximum values of 360 nm | Wavelength: maximum values of 720 nm |
| Natural Light | Natural Light 2 | Natural Light 3 | Natural Light 4 | |
|---|---|---|---|---|
| Classroom scenarios | 976 lx | 992 lx | 1008 lx | 975 lx |
| 4004 K | 3901 K | 4010 K | 3953 K | |
| Wavelength: maximum values of 670 nm | Wavelength: maximum values of 660 nm | Wavelength: maximum values of 650 nm | Wavelength: maximum values of 660 nm |
| Net Attention | Impulsivity Control | |||||||
|---|---|---|---|---|---|---|---|---|
| Natural | Green | Purple | Orange | Natural | Green | Purple | Orange | |
| Valid | 18 | 19 | 17 | 19 | 18 | 19 | 17 | 19 |
| Mode a | 35.000 | 38.000 | 35.000 | 48.000 | 89.700 | 90.000 | 100.000 | 100.000 |
| Median | 35.000 | 38.000 | 41.000 | 44.000 | 89.700 | 87.500 | 91.800 | 92.900 |
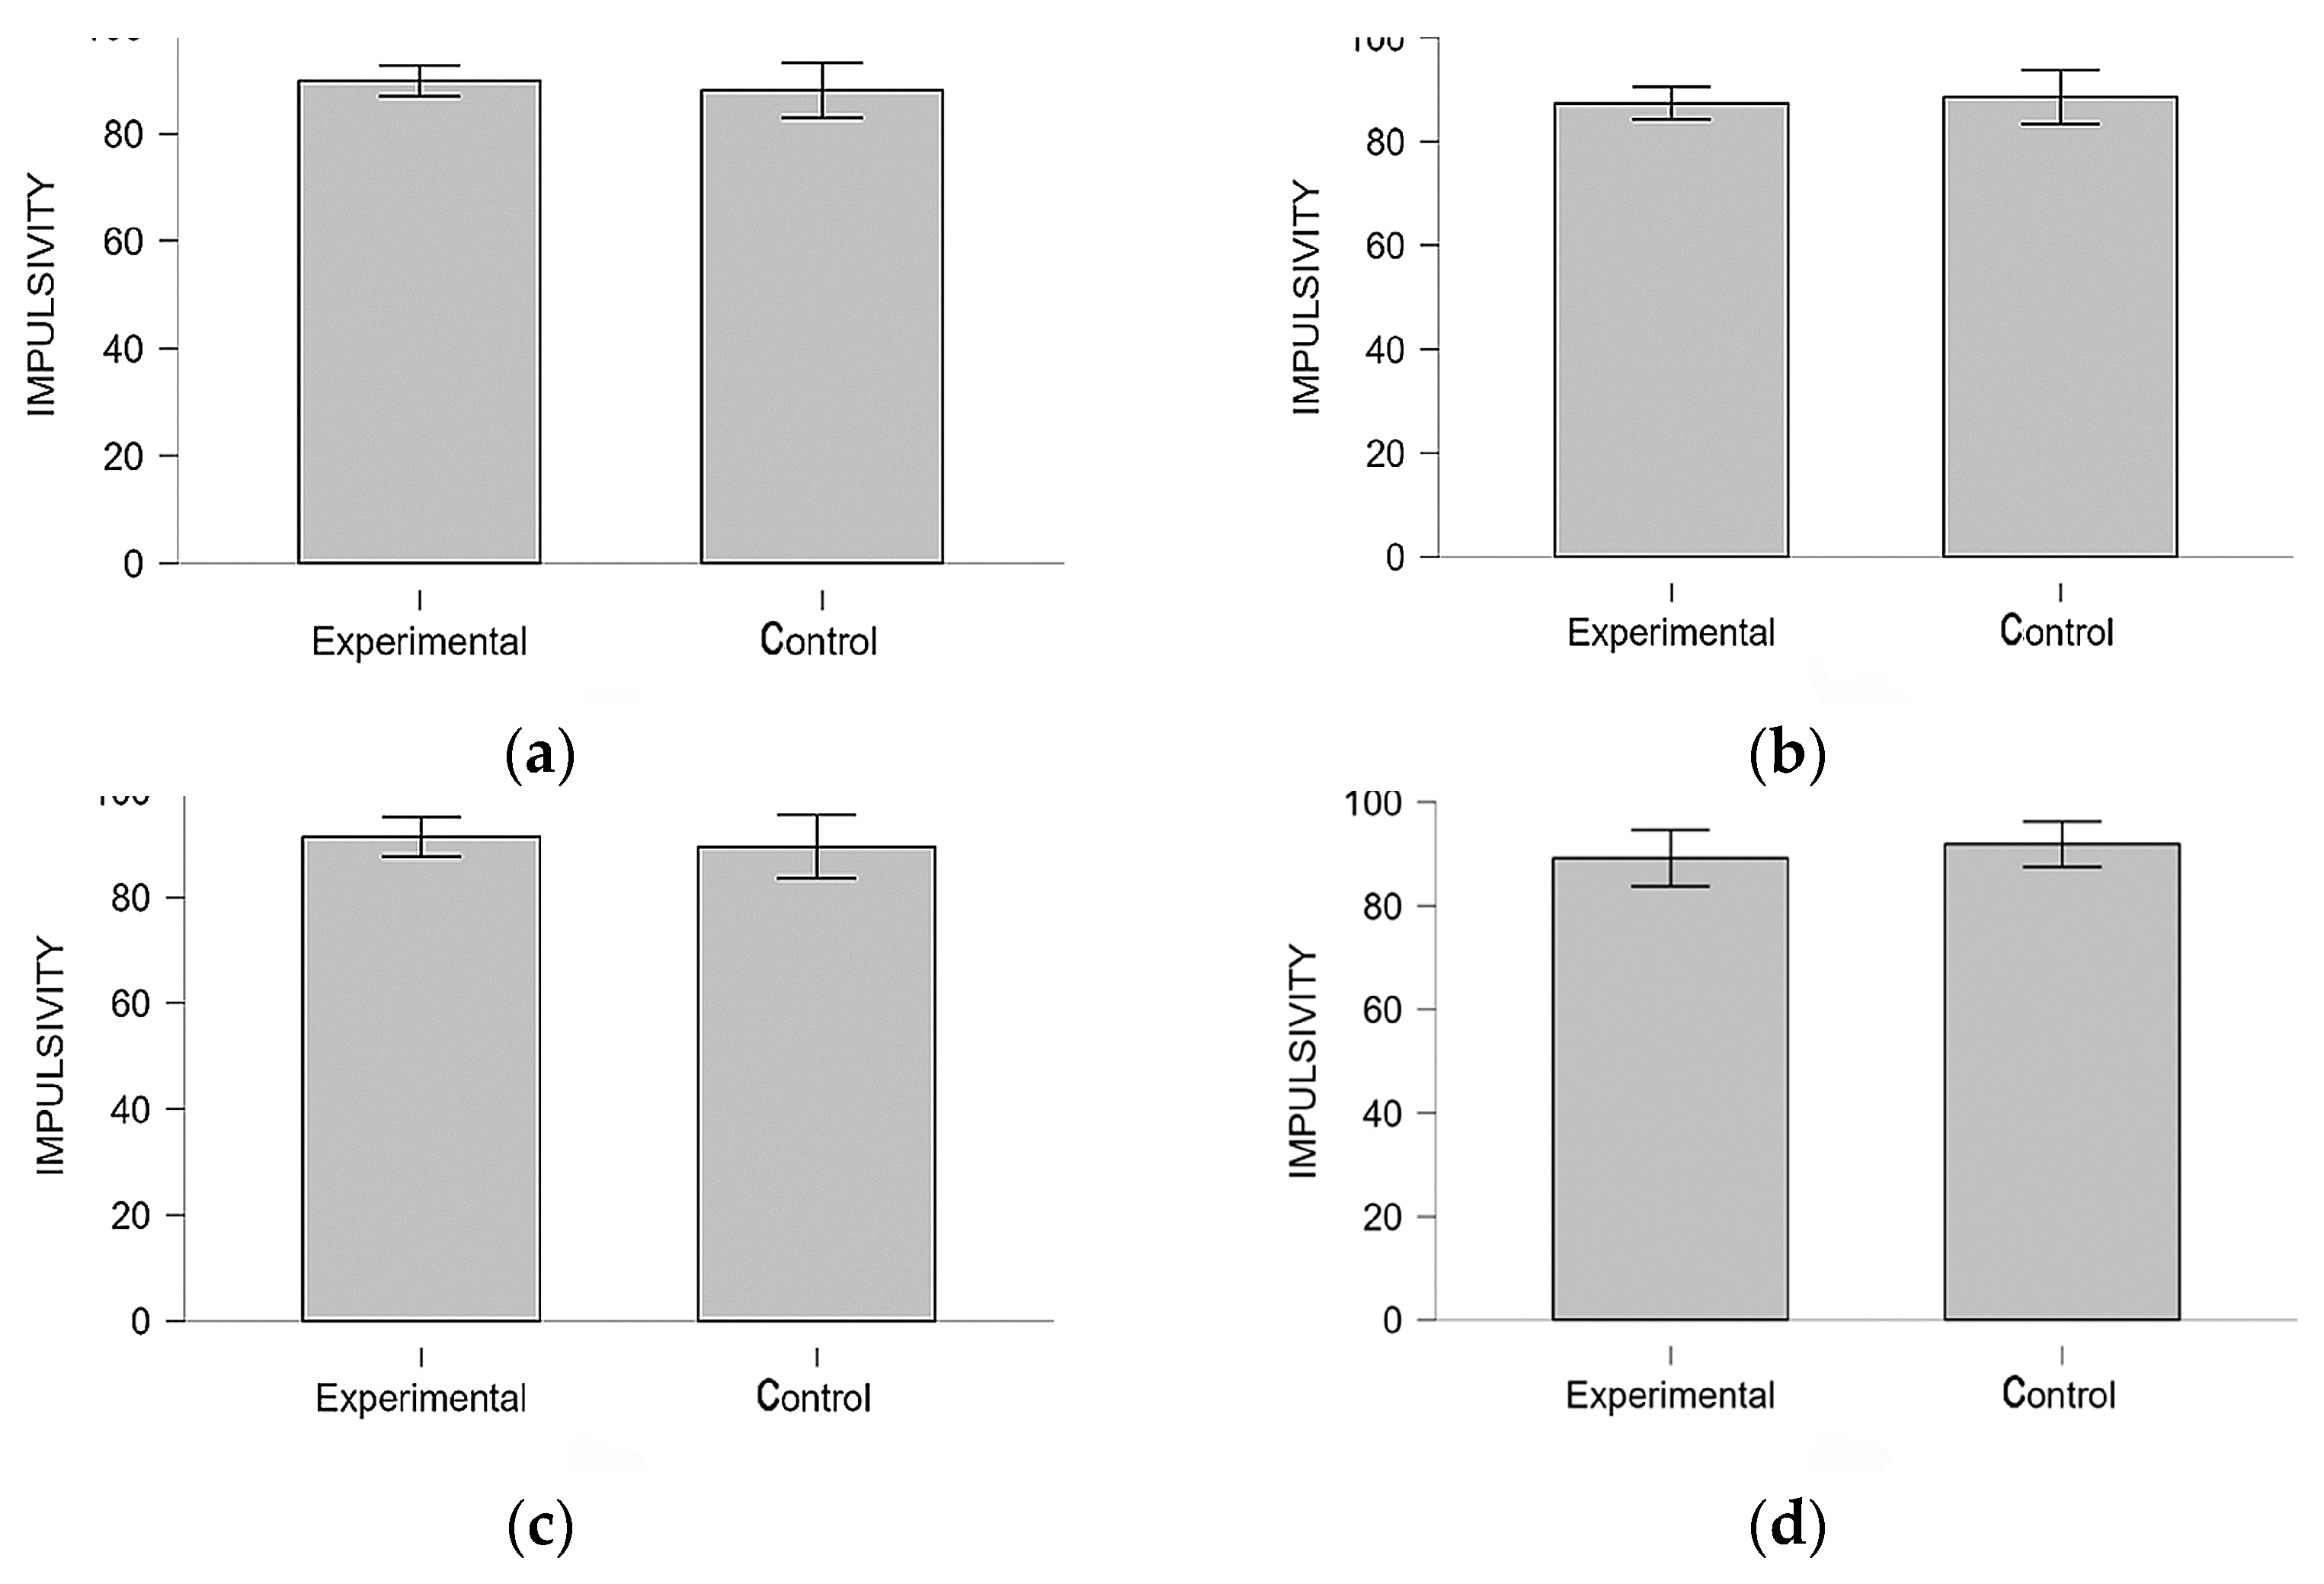
| Mean | 35.778 | 39.842 | 42.353 | 43.947 | 89.806 | 87.353 | 91.359 | 89.163 |
| Std. Deviation | 7.297 | 7.456 | 8.389 | 9.525 | 5.785 | 6.424 | 7.195 | 11.281 |
| Shapiro–Wilk | 0.948 | 0.931 | 0.933 | 0.968 | 0.966 | 0.972 | 0.904 | 0.869 |
| p-value of Shapiro–Wilk | 0.389 | 0.177 | 0.245 | 0.727 | 0.712 | 0.808 | 0.078 | 0.014 |
| Net Attention | Impulsivity Control | |||||||
|---|---|---|---|---|---|---|---|---|
| Natural | Natural 2 | Natural 3 | Natural 4 | Natural | Natural 2 | Natural 3 | Natural 4 | |
| Valid | 20 | 20 | 19 | 20 | 20 | 20 | 19 | 20 |
| Mode a | 30.000 | 38.000 | 29.000 | 58.000 | 100.000 | 100.000 | 100.000 | 100.000 |
| Median | 33.000 | 37.500 | 43.000 | 46.500 | 90.100 | 90.500 | 95.300 | 96.300 |
| Mean | 34.900 | 37.850 | 41.579 | 45.250 | 88.045 | 88.570 | 89.537 | 91.900 |
| Std. Deviation | 10.228 | 9.626 | 11.640 | 10.538 | 10.980 | 11.159 | 12.398 | 9.362 |
| Shapiro–Wilk | 0.961 | 0.956 | 0.947 | 0.907 | 0.909 | 0.887 | 0.796 | 0.815 |
| p-value of Shapiro–Wilk | 0.563 | 0.468 | 0.351 | 0.056 | 0.061 | 0.024 | <0.001 | 0.001 |
| Friedman Test | ||||
|---|---|---|---|---|
| Factor | Chi-Squared | df | p | Kendall’s W |
| Net attention | 14.294 | 3 | 0.003 | 0.298 |
| Impulsivity | 6.134 | 3 | 0.105 | 0.128 |
| Conover’s Post Hoc Comparisons | |||||||||
|---|---|---|---|---|---|---|---|---|---|
| Net Attention | Impulsivity Control | ||||||||
| Factor | T-Stat | df | p | pbonf | T-Stat | df | p | pbonf | |
| Natural | Green | 1.877 | 45 | 0.067 | 0.402 | 1.440 | 45 | 0.157 | 0.940 |
| Purple | 3.337 | 45 | 0.002 | 0.010 | 0.960 | 45 | 0.342 | 1.000 | |
| Orange | 3.128 | 45 | 0.003 | 0.018 | 0.206 | 45 | 0.838 | 1.000 | |
| Green | Purple | 1.460 | 45 | 0.151 | 0.908 | 2.400 | 45 | 0.021 | 0.123 |
| Orange | 1.251 | 45 | 0.217 | 1.000 | 1.646 | 45 | 0.107 | 0.640 | |
| Purple | Orange | 0.209 | 45 | 0.836 | 1.000 | 1.440 | 45 | 0.157 | 0.940 |
| Independent Samples t-Test; Net Attention | ||||||
|---|---|---|---|---|---|---|
| Test | Statistic | df | p | Effect Size | SE Effect Size | |
| Day 1, natural light | Student | 0.301 | 36 | 0.765 | 0.098 | 0.325 |
| Mann–Whitney | 198.000 | 0.608 | 0.100 | 0.188 | ||
| Day 2, green light | Student | 0.720 | 37 | 0.476 | 0.231 | 0.323 |
| Mann–Whitney | 218.000 | 0.438 | 0.147 | 0.185 | ||
| Day 3, purple light | Student | 0.226 | 34 | 0.822 | 0.076 | 0.334 |
| Mann–Whitney | 163.500 | 0.962 | 0.012 | 0.193 | ||
| Day 4, orange light | Student | −0.404 | 37 | 0.688 | −0.130 | 0.321 |
| Mann–Whitney | 172.500 | 0.632 | −0.092 | 0.185 | ||
| Independent Samples t-Test; Impulsivity Control | ||||||
|---|---|---|---|---|---|---|
| Test | Statistic | df | p | Effect Size | SE Effect Size | |
| Day 1, natural light | Student | 0.608 | 36 | 0.547 | 0.198 | 0.327 |
| Mann–Whitney | 181.000 | 0.988 | 0.006 | 0.188 | ||
| Day 2, green light | Student | −0.415 | 37 | 0.681 | −0.133 | 0.321 |
| Mann–Whitney | 160.000 | 0.406 | −0.158 | 0.185 | ||
| Day 3, purple light | Student | 0.531 | 34 | 0.599 | 0.177 | 0.335 |
| Mann–Whitney | 156.000 | 0.873 | −0.034 | 0.193 | ||
| Day 4, orange light | Student | −0.826 | 37 | 0.414 | −0.265 | 0.323 |
| Mann–Whitney | 158.000 | 0.371 | −0.168 | 0.185 | ||
| Originality | Elaboration | |||||||
|---|---|---|---|---|---|---|---|---|
| Natural | Green | Purple | Orange | Natural | Green | Purple | Orange | |
| Valid | 18 | 19 | 17 | 19 | 18 | 19 | 17 | 19 |
| Mode a | 21.000 | 100.000 | 39.000 | 173.000 | 4.000 | 10.000 | 11.000 | 11.000 |
| Median | 96.500 | 100.000 | 124.000 | 138.000 | 18.500 | 18.000 | 11.000 | 11.000 |
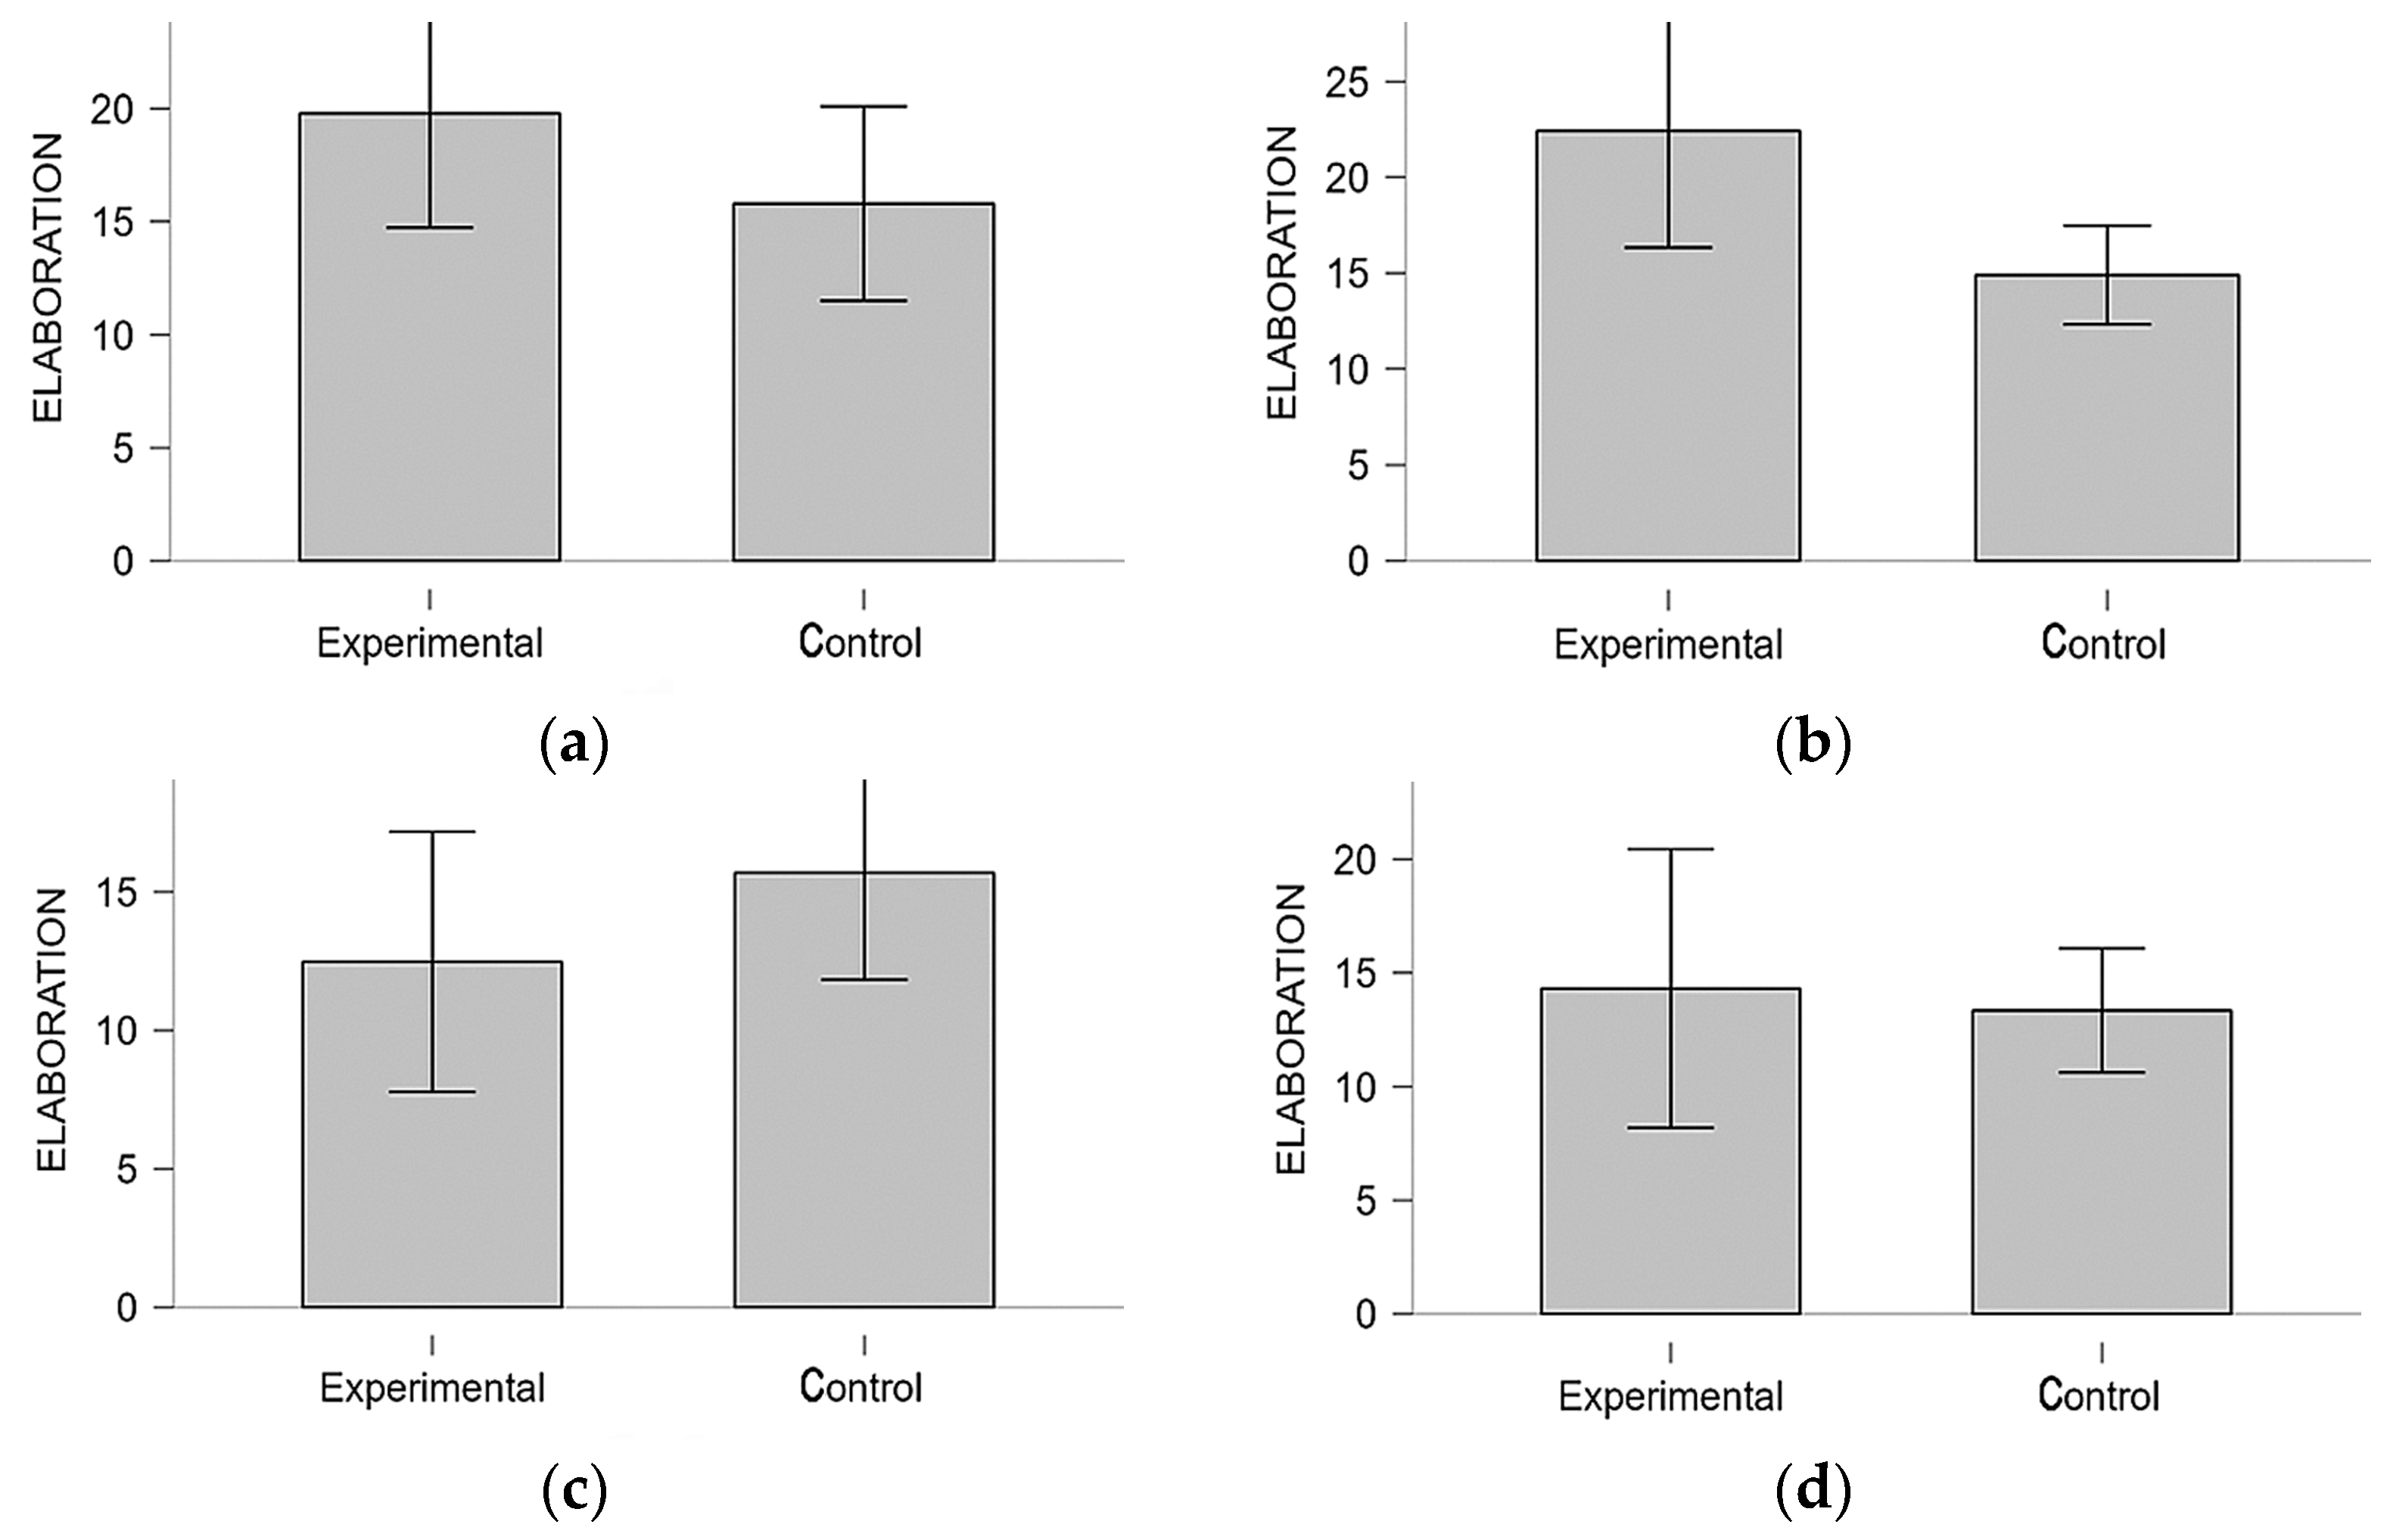
| Mean | 97.722 | 110.789 | 122.235 | 127.526 | 19.778 | 22.421 | 12.471 | 14.316 |
| Std. Deviation | 41.392 | 41.268 | 44.468 | 52.005 | 10.149 | 12.629 | 9.125 | 12.702 |
| Shapiro–Wilk | 0.981 | 0.895 | 0.964 | 0.933 | 0.954 | 0.923 | 0.907 | 0.783 |
| p-value of Shapiro–Wilk | 0.962 | 0.039 | 0.703 | 0.197 | 0.493 | 0.129 | 0.089 | <0.001 |
| Originality | Elaboration | |||||||
|---|---|---|---|---|---|---|---|---|
| Natural | Natural 2 | Natural 3 | Natural 4 | Natural | Natural 2 | Natural 3 | Natural 4 | |
| Valid | 20 | 20 | 19 | 20 | 20 | 20 | 19 | 20 |
| Mode a | 75.000 | 79.000 | 154.000 | 92.000 | 9.000 | 17.000 | 7.000 | 13.000 |
| Median | 80.000 | 97.000 | 106.000 | 117.000 | 16.000 | 17.000 | 14.000 | 14.000 |
| Mean | 87.250 | 98.450 | 112.947 | 119.450 | 15.800 | 14.900 | 15.684 | 13.350 |
| Std. Deviation | 29.266 | 38.568 | 36.331 | 39.779 | 9.180 | 5.505 | 8.000 | 5.824 |
| Shapiro–Wilk | 0.967 | 0.964 | 0.925 | 0.951 | 0.955 | 0.931 | 0.906 | 0.970 |
| p-value of Shapiro–Wilk | 0.689 | 0.633 | 0.139 | 0.388 | 0.447 | 0.160 | 0.062 | 0.765 |
| Friedman Test | ||||
|---|---|---|---|---|
| Factor | Chi-Squared | df | p | Kendall’s W |
| Originality | 11.465 | 3 | 0.009 | 0.239 |
| Elaboration | 22.084 | 3 | <0.001 | 0.460 |
| Conover’s Post Hoc Comparisons | |||||||||
|---|---|---|---|---|---|---|---|---|---|
| Originality | Elaboration | ||||||||
| Factor | T-Stat | df | p | pbonf | T-Stat | df | p | pbonf | |
| Natural | Orange | 1.097 | 45 | 0.278 | 1.000 | 1.174 | 45 | 0.247 | 1.000 |
| Purple | 1.646 | 45 | 0.107 | 0.640 | 3.038 | 45 | 0.004 | 0.024 | |
| Orange | 3.292 | 45 | 0.002 | 0.012 | 2.002 | 45 | 0.051 | 0.308 | |
| Green | Purple | 0.549 | 45 | 0.586 | 1.000 | 4.212 | 45 | <0.001 | <0.001 |
| Orange | 2.195 | 45 | 0.033 | 0.200 | 3.176 | 45 | 0.003 | 0.016 | |
| Purple | Orange | 1.646 | 45 | 0.107 | 0.640 | 1.036 | 45 | 0.306 | 1.000 |
| Independent Samples t-Test; Originality | ||||||
|---|---|---|---|---|---|---|
| Test | Statistic | df | p | Effect Size | SE Effect Size | |
| Day 1, natural light | Student | 0.908 | 36 | 0.370 | 0.295 | 0.329 |
| Mann–Whitney | 214.500 | 0.320 | 0.192 | 0.188 | ||
| Day 2, green light | Student | 0.965 | 37 | 0.341 | 0.309 | 0.324 |
| Mann–Whitney | 207.500 | 0.633 | 0.092 | 0.185 | ||
| Day 3, purple light | Student | 0.689 | 34 | 0.495 | 0.230 | 0.336 |
| Mann–Whitney | 182.000 | 0.526 | 0.127 | 0.193 | ||
| Day 4, orange light | Student | 0.546 | 37 | 0.588 | 0.175 | 0.322 |
| Mann–Whitney | 215.000 | 0.491 | 0.132 | 0.185 | ||
| Independent Samples t-Test; Elaboration | ||||||
|---|---|---|---|---|---|---|
| Test | Statistic | df | p | Effect Size | SE Effect Size | |
| Day 1, natural light | Student | 1.269 | 36 | 0.213 | 0.412 | 0.332 |
| Mann–Whitney | 220.000 | 0.248 | 0.222 | 0.188 | ||
| Day 2, green light | Student | 2.433 | 37 | 0.020 | 0.779 | 0.344 |
| Mann–Whitney | 239.000 | 0.172 | 0.258 | 0.185 | ||
| Day 3, purple light | Student | −1.126 | 34 | 0.268 | −0.376 | 0.340 |
| Mann–Whitney | 116.500 | 0.158 | −0.279 | 0.193 | ||
| Day 4, orange light | Student | 0.308 | 37 | 0.760 | 0.099 | 0.321 |
| Mann–Whitney | 156.500 | 0.353 | −0.176 | 0.185 | ||
| Fluency | Flexibility | |||||||
|---|---|---|---|---|---|---|---|---|
| Natural | Green | Purple | Orange | Natural | Green | Purple | Orange | |
| Valid | 18 | 19 | 17 | 19 | 18 | 19 | 17 | 19 |
| Mode a | 25.000 | 19.000 | 26.000 | 38.000 | 13.000 | 18.000 | 8.000 | 9.000 |
| Median | 25.000 | 24.000 | 26.000 | 28.000 | 14.000 | 18.000 | 16.000 | 15.000 |
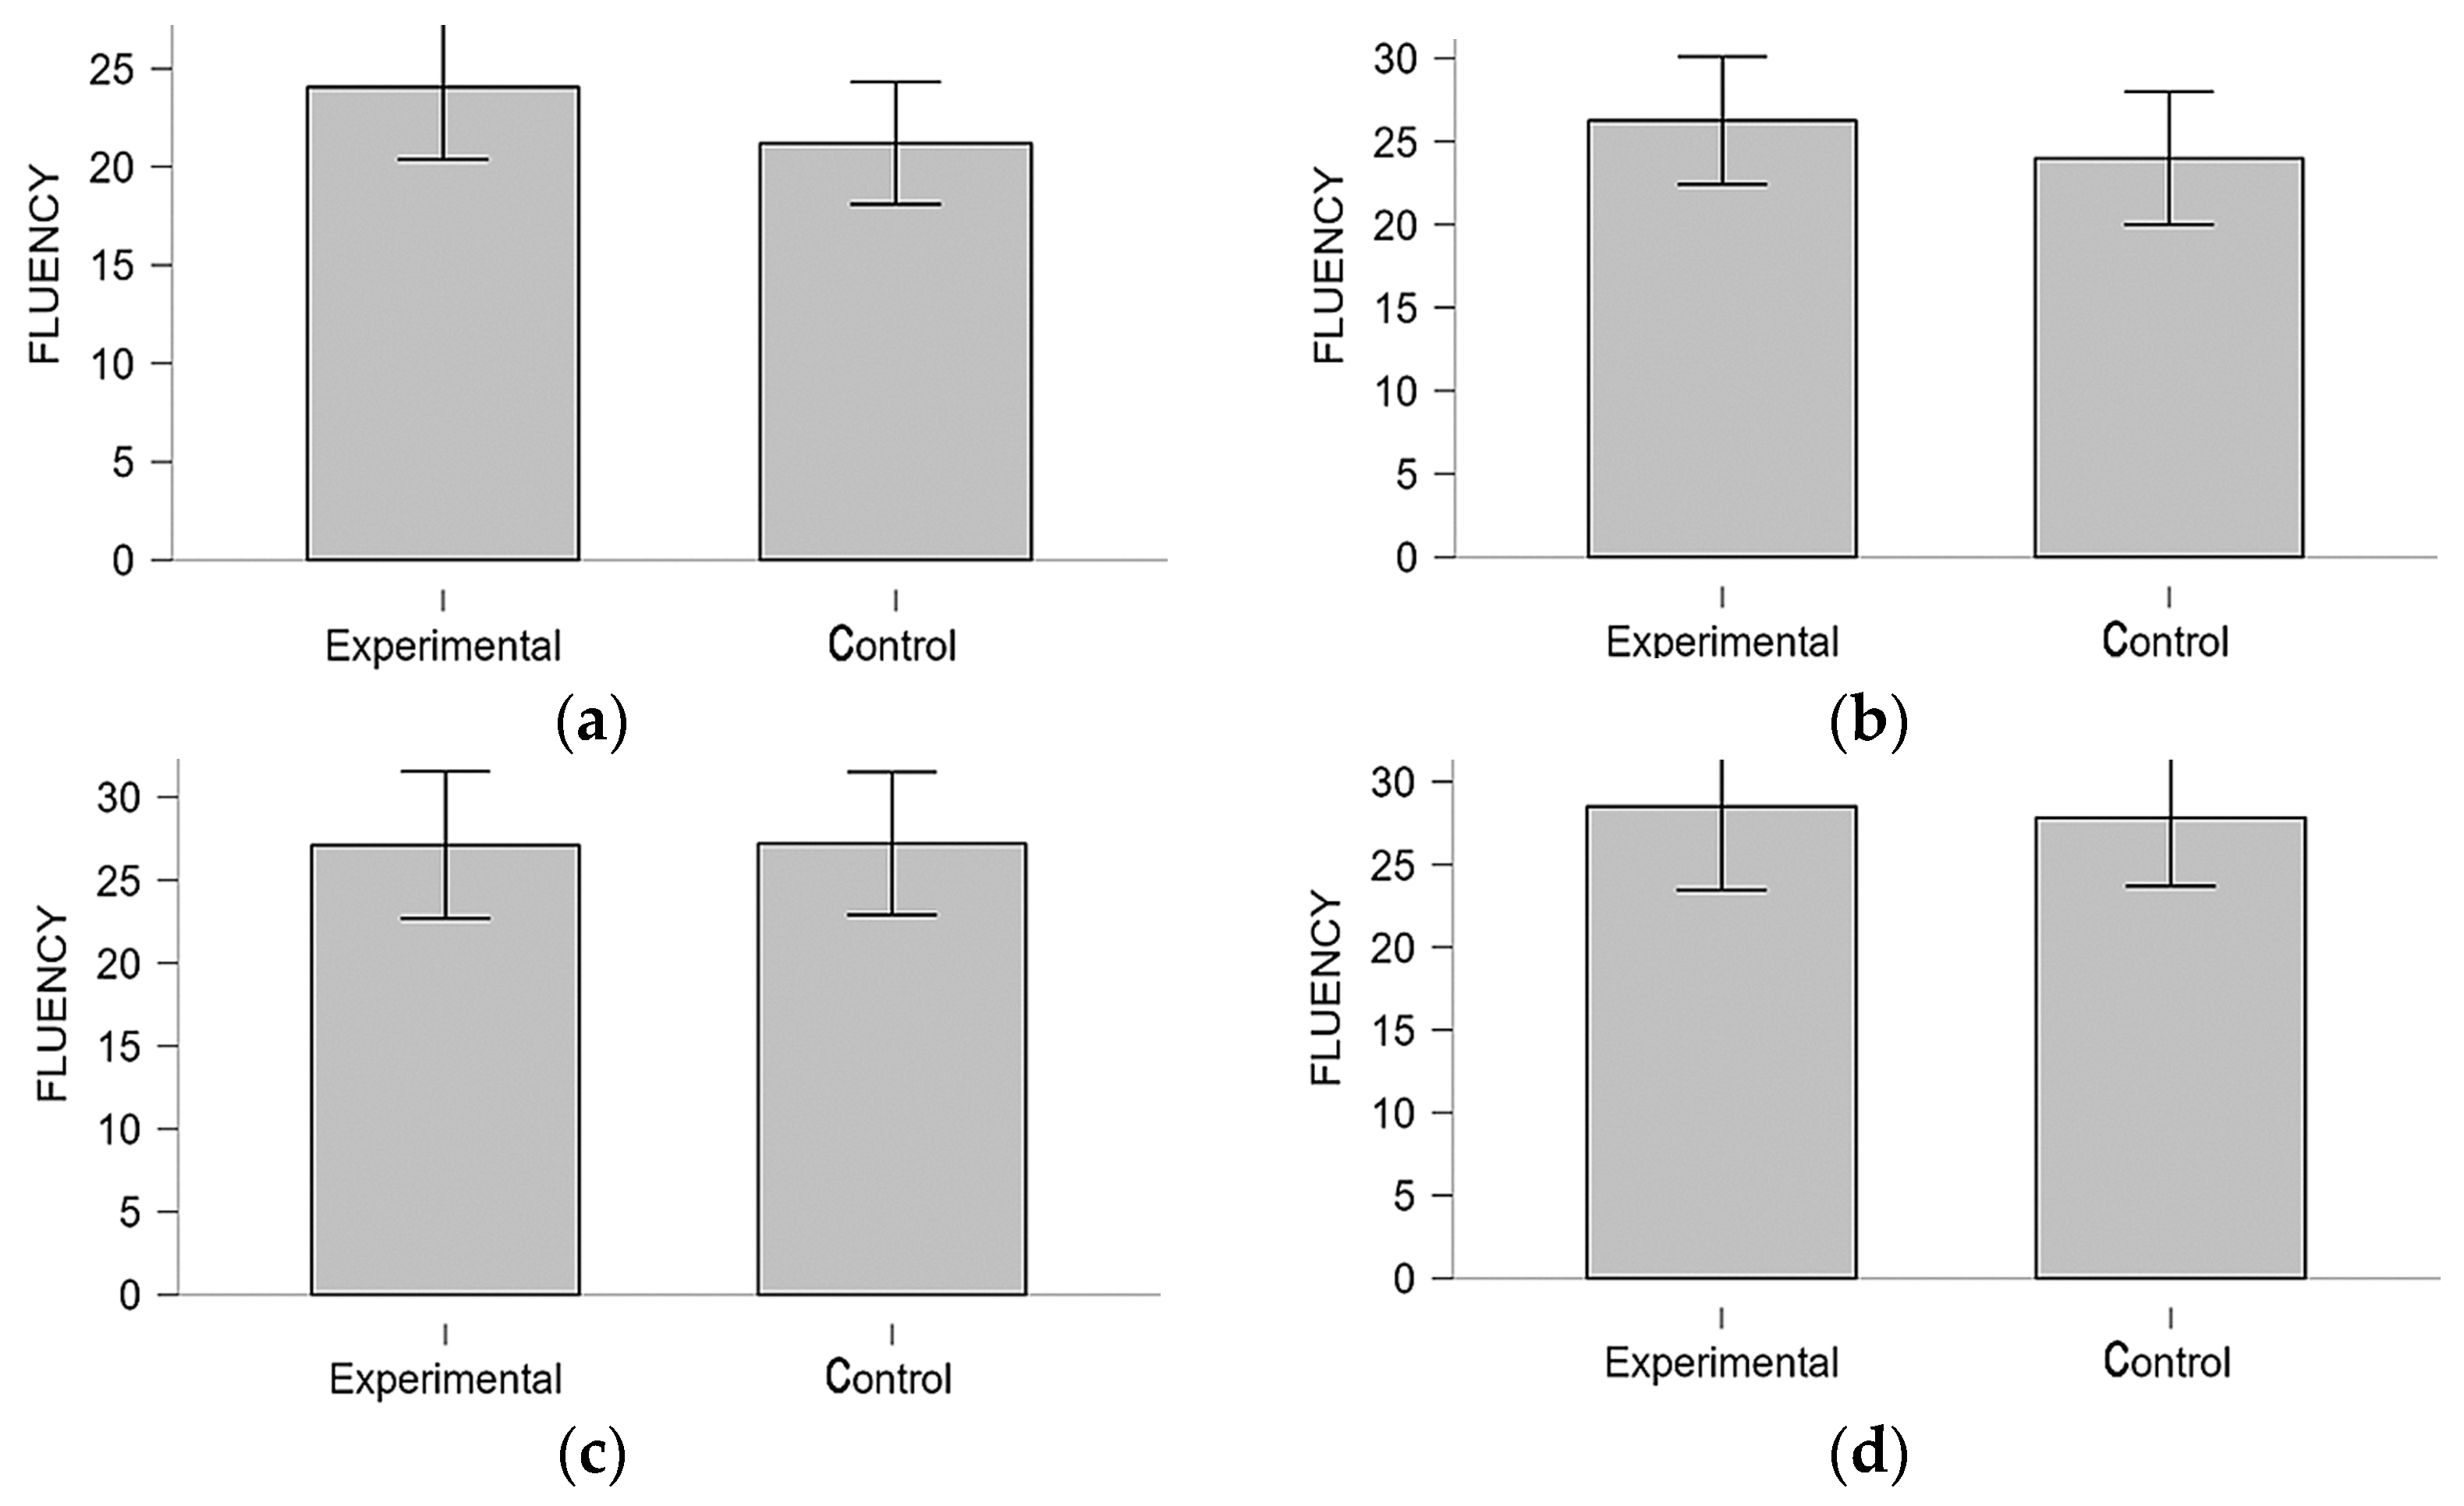
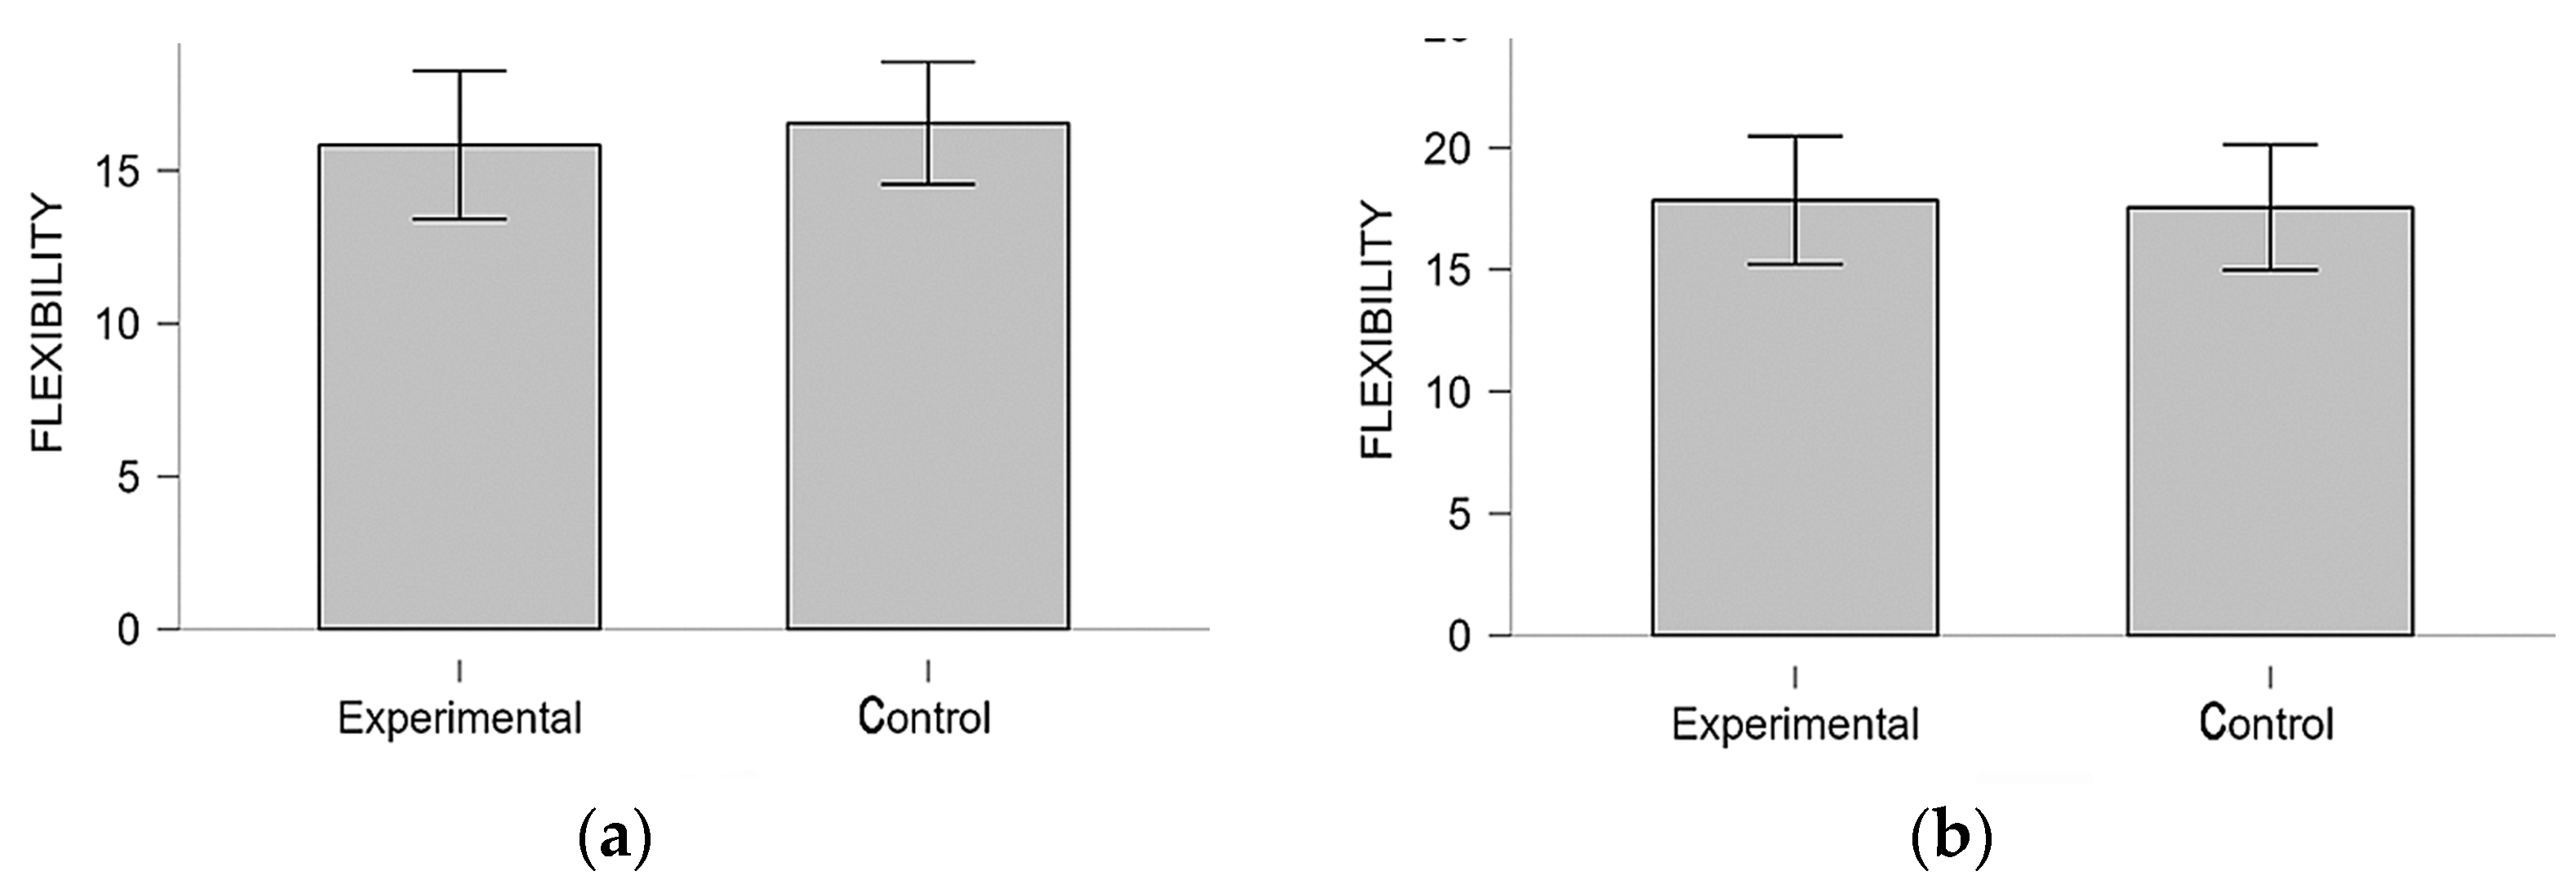
| Mean | 24.056 | 26.263 | 27.118 | 28.526 | 15.833 | 17.842 | 17.000 | 16.000 |
| Std. Deviation | 7.416 | 7.971 | 8.623 | 10.516 | 4.878 | 5.449 | 6.225 | 7.401 |
| Shapiro–Wilk | 0.980 | 0.889 | 0.944 | 0.896 | 0.924 | 0.927 | 0.945 | 0.922 |
| p-value of Shapiro–Wilk | 0.955 | 0.030 | 0.364 | 0.041 | 0.153 | 0.155 | 0.376 | 0.123 |
| Fluency | Flexibility | |||||||
|---|---|---|---|---|---|---|---|---|
| Natural | Natural 2 | Natural 3 | Natural 4 | Natural | Natural 2 | Natural 3 | Natural 4 | |
| Valid | 20 | 20 | 19 | 20 | 20 | 20 | 19 | 20 |
| Mode a | 21.000 | 21.000 | 13.000 | 22.000 | 13.000 | 20.000 | 14.000 | 25.000 |
| Median | 21.000 | 24.500 | 27.000 | 27.500 | 16.500 | 19.000 | 17.000 | 19.500 |
| Mean | 21.200 | 24.000 | 27.211 | 27.850 | 16.550 | 17.550 | 18.158 | 18.950 |
| Std. Deviation | 6.646 | 8.535 | 8.929 | 8.869 | 4.273 | 5.491 | 5.439 | 6.211 |
| Shapiro–Wilk | 0.982 | 0.963 | 0.931 | 0.948 | 0.961 | 0.945 | 0.943 | 0.965 |
| p-value of Shapiro–Wilk | 0.958 | 0.604 | 0.178 | 0.338 | 0.572 | 0.293 | 0.294 | 0.645 |
| Friedman Test | ||||
|---|---|---|---|---|
| Factor | Chi-Squared | df | p | Kendall’s W |
| Fluency | 8.786 | 3 | 0.032 | 0.183 |
| Flexibility | 1.268 | 3 | 0.737 | 0.026 |
| Conover’s Post Hoc Comparisons | |||||||||
|---|---|---|---|---|---|---|---|---|---|
| Fluency | Flexibility | ||||||||
| Factor | T-Stat | df | p | pbonf | T-Stat | df | p | pbonf | |
| Natural | Orange | 0.762 | 45 | 0.450 | 1.000 | 0.916 | 45 | 0.364 | 1.000 |
| Purple | 1.108 | 45 | 0.274 | 1.000 | 0.705 | 45 | 0.484 | 1.000 | |
| Orange | 2.840 | 45 | 0.007 | 0.040 | 0.070 | 45 | 0.944 | 1.000 | |
| Green | Purple | 0.346 | 45 | 0.731 | 1.000 | 0.211 | 45 | 0.833 | 1.000 |
| Orange | 2.078 | 45 | 0.043 | 0.260 | 0.846 | 45 | 0.402 | 1.000 | |
| Purple | Orange | 1.732 | 45 | 0.090 | 0.541 | 0.634 | 45 | 0.529 | 1.000 |
| Independent Samples t-Test; Fluency | ||||||
|---|---|---|---|---|---|---|
| Test | Statistic | df | p | Effect Size | SE Effect Size | |
| Day 1, natural light | Student | 1.252 | 36 | 0.219 | 0.407 | 0.332 |
| Mann–Whitney | 219.000 | 0.260 | 0.217 | 0.188 | ||
| Day 2, green light | Student | 0.855 | 37 | 0.398 | 0.274 | 0.323 |
| Mann–Whitney | 204.000 | 0.704 | 0.074 | 0.185 | ||
| Day 3, purple light | Student | −0.032 | 34 | 0.975 | −0.011 | 0.334 |
| Mann–Whitney | 164.500 | 0.937 | 0.019 | 0.193 | ||
| Day 4, orange light | Student | 0.218 | 37 | 0.829 | 0.070 | 0.321 |
| Mann–Whitney | 202.500 | 0.735 | 0.066 | 0.185 | ||
| Independent Samples t-Test; Flexibility | ||||||
|---|---|---|---|---|---|---|
| Test | Statistic | df | p | Effect Size | SE Effect Size | |
| Day 1, natural light | Student | −0.483 | 36 | 0.632 | −0.157 | 0.326 |
| Mann–Whitney | 154.500 | 0.463 | −0.142 | 0.188 | ||
| Day 2, green light | Student | 0.167 | 37 | 0.869 | 0.053 | 0.320 |
| Mann–Whitney | 185.000 | 0.899 | −0.026 | 0.185 | ||
| Day 3, purple light | Student | −0.596 | 34 | 0.555 | −0.199 | 0.336 |
| Mann–Whitney | −1.351 | 0.185 | −0.433 | 0.328 | ||
| Day 4, orange light | Student | −1.351 | 37 | 0.185 | −0.433 | 0.328 |
| Mann–Whitney | 139.500 | 0.159 | −0.266 | 0.185 | ||
| Figurative Creativity | ||||
|---|---|---|---|---|
| Natural | Green | Purple | Orange | |
| Valid | 18 | 19 | 17 | 19 |
| Mode a | 74.000 | 103.000 | 76.000 | 52.000 |
| Median | 160.000 | 169.000 | 180.000 | 201.000 |
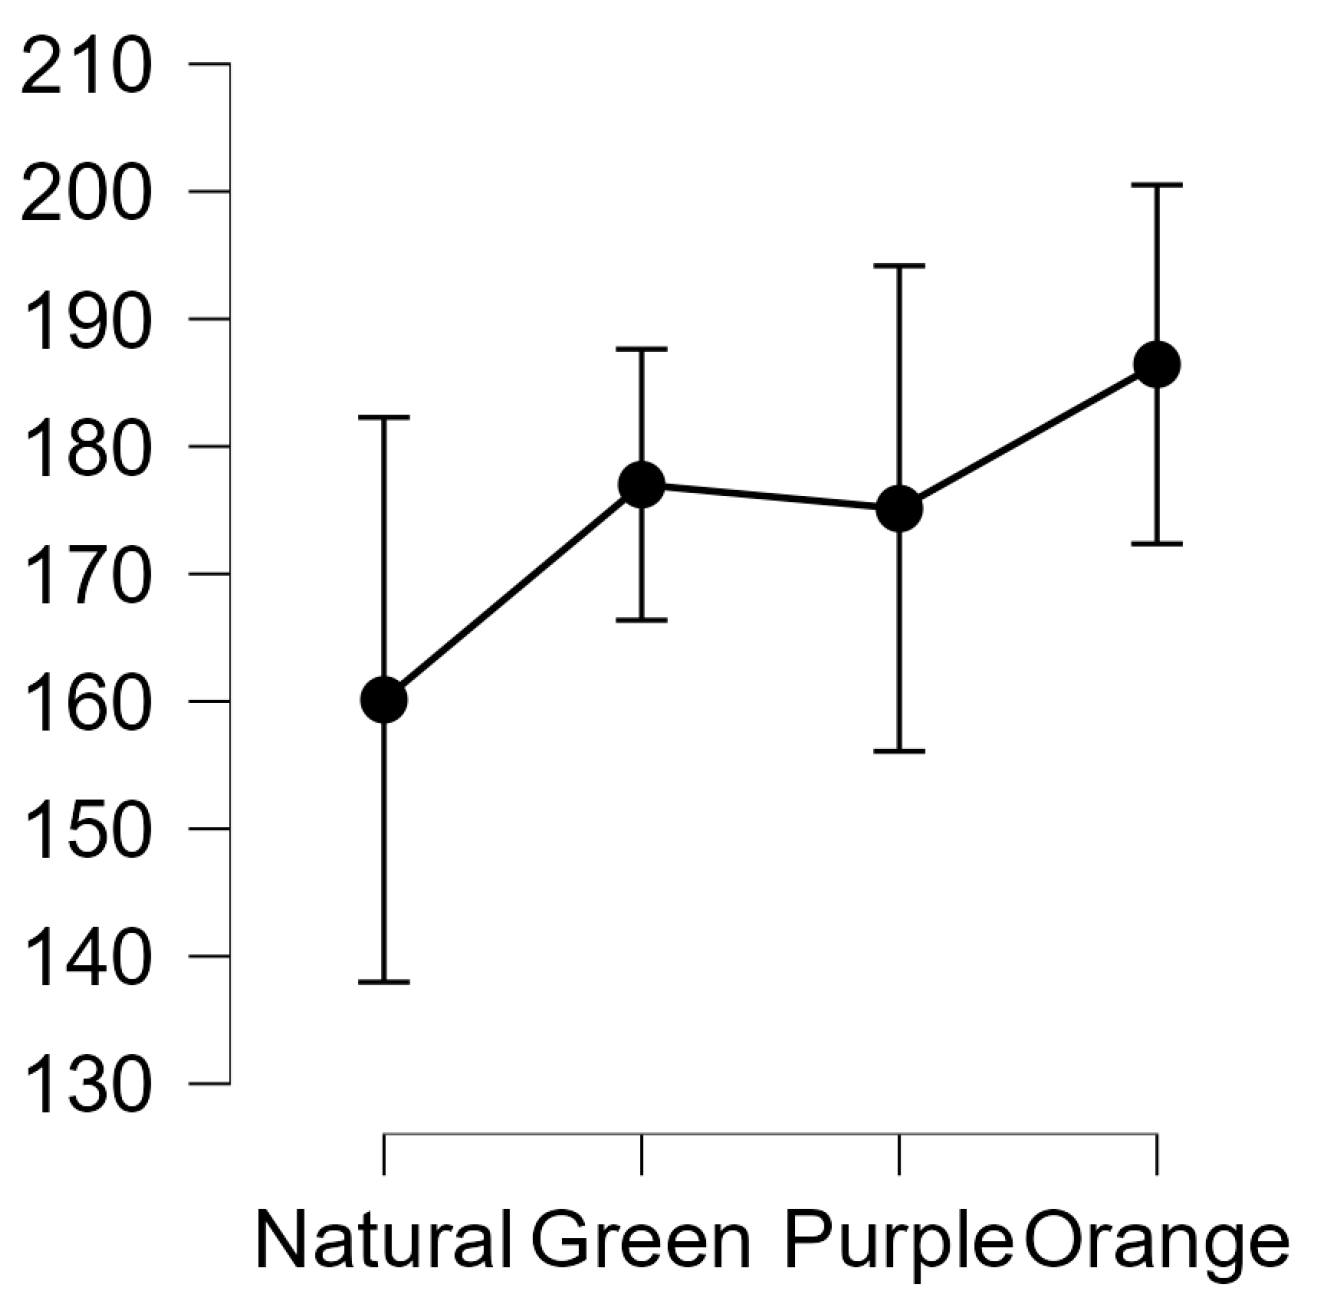
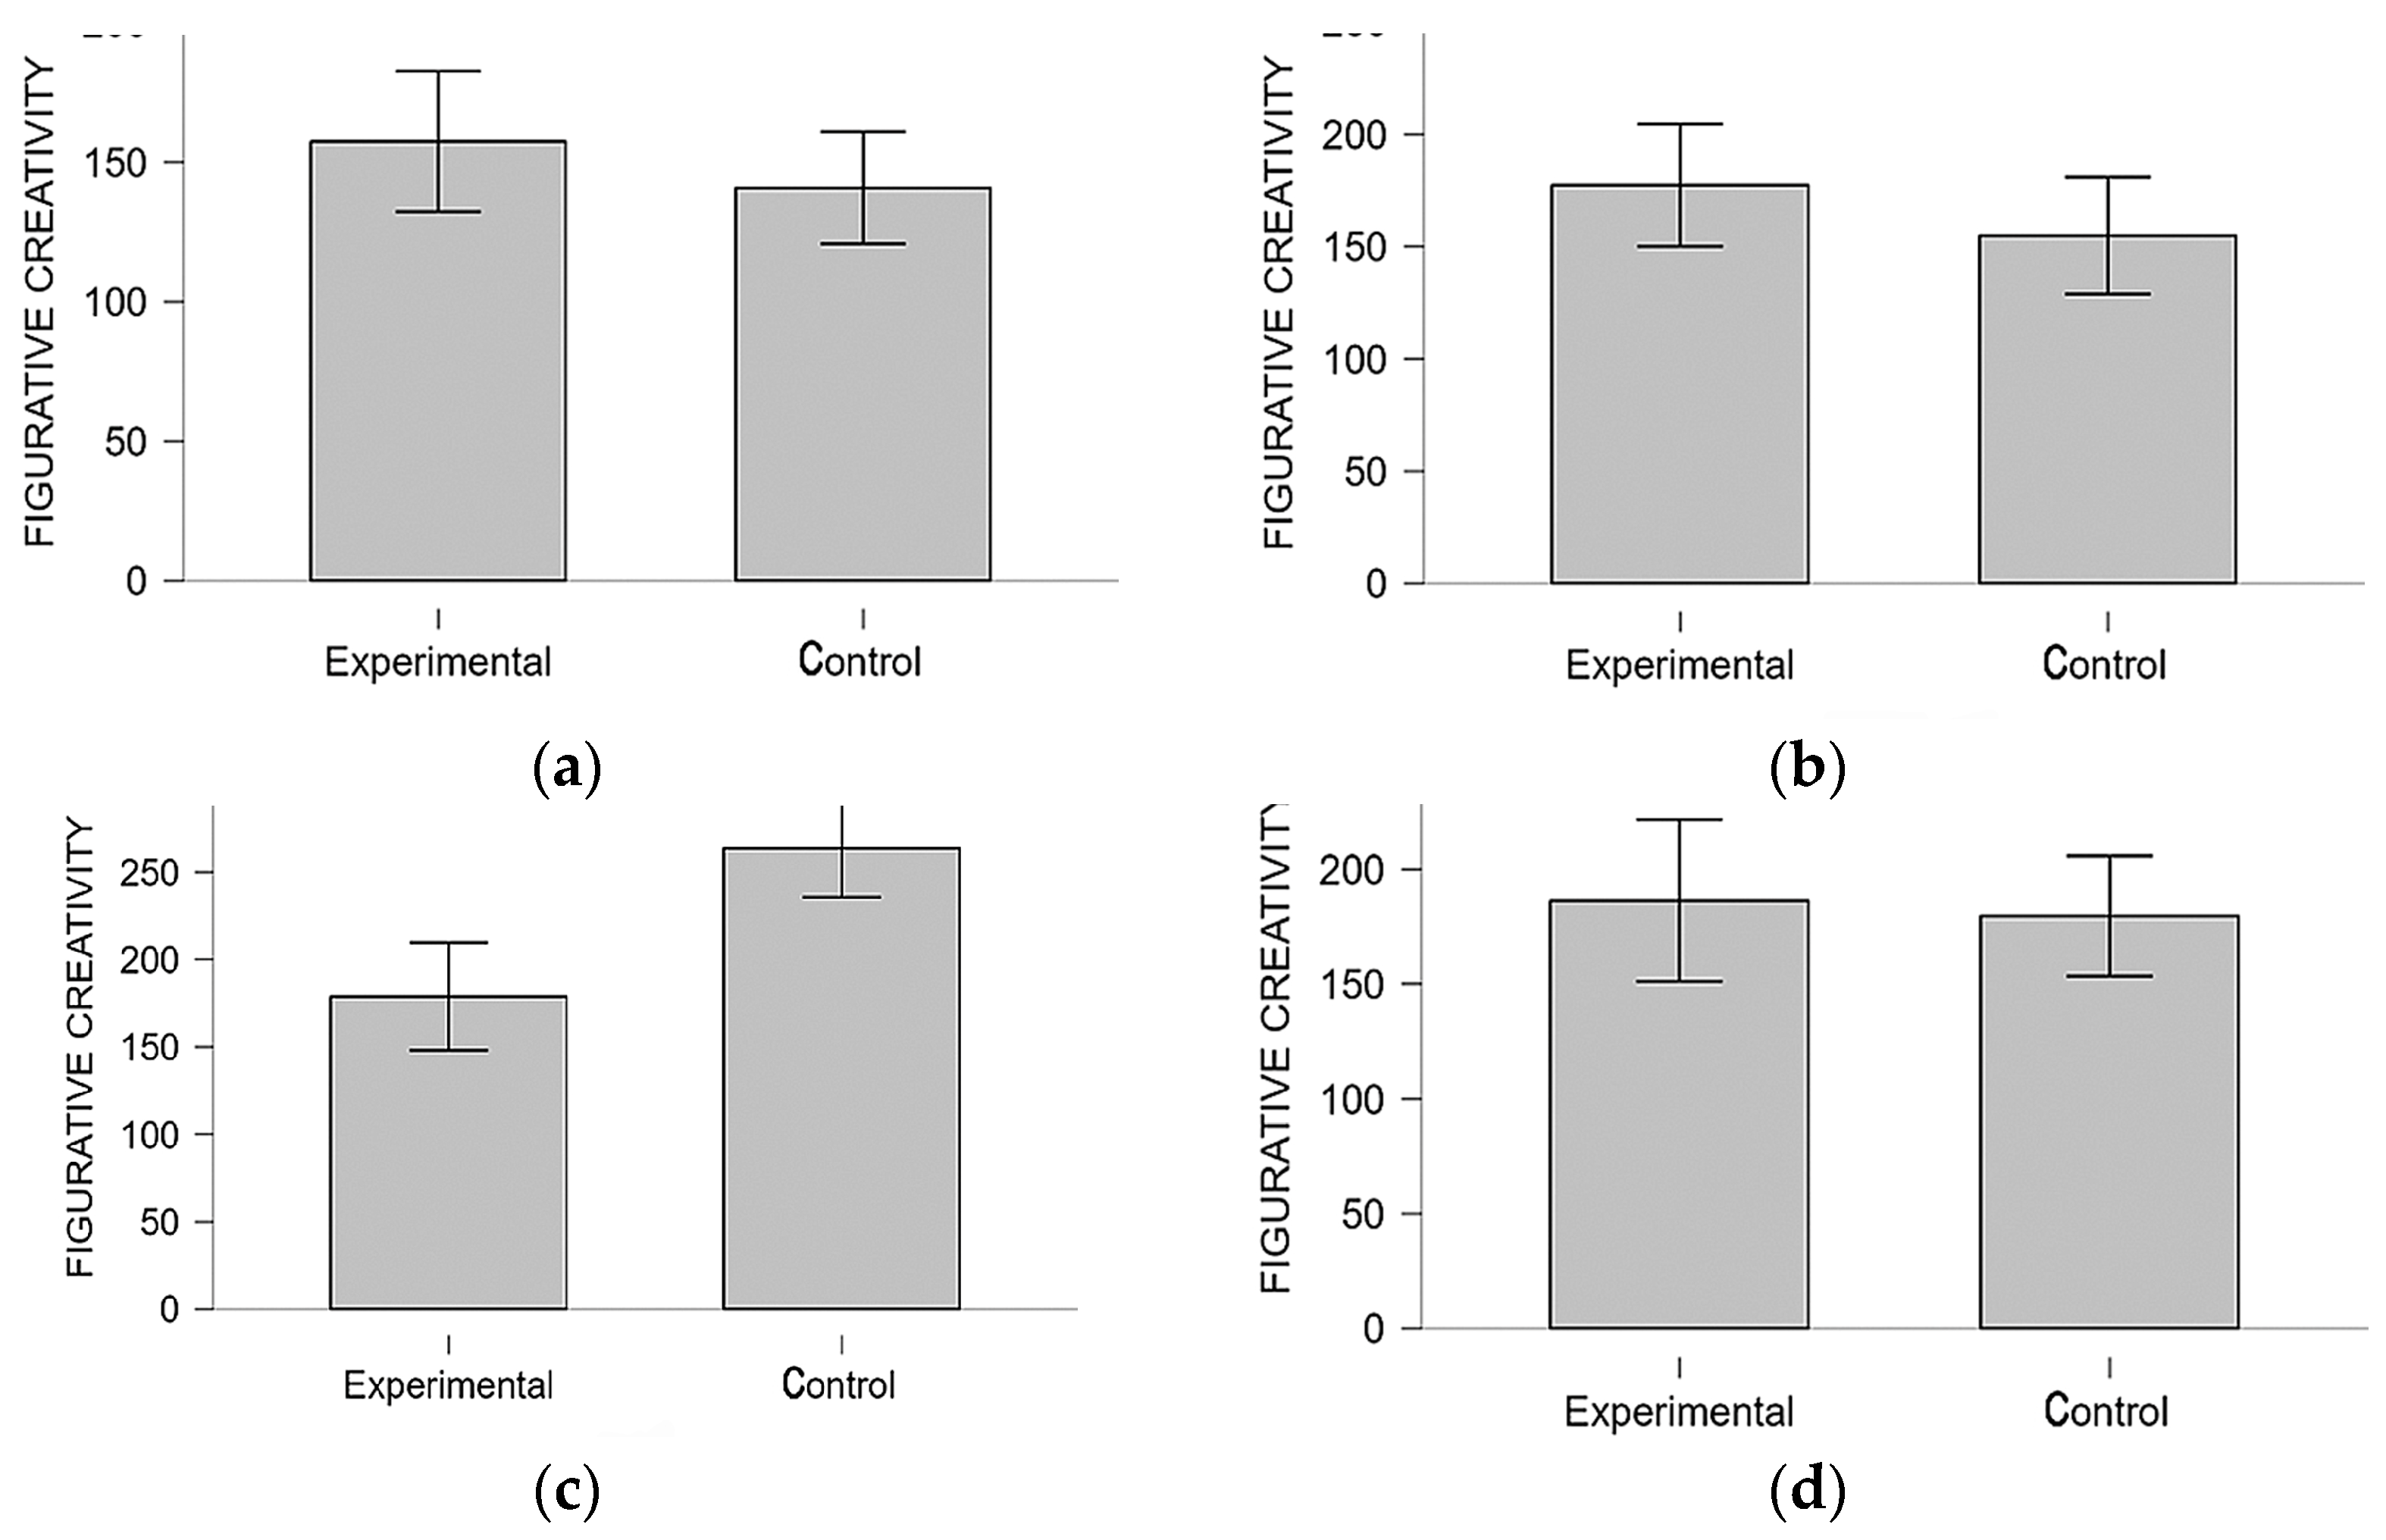
| Mean | 157.389 | 177.316 | 178.824 | 186.368 |
| Std. Deviation | 50.609 | 56.536 | 59.821 | 73.033 |
| Shapiro–Wilk | 0.970 | 0.932 | 0.960 | 0.951 |
| p-value of Shapiro–Wilk | 0.793 | 0.188 | 0.630 | 0.412 |
| Figurative Creativity | ||||
|---|---|---|---|---|
| Natural | Natural 2 | Natural 3 | Natural 4 | |
| Valid | 20 | 20 | 19 | 20 |
| Mode a | 47.000 | 128.000 | 149.000 | 79.000 |
| Median | 140.500 | 154.500 | 165.000 | 175.500 |
| Mean | 140.800 | 154.900 | 174.000 | 179.600 |
| Std. Deviation | 42.930 | 55.660 | 52.097 | 55.935 |
| Shapiro–Wilk | 0.978 | 0.960 | 0.928 | 0.952 |
| p-value of Shapiro–Wilk | 0.910 | 0.547 | 0.156 | 0.403 |
| Friedman Test | ||||
|---|---|---|---|---|
| Factor | Chi-Squared | df | p | Kendall’s W |
| Figurative creativity | 6.000 | 3 | 0.112 | 0.125 |
| Conover’s Post Hoc Comparisons | |||||
|---|---|---|---|---|---|
| Figurative Creativity | |||||
| Factor | T-Stat | df | p | pbonf | |
| Natural | Green | 1.367 | 45 | 0.178 | 1.000 |
| Purple | 0.684 | 45 | 0.498 | 1.000 | |
| Orange | 2.324 | 45 | 0.025 | 0.148 | |
| Green | Purple | 0.684 | 45 | 0.498 | 1.000 |
| Orange | 0.957 | 45 | 0.344 | 1.000 | |
| Purple | Orange | 1.640 | 45 | 0.108 | 0.647 |
| Independent Samples t-Test; Flexibility | ||||||
|---|---|---|---|---|---|---|
| Test | Statistic | df | p | Effect Size | SE Effect Size | |
| Day 1, natural light | Student | 1.093 | 36 | 0.282 | 0.355 | 0.330 |
| Mann–Whitney | 209.500 | 0.396 | 0.164 | 0.188 | ||
| Day 2, green light | Student | 1.248 | 37 | 0.220 | 0.400 | 0.327 |
| Mann–Whitney | 220.000 | 0.407 | 0.158 | 0.185 | ||
| Day 3, purple light | Student | −4.315 | 34 | <0.001 | −1.441 | 0.415 |
| Mann–Whitney | 51.000 | <0.001 | −0.684 | 0.193 | ||
| Day 4, orange light | Student | 0.326 | 37 | 0.746 | 0.104 | 0.321 |
| Mann–Whitney | 201.500 | 0.757 | 0.061 | 0.185 | ||
| Extreme Values of the Dependent Variables (Dimensions and Indicators Included) | ||||
|---|---|---|---|---|
| Maximum Value | Minimum Value | |||
| Mean | Median | Mean | Median | |
| Net Attention (level over 60) | 45.250 Natural light4 (control group) | 46.500 Natural light4 (control group) | 34.900 Natural light1 (control group) | 33.000 Natural light1 (control group) |
| Impulsivity Control (level over 100) | 91.900 Natural light4 (control group) | 96.300 Natural light4 (control group) | 87.353 Green light (experimental group) | 87.500 Green light (experimental group) |
| Originality | 127.526 Orange light (experimental group) | 138.000 Orange light (experimental group) | 87.250 Natural light1 (control group) | 80.000 Natural light1 (control group) |
| Elaboration | 22.421 Green light (experimental group) | 18.500 Natural light (experimental group) | 12.471 Purple light (experimental group) | 11.000 Purple and orange light (experimental group) |
| Fluency | 28.526 Orange light (experimental group) | 28.000 Orange light (experimental group) | 21.200 Natural light1 (control group) | 21.000 Natural light1 (control group) |
| Flexibility | 18.950 Green light Natural light4 (control group) | 19.500 Green light Natural light4 (control group) | 14.000 Natural light (experimental group) | 15.833 Natural light (experimental group) |
| Figurative Creativity | 186.368 Orange light (experimental group) | 201.000 Orange light (experimental group) | 140.800 Natural light1 (control group) | 140.500 Natural light1 (control group) |
Disclaimer/Publisher’s Note: The statements, opinions and data contained in all publications are solely those of the individual author(s) and contributor(s) and not of MDPI and/or the editor(s). MDPI and/or the editor(s) disclaim responsibility for any injury to people or property resulting from any ideas, methods, instructions or products referred to in the content. |
© 2024 by the authors. Licensee MDPI, Basel, Switzerland. This article is an open access article distributed under the terms and conditions of the Creative Commons Attribution (CC BY) license (https://creativecommons.org/licenses/by/4.0/).
Share and Cite
Quiles-Rodríguez, J.; Palau, R. New Evidence on the Influence of Coloured Lighting on Students’ Cognitive Processes. Electronics 2024, 13, 3005. https://doi.org/10.3390/electronics13153005
Quiles-Rodríguez J, Palau R. New Evidence on the Influence of Coloured Lighting on Students’ Cognitive Processes. Electronics. 2024; 13(15):3005. https://doi.org/10.3390/electronics13153005
Chicago/Turabian StyleQuiles-Rodríguez, José, and Ramon Palau. 2024. "New Evidence on the Influence of Coloured Lighting on Students’ Cognitive Processes" Electronics 13, no. 15: 3005. https://doi.org/10.3390/electronics13153005
APA StyleQuiles-Rodríguez, J., & Palau, R. (2024). New Evidence on the Influence of Coloured Lighting on Students’ Cognitive Processes. Electronics, 13(15), 3005. https://doi.org/10.3390/electronics13153005


