Article

New Evidence on the Influence of Coloured Lighting on Students’ Cognitive Processes

by
José Quiles-Rodríguez
* and
Ramon Palau
Department of Pedagogy, URV, Campus Sescelades, Carretera de Valls s/n, 43007 Tarragona, Spain
*
Author to whom correspondence should be addressed.
Electronics 2024, 13(15), 3005; https://doi.org/10.3390/electronics13153005
Submission received: 3 July 2024 / Revised: 27 July 2024 / Accepted: 29 July 2024 / Published: 30 July 2024

Abstract

:
Although there is a large amount of scientific literature on the impact of colour on learning, there is considerably less research on the impact of coloured lighting on learning. Numerous studies have explored this traditional approach, but their results are inconsistent and lack systematic rigour. However, the logical technological evolution towards coloured lighting remains a nascent field, with most research focusing on colour temperature (CCT) rather than coloured lighting per se. Studies such as this one highlight the benefits of coloured LED lighting on students’ cognitive processes, as it is a technology which can overcome the limitations of traditional colour applications by introducing the concept of “dynamic colour” as a key component of smart classrooms that can be integrated into artificial intelligence (AI)-based decision making. This study, conducted in a primary school classroom, employed a quasi-experimental design with a pre-test and a control group, and had a duration of three months. The effect of coloured lighting on students’ cognitive processes, such as attention, impulsivity control and figurative creativity, divided into four dimensions, was investigated. Descriptive, variance-based and comparative analyses of the overall results reveal that coloured light significantly influences cognitive processes, and some results are even generalisable across the variables analysed.

1. Introduction

The impact of colour on learning environments has been extensively researched for decades, but the shift towards the examination of coloured lighting remains poorly documented; coloured lighting refers to the strategic use of different colours of light in the classroom environment to influence students’ academic performance and well-being and thus their learning. In this regard, Quiles-Rodríguez et al. [1] provide a systematic review of the literature on the impact of colour as traditionally understood, that is, in its physical application to the elements of the classroom environment without the intervention of coloured light. After a rigorous analysis of colour elements in the classroom, as subjects of particular consideration or in conjunction with other environmental elements, they end by systematising the previous literature, amounting to 35 papers considered for review, into two large groups: research that recognises the influence of colour on the cognitive processes of students and influence on affective-social processes.
On the other hand, although it is true that the relationship between correlated light temperature (CCT) and brightness and learning has been widely studied, mainly for its effects on the academic performance, attention-concentration and emotional-motivational state of students, as will be shown in later paragraphs of this section, there are hardly any purely educational references on the explicit implications of the colour of light (measured in nanometres -nm-) [2]. Not being able to confuse the two relevant parameters (colour temperature—CCT—and colour of light), which are both different in nature and measured, respectively, by different units (Kelvin the first one and nanometres the second one), authors such as Suh et al. [3], Rajae-Joordens [4] and Kombeiz et al. [5] have produced the first milestones in this incipient field of educational research on the colour of light, which has nevertheless been studied for years in other fields of research such as interior design [6], agriculture [7,8], medicine [9], or even astronautics [10].
Traditional studies on colours, understood as their physical application to elements, often lack systematic and holistic methodologies [11], a deficiency that also applies to the scarce research on coloured lighting [12]. For example, Von Castell et al. [13] claim that the effects of environmental colour are so inconsistent that it is difficult to deduce practical applications. Similarly, some studies suggest that visual noise and colour changes can negatively affect school performance [14]. In contrast, other researchers have made efforts to increase the rigour and systematic nature of their studies on environmental influences, including colour, within the framework of large, longitudinal investigations [15,16].
The situation becomes even more worrying when we focus specifically on students’ cognitive processes, a field which refers to the set of brain activities separate from socio-affective processes [17]. Although some of the traditional studies on environmental colour collected by Quiles-Rodríguez [1] have related physical colour to cognition, as shown by Mehta et al. [18], Duyan et al. [19], Tuszyńska-Bogucka et al. [20] and Pourbagher et al. [21], specific research on coloured lighting is remarkably scarce. Only a few studies, such as those by Kombeiz et al. [5], which examine the effects of coloured lighting on creativity at a German university, and earlier research in the primary school context [11], address this issue. Although there is some further research on the impact of colour on affective processes [22], this study focuses on cognitive effects, trying to help fill the significant gap in the literature. Special mention should be made of our inspiring precedent, the work of Quiles-Rodríguez et al. [12], who carried out an extensive exploratory intervention in a primary school in search of cognitive, academic and emotional effects caused by the presence of coloured lighting in the classroom, reaching conclusions sufficient to lead us to continue researching its current impact on cognitive processes.
However, the literature on correlated colour temperature (CCT) and its impact on cognitive processes is more substantial. For example, Mogas-Recalde et al. [23] review 18 studies exploring the connection between CCT and cognitive functions, while Llinares et al. [24] examine the effects of CCT on attention and memory. In addition, Hviid et al. [25] investigate how CT, combined with ventilation, influences cognitive processes such as concentration, logical reasoning and processing speed. Despite some overlap with our study, these works do not focus on our specific variable, “coloured lighting”. Mogas-Recalde et al. [23] also advocate “dynamic lighting” in smart classrooms, a recommendation echoed by Poldma [6] and Suh et al. [3], who directly address “coloured lighting” rather than just CCT. This aspect of the dynamism of light, understood as the authors cited above do, is not only fundamental in smart classrooms, but opens an important door towards its management by artificial intelligence (AI) allowing for the personalisation and adaptability of teaching and learning [26]
In the following sections we will explain the materials and methods used in the experimental situation designed; we will then show the results obtained for each variable from a triple analysis (descriptive, variance-based and comparative) to finally reach clear conclusions after the necessary discussion.

2. Materials and Methods

2.1. Statement of the Problem, Objectives, Questions and Hypotheses

Based on the previous state of the art, our research has the following general objectives:
  • GO1. To investigate how different configurations of coloured lighting improve specific cognitive processes in primary school students.
  • GO2. To assess the effect of “dynamic colour” on students’ cognitive processes in primary school classrooms.
Based on this, and considering previous research that examined the effects of various coloured lighting scenarios on students [12], we set out to further investigate cognitive processes with a new experimental design and an expanded sample size. In this way, the weak robustness of the baseline exploratory study, precisely because of its exploratory nature and incomplete counterbalanced design, could now be overcome, while additionally gaining in consistency, reliability and validity (as will be seen in the next section), allowing more rigorous conclusions to be drawn. Thus, the proposed general objectives are concretised through the following research questions:
  • RQ1. Which configurations of coloured lighting enhance figurative creativity among primary school students in classroom environments?
  • RQ2. Which configurations of coloured lighting enhance net attention among primary school students in classroom environments?
  • RQ3. Which configurations of coloured lighting enhance impulsivity control among primary school students in classroom environments?
  • RQ4. What possibilities does “dynamic colour” offer to enhance students’ cognitive processes in primary classrooms?
Since hypotheses serve as speculative solutions to the research problem [27], it is essential that they are empirically tested [28]. Therefore, the hypotheses of this study are formulated as follows:
  • H1. Coloured lighting configurations in primary school classrooms help to enhance students’ figurative creativity.
  • H2. Coloured lighting configurations in primary school classrooms help to enhance students’ net attention.
  • H3. Coloured light configurations in primary school classrooms help to enhance students’ impulsivity control.
  • H4. The use of “dynamic colours” makes it possible to personalise the coloured lighting to adapt it to the different cognitive processes of the students.

2.2. Methodology

This research employs a quasi-experimental design with a control group and a pretest, very similar to what Campbell et al. [29] classify as an “equivalent materials design”. Over a period of three months, four measurements were made for each dependent variable and its dimensions: a pretest and three post-test measurements after the application of coloured light scenarios. These scenarios serve as the independent variable, using colours consistent with those studied in Quiles-Rodríguez et al. [12] and defined by Suh et al. [3], although with some variations in the colour sequence. The “natural light” condition combines minimal outdoor light with standard indoor lighting, while the coloured light scenarios use LED bulbs of the colours recommended by Suh et al. [3], which are commonly found in natural settings, with a slight infusion of outdoor light to mitigate any perceived sense of confinement, as previously expressed by students.
As indicated in the introduction, the effects of classroom light (relative to CCT and brightness) on academic performance, attention-concentration and emotional state-motivation are among the most recurrent themes in the literature [2]. But this is so not only in relation to lighting as an independent variable, but also in relation to colour as traditionally understood [1]. Without being able to address them in their entirety, we do consider attention (and the control of impulsivity intimately linked to it) to be crucial; this is because of its tradition in the scientific community but also because of the importance with which it is currently being treated historically and socially, especially when it comes to minors [30]; as we also consider creativity to be particularly relevant, especially as praised by the educational legislation of the Western world in its highlighting of the cognitive processes derived from Bloom’s taxonomy as the basis for good academic performance [31,32]. Therefore, we have analysed the following dependent variables, of which we present a quick graphical overview in Figure 1:
  • VD1. Net attention. By net attention we mean the ability of an individual student to maintain sustained and efficient focus in performing a task that requires visual discrimination of similar stimuli over a given period of time. Central to its measurement are selective attention and perceptual speed, as well as the accuracy with which a person can identify minute differences between a series of presented visual stimuli.
  • VD2. Impulsivity control. This variable refers to the ability of an individual learner to regulate and manage his or her immediate and impulsive responses when presented with a task that requires visual discrimination and sustained attention. This control is manifested in the ability to avoid impulsive errors, such as incorrectly marking pictures, by taking the time necessary to ensure accuracy in identifying differences between visual stimuli.
  • VD3. Figurative creativity. This is measured through its four dimensions: originality, elaboration, fluency and flexibility. This variable is intended to measure an individual student’s ability to generate original and useful ideas by interpreting and modifying visual stimuli. This type of creativity manifests itself in the ability to think divergently and to create new forms, images and designs from provided graphic elements. The four dimensions mentioned above which constitute the variable are the very ones that the test we will use establishes as integral to figurative creativity and, therefore, are necessary for its quantification.
The instruments used to collect data on the dependent variables were identical to those used by Quiles-Rodríguez et al. [12]: the “Faces Test” provides measures for both net attention and impulsivity-control within an application time of only 3 min [33]; the “Torrance Creativity Test”, adapted by Artiles et al. [34], assesses figurative creativity and its different dimensions in three practical blocks of 10 min each; both tests treat the dependent variables clearly as quantitative ratio variables, in which net attention can obtain values from 0 to 60, impulsivity control can reach from 0 to 100 and figurative creativity can reach from 0 to values close to 300. The instruments, in addition to being adapted to the aim of the study, have been used previously in similar research and are suitable for the ages of the students studied. The reliability analysis (Cronbach’s alpha) for the set of instruments results in α = 0.700, with α = 0.738 for the set of instruments constituting the variable “figurative creativity” and α = 0.610 for the attention tests. The research design, as already stated, is closely aligned with the “equivalent materials design” defined by Campbell et al. [29], ensuring rigorous internal validity despite some limitations in external validity, as pointed out by the authors’ theoretical model. In order to improve this validity, efforts were made to minimise extraneous variables, although it was recognised that it was impossible to isolate them completely, especially in the standardised classroom environment in which the tests were conducted.
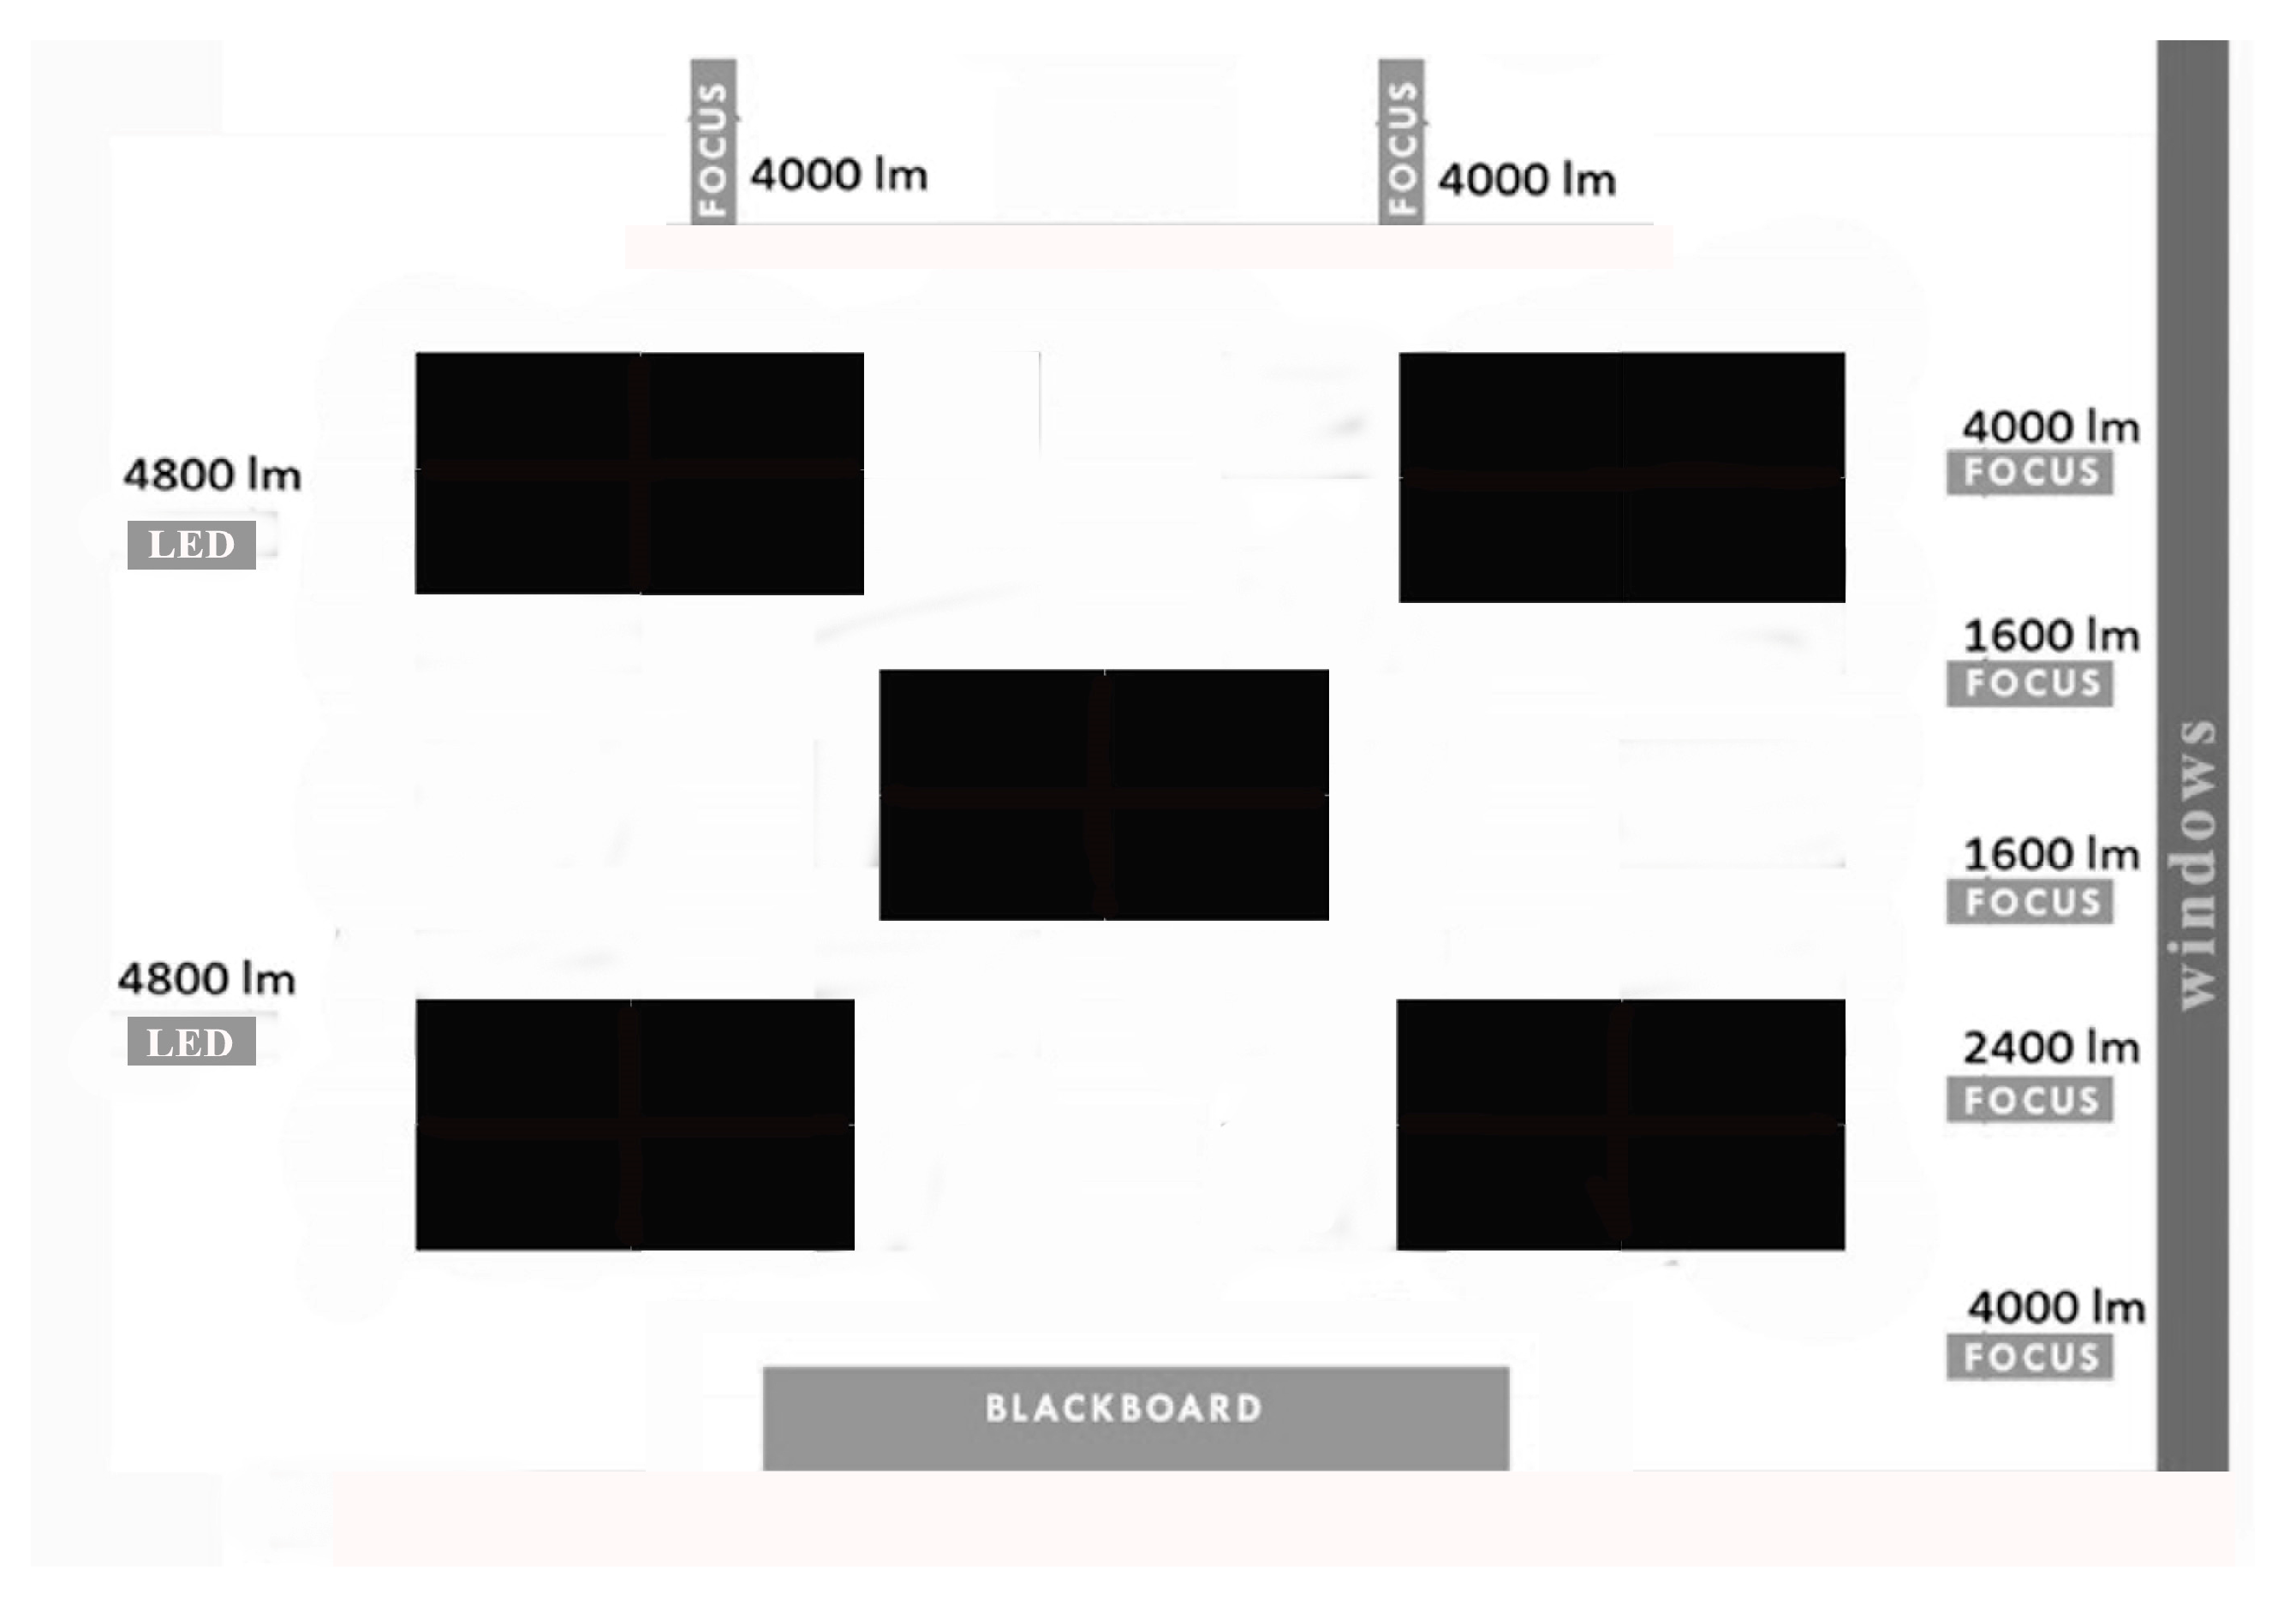
  • We aimed to reduce the impact of weather conditions on the lighting conditions, minimising their influence, but without creating a sense of confinement for the students due to a total lack of natural light. To increase the sample size, we tested all students in the experimental group each day, foregoing a counterbalanced design.
  • Coloured lights were introduced one month prior to data collection and integrated weekly into the teachers’ regular classroom activities to mitigate potential Hawthorne or motivational effects.
  • Memory and learning effects, as outlined by Chacón-Moscoso et al. [35], were addressed by spacing pretest data collection one month after the first light scenario, with subsequent light scenarios spaced two weeks apart. Additionally, to prevent the influencing of students’ behaviour and affective processes, the study’s purpose was not disclosed, and all activities were presented as routine classroom procedures.
  • To further avoid memory effects, the order of the “coloured light” scenarios was altered compared to previous research.

2.3. Sample and Context of the Study, Experimental Situation

The participants were 20 fifth-year primary school students from a public school in a small rural town in Andalusia, Spain where farming predominates, and the socio-economic index is average. This non-probabilistic sample was formed by intact group-classes, maintaining the school’s existing configuration. The students’ ages ranged from 10 to 12 years. They were not informed about the research and perceived it as a regular classroom activity. The experimental group consisted of the class in which the necessary technological interventions for coloured lighting were implemented. The classroom was equipped with coloured LED spotlights (Figure 2), and the light levels were measured using the “evo lightspectrum pro” application. Measurements were taken daily after the tests without the students present. Each scenario had 20 measurements—one per student table—and a smart device was used to record the data. Three values were considered in each measurement: luminance (lx), CCT colour temperature (K), and light colour (nm). The average values for each colour scenario are presented in Table 1 for the experimental group and in Table 2 for the control group. The details of the whole experimental process can be seen in Figure 3.

2.4. Ethical Considerations

To conduct the study with minors, explicit informed consent was obtained from their parents. The parents were provided with an information sheet detailing all aspects of the study, in compliance with European and national legislation (General Data Protection Regulation 679, [36]; Organic Law 3, [37]). This procedure was communicated to the Research Ethics Committee on People, Society and Environment (CEIPSA) of the Rovira i Virgili University, which granted its approval.

3. Results

The results of the Shapiro test demonstrating non-normality for most variables, combined with the small sample size (20 or less in all cases), as well as the lack of homoscedasticity according to Levene’s test, necessitated a non-parametric analysis of the data. Each dependent variable and its dimensions will be presented in subsections grouped as much as possible, optimising space by minimising the use of additional tables and figures. For each variable, descriptive data, an analysis of variance according to the different coloured light scenarios (using Friedman’s test—ANOVA for repeated measures—and Conover’s post hoc test, incorporating Bonferroni corrections) and a third analysis comparing the experimental and control groups on all days and variables/dimensions using the Mann–Whitney test are provided.
In addition, a final subsection summarises the maximum and minimum values of all variables and their dimensions, together with their means and medians, providing a quick overview.
A significance level (α) of 0.05 was systematically applied to establish the significance of the results. Statistical analyses were performed with Jasp, version 0.14.1.0.

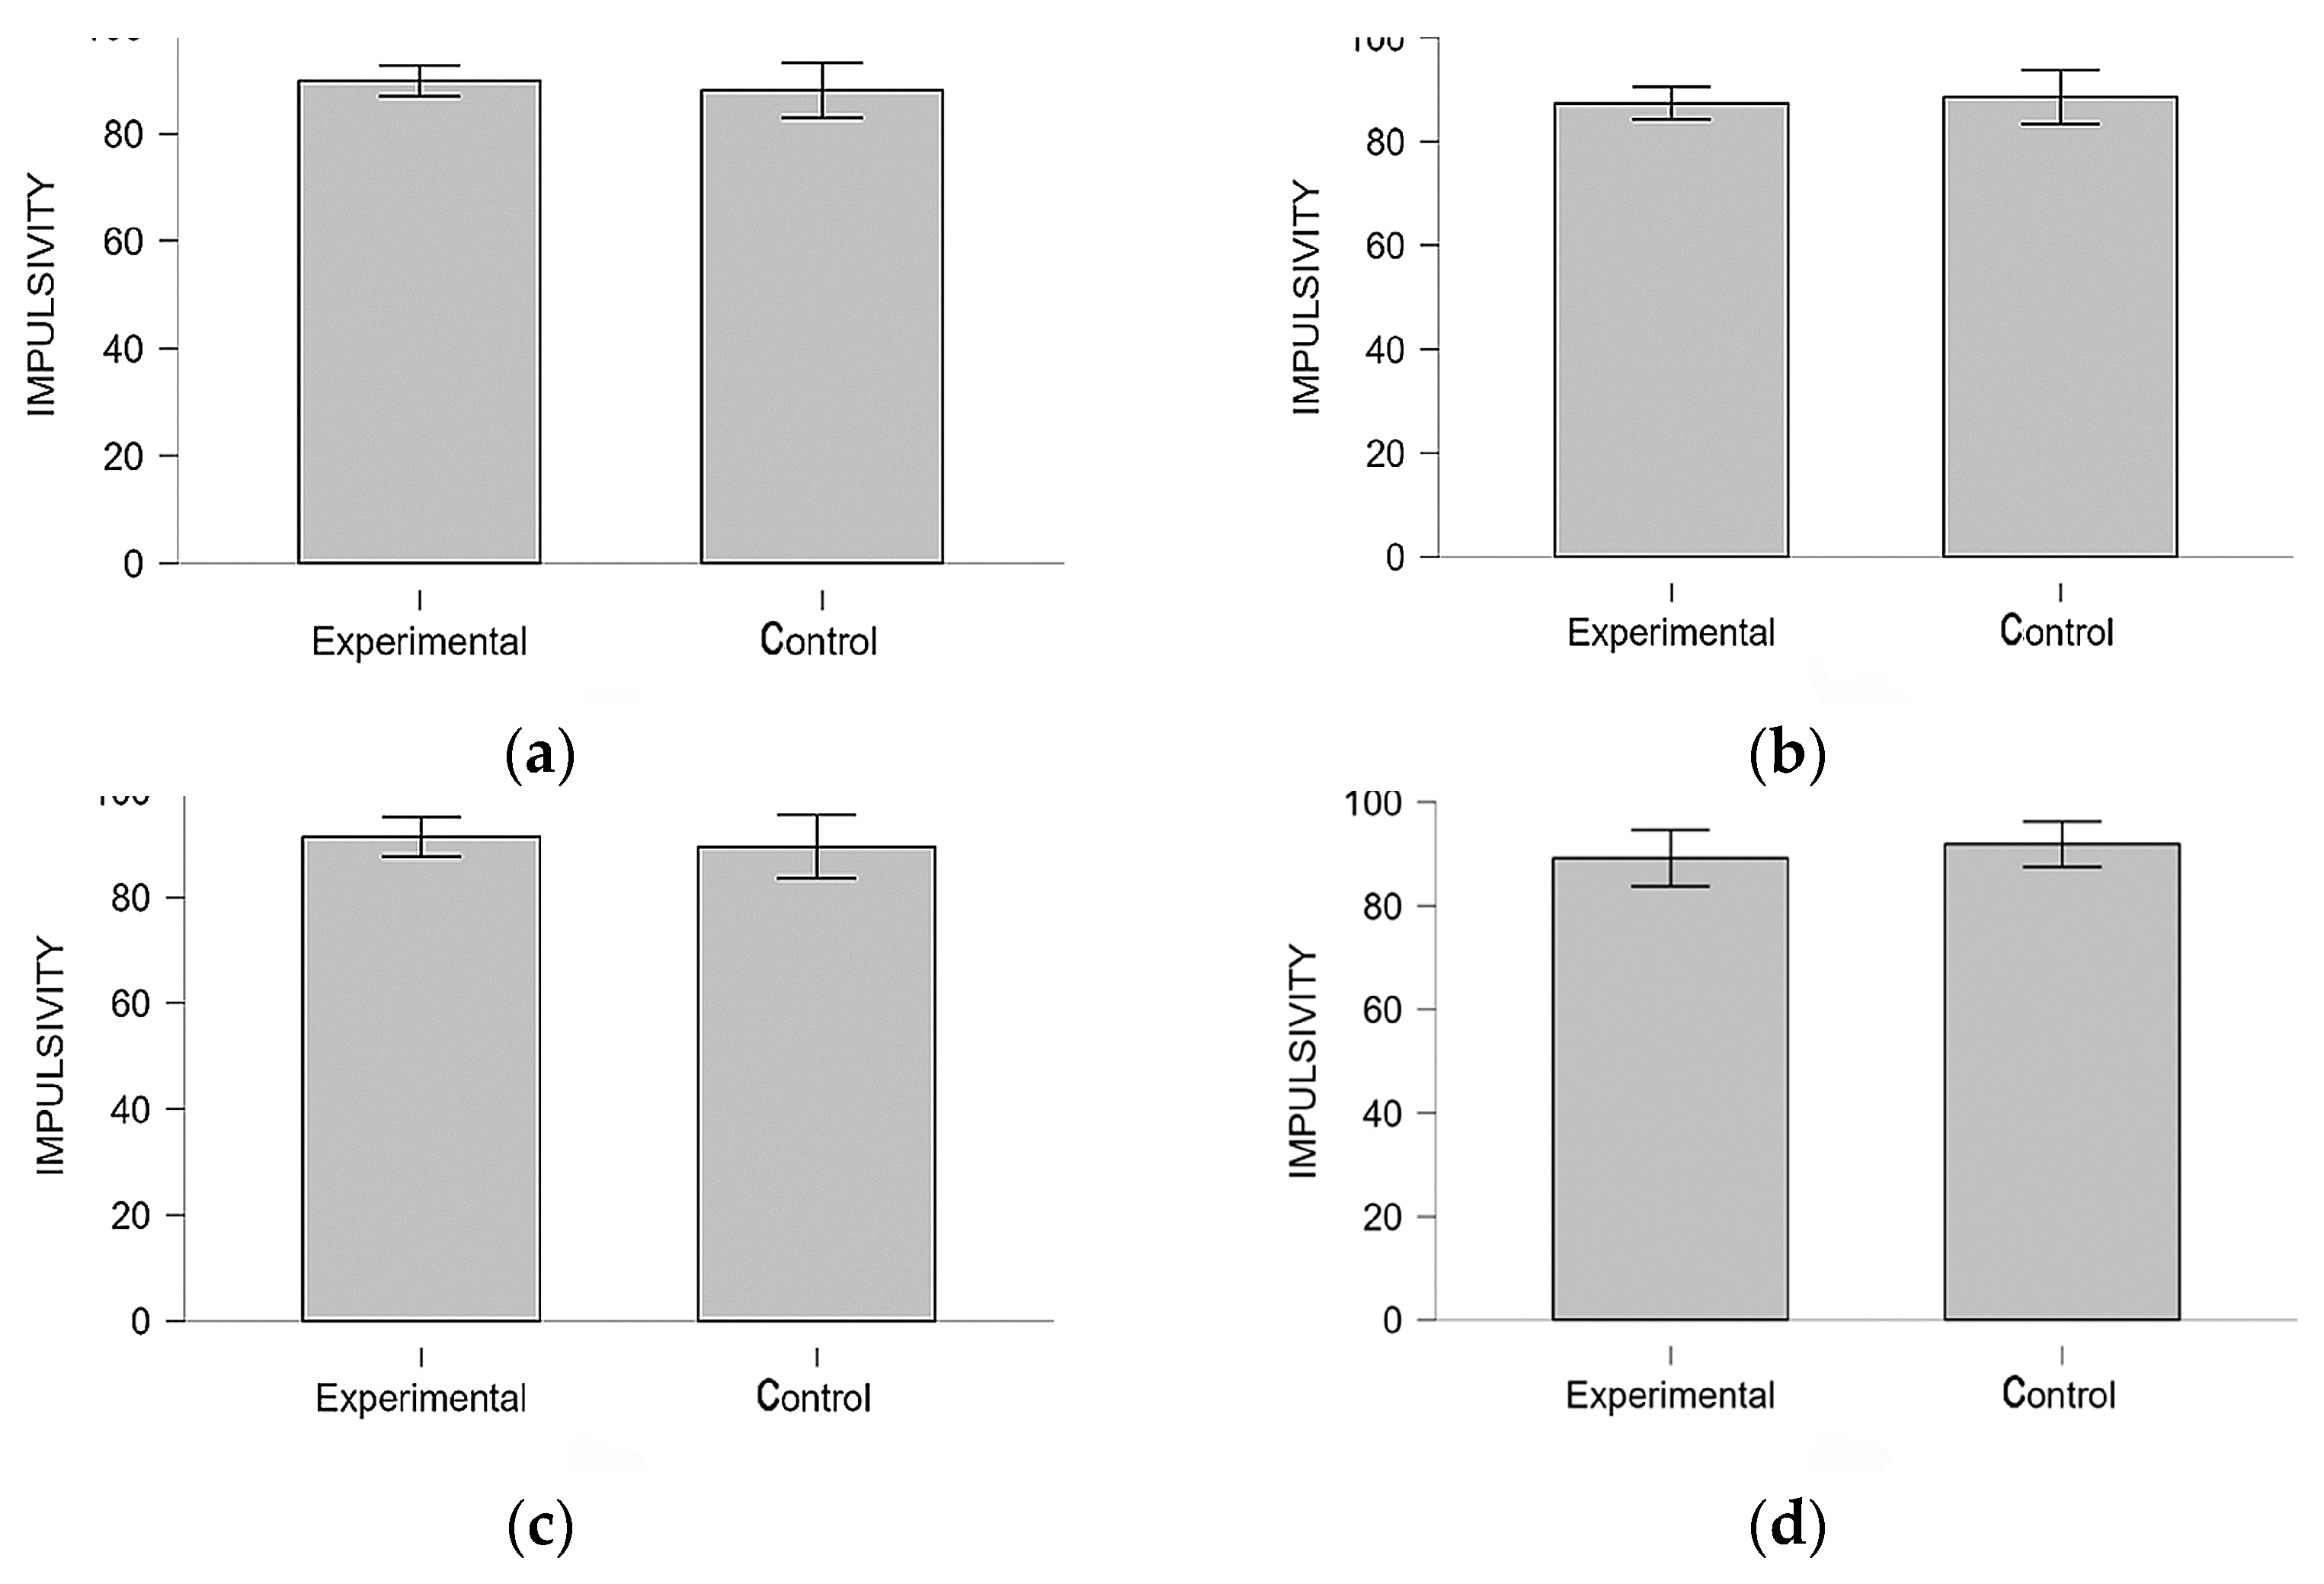
3.1. Net Attention and Impulsivity-Control

3.1.1. Descriptive Analysis

The descriptive values for the experimental group for both “net attention” and “impulsivity control” are presented in Table 3, while the corresponding values for the control group are shown in Table 4. For the experimental group, the mean and median values for “net attention” are higher in all coloured light scenarios compared to natural light, with the highest values being observed in the orange scenario. In contrast, “impulsivity control” does not follow the same pattern, as the green scenario shows the lowest values, while the highest values are found in the violet or orange scenarios, depending on the specific measure considered. A similar trend is observed in the control group, with a progressive improvement of both variables in the different natural scenarios.

3.1.2. Variance Analysis

The differences in descriptive values discussed above are reflected in the significant-variance p-values for the variable “net attention”, according to Friedman’s test, but not for “impulsivity control” (Table 5, Figure 4). Conover’s post-hoc test (Table 6) further refines these results, indicating that significance for “net attention” occurs when contrasting the natural light scenario with the violet and orange scenarios. For “impulsivity control”, significant variance is only found in the relationship between the green and violet scenarios.

3.1.3. Comparative Analysis

On a day-by-day basis, the Mann–Whitney test was performed to make non-parametric comparisons between the experimental and control groups (Table 7 and Table 8). This adds more precision to the observations derived from the previous analyses. In contrast to the previous analyses, p-values do not seem to be generalisable now, but interesting trends are observed. Thus, with respect to “net attention”, all scenarios appear favourable for the experimental group (with the exception of the last one, orange light), while this is not the case for the “impulsivity control”, in which it is only the natural light scenario that is favourable for this experimental group. Figure 5 and Figure 6 provide a graphical picture of the same.

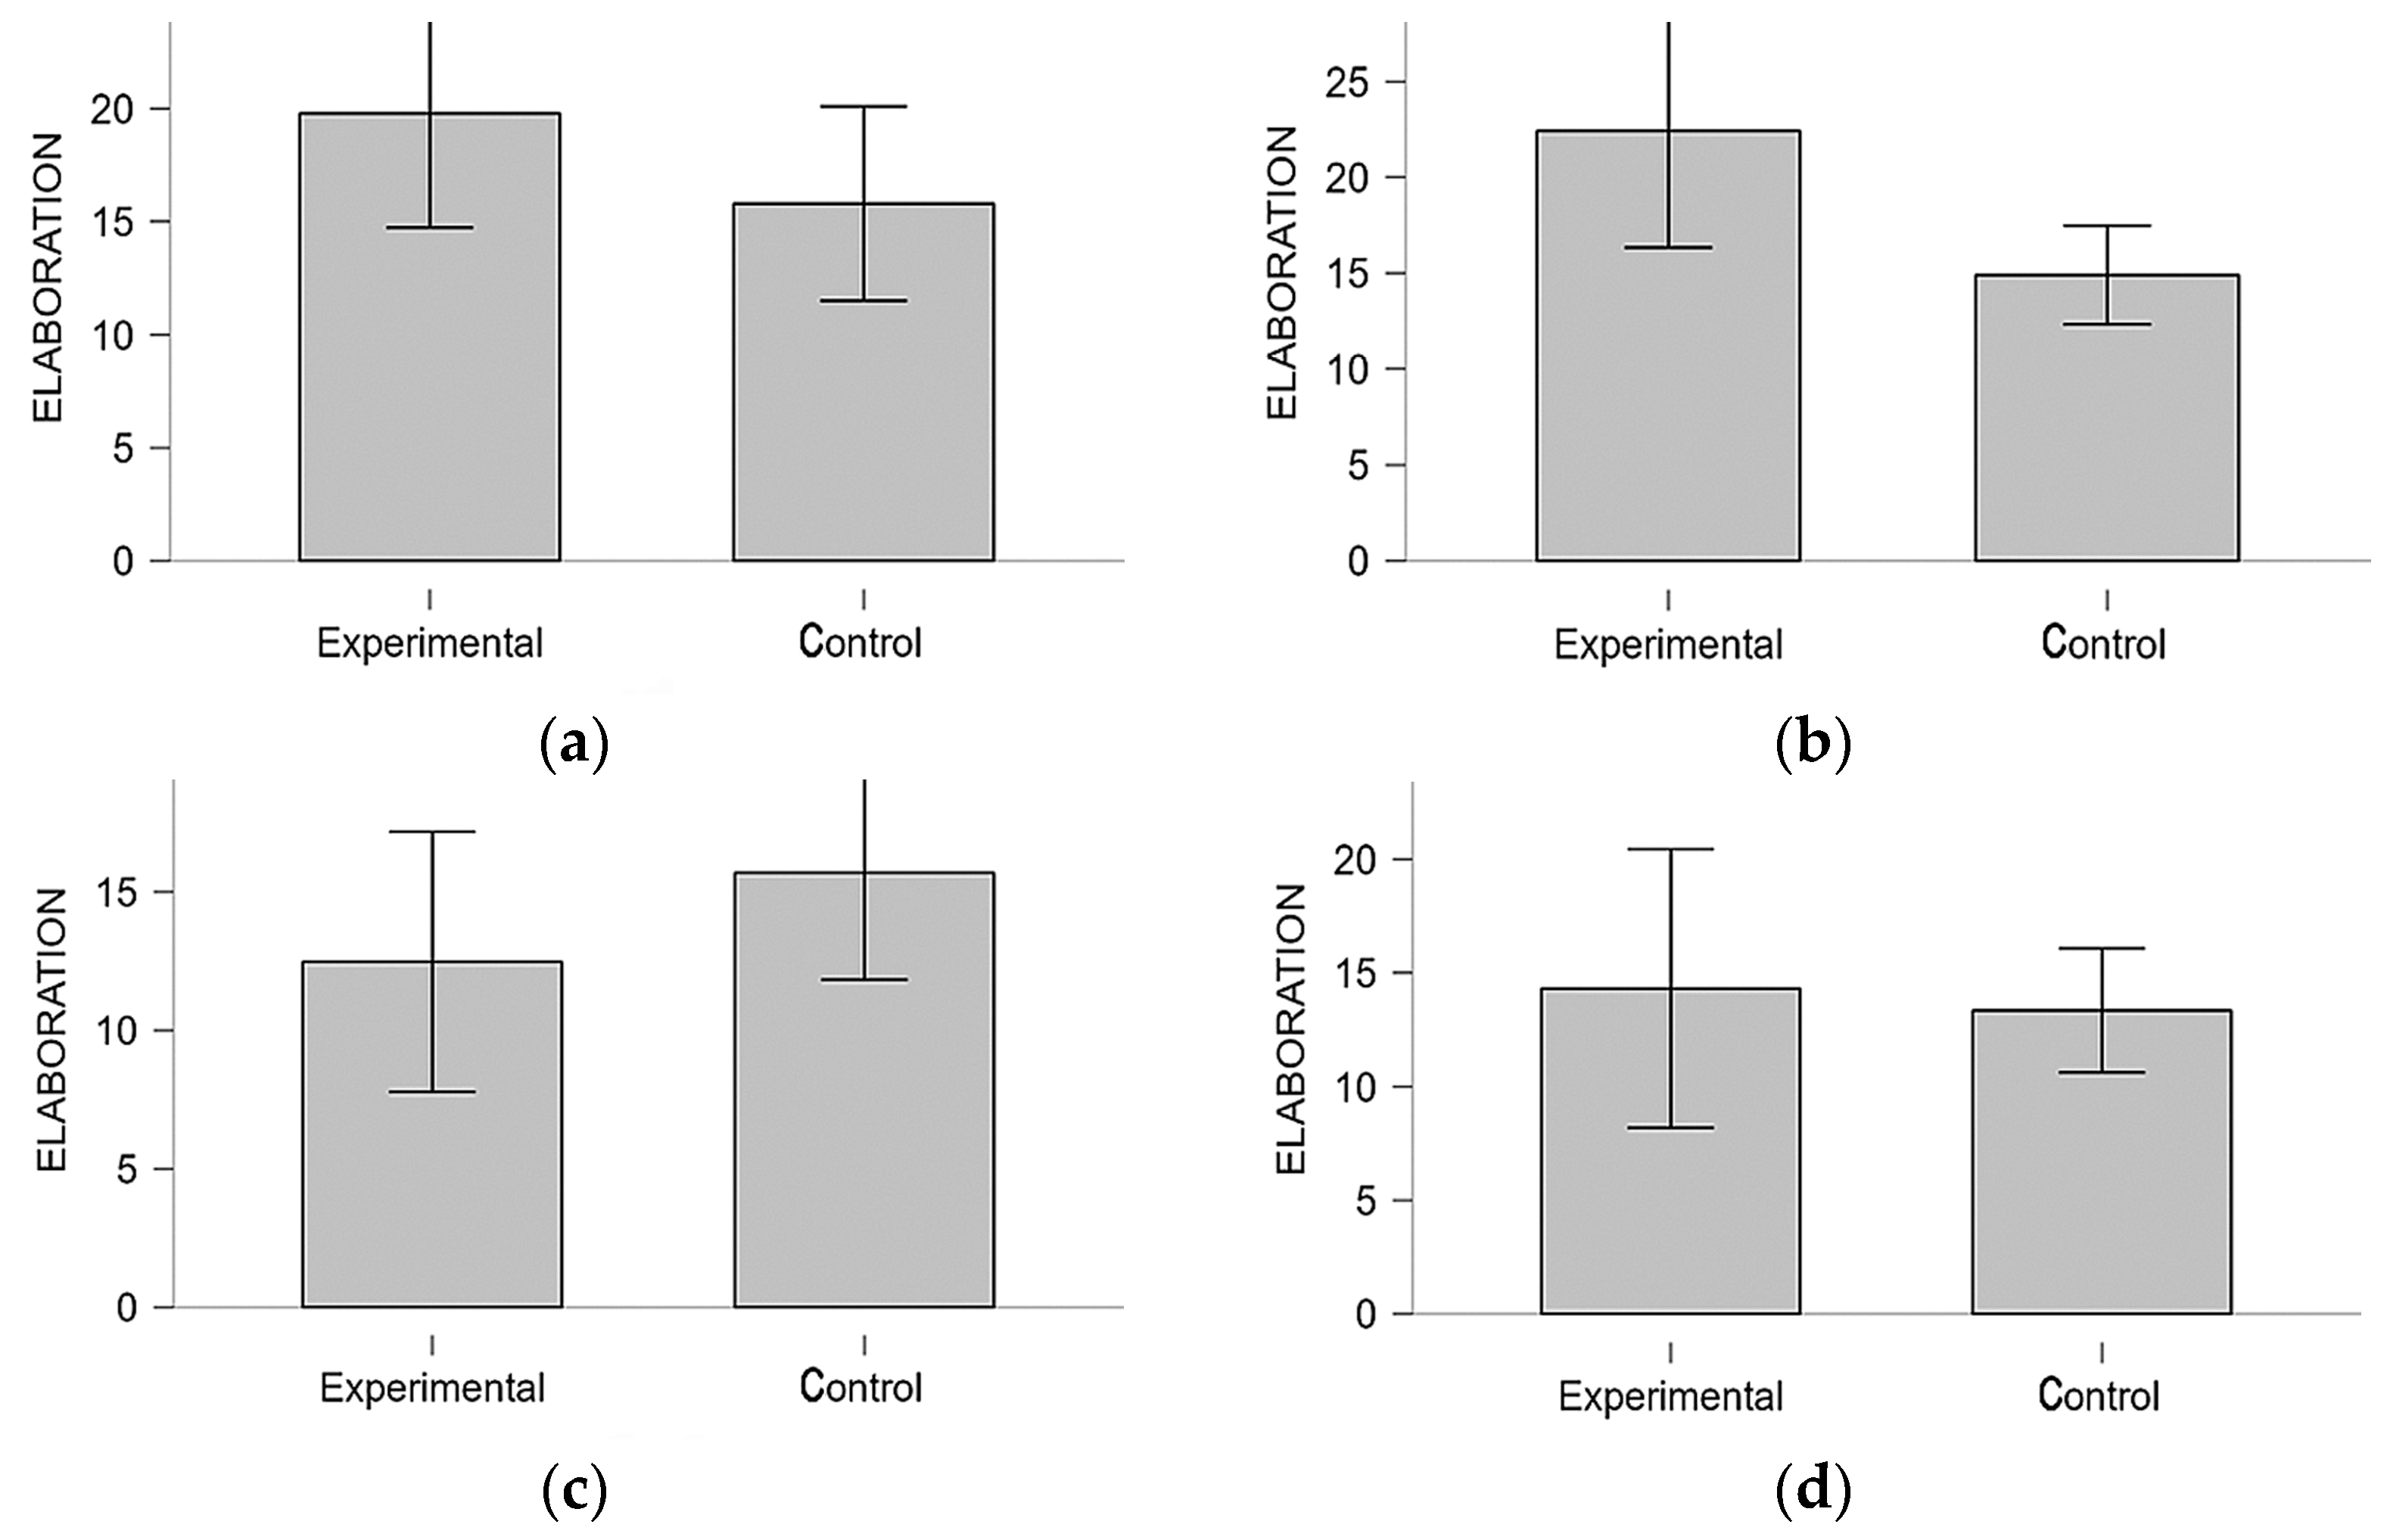
3.2. Originality and Elaboration

3.2.1. Descriptive Analysis

Table 9 shows the descriptive values for “originality” and “elaboration” in the experimental group. The corresponding values for the control group are presented in Table 10. In the experimental group, the mean and median values for “originality” are systematically higher in all coloured light scenarios, compared to natural light, with the highest values being observed in the orange scenario. However, “elaboration” shows a different pattern, with both the violet and orange scenarios showing lower mean and median values, while the green scenario shows higher mean values compared to both the natural scenario and the median. Similarly, the control group shows a trend in favour of higher mean values for ‘originality’, albeit with its own variations. For “elaboration”, scenarios one and three show the highest mean values, although this is not reflected in the median values.

3.2.2. Variance Analysis

Descriptive values discussed above are now evident in the significant variance p-values for the “originality” and “elaboration” dimensions, as determined by Friedman’s test (Table 11, Figure 7). Conover’s post hoc test (Table 12) further clarifies these results. For “originality”, significant differences are observed between the daylight and violet scenarios, as well as between the green and orange scenarios. In terms of “elaboration”, significant differences are observed between the natural and violet, and green and violet scenarios (with violet performing worse), and between the green and orange scenarios (with orange performing worse).

3.2.3. Comparative Analysis

We again used the Mann–Whitney test for the non-parametric comparison of variables and dimensions (Table 13 and Table 14). As before, although the p-values of this test are not generalisable, some interesting trends emerge. In the case of “originality”, all differences in effect size systematically favour the experimental group and there is almost total uniformity. The “elaboration” dimension, on the other hand, shows two scenarios favouring the experimental group (natural, green) while the other two reverse their effect in favour of the control group (violet and orange). Figure 8 and Figure 9 show this graphically.

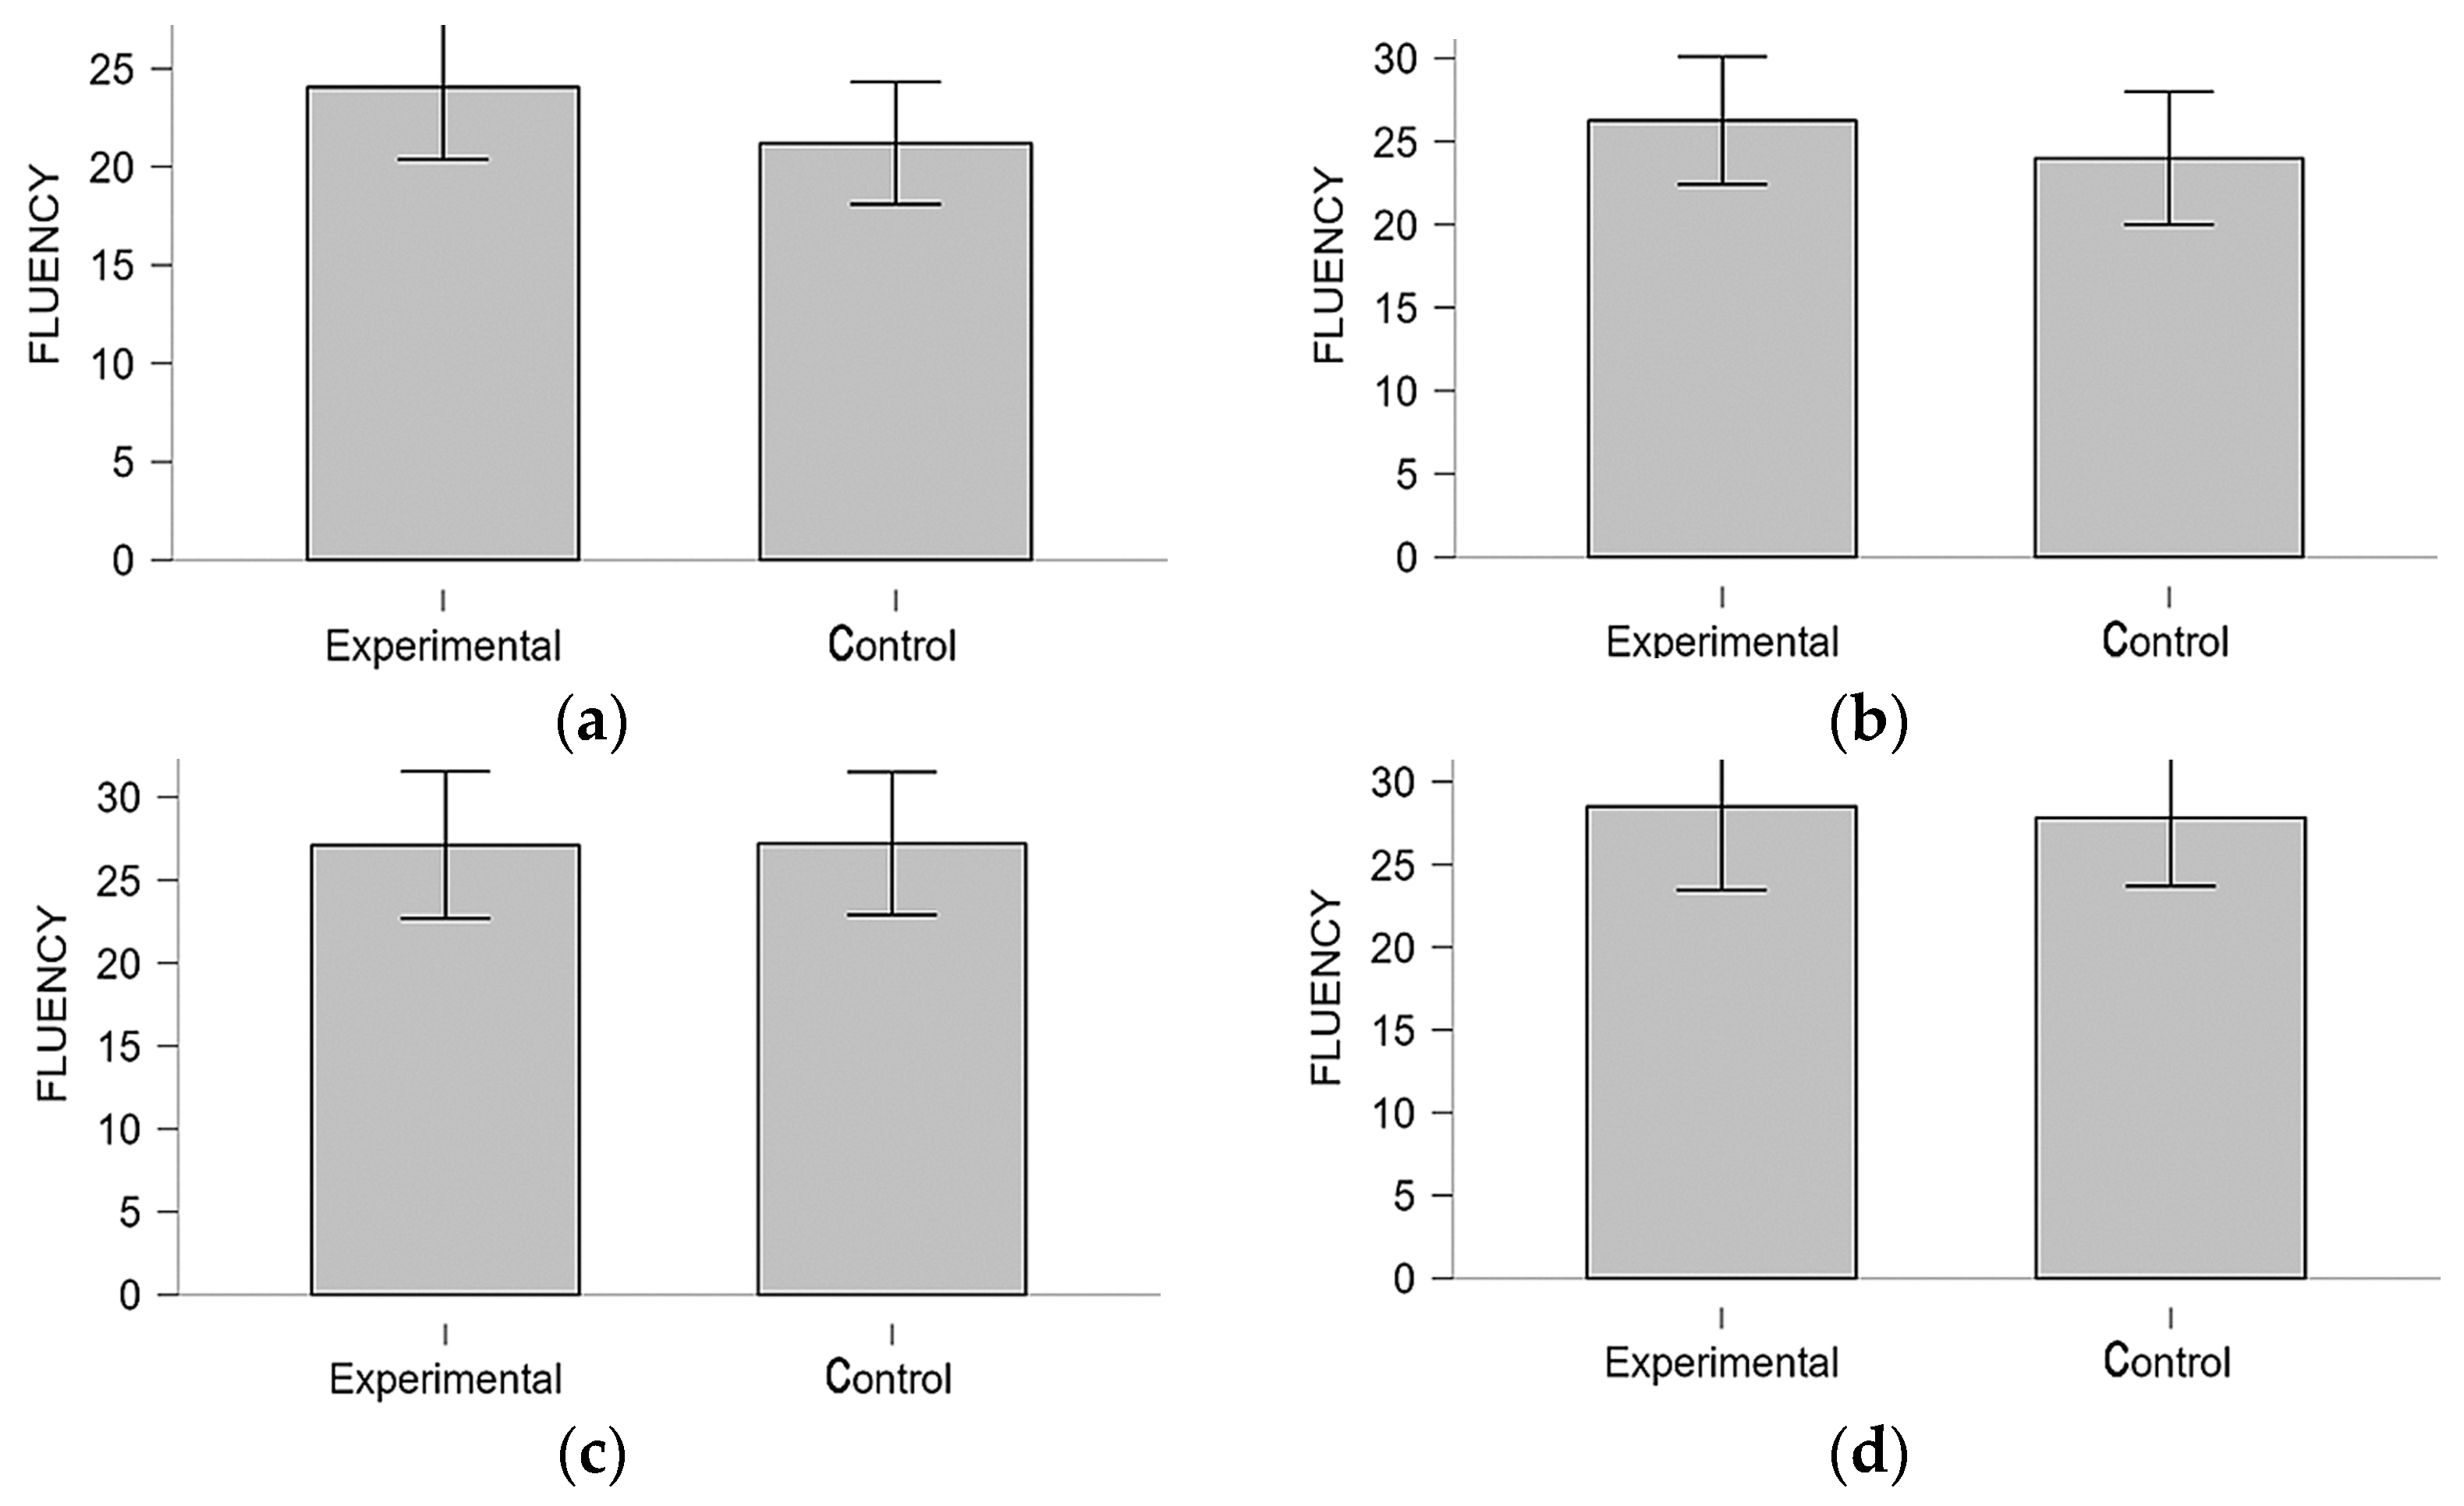
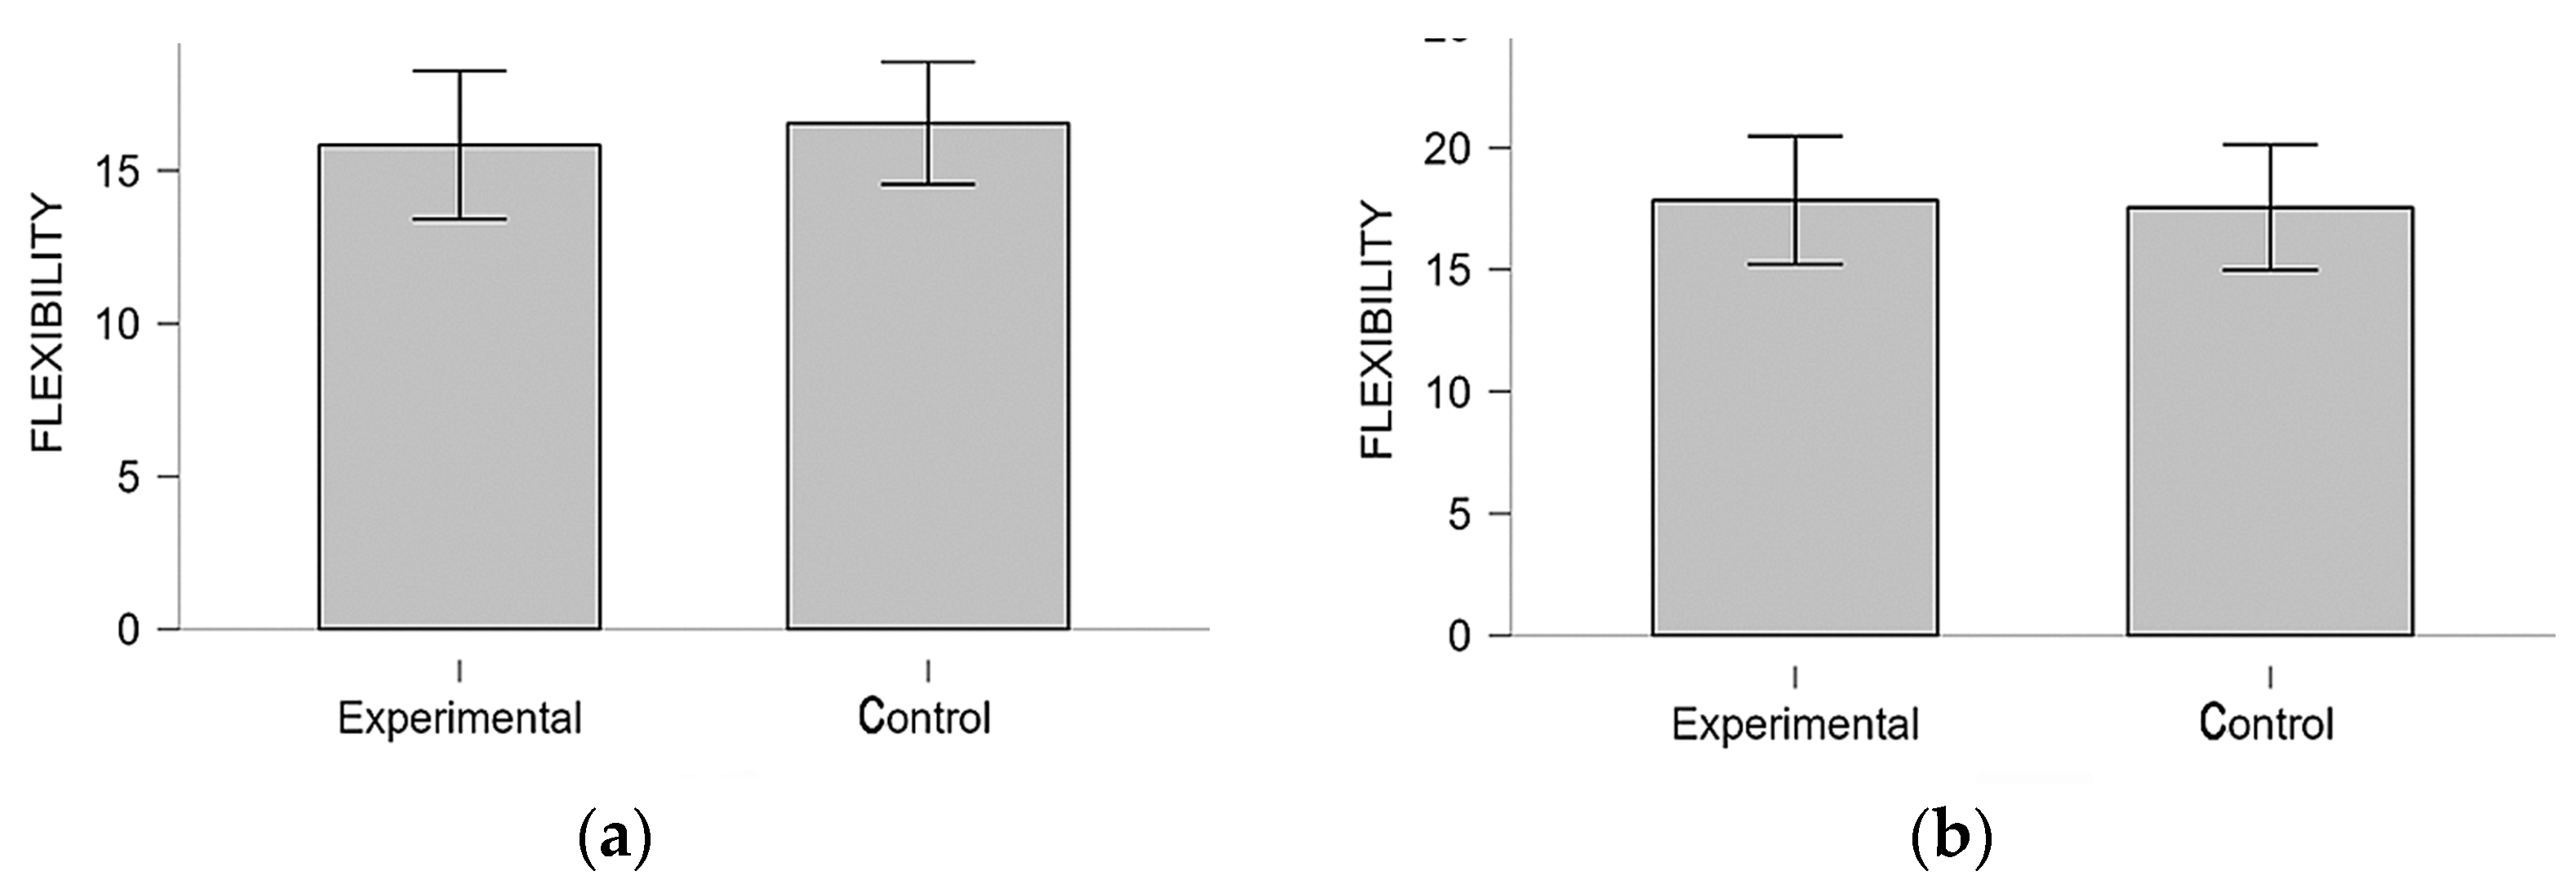
3.3. Fluency and Flexibility

3.3.1. Descriptive Analysis

Table 15 shows the descriptive values for “fluency” and “flexibility” in the experimental group. The corresponding values for the control group are presented in Table 16. In the experimental group, the mean and median values for “fluency” are fairly consistent although not consistently so, with the mean showing a progressive improvement of results in each scenario (the mean shows a slight drop in the green scenario). Similar circumstances are observed in the control group, with total parallelism between mean and median. In the experimental group, “flexibility” shows a significant increase in values in the green scenario, one which decreases in the two successive scenarios, showing differences with respect to the control group, which follows more of a zigzagging in its results.

3.3.2. Variance Analysis

The descriptive values discussed above are now evident in the significant variance p-values for the “fluency” dimension, but not for “flexibility”, as determined by Friedman’s test (Table 17, Figure 10). Conover’s post hoc test (Table 18) further clarifies these results, showing that the significance of “fluency” occurs in the variance between the natural and orange scenarios, as well as in the green–orange scenario, always in favour of the latter.

3.3.3. Comparative Analysis

The results of the non-parametric comparative analysis of the Mann–Whitney test (Table 19 and Table 20) indicate the absence of significant p-values for either of the two dimensions analysed. We only note that the effect size is always in favour of the experimental group in all scenarios for the fluency dimension, while the opposite is true for the flexibility dimension. The evolution of the comparative effect size can be seen in the tables above as well as in Figure 11 and Figure 12.

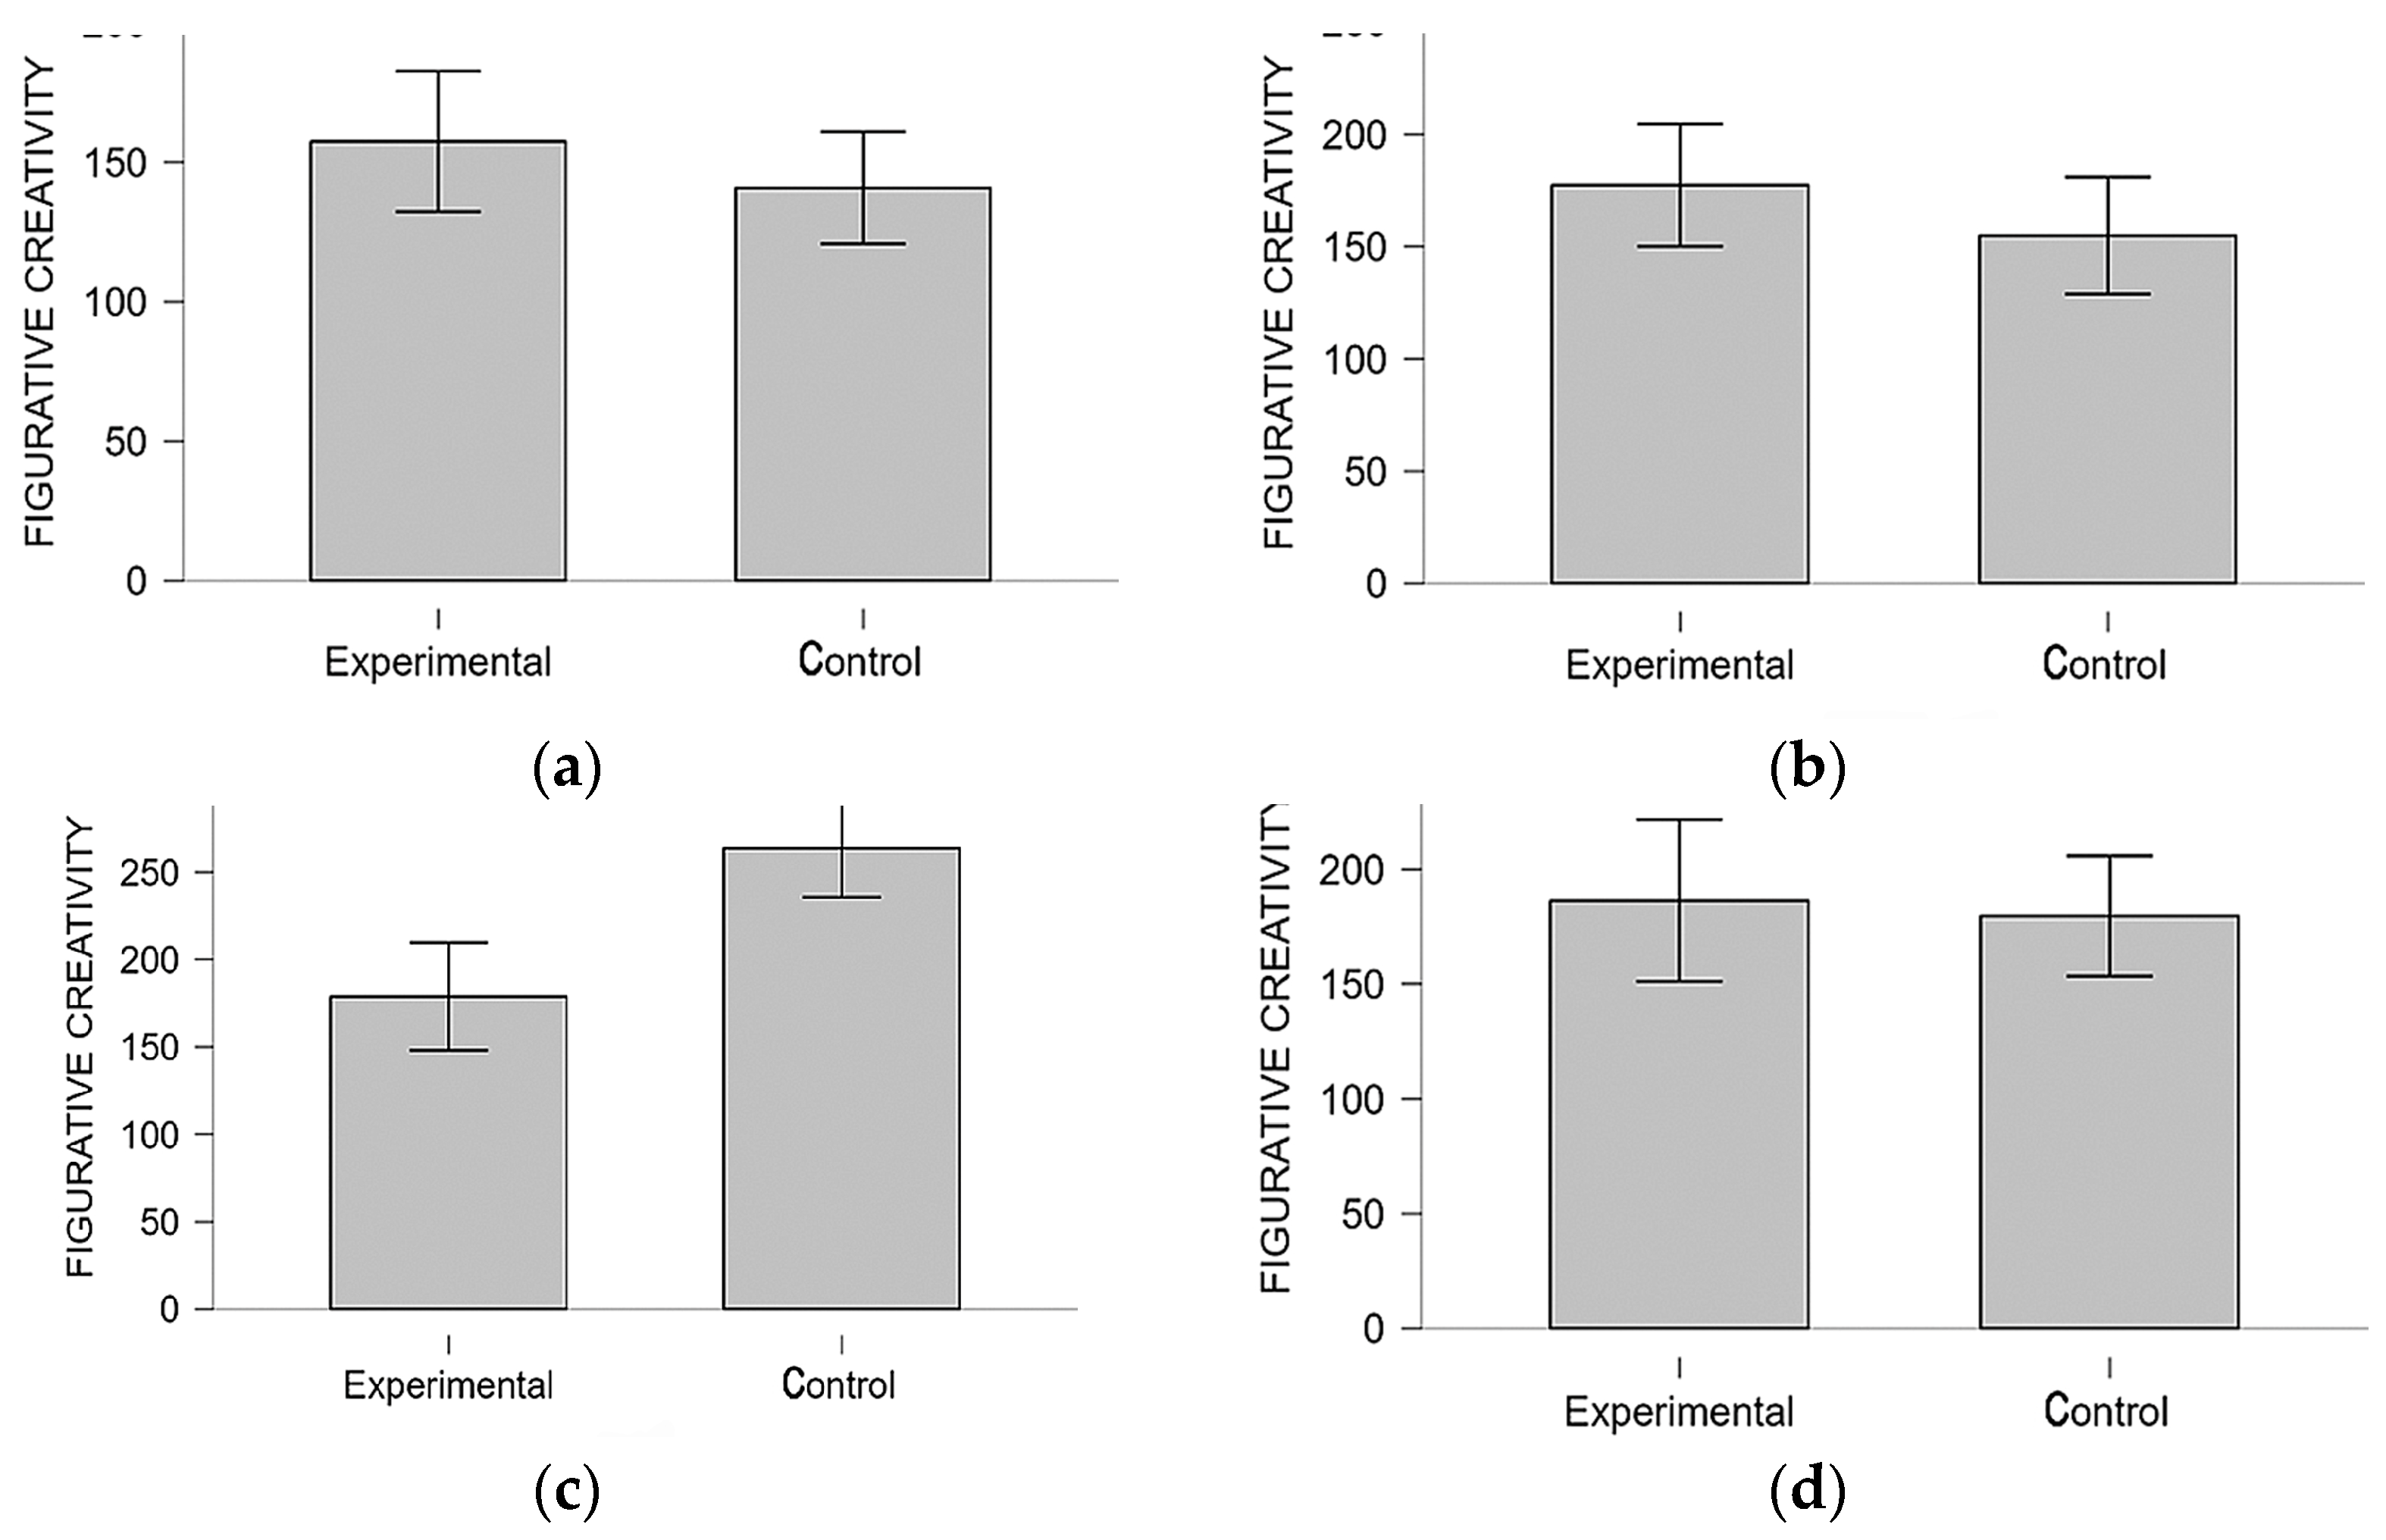
3.4. Figurative Creativity

3.4.1. Descriptive Analysis

The results of the four dimensions, originality, elaboration, fluency and flexibility, allow us to show the values of the variable “figurative creativity”, which are in Table 21 for the experimental group and Table 22 for the control group. As an agglutinating variable of the four dimensions already shown, its mean and median values are also agglutinating, so once again we observe a progressive increase in these values with the succession of the different coloured light scenarios. The latter is applicable both to the experimental group and to the control group, both maintaining a similar evolution.

3.4.2. Variance Analysis

Although Friedman’s test (Table 23) for the variance in the different coloured light scenarios for figurative creativity does not show generalisable p-values, Conover’s post hoc posterior does. In this test, only one of the counterposed scenarios shows a significant p-value, namely, the natural and orange scenario (Table 24, Figure 13).

3.4.3. Comparative Analysis

The results of the non-parametric comparative analysis of the Mann–Whitney test (Table 25, Figure 14) indicate the existence of a significant p-value in the violet light scenario. This is interesting in the context of the rest of the comparisons, where all comparisons are in favour of the experimental group, except for the violet scenario, where the control group performs better.

3.5. Extreme Values of the Dependent Variables

Table 26 concisely presents the main descriptive values for each variable and dimension. The maximum and minimum values indicate that the coloured-light scenarios, in particular the orange, and occasionally the green or violet, consistently yield the highest values. In contrast, the lowest values are always found in one of the daylight scenarios in the control group.

4. Discussion

Although this study is not yet fully conclusive, its new experimental approach adds greater rigour to previous similar studies, such as that of Quiles-Rodríguez et al. [12], with which part of the discussion in this section will be developed. Despite being quasi-experimental, with a control group and a pretest, the results provide valuable insights into a relatively unexplored field. The statistical analysis, using non-parametric tools that we have already justified, offers reasons for optimism, as discussed below.
To systematically address each variable, we begin with “net attention”. Mogas-Recalde et al. [23] acknowledge the impact of lighting on “net attention”, although they study correlated colour temperature (CCT) rather than colour illumination per se. Hviid et al. [25] found that cool lighting, especially when combined with high ventilation rates, improves concentration, which psychologically equates to higher levels of attention. Similarly, Llinares et al. [24] indicate that higher CCT and lighting levels (lux) improve attention. The most relevant discussion is from Quiles-Rodríguez et al. [12], who focus specifically on coloured light. Their study suggests that cognitive processes, in particular attention, may be enhanced by coloured light, with the highest values being observed under violet light, although these results were not statistically significant. In this study, the experimental group showed consistently better results in all coloured light scenarios, with the highest values occurring in orange light. Interestingly, orange was the last scenario tested, while violet had the highest values in the previous study and was also the last of the scenarios on that occasion, suggesting a possible “learning effect”. In the analysis of variance, with the orange scenario giving the best results overall, the most significant p-value (p = 0.002) was found in the purple scenario. As for the comparative analysis, although the values were not statistically significant, we observed an inverted effect size favouring the control group in the final scenario (orange), while in the rest of the scenarios the effect favoured the experimental group. This reversal supports the dominance of the experimental group in the violet scenario, which was the penultimate scenario tested, and in which it still did not lose its original pre-test primacy.
In discussing impulsivity control we will find a similar situation. The only relevant precedent in the literature is the study by Quiles-Rodriguez et al. [12], who found that all coloured light scenarios produced better internal data compared to the natural light scenario. In their study, the violet light scenario was particularly superior, especially when considering the mean rather than the median, and also compared to the control group. However, the p-values in that study did not allow for generalisability. In the current study the purple scenario was again superior, which is noteworthy, as it is not the last scenario tested (the last one being orange), but it still yielded higher p-values. In addition, the green scenario showed the lowest values of all, which were even lower than the daylight scenario. Perhaps because of this, although the Friedman test did not yield generalisable p-values, significant results were observed in the green–violet comparison after Conover’s post hoc analysis. These high violet values are supported by the comparative analysis, as this scenario shows the least-sized negative effect of all the light scenarios (except for the pre-test), which points in its favour.
Kombeiz et al. [5] found that creativity tasks in an experimental university classroom context are favoured by red and blue lights. In contrast, Quiles-Rodriguez et al. [12] found that green light is most conducive to creativity in a school context, although their analysis did not include red and blue lights. Our current study differs from these results, indicating that orange light is most conducive to figurative creativity. In particular, all coloured light scenarios performed better than natural light. This superiority of orange light is confirmed in the analysis of variance: while Friedman’s test was not significant, Conover’s post hoc test showed significance in the natural light vs. orange light contrast. However, the comparative analysis did not show a larger effect to be associated with the experimental group for the orange light scenario. It is true that not all the dimensions of the variable coincide with each other. Thus, for example, elaboration and flexibility present descriptive, variance and comparative results very different from the line sequenced for figurative creativity, with the purple and orange scenarios being very minimised in the former. We did find interesting the significance in variance of both originality and elaboration and fluency, as already observed in the Results section.
From all of the above, in addition to what has already been shown in the values in Table 26, and also given logical consequence, the dynamism of coloured light emerges. Poldma [6] and Suh et al. [3] have already warned us of its great potential, as have Mogas-Recalde et al. [23] in encouraging the need to adapt lighting to each school task. Quiles-Rodríguez et al. [12] make a similar determination when they write that the dynamism of coloured light is a necessity, since otherwise it could happen that some associated scenarios could harm certain processes instead of benefiting them. This is the line we follow in the results obtained in this design, as we have also obtained some possible negative results relevant to coloured light in certain dimensions, so dynamism not only favours the benefits but also allows us to avoid the detriments of the approach. Being orthodox, and although there are some maximum values in the violet and green scenarios with respect to the natural one, the predominance of orange light is abundant, although not total. This may be due to a possible learning-effect in the application of the tests, which, although foreseen in the design and mitigated by the temporal separation and the specificity of the chosen tests, may not have been completely eliminated. In any case, the dynamism of light still appears to be desirable for its impact.

5. Conclusions

In a precise order, we address the first hypothesis, which postulates that the configuration of coloured lighting in the classroom contributes to the enhancement of students’ figurative creativity. Our results confirm this hypothesis, albeit with some nuances. Although all coloured lighting scenarios yielded higher results than those of natural light in the experimental group, only the natural–orange scenario showed a significant p-value in the analysis of variance. The comparative analysis with the control group yielded no results to refute this hypothesis, except for the violet scenario. In this case, the initial advantage of the experimental group was reversed in favour of the control group, probably due to the performance of the control group rather than any deficiency of the experimental group.
The second hypothesis, similar to the first but pertaining to the net attention variable, is confirmed even more strongly. Once again, all the coloured light values show higher values than the natural scenario, with the particularity that Friedman’s analysis (variance) is now significant both as a whole and in the natural–violet and natural–orange elements. The comparative analysis again shows how the initial advantage of the experimental group is reversed in the last of the scenarios, which is again more due to the merit of the control group than to the poor performance of the experimental group.
For the third hypothesis, affirmative with respect to the dependent variable “control of impulsivity”, we have to conclude by affirming its refutation. The descriptive, variance-based and comparative analyses all show doubts as to the ability to affirm the hypothesis. Thus, both the green and violet light scenarios show worse results than the natural one in the experimental group, which translates directly into their variance. Comparatively, it is important to point out that despite the better results of the experimental group over the control in the natural scenario, for the rest of the scenarios (these do have coloured light), the control group appears superior in the Mann–Whitney test.
As for the last hypothesis, which postulates the benefit of adapting coloured light to the needs of the different cognitive processes of the learners, we can confirm it, but also with nuances. We have already said in the discussion that, despite an average generalisation finding the obtaining of better results with coloured light scenarios, especially orange, these can also end up being detrimental (for example, the elaboration dimension with violet or orange light, or impulse control with green light). Moreover, the best result for flexibility, as well as processing, is obtained with green light. This requires the dynamism of light, which could even be controlled by artificial intelligence in the not-too-distant future (more on this later).
The results indicate that coloured light significantly influences the development of certain cognitive processes in students. This influence, although consistently strong around the orange light scenario (potentially due to a learning effect despite mitigation efforts), could be even more beneficial if accompanied by dynamic adjustments. This dynamism could maximise the benefits and avoid potential drawbacks, especially in a smart classroom environment with artificial intelligence-based decision making. Expanding on this a little further, when we ask the research about the colour lighting settings that improve both figurative creativity and net attention or impulsivity-control, we can say the following: figurative creativity shows noticeable improvements with the orange lighting setting (although all variables are positively impacted), net attention appears to demonstrate generalisable improvements in both the violet and orange settings, and impulsivity control, although slightly improved under violet lighting, also worsens with the impact of green lighting. Therefore, when, among the same research questions, we ask ourselves whether the dynamism of coloured light facilitated by LED technology could improve the cognitive processes of students, we can answer yes, insofar as it enables both the selection of the most appropriate scenarios for each variable and the deselection of those that could be detrimental. This leads us to believe that the two general objectives we have proposed for this research, namely, to investigate how different configurations of coloured lighting improve specific cognitive processes in primary school students and to evaluate the effect of “dynamic colour” on students’ cognitive processes in primary school classrooms, have been achieved through experimental development.
Extending the use of coloured light to all primary classrooms by installing systems independent of general lighting could create specialised spaces adapted to various activities. Given current concerns about high energy consumption, such installations could also lead to savings in the medium-to-long term. Establishing a standardised system would be advantageous, as it would allow leading industries to promote the widespread adoption of coloured light in educational environments.

6. Limitations and Future Lines of Research

Previous studies on the same subject posed experimental situations with low n-values, a situation which we have managed to improve on this occasion, although this aspect is still insufficient, and a further extension would be desirable. In this relative improvement, we implemented a new research design that aimed to neutralise the “learning effect” associated with test interactions, although this may not have been entirely sufficient either, as already indicated in previous sections. The partial exclusion of natural light from our scenario, keeping only that necessary to avoid the feeling of confinement, makes the coloured light scenarios less standardisable. The above literature includes both the presence and absence of natural light, with the prevailing view that a mixture of natural and artificial light is ideal. However, this introduces uncontrolled experimental variables that complicate the isolation of the independent variable. Consequently, we chose to minimise these variables as much as possible in our study. We must also note that our experimental group was not randomly selected, as it was pre-established as a class by the educational institution where the experiment occurred. While a higher degree of randomization would be preferable, it was not feasible under the circumstances.
It is possible that future research could seek to overcome the learning effect with new and more robust experimental designs. Interventions should also be applied at different educational stages and in different geographical and socio-cultural contexts to provide a broader understanding of the impact of coloured lighting. The use of physiological sensors, as suggested by Rajae-Joordens [4], could open new avenues in this field of research. This approach could lead in the near future to the automation of the use of coloured light, taking advantage of its dynamic properties and the division into specific sectors (corners) to achieve a high level of personalisation adapted to different cognitive processes. Moreover, this personalisation could be managed by artificial intelligence (AI), as highlighted by Muñoz et al. [38]. They point out that AI can collect, classify and make decisions faster and more accurately than any teaching professional, although the final decision must remain with the human, who considers additional social and emotional factors beyond the data provided by AI.
Perhaps we are not that far away from such a scenario. We already know about the successful implementation of dynamic lighting systems in different schools, such as the successful implementation reported by Shalamanov [39] in Bulgaria, the system designed by Choi et al. [40] in Korea and the remarkable design and implementation of a context-aware lighting control system to enhance learning by Lee et al. [41]. Contributions such as those of our research and its conclusions would add an appendix to these existing systems, especially the one referred to by Lee et al. [41]. Given that they base their lighting on context knowledge (information provided automatically by sensors—which could be regulated by artificial intelligence, or manually by the teachers), nothing would make it impossible to add new points of coloured light, in addition to the ordinary cold or warm white light, which could provide different colours according to the internal variability of the classroom context itself or, more homogeneously, for the whole group of students if this were the case. We know that talking about AI as an assistant in these decision-making processes may still sound futuristic, but nothing could be further from the truth, when we are aware of proposals such as the current one by Sun et al. [42] in which the implementation of an intelligent lighting system based on big data is already plausible.

Author Contributions

Conceptualization, J.Q.-R. and R.P.; methodology, J.Q.-R. and R.P.; software, J.Q.-R.; formal analysis, J.Q.-R. and R.P.; investigation, J.Q.-R. and R.P.; writing—original draft preparation, J.Q.-R.; writing—review and editing, J.Q.-R. and R.P.; resources, J.Q.-R.; supervision, R.P. All authors have read and agreed to the published version of the manuscript.

Funding

This research received no external funding.

Data Availability Statement

Readers can obtain the dataset from the author through https://drive.google.com/drive/folders/1Qs83Pgb347OfkEA39NUi1kY7StceZfBi?usp=drive_link (accessed on 1 July 2024).

Conflicts of Interest

The authors declare no conflicts of interest.

References

  1. Quiles-Rodríguez, J.; Palau, R. Effects of Classroom Colour on Learning Processes for a Future Smart Classroom: A Systematic Review. In Challenges of the Educational System in Contemporary Society; Antolí, J., Ed.; IGI Global: Hershey, PA, USA, 2023; pp. 222–241. [Google Scholar] [CrossRef]
  2. Arbona Hidalgo, L. Estudio de la Influencia de la Iluminación en la Percepción de los Estudiantes Universitarios. Ph.D. Thesis, Universitat Politècnica de València, Valencia, Spain, 2021. [Google Scholar]
  3. Suh, J.K.; Park, E.K.; Iwamoto, D. Color-filtered lighting: Visual and emotional impact in learning environments. Int. J. Arch. Spat. Environ. Des. 2020, 14, 41–55. [Google Scholar] [CrossRef]
  4. Rajae-Joordens, R.J.E. The Effects of Colored Light on Valence and Arousal. In Philips Research Book Series; Sensing Emotions; Westerink, J., Krans, M., Ouwerkerk, M., Eds.; Springer: Berlin/Heidelberg, Germany, 2010; Volume 12, pp. 65–84. [Google Scholar] [CrossRef]
  5. Kombeiz, O.; Steidle, A. Facilitation of creative performance by using blue and red accent lighting in work and learning areas. Ergonomics 2018, 61, 456–463. [Google Scholar] [CrossRef] [PubMed]
  6. Poldma, T. Learning the dynamic processes of color and light in interior design. J. Inter. Des. 2009, 34, 19–33. [Google Scholar] [CrossRef]
  7. Hogewoning, S.W.; Trouwborst, G.; Maljaars, H.; Poortr, H.; Van Leperen, W.; Harbinson, J. Blue light dose-responses of leaf photosynthesis, morphology, and chemical composition of Cucumis sativus grown under different combinations of red and blue light. J. Exp. Bot. 2010, 61, 3107–3117. [Google Scholar] [CrossRef] [PubMed]
  8. Johkan, M.; Shoji, F.; Goto, F.; Hahida, S.; Yoshihara, T. Effect of green light wavelength and intensity on photomorphogenesis and photosynthesis in Lactuca sativa. Environ. Exp. Bot. 2010, 75, 128–133. [Google Scholar] [CrossRef]
  9. Araujo, J.; Rodriguez, M.J.; Postolache, O.; Cercas, F.; Martín, F.F.; Martínez, A.L. Heart Rate Variability Analysis in Healthy Subjects Under Different Colored Ligthing Conditions. In Proceedings of the IEEE International Instrumentation and Measuremente Technology Conference (I2MTC), Dubrovnik, Croatia, 25–28 May 2020. [Google Scholar] [CrossRef]
  10. Jiang, A.; Schlacht, I.L.; Yao, X.; Foing, B.; Fang, Z.; Westland, S.; Hemingray, C.; Yao, W. Space Habitat Astronautics: Multicolour Lighting Psychology in a 7-Day Simulated Habitat. Space Sci. Technol. 2022, 2022, 1–11. [Google Scholar] [CrossRef]
  11. Manca, S.; Cerina, V.; Tobia, V.; Sacchi, S.; Fornara, F. The effect of school design on users’ responses: A systematic review (2008–2017). Sustainability 2020, 12, 3453–3490. [Google Scholar] [CrossRef]
  12. Quiles-Rodríguez, J.; Palau, R. Effects of colored lighting on learning processes: Towards a smart classroom. J. Technol. Sci. Educ. 2024, 14, 484–506. [Google Scholar] [CrossRef]
  13. Von Castell, C.; Stelzmann, D.; Oberfeld, D.; Welsch, R.; Hecht, H. Cognitive performance and emotion are indifferent to ambient color. Color Res. Appl. 2017, 43, 65–74. [Google Scholar] [CrossRef]
  14. Godwin, K.; Leroux, A.; Scupelli, P.; Fisher, A. Classroom Design and Children’s Attention Allocation: Beyond the Laboratory and into the Classroom. Mind Brain Educ. 2022, 16, 239–251. [Google Scholar] [CrossRef]
  15. Barrett, P.; Davies, F.; Zhang, Y.; Barrett, L. The impact of classroom design on pupils’ learning: Final results of a holistic, multi-level analysis. Build. Environ. 2015, 89, 118–133. [Google Scholar] [CrossRef]
  16. Barrett, P.; Davies, F.; Zhang, Y.; Barrett, L. The Holistic Impact of Classroom Spaces on Learning in Specific Subjects. Environ. Behav. 2017, 49, 425–451. [Google Scholar] [CrossRef] [PubMed]
  17. Smith, E.E.; Kosslyn, S.M. Procesos Cognitivos. Modelos y Bases Neurales; Pearson Educación: Madrid, Spain, 2008. [Google Scholar]
  18. Mehta, R.; Zhu, R.J. Blue or red? Exploring the effect of color on cognitive task performances. Science 2009, 5918, 1226–1229. [Google Scholar] [CrossRef] [PubMed]
  19. Duyan, F.; Ünver, R. A research on the effect of classroom wall colours on student’s attention. A/Z ITU J. Fac. Arch. 2016, 13, 73–78. [Google Scholar] [CrossRef]
  20. Tuszyńska-Bogucka, W.; Borys, M.; Dzieńkowski, M.; Kwiatkowski, B.; Kocki, W.; Pełka, J.; Bogucki, J. Use of Eye Tracking for Designing of Learning Spaces. ICERI2018 Proc. 2018, 1, 5360–5368. [Google Scholar] [CrossRef]
  21. Pourbagher, S.; Azemati, H.R.; Saleh Sedgh Pour, B. Classroom wall color: A multiple variance analysis on social stress and concentration in learning environments. Int. J. Educ. Manag. 2020, 35, 189–200. [Google Scholar] [CrossRef]
  22. Quiles-Rodríguez, J.; Mateo-Sanz, J.M.; Palau, R. How does Coloured Lighting Influence the Affective Processes of Pupils? Interact. Des. Archit. J. 2024, 60, 103–121. [Google Scholar] [CrossRef]
  23. Mogas-Recalde, J.; Palau, R. Classroom lighting and its effect on student learning and performance: Towards smarter conditions. In Ludic, Co-Design and Tools Supporting Smart Learning Ecosystems and Smart Education: Proceedings of the 5th International Conference on Smart Learning Ecosystems and Regional Development; Springer: Singapore, 2021; pp. 3–12. [Google Scholar] [CrossRef]
  24. Llinares, C.; Castilla, N.; Higuera-Trujillo, J.L. Do attention and memory tasks require the same lighting? A study in university classrooms. Sustainability 2021, 13, 8374. [Google Scholar] [CrossRef]
  25. Hviid, C.; Pedersen, C.; Dabelsteen, K. A field study of the individual and combined effect of ventilation rate and lighting conditions on pupils’ performance. Build. Environ. 2020, 171, 106608. [Google Scholar] [CrossRef]
  26. López-Villanueva, D.; Palau, R.; Santiago, R. ¿Cómo puede la IA ayudar a la personalización del aprendizaje? In Inteligencia Artificial en la Microeducación: Transformando el Aula del Futuro; Muñoz, J.M., Lorenzo, N., Suñé, X., Eds.; Observatorio de Innovación Educativa y Cultura Digital (ODITE): Barcelona, Spain, 2024. [Google Scholar]
  27. Román-García, M.; Prendes-Espinosa, M.P. El informe del TFM. In Trabajo Fin de Máster en Tecnología Educativa. Orientaciones para la Elaboración y Criterios de Calidad; Prendes Espinosa, M.P., González Calatayud, V., Eds.; Universidad de Murcia: Murcia, Spain, 2018; pp. 59–67. [Google Scholar]
  28. López Fuentes, R.; Salmerón Vilchez, P. Proceso de Investigación Educativa I: Investigación Experimental. In Innovación Docente e Investigación Educativa. Máster Universitario de Educación Secundaria Obligatoria y Bachillerato, Formación Profesional y Enseñanza de Idiomas; López Fuentes, R., Ed.; Universidad de Granada: Granada, Spain, 2011; pp. 24–40. Available online: https://www.ugr.es/~emiliobl/Emilio_Berrocal_de_Luna/Master_files/Introduccio%CC%81n%20a%20la%20Innovacio%CC%81n%20Docente.pdf (accessed on 5 May 2024).
  29. Campbell, D.T.; Stanley, J.C. Experimental and Quasi-Experimental Designs for Research; Rand McNally & Company: Chicago, IL, USA, 1966. [Google Scholar]
  30. Luri, G. La Escuela no es un Parque de Atracciones. Una Defensa del Conocimiento Poderoso; Ariel: Barcelona, Spain, 2020; p. 410. [Google Scholar]
  31. Toala Ponce, S.R.; Gómez Pinillo, L.Y.; Guevara Heredia, R.N.; Quiñonez Ortiz, E.C. Application of Bloom’s taxonomy to improve teaching-learning. Sapienza Int. J. Interdiscip. Stud. 2022, 3, 176–189. [Google Scholar] [CrossRef]
  32. Ley Orgánica 8/2013, de 9 de diciembre, de Mejora de la Calidad Educativa. BOE núm. 295. Available online: https://www.boe.es/eli/es/lo/2013/12/09/8 (accessed on 10 April 2024).
  33. Thurstone, L.L.; Yela, M. Caras-R. Test de Percepción de Diferencias-Revisado, 13th ed.; TEA Ediciones: Madrid, Spain, 2019. [Google Scholar]
  34. Artiles Hernández, C.; Jiménez González, J.E.; Rodríguez Rodríguez, C.; García Miranda, E. Adaptación y Baremación del Test de Pensamiento Creativo de Torrance: Expresión Figurada. Educación Primaria y Secundaria; Consejería de Educación, Cultura y Deportes del Gobierno de Canarias, Dirección General de Ordenación e Innovación Educativ: Islas Canarias, Spain, 2007. [Google Scholar]
  35. Chacón Moscoso, S.; Sanduvete Chavez, S. Métodos, Diseños y Técnicas de Investigación Psicológica; Universidad de Sevilla: Sevilla, Spain, 2018. [Google Scholar]
  36. Reglamento (UE) 2016/679 del Parlamento Europeo y del Consejo, de 27 de Abril de 2016, Relativo a la Protección de las Personas Físicas en lo que Respecta al Tratamiento de Datos Personales y a la Libre Circulación de Estos Datos y por el que se Deroga la Directiva 95/46/CE (Reglamento General de Protección de Datos). DOUE Núm. 119. Available online: https://www.boe.es/doue/2016/119/L00001-00088.pdf (accessed on 10 April 2024).
  37. Ley Orgánica 3/2018, de 5 de Diciembre, de Protección de Datos Personales y Garantía de los Derechos Digitales. BOE Núm. 294. Available online: https://www.boe.es/eli/es/lo/2018/12/05/3 (accessed on 10 April 2024).
  38. Muñoz, J.M.; Lorenzo, N.; Suñé, X. Inteligencia artificial en la Microeducación: Transformando el Aula del Futuro. In Inteligencia artificial en la Microeucación: Transformando el Aula del Futuro; Muñoz, J.M., Lorenzo, N., Suñé, X., Eds.; Observatorio de Innovación Educativa y Cultura Digital (ODITE): Barcelona, Spain, 2024. [Google Scholar]
  39. Shalamanov, V. Implementation of Artifical Dynamic and Biodynamic Lighting System in Training Laboratory. In Proceedings of the 12th Electrical Engineering Faculty Conference (BulEF), Varna, Bulgaria, 9–12 September 2020. [Google Scholar] [CrossRef]
  40. Choi, K.; Suk, H. Dynamic lighting system for the learning environment: Performance of elementary students. Opt. Express 2016, 24, 907–916. [Google Scholar] [CrossRef] [PubMed]
  41. Lee, H.S.; Kwon, S.Y.; Lim, J.H. A Development of a Lighting Control System Based on Context-Awareness for the Improvement of Learning Efficiency in Classroom. Wirel. Pers. Commun. 2016, 86, 165–181. [Google Scholar] [CrossRef]
  42. Sun, B.; Zhang, Q.; Cao, S. Development and Implementation of a Self-Optimizable Smart Lighting System Based on Learning Context in Classroom. Int. J. Environ. Res. Public Health 2020, 17, 1217. [Google Scholar] [CrossRef] [PubMed]
Figure 1. Complete overview of variables and dimensions.
Electronics 13 03005 g001
Figure 2. Placement of coloured LED spotlights in the experimental classroom.
Electronics 13 03005 g002
Figure 3. Experimental design of the two groups (experimental and control).
Electronics 13 03005 g003
Figure 4. (a) Graph of variance in net attention for different coloured light scenarios; (b) graph of variance in impulsivity control for different coloured light scenarios.
Electronics 13 03005 g004
Figure 5. Comparative box-and-whisker plot between experimental and control group for the net-attention variable in the different coloured light scenarios: (a) natural, (b) green, (c) purple, and (d) orange.
Electronics 13 03005 g005
Figure 6. Comparative box-and-whisker plot between experimental and control group for the impulsivity-control variable in the different coloured light scenarios: (a) natural, (b) green, (c) purple, and (d) orange.
Electronics 13 03005 g006
Figure 7. (a) Graph of variance in originality for different coloured light scenarios; (b) graph of variance in elaboration for different coloured light scenarios.
Electronics 13 03005 g007
Figure 8. Comparative box-and-whisker plot between experimental and control group for the originality dimension in the different coloured light scenarios:(a) natural, (b) green, (c) purple, and (d) orange.
Electronics 13 03005 g008aElectronics 13 03005 g008b
Figure 9. Comparative box-and-whisker plot between experimental and control group for the elaboration dimension in the different coloured light scenarios: (a) natural, (b) green, (c) purple, and (d) orange.
Electronics 13 03005 g009
Figure 10. (a) Graph of variance in fluency for different coloured light scenarios: (b) graph of variance in flexibility for different coloured light scenarios.
Electronics 13 03005 g010
Figure 11. Comparative box-and-whisker plot between experimental and control group for the fluency variable in the different coloured light scenarios: (a) natural, (b) green, (c) purple, and (d) orange.
Electronics 13 03005 g011
Figure 12. Comparative box-and-whisker plot between experimental and control group for the flexibility variable in the different coloured light scenarios: (a) natural, (b) green, (c) purple, and (d) orange.
Electronics 13 03005 g012aElectronics 13 03005 g012b
Figure 13. Graph of variance in figurative creativity for different coloured light scenarios.
Electronics 13 03005 g013
Figure 14. Comparative box-and-whisker plot between experimental and control group for the figurative creativity variable in the different coloured light scenarios: (a) natural, (b) green, (c) purple, and (d) orange.
Electronics 13 03005 g014
Table 1. Experimental group light measurements (total class average for each scenario and value).
Natural LightGreen LightPurple LightOrange Light
Classroom
scenarios
980 lx907 lx846 lx775 lx
3963 K4239 K4004 K3502 K
Wavelength: maximum values of 660 nmWavelength: maximum values of 520 nmWavelength: maximum values of 360 nmWavelength: maximum values of 720 nm
Table 2. Control-group light measurements (total class average for each scenario and value).
Natural LightNatural Light 2Natural Light 3Natural Light 4
Classroom
scenarios
976 lx992 lx1008 lx975 lx
4004 K3901 K4010 K3953 K
Wavelength: maximum values of 670 nmWavelength: maximum values of 660 nmWavelength: maximum values of 650 nmWavelength: maximum values of 660 nm
Table 3. Descriptive values of net attention and impulsivity-control in the different experimental coloured light scenarios.
Net Attention Impulsivity Control
NaturalGreenPurpleOrangeNaturalGreenPurpleOrange
Valid1819171918191719
Mode a35.00038.00035.00048.00089.70090.000100.000100.000
Median35.00038.00041.00044.00089.70087.50091.80092.900
Mean35.77839.84242.35343.94789.80687.35391.35989.163
Std. Deviation7.2977.4568.3899.5255.7856.4247.19511.281
Shapiro–Wilk0.9480.9310.9330.9680.9660.9720.9040.869
p-value of Shapiro–Wilk0.3890.1770.2450.7270.7120.8080.0780.014
a More than one mode exists, and only the first is reported.
Table 4. Descriptive values of net attention and impulsivity-control in the different control-group light scenarios.
Net Attention Impulsivity Control
NaturalNatural 2Natural 3Natural 4NaturalNatural 2Natural 3Natural 4
Valid2020192020201920
Mode a30.00038.00029.00058.000100.000100.000100.000100.000
Median33.00037.50043.00046.50090.10090.50095.30096.300
Mean34.90037.85041.57945.25088.04588.57089.53791.900
Std. Deviation10.2289.62611.64010.53810.98011.15912.3989.362
Shapiro–Wilk0.9610.9560.9470.9070.9090.8870.7960.815
p-value of Shapiro–Wilk0.5630.4680.3510.0560.0610.024<0.0010.001
a More than one mode exists, and only the first is reported.
Table 5. Repeated-measures analysis of variance on net attention and impulsivity-control in different coloured light scenarios.
Friedman Test
FactorChi-SquareddfpKendall’s W
Net attention14.29430.0030.298
Impulsivity6.13430.1050.128
Table 6. Conover post hoc on the variance of net attention and impulsivity-control in different coloured light scenarios.
Conover’s Post Hoc Comparisons
Net AttentionImpulsivity Control
FactorT-StatdfppbonfT-Statdfppbonf
NaturalGreen1.877450.0670.4021.440450.1570.940
Purple3.337450.0020.0100.960450.3421.000
Orange3.128450.0030.0180.206450.8381.000
GreenPurple1.460450.1510.9082.400450.0210.123
Orange1.251450.2171.0001.646450.1070.640
PurpleOrange0.209450.8361.0001.440450.1570.940
Note. Grouped by subject.
Table 7. Comparison of net attention between experimental and control groups on all experimental days.
Independent Samples t-Test; Net Attention
TestStatisticdfpEffect SizeSE Effect Size
Day 1, natural lightStudent0.301360.7650.0980.325
Mann–Whitney198.000 0.6080.1000.188
Day 2, green lightStudent0.720370.4760.2310.323
Mann–Whitney218.000 0.4380.1470.185
Day 3, purple lightStudent0.226340.8220.0760.334
Mann–Whitney163.500 0.9620.0120.193
Day 4, orange lightStudent−0.404370.688−0.1300.321
Mann–Whitney172.500 0.632−0.0920.185
Note. For the Student t-test, effect size is given by Cohen’s d. For the Mann–Whitney test, effect size is given by the rank biserial correlation.
Table 8. Comparison of impulsivity control between experimental and control groups on all experimental days.
Independent Samples t-Test; Impulsivity Control
TestStatisticdfpEffect SizeSE Effect Size
Day 1, natural lightStudent0.608360.5470.1980.327
Mann–Whitney181.000 0.9880.0060.188
Day 2, green lightStudent−0.415370.681−0.1330.321
Mann–Whitney160.000 0.406−0.1580.185
Day 3, purple lightStudent0.531340.5990.1770.335
Mann–Whitney156.000 0.873−0.0340.193
Day 4, orange lightStudent−0.826370.414−0.2650.323
Mann–Whitney158.000 0.371−0.1680.185
Note. For the Student t-test, effect size is given by Cohen’s d. For the Mann–Whitney test, effect size is given by the rank biserial correlation.
Table 9. Descriptive values of originality/elaboration in the different experimental coloured light scenarios.
Originality Elaboration
NaturalGreenPurpleOrangeNaturalGreenPurpleOrange
Valid1819171918191719
Mode a21.000100.00039.000173.0004.00010.00011.00011.000
Median96.500100.000124.000138.00018.50018.00011.00011.000
Mean97.722110.789122.235127.52619.77822.42112.47114.316
Std. Deviation41.39241.26844.46852.00510.14912.6299.12512.702
Shapiro–Wilk0.9810.8950.9640.9330.9540.9230.9070.783
p-value of Shapiro–Wilk0.9620.0390.7030.1970.4930.1290.089<0.001
a More than one mode exists, and only the first is reported.
Table 10. Descriptive values of originality/elaboration in the different control-group light scenarios.
Originality Elaboration
NaturalNatural 2Natural 3Natural 4NaturalNatural 2Natural 3Natural 4
Valid2020192020201920
Mode a75.00079.000154.00092.0009.00017.0007.00013.000
Median80.00097.000106.000117.00016.00017.00014.00014.000
Mean87.25098.450112.947119.45015.80014.90015.68413.350
Std. Deviation29.26638.56836.33139.7799.1805.5058.0005.824
Shapiro–Wilk0.9670.9640.9250.9510.9550.9310.9060.970
p-value of Shapiro–Wilk0.6890.6330.1390.3880.4470.1600.0620.765
a More than one mode exists, and only the first is reported.
Table 11. Repeated-measures analysis of variance on originality/elaboration in different coloured light scenarios.
Friedman Test
FactorChi-SquareddfpKendall’s W
Originality11.46530.0090.239
Elaboration22.0843<0.0010.460
Table 12. Conover post hoc on the variance of originality/elaboration in different coloured light scenarios.
Conover’s Post Hoc Comparisons
OriginalityElaboration
FactorT-StatdfppbonfT-Statdfppbonf
NaturalOrange1.097450.2781.0001.174450.2471.000
Purple1.646450.1070.6403.038450.0040.024
Orange3.292450.0020.0122.002450.0510.308
GreenPurple0.549450.5861.0004.21245<0.001<0.001
Orange2.195450.0330.2003.176450.0030.016
PurpleOrange1.646450.1070.6401.036450.3061.000
Note. Grouped by subject.
Table 13. Comparison of originality between experimental and control groups on all experimental days.
Independent Samples t-Test; Originality
TestStatisticdfpEffect SizeSE Effect Size
Day 1, natural lightStudent0.908360.3700.2950.329
Mann–Whitney214.500 0.3200.1920.188
Day 2, green lightStudent0.965370.3410.3090.324
Mann–Whitney207.500 0.6330.0920.185
Day 3, purple lightStudent0.689340.4950.2300.336
Mann–Whitney182.000 0.5260.1270.193
Day 4, orange lightStudent0.546370.5880.1750.322
Mann–Whitney215.000 0.4910.1320.185
Note. For the Student t-test, effect size is given by Cohen’s d. For the Mann–Whitney test, effect size is given by the rank biserial correlation.
Table 14. Comparison of elaboration between experimental and control groups on all experimental days.
Independent Samples t-Test; Elaboration
TestStatisticdfpEffect SizeSE Effect Size
Day 1, natural lightStudent1.269360.2130.4120.332
Mann–Whitney220.000 0.2480.2220.188
Day 2, green lightStudent2.433370.0200.7790.344
Mann–Whitney239.000 0.1720.2580.185
Day 3, purple lightStudent−1.126340.268−0.3760.340
Mann–Whitney116.500 0.158−0.2790.193
Day 4, orange lightStudent0.308370.7600.0990.321
Mann–Whitney156.500 0.353−0.1760.185
Note. For the Student t-test, effect size is given by Cohen’s d. For the Mann–Whitney test, effect size is given by the rank biserial correlation.
Table 15. Descriptive values of fluency/flexibility in the different experimental coloured light scenarios.
Fluency Flexibility
NaturalGreenPurpleOrangeNaturalGreenPurpleOrange
Valid1819171918191719
Mode a25.00019.00026.00038.00013.00018.0008.0009.000
Median25.00024.00026.00028.00014.00018.00016.00015.000
Mean24.05626.26327.11828.52615.83317.84217.00016.000
Std. Deviation7.4167.9718.62310.5164.8785.4496.2257.401
Shapiro–Wilk0.9800.8890.9440.8960.9240.9270.9450.922
p-value of Shapiro–Wilk0.9550.0300.3640.0410.1530.1550.3760.123
a More than one mode exists, and only the first is reported.
Table 16. Descriptive values of fluency/flexibility in the different control-group light scenarios.
Fluency Flexibility
NaturalNatural 2Natural 3Natural 4NaturalNatural 2Natural 3Natural 4
Valid2020192020201920
Mode a21.00021.00013.00022.00013.00020.00014.00025.000
Median21.00024.50027.00027.50016.50019.00017.00019.500
Mean21.20024.00027.21127.85016.55017.55018.15818.950
Std. Deviation6.6468.5358.9298.8694.2735.4915.4396.211
Shapiro–Wilk0.9820.9630.9310.9480.9610.9450.9430.965
p-value of Shapiro–Wilk0.9580.6040.1780.3380.5720.2930.2940.645
a More than one mode exists, and only the first is reported.
Table 17. Repeated-measures analysis of variance for fluency/flexibility in different coloured light scenarios.
Friedman Test
FactorChi-SquareddfpKendall’s W
Fluency8.78630.0320.183
Flexibility1.26830.7370.026
Table 18. Conover post hoc on the variance of fluency/flexibility in different coloured light scenarios.
Conover’s Post Hoc Comparisons
FluencyFlexibility
FactorT-StatdfppbonfT-Statdfppbonf
NaturalOrange0.762450.4501.0000.916450.3641.000
Purple1.108450.2741.0000.705450.4841.000
Orange2.840450.0070.0400.070450.9441.000
GreenPurple0.346450.7311.0000.211450.8331.000
Orange2.078450.0430.2600.846450.4021.000
PurpleOrange1.732450.0900.5410.634450.5291.000
Note. Grouped by subject.
Table 19. Comparison of fluency between experimental and control groups on all experimental days.
Independent Samples t-Test; Fluency
TestStatisticdfpEffect SizeSE Effect Size
Day 1, natural lightStudent1.252360.2190.4070.332
Mann–Whitney219.000 0.2600.2170.188
Day 2, green lightStudent0.855370.3980.2740.323
Mann–Whitney204.000 0.7040.0740.185
Day 3, purple lightStudent−0.032340.975−0.0110.334
Mann–Whitney164.500 0.9370.0190.193
Day 4, orange lightStudent0.218370.8290.0700.321
Mann–Whitney202.500 0.7350.0660.185
Note. For the Student t-test, effect size is given by Cohen’s d. For the Mann–Whitney test, effect size is given by the rank biserial correlation.
Table 20. Comparison of flexibility between experimental and control groups on all experimental days.
Independent Samples t-Test; Flexibility
TestStatisticdfpEffect SizeSE Effect Size
Day 1, natural lightStudent−0.483360.632−0.1570.326
Mann–Whitney154.500 0.463−0.1420.188
Day 2, green lightStudent0.167370.8690.0530.320
Mann–Whitney185.000 0.899−0.0260.185
Day 3, purple lightStudent−0.596340.555−0.1990.336
Mann–Whitney−1.351 0.185−0.4330.328
Day 4, orange lightStudent−1.351370.185−0.4330.328
Mann–Whitney139.500 0.159−0.2660.185
Note. For the Student t-test, effect size is given by Cohen’s d. For the Mann–Whitney test, effect size is given by the rank biserial correlation.
Table 21. Descriptive values of figurative creativity in the different experimental coloured light scenarios.
Figurative Creativity
NaturalGreenPurpleOrange
Valid18191719
Mode a74.000103.00076.00052.000
Median160.000169.000180.000201.000
Mean157.389177.316178.824186.368
Std. Deviation50.60956.53659.82173.033
Shapiro–Wilk0.9700.9320.9600.951
p-value of Shapiro–Wilk0.7930.1880.6300.412
a More than one mode exists, and only the first is reported.
Table 22. Descriptive values of figurative creativity in the different control-group light scenarios.
Figurative Creativity
NaturalNatural 2Natural 3Natural 4
Valid20201920
Mode a47.000128.000149.00079.000
Median140.500154.500165.000175.500
Mean140.800154.900174.000179.600
Std. Deviation42.93055.66052.09755.935
Shapiro–Wilk0.9780.9600.9280.952
p-value of Shapiro–Wilk0.9100.5470.1560.403
a More than one mode exists, and only the first is reported.
Table 23. Repeated-measures analysis of variance on figurative creativity in different coloured light scenarios.
Friedman Test
FactorChi-SquareddfpKendall’s W
Figurative creativity6.00030.1120.125
Table 24. Conover post hoc on the variance of figurative creativity in different coloured light scenarios.
Conover’s Post Hoc Comparisons
Figurative Creativity
FactorT-Statdfppbonf
NaturalGreen1.367450.1781.000
Purple0.684450.4981.000
Orange2.324450.0250.148
GreenPurple0.684450.4981.000
Orange0.957450.3441.000
PurpleOrange1.640450.1080.647
Note. Grouped by subject.
Table 25. Comparison of figurative creativity between experimental and control groups on all experimental days.
Independent Samples t-Test; Flexibility
TestStatisticdfpEffect SizeSE Effect Size
Day 1, natural lightStudent1.093360.2820.3550.330
Mann–Whitney209.500 0.3960.1640.188
Day 2, green lightStudent1.248370.2200.4000.327
Mann–Whitney220.000 0.4070.1580.185
Day 3, purple lightStudent−4.31534<0.001−1.4410.415
Mann–Whitney51.000 <0.001−0.6840.193
Day 4, orange lightStudent0.326370.7460.1040.321
Mann–Whitney201.500 0.7570.0610.185
Note. For the Student t-test, effect size is given by Cohen’s d. For the Mann–Whitney test, effect size is given by the rank biserial correlation.
Table 26. Maximum and minimum descriptive values of cognitive variables.
Extreme Values of the Dependent Variables
(Dimensions and Indicators Included)
Maximum ValueMinimum Value
MeanMedianMeanMedian
Net Attention
(level over 60)
45.250
Natural light4
(control group)
46.500
Natural light4
(control group)
34.900
Natural light1
(control group)
33.000
Natural light1
(control group)
Impulsivity Control
(level over 100)
91.900
Natural light4
(control group)
96.300
Natural light4
(control group)
87.353
Green light
(experimental group)
87.500
Green light
(experimental group)
Originality127.526
Orange light
(experimental group)
138.000
Orange light
(experimental group)
87.250
Natural light1
(control group)
80.000
Natural light1
(control group)
Elaboration22.421
Green light
(experimental group)
18.500
Natural light
(experimental group)
12.471
Purple light
(experimental group)
11.000
Purple and orange light
(experimental group)
Fluency28.526
Orange light
(experimental group)
28.000
Orange light
(experimental group)
21.200
Natural light1
(control group)
21.000
Natural light1
(control group)
Flexibility18.950
Green light
Natural light4
(control group)
19.500
Green light
Natural light4
(control group)
14.000
Natural light
(experimental group)
15.833
Natural light
(experimental group)
Figurative Creativity186.368
Orange light
(experimental group)
201.000
Orange light
(experimental group)
140.800
Natural light1
(control group)
140.500
Natural light1
(control group)
Disclaimer/Publisher’s Note: The statements, opinions and data contained in all publications are solely those of the individual author(s) and contributor(s) and not of MDPI and/or the editor(s). MDPI and/or the editor(s) disclaim responsibility for any injury to people or property resulting from any ideas, methods, instructions or products referred to in the content.

