Article

Lightweight Low-Voltage AC Arc-Fault Detection Method Based on the Interpretability Method

by
Xin Ning
1,2,
Dejie Sheng
3,
Tianle Lan
3,
Wenbing He
4,
Jiayu Xiong
1,2 and
Yao Wang
3,*
1
State Grid Sichuan Electric Power Research Institute, Chengdu 610041, China
2
Power Internet of Things Key Laboratory of Sichuan Province, Chengdu 610041, China
3
State Key Laboratory of Reliability and Intelligence of Electrical Equipment, Hebei University of Technology, Tianjin 300401, China
4
Ganzi Power Supply Company, State Grid Sichuan Electric Power Company, Ganzi 626099, China
*
Author to whom correspondence should be addressed.
Electronics 2024, 13(13), 2662; https://doi.org/10.3390/electronics13132662
Submission received: 6 June 2024 / Revised: 30 June 2024 / Accepted: 4 July 2024 / Published: 7 July 2024

Abstract

:
Electrical fires are frequently caused by low-voltage AC series arc faults, which can result in significant injuries and property damage. The installation of arc-fault detection devices is mandated or recommended in many regions and countries across the world, yet the current devices’ detection accuracy is insufficient to completely eliminate the risk posed by arc faults. The method based on artificial intelligence is a solution with high detection accuracy, but the AI model is a ‘black box’. When a misjudgment occurs, the cause of the model error cannot be found fundamentally, and the modification and light weight of the model also presents significant difficulties when using the approach. Given the aforementioned issues, this research proposes a novel lightweight low-voltage AC arc-fault detection method based on the explainability approach. By applying the attention mechanism approach and performing a visual analysis, the contribution of arc features to model detection is determined. Model input data optimization and model structure simplification are achieved at the same time as increased model detection accuracy. Ultimately, an experimental prototype for arc-fault detection is designed and validated. Test results demonstrate the effectiveness of the method by demonstrating that the lightweight model maintains 99.69% detection accuracy, even after optimizing the input data by 80% and reducing the model parameters by 51.52%.

1. Introduction

With increasing power consumption, electrical fire accidents caused by electrical equipment failure and electrical line aging are also increasing year by year. In 2023, there were 1941 electrical fires in the country, accounting for 29.1%, which was the primary cause of fires [1]. The number of lines and equipment in low-voltage distribution networks is large, network topology and operating environments are complex, and there is a lack of regular operation and maintenance. Therefore, the hidden danger of the safe operation of low-voltage distribution networks, especially the hidden danger of electrical fires, is very prominent. Among them, series arc faults, as a common fault type, have created great challenges for the safe operation of low-voltage distribution networks due to the difficulties of detection and accurate positioning. Therefore, it is necessary to carry out research on the effective detection method of arc faults in low-voltage distribution networks to meet the needs of the effective prevention and control of fires caused by arc faults.
According to the arc-fault detection method, the existing technology can be divided into mechanical and electrical types [2]. The main defect of the mechanical arc-fault detection method is that the sensor must be set near the arc position to perform reliable detection. Therefore, the mechanical detection method is only suitable for fixed-point detection scenarios, such as switch cabinets, and the practicability is poor. The electrical arc-fault detection method usually detects an arc fault by the abnormal changes in the electrical characteristics corresponding to the current and voltage. The arc-fault detection method based on the changes in the voltage and current characteristics in the line has attracted more and more attention. Kim et al. [3] studied the symmetrical energy distribution of arc-fault voltage, and proposed an arc-fault identification method based on this. However, due to the unpredictable location of the arc, the arc voltage waveform is usually difficult to obtain in the actual line. In contrast, the arc current signal is easier to collect and process, which is the focus of current research. H. Zhao et al. [4] combined the current zero-break time ratio and the normalized mean square error coefficient of the waveform to obtain the comprehensive feature recognition coefficient of the series arc fault, and compared it with the empirical threshold to determine whether there is a series arc fault. However, the paper does not consider the fact that the nonlinear load work will cause the algorithm to misidentify the issue at hand. The method based on the low-frequency characteristics of arc currents has certain limitations. In recent years, many scholars have begun to study the arc-fault identification method based on frequency domain analysis. Xiong Qing et al. [5] used the relationship between the Fourier integral amplitude and frequency of arc currents to identify and locate arc faults. Due to the increase in nonlinear loads in the distribution network environment, high-order harmonics and distortions will also occur in the normal current of the load. Similar to the arc-fault current, the traditional arc-fault identification method easily causes misjudgments. Moreover, the time–frequency domain characteristics of an arc current are easily affected by the type of load, and the artificially set threshold is no longer universal. The recognition algorithm is prone to misoperation and rejection, and the reliability is poor.
In recent years, artificial intelligence technology has developed rapidly [6]. W. Yu et al. proposed a data-driven fault detection and diagnosis method [7,8,9]. The generalized convolutional neural network with incremental learning ability is used to diagnose industrial faults. Robust monitoring and fault isolation for nonlinear industrial processes are achieved using denoising autoencoders and resilient networks. MoniNet with the concurrent analysis of temporal and spatial information is used to detect industrial faults. The development of artificial intelligence has opened up new ideas for the research of arc-fault diagnosis technology. The advantage of using artificial intelligence for arc-fault identification is that artificial intelligence can automatically extract the deep features of the input signal, eliminate the interference of human factors, and automatically establish a series arc-fault identification model. Compared with the traditional machine learning algorithm, the deep learning algorithm can obtain more original signal features, reduce the data preprocessing process, and obtain the arc-fault recognition results more directly. Y. Wang et al. [10] proposed a hybrid arc-fault detection method based on improved Mel frequency cepstrum coefficient (MFCC) preprocessing and the arc recognition neural network model based on ARC_MFCC. The detection accuracy can reach 99.34%. G. Zhou et al. [11] proposed a series arc-fault detection method based on double-filter feature selection and improved hierarchical clustering, which significantly improved the training and detection speed. Y. Wang et al. [12] proposed an AC arc-fault recognition model based on a convolutional neural network, which can realize the real-time processing and state recognition of current signals in hardware. L. Zhao et al. [13] introduced a method for selecting the phase of a fault arc in three phases using a global time convolution network, and the global attention mechanism was used to extract the fault depth representation. C. D. Prasad et al. [14] used the energy coefficient of the optimal transient extraction transform as an indicator to detect high-resistance arc faults, and used the particle swarm optimization algorithm to obtain the fault data set in OTET. F. Zhang et al. [15] used sparse coding to obtain signal features, and used the neural network for feature learning and classification, which can avoid the misoperation of the switching characteristic load start-up process. The experimental results show that the SRFCNN method is effective and versatile for arc-fault detection of various load types. At the same time, the design architecture and analysis method of the SRFCNN method reveal the potential of this method in other signal feature extractions, fault diagnoses, and classifications.
At present, the research on low-voltage AC arc-fault detection still faces many challenges. Traditional arc-fault detection methods lack accuracy. Using artificial intelligence methods to detect arc faults can improve the accuracy, but artificial intelligence methods often lack interpretability. In the face of multiple loads, different loads will have overlapping frequency bands, and it is difficult to distinguish arc-free signals. Therefore, it is necessary to use artificial intelligence to perform detections. Most of the existing artificial intelligence methods lack interpretability, which limits the parameter adjustment, accuracy improvement, and light weight of the model. The output of the model cannot be reasonably explained, and correct sample analysis is also difficult. The interpretability of the model is helpful to the improvement of the model. In the process of model improvement, interpretability helps to judge the flow process of the data. In the field of arc-fault detection, due to the particularity of the power system, the detection of the arc fault has accurate and rapid requirements. Therefore, a detection model needs to be continuously improved with the changes in application scenarios and requirements. Therefore, the interpretability of the detection model is important in the context of arc-fault detection.
Before using the artificial intelligence method to identify an arc fault, it is necessary to manually extract the arc characteristics as the input parameters of the machine learning algorithm. The selection of arc characteristics directly determines the final accuracy of the machine learning algorithm [16]. At present, the feature selection of machine learning methods is mainly based on field experience, and it cannot guarantee that the selected arc features match the artificial intelligence algorithm used, resulting in the arc detection algorithm easily malfunctioning. The attention mechanism plays an important role in the field of deep learning. It imitates the way the human brain processes information and helps the neural network selectively focus on specific inputs [17]. In order to solve the problem of arc feature selection, this paper proposes an arc-fault detection method based on the attention weight automatic extraction of arc features. The key arc features are selected by extracting the attention weight embedded in the algorithm, and the insensitive redundant features are eliminated for arc-fault identification. An anti-interference test is carried out, and the results show the effectiveness of the method.
This paper proposes an interpretable lightweight model for low-voltage AC arc-fault detection. The specific effects of the method are as follows.
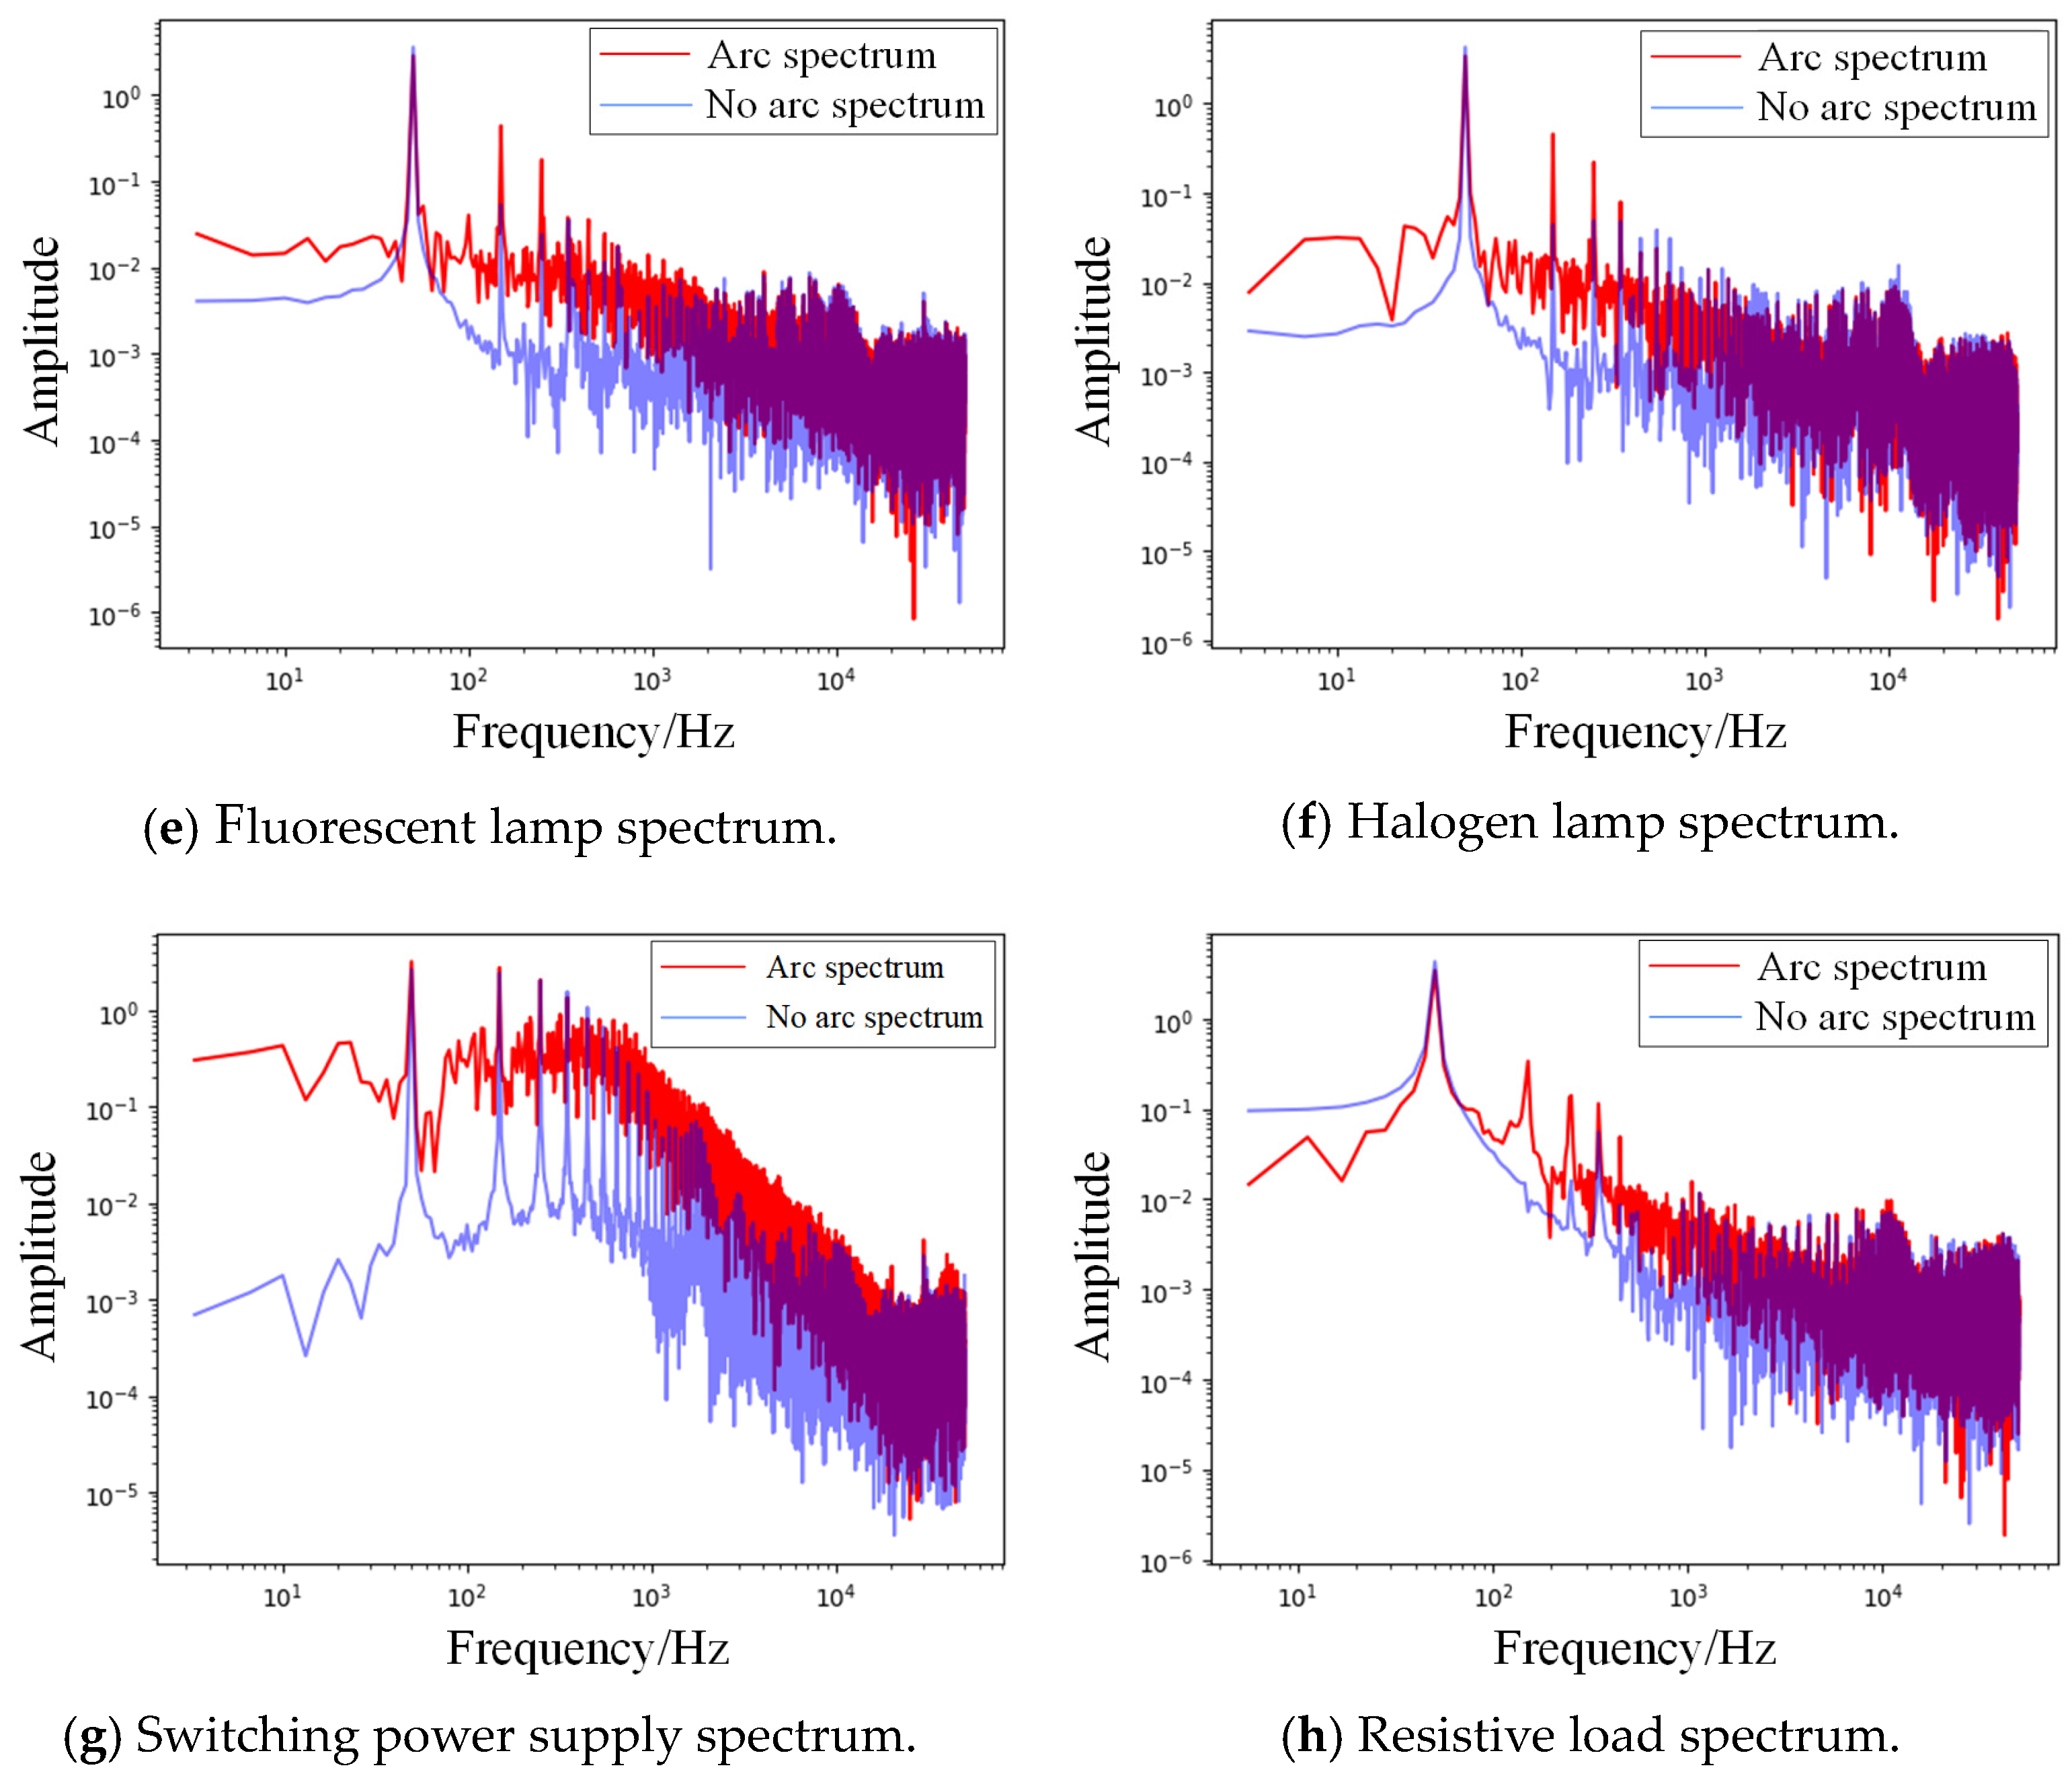
First, through frequency domain analysis, it is found that the spectrum information of arc-fault currents can reflect certain characteristics of AC arc-faults under multi-type loads. The use of frequency domain information combined with the attention mechanism model in this paper can better combine the prior experience in the field of arc faults, which is helpful to obtain the characteristic frequency band of arc faults from the perspective of the model output, and provide the basis for model accuracy improvement and light weight.
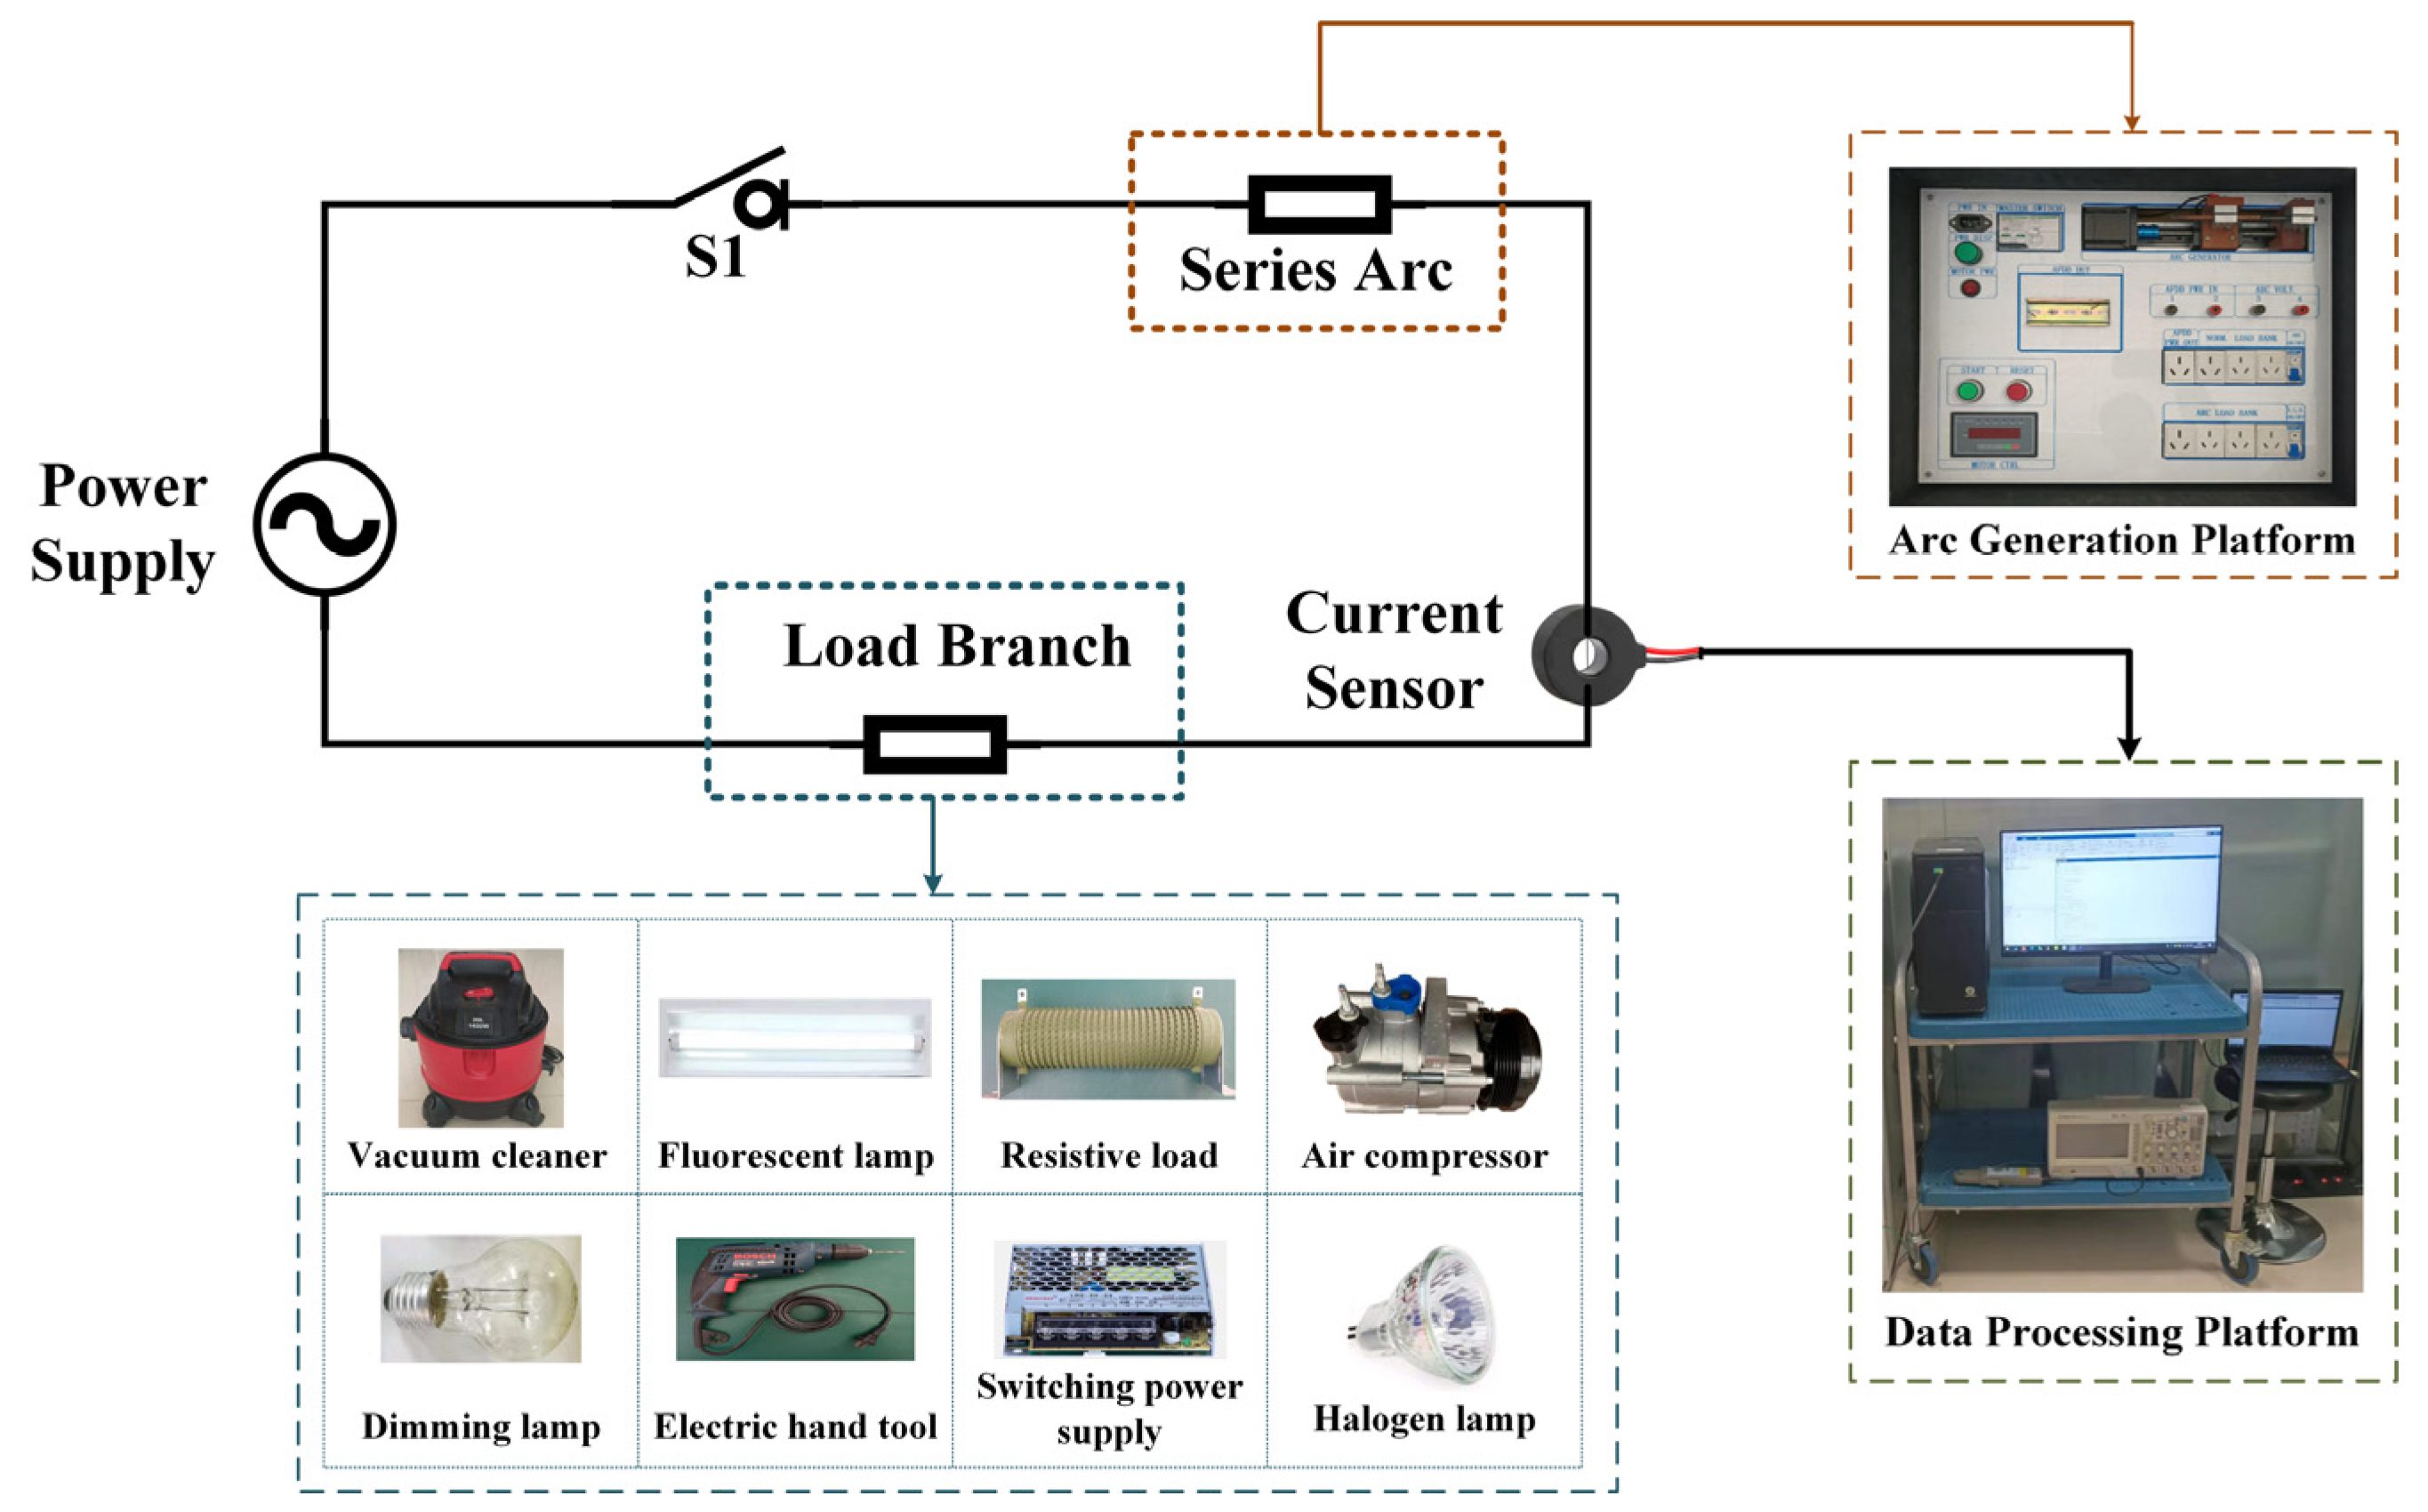
Second, a true arc-fault test platform was built. Arc-fault data under various typical AC loads were collected by high-precision transformers and a data set was made. An arc-fault detection model based on the attention mechanism is built, and an arc-fault detection algorithm with the best performance in detection accuracy is formed.
Third, according to the weight calculation of the input data by the model attention mechanism module, the input spectrum data are divided. Through experiments, the performance of different part data combinations on the accuracy of the model is tested, and the effect of each part data on the accuracy of the model is determined. Then, the input data combination with the best accuracy performance is obtained, and the input data optimization method in line with the existing knowledge in the field of arc-fault detection is formed, which fundamentally reduces the calculation pressure of the model. The lightweight model is more suitable for deployment on industrial-grade embedded platforms, and a complete arc-fault detection scheme is finally formed.
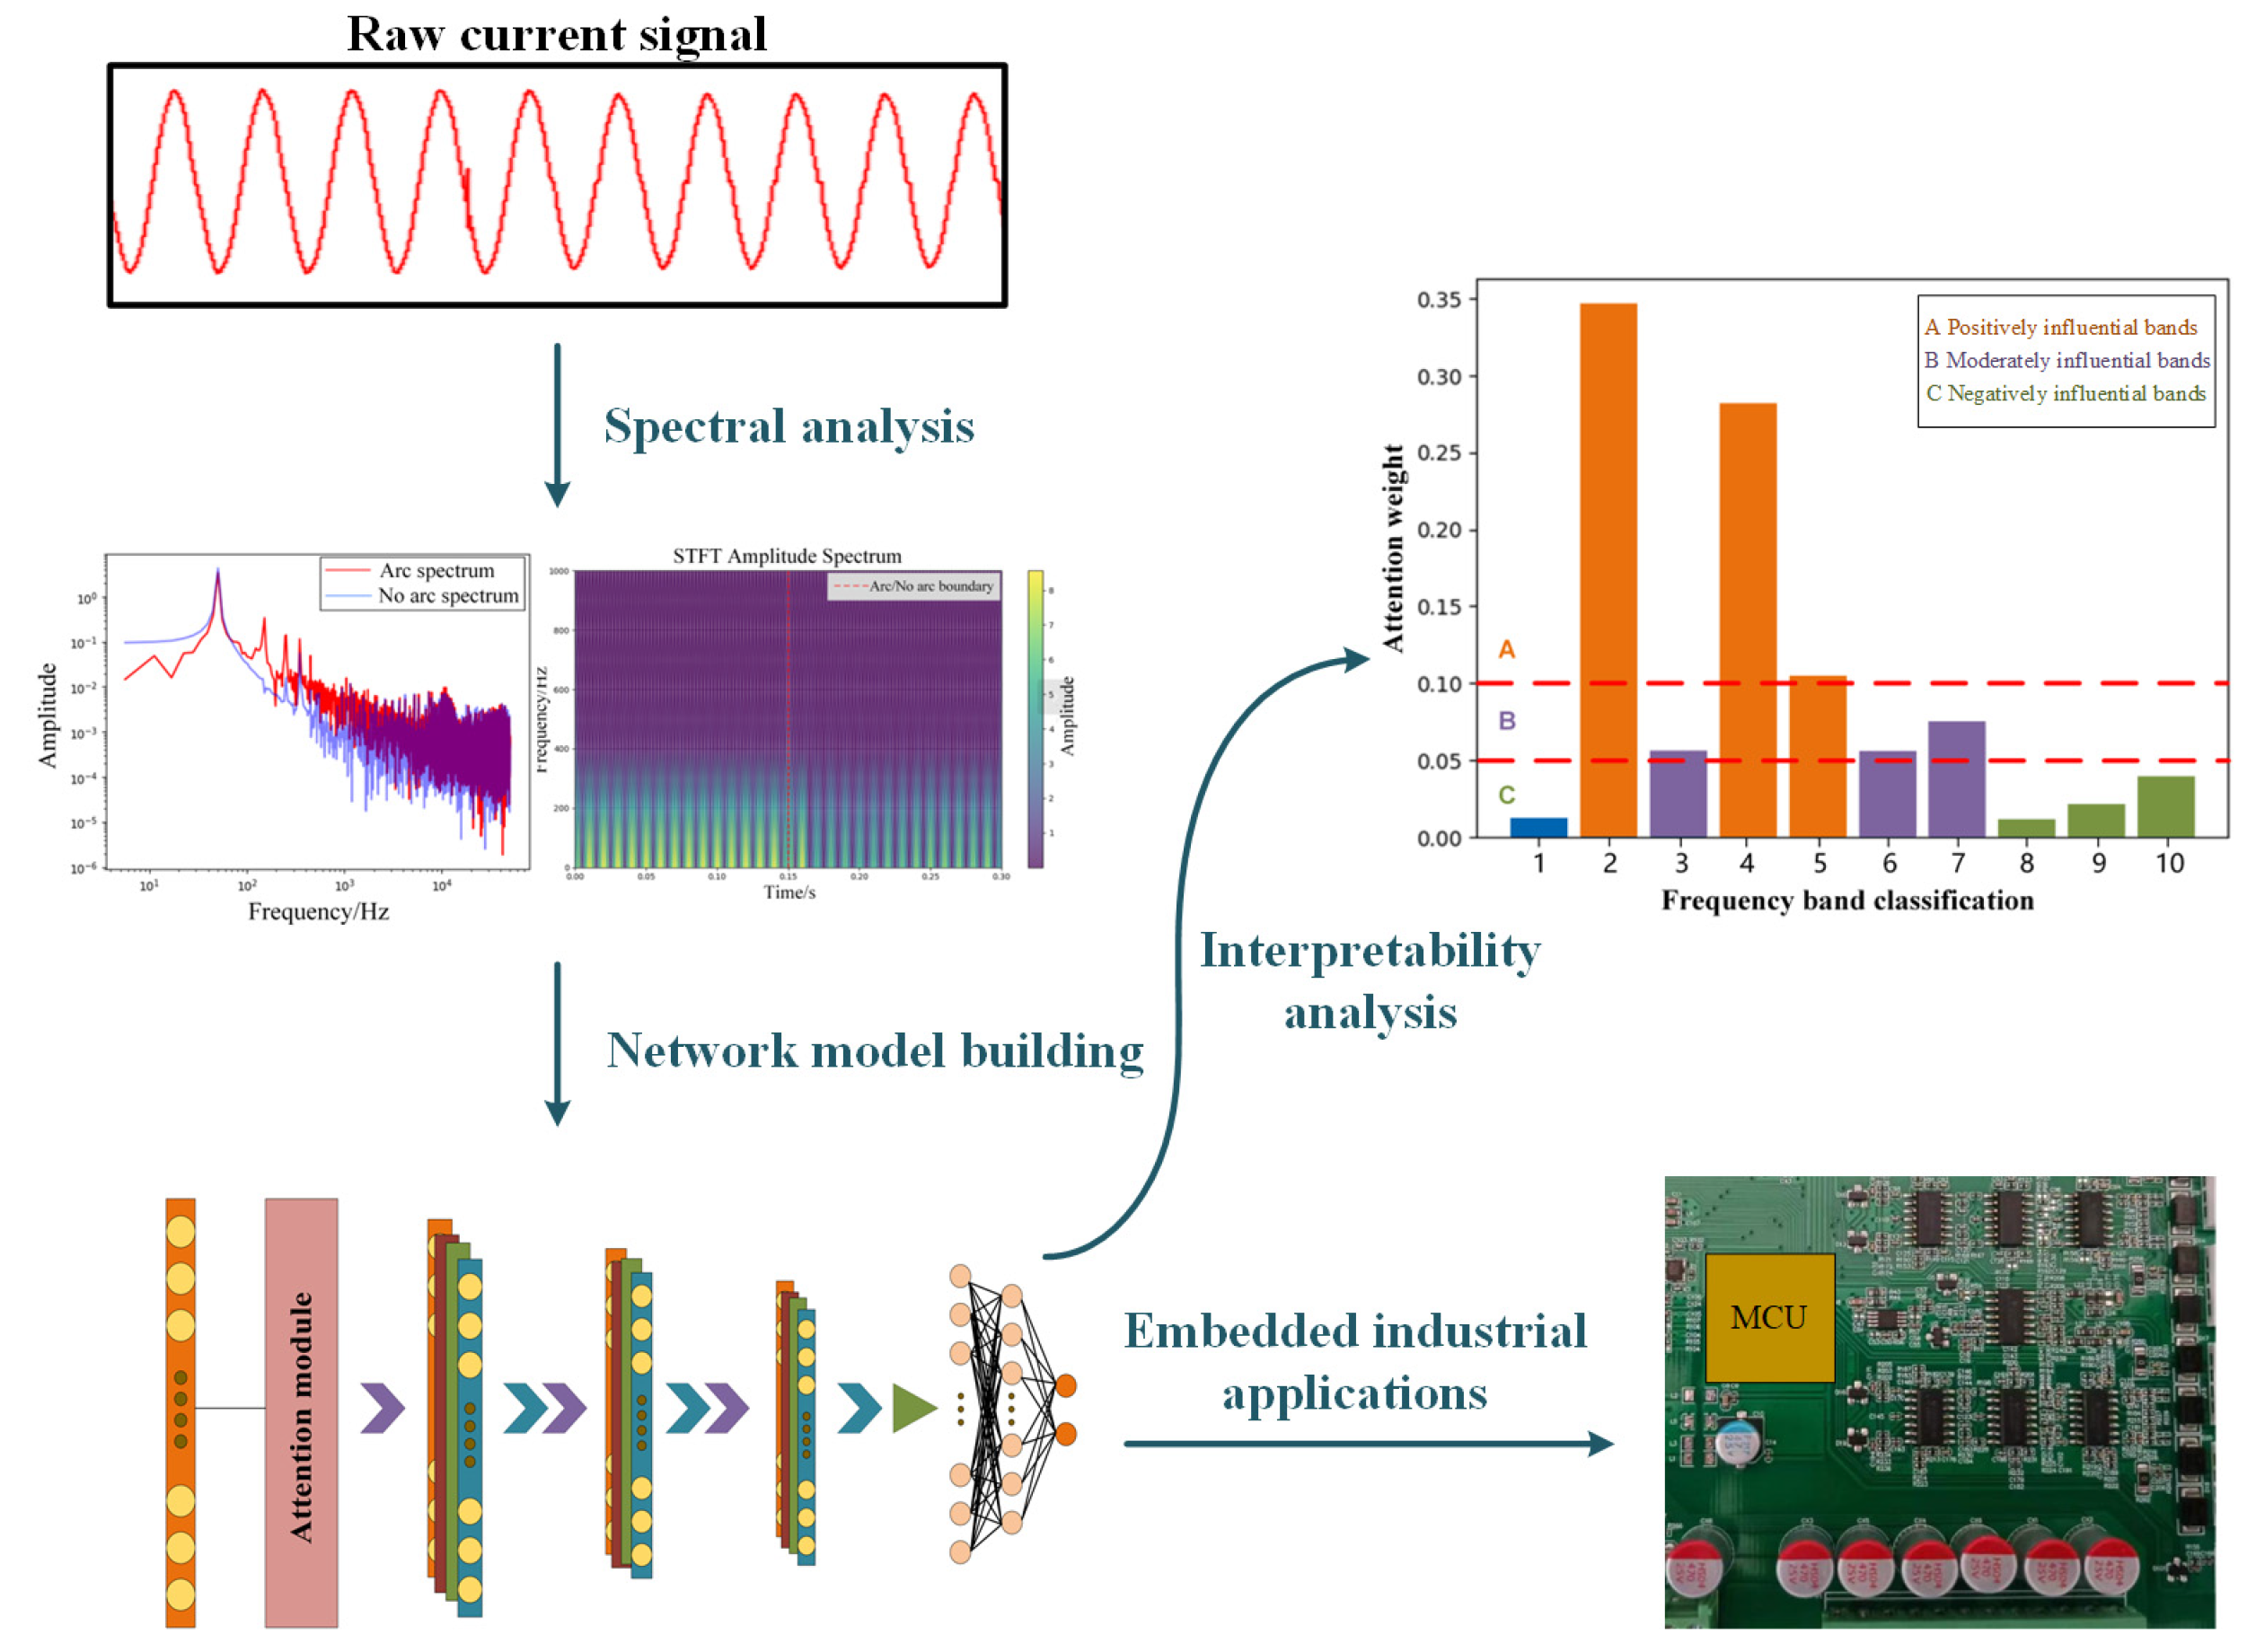
The flow chart of the proposed method is shown in 
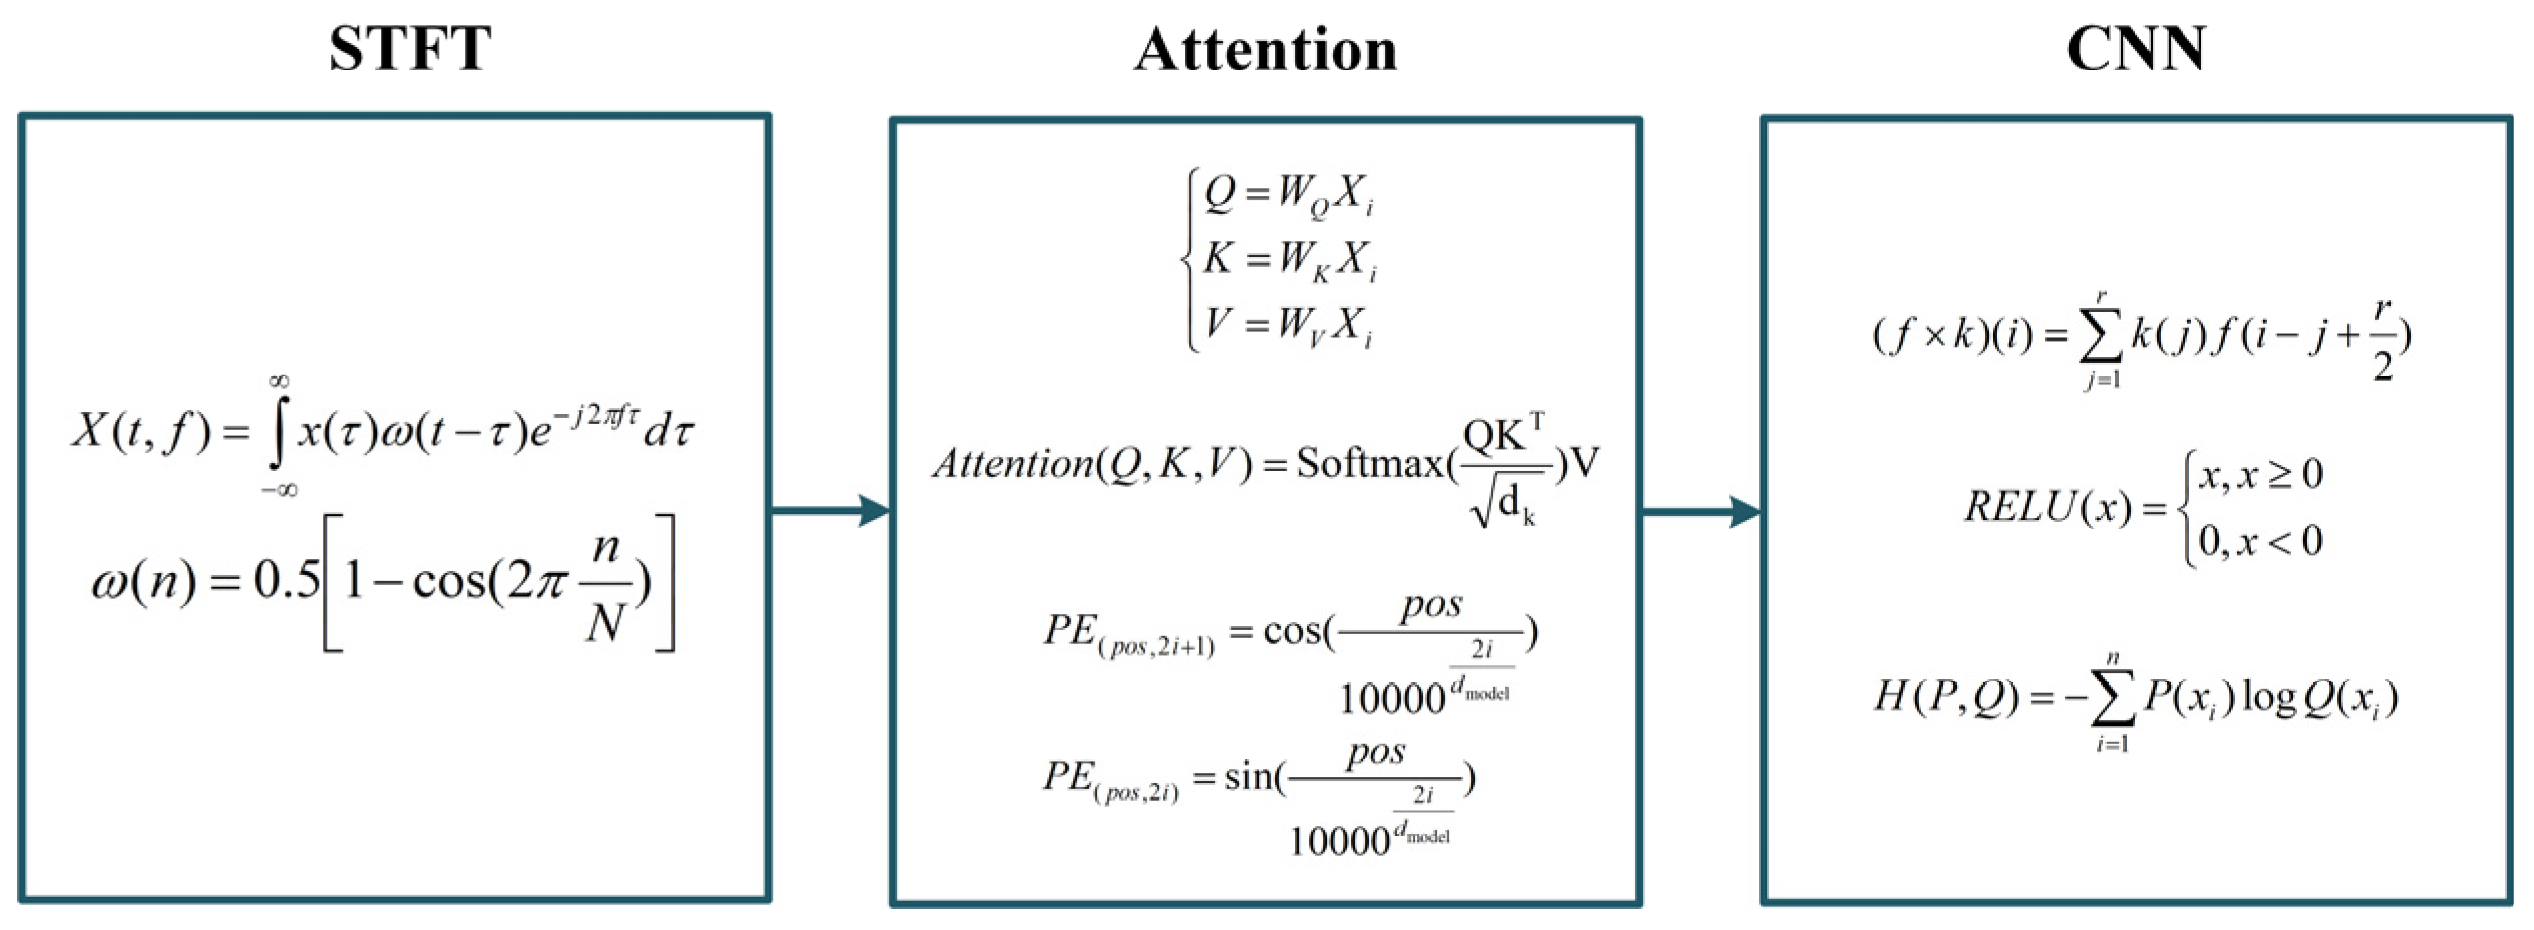
Figure 1. The algorithm flow chart of this paper is shown in 
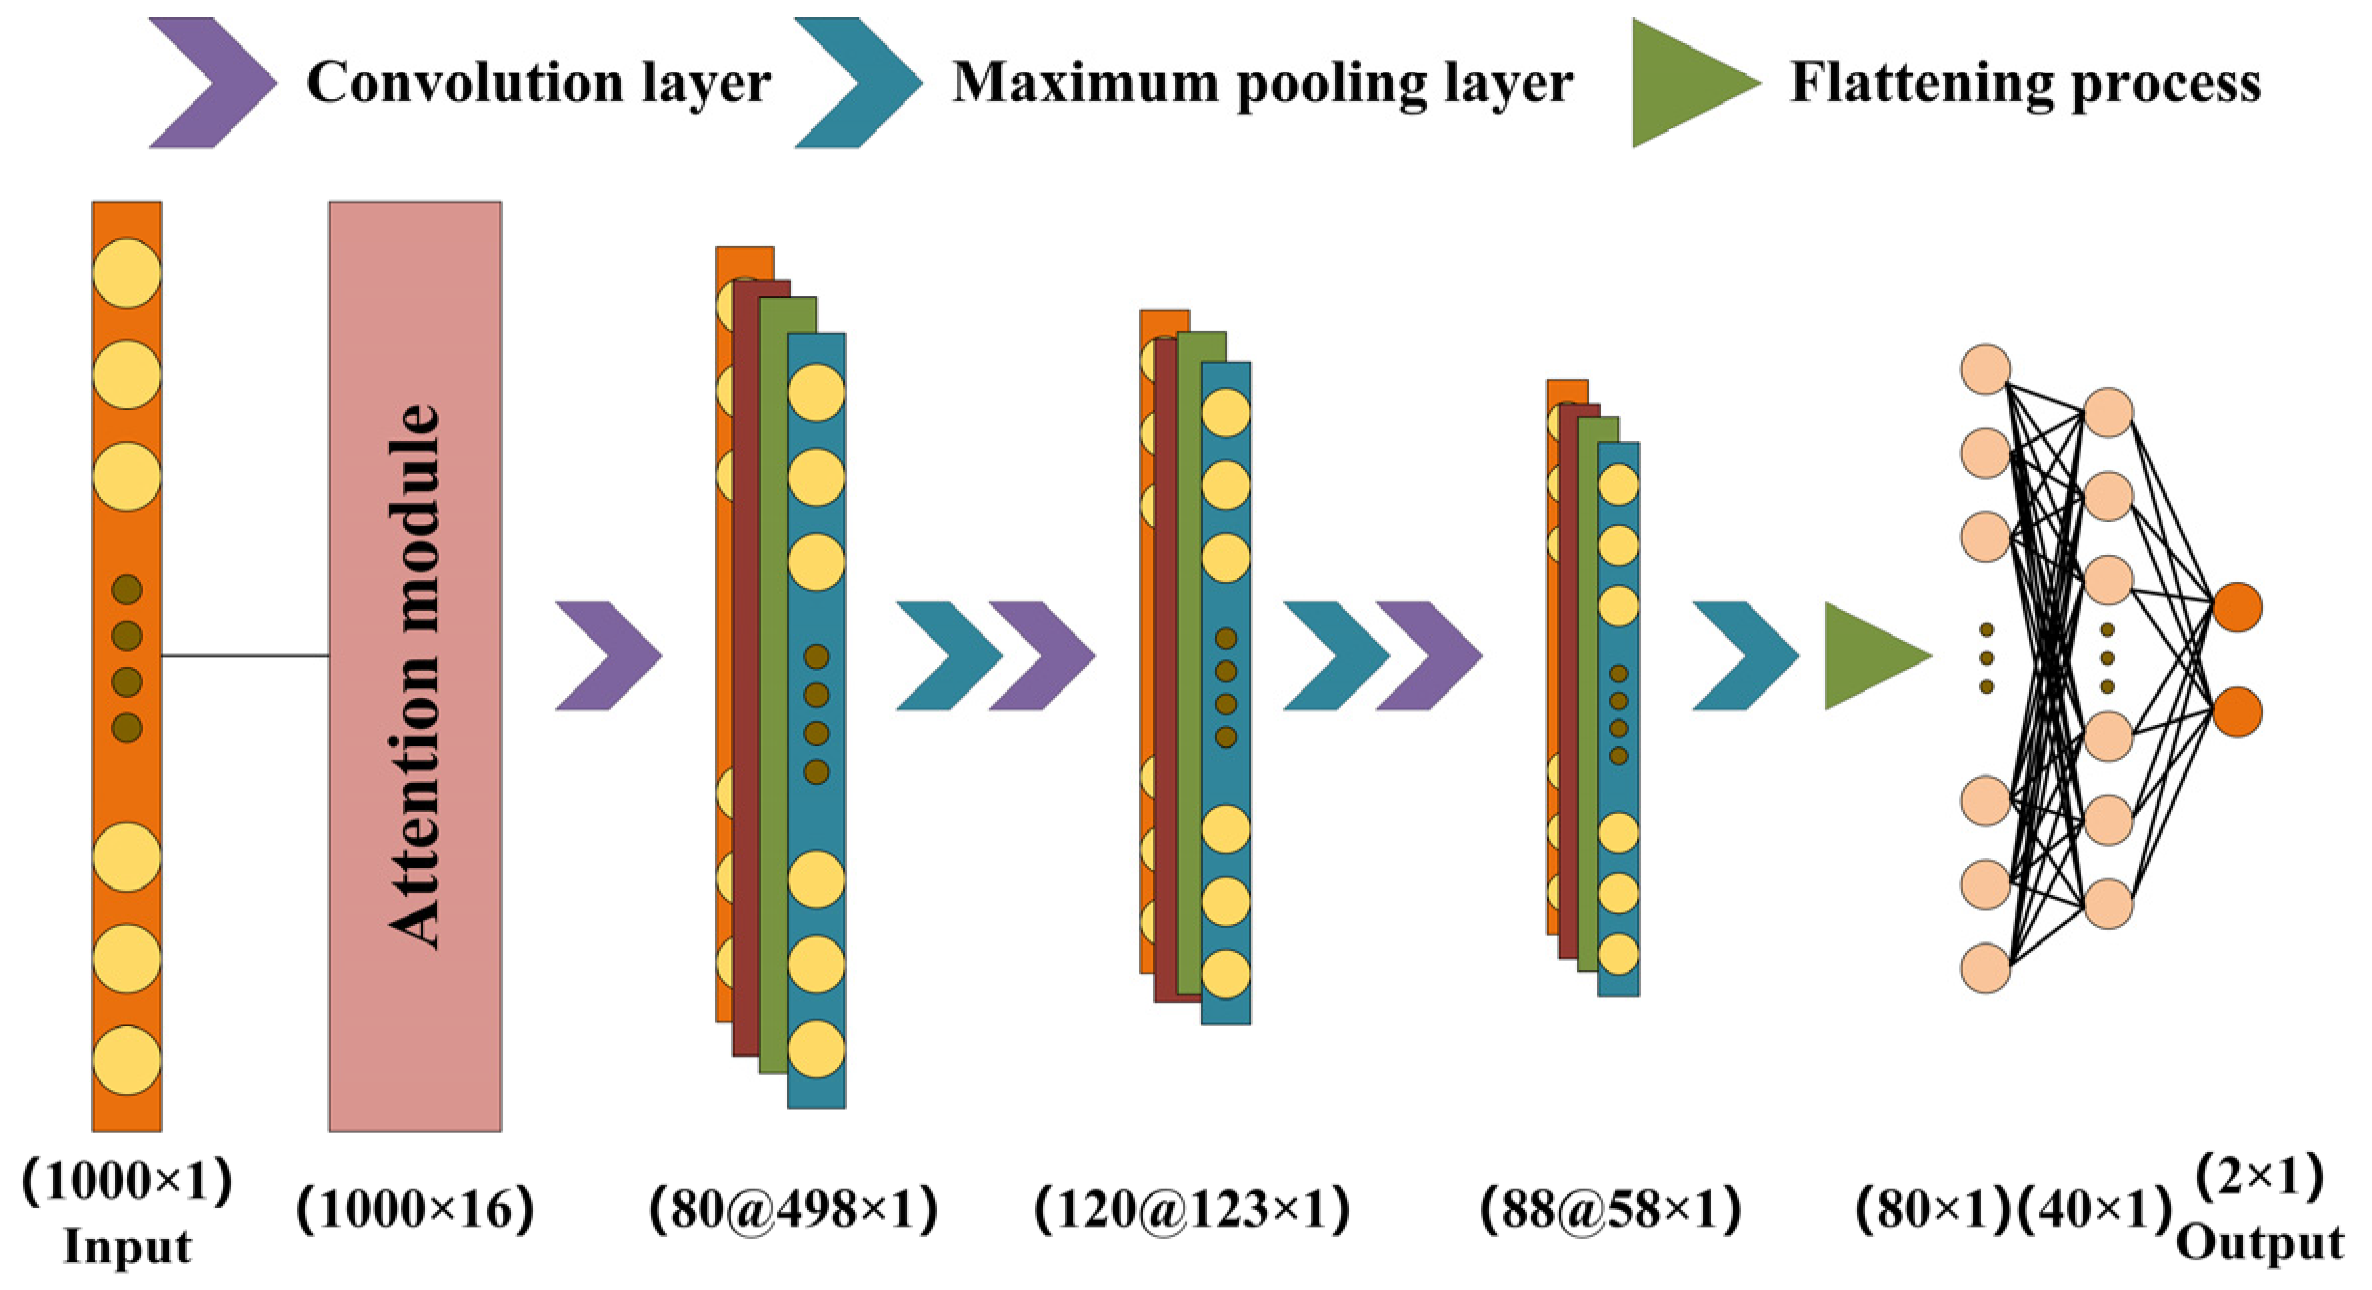
Figure 2. The attention mechanism is a technology widely used in the fields of machine learning and artificial intelligence. It simulates the human attention mechanism, so that the model can selectively focus on some parts of the input data, thereby improving the performance and efficiency of the model. In deep learning, the attention mechanism is usually used to process sequence data. It can help the model to pay different types of attention to the input data at each time step or vocabulary in order to better capture important information. The core idea of the attention mechanism is to dynamically allocate weights based on the input data, so that the model can focus on the most meaningful part of the current task. The convolutional neural network is a deep learning model, which is mainly used to deal with visual-related tasks, such as image classification, target detection, and image segmentation. The design inspiration of the CNN comes from the working principle of the biological vision system. The features in the image are extracted by the convolution operation and pooling operation and classified or regressed by the fully connected layer. In this paper, the data are processed by short-time Fourier transform, and the arc-fault detection model is built by combining an attention mechanism and convolutional neural network.
The arc-fault current feature set is obtained by the spectral analysis of the original current data. A convolutional neural network model based on an attention mechanism is built to process the frequency domain data of the arc fault. The model proposed in this paper is interpretable. By comparing the training effects of different feature frequency bands in the model, the readability of the model is enhanced. Finally, the proposed method is deployed on hardware. After verification, it is found that the detection accuracy and judgment time of the proposed method for arc faults meet the requirements.

2. Data Acquisition and Analysis

2.1. Data Acquisition

Due to the randomness of the location of the arc, it is difficult to collect the arc-fault voltage. However, the arc current can be directly collected by the current transformer, so it has become the main research object of arc-fault detection. The research of series arc-fault detection requires a lot of data. However, the occurrence of arc faults in real scenarios is usually difficult to predict, and it is difficult to collect a large number of arc-fault current signals. Therefore, an arc-fault test platform is built according to IEC 62606 standard, as shown in Figure 3 [18]. The arc-fault test platform is composed of an arc-fault generator, load, AC source, and arc signal processing platform. Its core is the arc generating device, which is used to generate the arc. The AC power supply voltage used is 220 V, 50 Hz. The load of the test platform includes the resistive load, switching power supply, fluorescent lamp, dimming lamp, air compressor, halogen lamp, hand drill, vacuum cleaner, and a total of eight kinds of loads. The arc-fault generator is used to generate the arc. It connects a set of copper rods and carbon rods to the main circuit and drags the copper rods and carbon rods with a stepper motor. When the system voltage and the distance between the copper rod and the carbon rod are fixed, the arc fault can be generated. The arc signal processing platform includes a current transformer and a data processing platform. The current transformer collects the arc signal in the main circuit. The arc signal is processed offline through the data processing platform to construct the arc-fault feature data set. The specific parameters of this chapter and the subsequent tested and analyzed loads are shown in Table 1. The data processing platform, including an oscilloscope and related computer equipment, can store the current data collected in real time and analyze the waveform and spectrum, and establish a multi-load characteristic data set of low-voltage AC series arc faults.
Through the offline analysis of the arc current data collected by the experimental platform, the frequency domain information under different loads is obtained. It can be seen from Figure 4 that, in the cases of arc and no arc, the air compressor, fluorescent lamp, switching power supply, halogen lamp, and resistive load have obvious differences in the frequency band below 1 kHz, the vacuum cleaner load has obvious differences in the frequency band below 100 Hz, and the handheld electric drill load has obvious differences in the frequency band above 10 kHz. The dimming lamp load shows serious aliasing in the whole frequency band under the conditions of arc and no arc, which is difficult to distinguish. The multi-type load presents different characteristics, and the traditional threshold method cannot fully cope with it [19]. Therefore, further mining of spectrum information is needed.

2.2. Short-Time Fourier Transform

Arc faults can produce a large amount of heat in a short time and cause serious fire hazards. The relevant standards have mandatory provisions on the maximum breaking time of an arc current. Therefore, the arc-fault detection method should also pay full attention to the timeliness of the method. The information contained in the arc current during the occurrence of the arc fault will also be affected by the randomness of the arc, resulting in sequential fluctuations. Short-time Fourier transform can not only extract the frequency domain information of the arc fault, but also show the change process of arc current information from the time domain perspective, and can control the response time of the method by specifying the time of the window.
The essence of the short-time Fourier transform is to window and cut off the non-stationary time-varying signal. Then Fourier transform is performed on the truncated signal, which can be regarded as local stationary processing. The result of the transform is a two-dimensional function of time and frequency, and the energy distribution of different frequency bands of the arc fault at each time can be obtained, that is, the frequency band range that changes with time and the changes are more concentrated.
When using short-time Fourier transform for time–frequency analysis, it is necessary to pay attention to the conversion of time resolution and frequency resolution. For example, a section of the data with a sampling rate of 500 kHz and 2 s is cut into 100 sections in a power frequency cycle, and then Fourier transform is performed on each section of signal. The frequency resolution is not higher than 50 Hz, and the minimum recording length is 0.02 s. The minimum data length recorded in a power frequency cycle is 10,000. Although the frequency resolution can only reach 50 Hz when the time resolution is 20 ms, it can meet the needs of signal analysis in the range of 0~250 kHz.
In the process of signal truncation, there is often a phenomenon of ‘spectrum leak-age’. In order to suppress this effect, the sampling data are usually windowed. The commonly used window functions are rectangular window, triangular window, Hanning window, and so on. In the subsequent analysis, the Hanning window is used, and its expression is (1). In Equation (1), w represents the frequency, t represents the time, and n/N represents the ratio of the data in the time window to the entire amount of data.
ω ( n ) = 0.5 1 cos ( 2 π n N )
The current data collected by the eight loads specified by IEC62606 are analyzed by short-time Fourier transform, and the results are shown in Figure 5. In order to accurately identify the AC arc signal, it is very important to select the appropriate time window. The smaller the time window, the better the time resolution of the spectrum results, but this will overload the computing power of the hardware processor. An excessive time window will affect the time domain resolution and reduce the real-time performance of the detection scheme. In order to balance the real-time requirements of the arc detection task and the resolution of the arc characteristics in the frequency domain, this paper selects a 20 ms time window. The time window satisfies the maximum allowable tripping time of the detection standard and provides effective features for distinguishing the arc fault and normal state.
From the STFT analysis, it can be seen that the spectrum of some arc loads, such as vacuum cleaner, switching power supply, and resistive load, changes significantly before and after the occurrence of arc. Due to the overlap of frequency bands, the frequency spectrum of some loads, such as electric drills and halogen lamps, does not change significantly when the arc occurs. It is difficult to identify arc faults by the direct threshold method. The method based on artificial intelligence has obvious advantages in feature extraction and information perception. At the same time, it can process a large amount of data and explore the rules. Therefore, it can be selected as an effective method to realize the accurate identification of arc faults.

3. Attention Mechanism Model Construction

3.1. Analysis of Attention Mechanism Methods

The convolution neural network has excellent one-dimensional sequence data classification ability and can accurately extract the characteristics of arc currents and normal working currents. A series of deep learning algorithms, such as the convolutional neural network, have high arc-fault recognition accuracy. However, their powerful learning ability comes at the expense of a large number of network parameters and computational complexity, making the model size and computational complexity far greater than the memory capacity and computing power of embedded microprocessors. Therefore, it is necessary to apply the interpretability technology of deep learning for arc-fault identification, extract key arc features, optimize network structure, and reduce network parameters and calculations, so that the arc-fault identification algorithm based on deep learning can be applied to the arc-fault detection device with an embedded microprocessor as the main application scenario.
The attention mechanism enables the neural network to focus on important information, thereby improving the network’s ability to identify arc faults [20]. The interpretability of the attention mechanism enables people to grasp the decision-making behavior of the network model: the key feature frequency bands of the low-voltage AC series arc fault are extracted by visual feature weights to improve the reliability of the network. Therefore, the research of the weight calculation method has become the key of the interpretable method to extract the key characteristic frequency bands of arc faults.
As one of the most commonly used and easy to implement ANNs and the most typical multi-layer feedforward network, multi-layer perceptron (MLP) has been proved to be a universal approximator. It is one of the most mature and widely used neural network models in the field of neural networks. The MLP can fit any nonlinear function. However, its training cost is relatively high, and it is slow to process large-scale data sets and high-dimensional features. Therefore, it is necessary to pay attention to the balance of performance and efficiency in practical applications. The topological structure of MLP includes an input layer, hidden layer, and output layer. By learning a large number of input–output data samples, the gradient descent algorithm can continuously adjust the weights and thresholds of the network by means of back propagation, and establish a mathematical model that can reflect the input and output relationship between these kinds of modes. The algorithm is called the BP algorithm. Theoretically, the BP algorithm has a strong nonlinear mapping ability and can approximate any continuous function [21]. The weight calculation method of the multi-layer perceptron method can be expressed by (2). In Equation (2), q represents query, k represents key, and W represents the corresponding matrix of the corresponding component.
a ( q , k ) = w 2 T tanh ( W 1 q ; k )
The bilinear convolutional neural network (B-CNN) is an end-to-end model proposed by Lin et al. in 2015. Its network structure is composed of two branch networks to extract features, and the outer product multiplication operation is performed at each position of the output image, so that the information of each channel can be linked to obtain image descriptors [22]. In order to improve the expression ability of the image, second-order statistical information is used in the bilinear pooling layer, which is particularly useful for fine-grained classification. The difference between this network model and other models is that it uses two convolutional neural networks, A and B, to extract image features. These two convolutional neural networks can be the same network structure or different network structures. The two network structures of VGG-M and VGG-D used by Lin et al. cooperate with each other to perform important steps in the fine-grained image classification task: region detection and feature extraction. Finally, the extracted features are sent to the classification layer for prediction after the outer product and pooling operations. Relationship mapping between q and k is directly established by a weight matrix, which is more direct and faster. The weight calculated by the bilinear method can be expressed by (3). In Equation (3), q represents query, k represents key, and W represents the corresponding matrix of the corresponding component.
a ( q , k ) = q T W k
The attention mechanism presents diversity and complexity [23]. The dot product attention mechanism is a technology widely used in a variety of deep learning models, especially in the tasks of processing sequence data and complex interactions. This mechanism works by calculating the relationship between queries, keys, and values. The advantage of the dot-product attention mechanism is that the calculation is simple and efficient because the dot-product operation of the vector has the characteristics of parallel computing, which is suitable for large-scale computing. In addition, the dot-product attention mechanism can also better preserve the overall structure information of the input because it directly measures the correlation between the query and the key through the dot product. The calculation of the dot-product attention weight can be expressed by (4). In Equation (4), q represents query, k represents key, and W represents the corresponding matrix of the corresponding component.
A t t e n t i o n   W e i g h t s = softmax ( Q K T d k )
The benefits and drawbacks of the three techniques are illustrated in Table 2.

3.2. Scaling the Dot-Product Attention Mechanism Model

In the current study, the main attention mechanisms used include scaling dot-product attention, addition attention, and convolution attention. Although additive attention shows enhanced processing power for the input of different lengths, and convolutional attention can capture local and global dependencies, the scaled dot-product attention mechanism has higher computational efficiency. In view of the fact that the arc-fault detection task attaches great importance to the real-time performance of the algorithm, the zoom dot-product attention mechanism with higher computational efficiency is selected. The calculation process of the dot-product attention mechanism is shown in Figure 6.
Q = W Q X i K = W K X i V = W V X i
Equation (5) illustrates that Xi represents the input data, whereas WQ, WK, and WV are the weight matrices associated with the query, key, and value, respectively.
The scaled dot-product attention mechanism calculates the attention score by calculating the dot product between the query and the key. Subsequently, these scores are measured by dividing the square root of the dimension of the key. Then, the SoftMax function is applied to obtain the attention weight. The output of the attention mechanism is calculated by the dot product between the attention weight and the value. The mathematical expression of the dot-product attention mechanism is:
A t t e n t i o n ( Q , K , V ) = Softmax ( QK T d k ) V
dk represents the dimension of the key.
In the scaled dot-product attention mechanism, sinusoidal position coding is used. This coding method does not need to be learned through training. By applying sine and cosine functions of different frequencies to each position, positional encoding is created by alternating the sin function and the cos function, and a unique encoding value can be generated for each position. The sine position encoding is shown in Formulas (7) and (8).
P E ( p o s , 2 i + 1 ) = cos ( p o s 10000 2 i d model )
P E ( p o s , 2 i ) = sin ( p o s 10000 2 i d model )
PE(pos, 2i) and PE(pos, 2i + 1) represent the coding values of the 2i and 2i + 1 columns in the row of the coding matrix position, respectively, and dmodel represents the dimension of the position vector.
The proposed model uses 1D convolution to extract arc features, and the feature extraction layer composed of multi-layer convolution optimizes network parameters through repeated back propagation and forward propagation. If the length of 1D convolution vector f is l and the length of convolution kernel k is r, then the result (f × k) of the j-th convolution kernel in the i-th convolution can be expressed as (9).
( f × k ) ( i ) = j = 1 r k ( j ) f ( i j + r 2 )
The revised linear unit activation function can be mathematically represented by (10).
R E L U ( x ) = x , x 0 0 , x < 0
The loss function in the model suggested in this study is the cross-entropy function, as represented by (11).
H ( P , Q ) = i = 1 n P ( x i ) log Q ( x i )
P and Q are the proper and approximate random variable X distributions, respectively.

3.3. Data Preprocessing and Database Creation

The normal working condition current data and arc-fault current data under various experimental conditions were collected through the experimental platform. The experimental platform in this study processed the current data, both with and without arcs, using short-time Fourier transform (STFT). The processed data were then organized and divided into the following sets: The training set comprised 75% of the data, the test set comprised 10%, and the verification set comprised 15%, as indicated in Table 3.
The network structure of the proposed model is shown in Figure 7. The specific parameters of the network structure are shown in Table 4.
During each 20 millisecond interval, a total of 2000 data points of the current signal were gathered at a sample frequency of 100 kilohertz. The spectrum amplitude data obtained by STFT were normalized and then inputted into the model. The network comprises an attention module, three 1D convolution layers, three maximum pooling layers, and three fully linked layers. The convolutional layer learned to extract the features of the input data through convolution operations. These features can be edge, texture, or more advanced features, which help to capture the local structural information of the data. The maximum pooling layer reduces the dimension and calculation of the data by pooling the input data, which helps to improve the computational efficiency of the model. The fully connected layer is responsible for connecting all the neurons in the previous layer with each neuron in the current layer to achieve the combination of features. The initial convolutional layer was equipped with 80 filters. The second convolutional layer was equipped with 120 filters. The third convolutional layer was equipped with 88 filters. The kernel size of all filters in the convolution layer was 5 × 1. The maximum pooling layer size was 2 × 1, which can effectively reduce the feature map size and improve the calculation efficiency. The stride of the first convolutional layer was 2. The stride of the second convolutional layer was 2. The stride of the third convolutional layer was 1. The stride of the initial maximum pooling layer was 2. The stride of the second maximum pooling layer was 2. The stride of the third maximum pooling layer was 1. Following the last pooling layer, the data were transformed into a flattened state in order to decrease the data’s dimensionality. The output layer was the classification layer, where the score was transformed into the probability of 1. The class with the highest probability was considered the final classification state.

4. Model Results and Analysis

4.1. Model Calculation Results

This paper utilized 120 epochs for training, with a batch size of 100 and an initial learning rate of 0.00001. The results show that the recognition accuracy of the proposed model for arc faults under different loads reaches 99.69%. The characteristic frequency band of the arc critical energy spectrum based on interpretability extraction can accurately characterize the arc characteristics, and reduce the network parameters and calculation amount while maintaining the accuracy of network identification, which proves the feasibility of using interpretability method to extract arc characteristics.
The selection of characteristic frequency band is very important for arc-fault identification. The characteristics of low-voltage AC series arc faults are mainly distributed in the frequency range of 1 kHz to 100 kHz. However, in frequencies higher than 20 kHz, the energy spectra of the arc state and the normal operation state overlap in some frequency bands. The energy spectrum of overlapping frequency bands will not be conducive to the identification of arc faults, and even reduce the accuracy of the model. Therefore, it is necessary to extract the key arc features that are conducive to arc-fault identification from the arc features from 1 kHz to 100 kHz.
The eight different loads specified in IEC62606 in AC series arc-fault detection are trained in combination with the interpretable arc-fault identification network based on the attention mechanism proposed in this paper. The training outcomes are presented in Table 5, while the associated confusion matrix is displayed in Figure 8.
According to the analyses of confusion matrix-, accuracy-, recall-, and precision-related parameters, the model proposed in this paper is tested under eight different loads specified in IEC62606, and the performance of the model proposed in this paper is verified in the test data set. The horizontal axis of the matrix is the model prediction category, and the vertical axis is the actual category. Diagonal data are the number of correctly identified samples. The inaccuracy of the confusion matrix has a minimal impact on the accuracy of arc detection, and it does not result in any incorrect or overlooked judgments. The detection error primarily occurs in the resistive, motor, and power electronic loads. The arc current waveform of both the resistive load and the motor load closely resembles the average current waveform of the power electronic load, resulting in a minimal detection error.

4.2. Model Attention Weight Analysis

Choosing specific frequency bands is crucial for identifying arc faults. The primary distribution of features for low-voltage AC series arc faults occurs between 1 kHz and 100 kHz. However, beyond a specific frequency range over 20 kHz, the energy spectrum without arcs overlaps, which hinders the detection of arc defects and even diminishes the precision of the model. Thus, the essential characteristics of the arc that help identify arc faults are removed. To validate the functionality of the attention mechanism employed in this paper, the attention spectrum weight map is depicted for various loads.
The horizontal axis in Figure 9 depicts the categorization of frequency bands, whereas the vertical axis represents the magnitude of the attention weight for each frequency band. The collected data are organized into groups with a frequency interval of 5 kHz. The test data are further separated into ten groups to highlight the significance of weights in various frequency ranges.
It can be seen in Figure 9 that the attention weights of groups 2, 4, and 5 are the largest, representing data in the ranges of 5–10 kHz and 15–25 kHz; the weights of groups 3, 6, 7 are the second highest, representing 10–15 kHz and 25–35 kHz; and the weights of groups 8, 9, and 10 are the smallest, representing a data range of 35–50 kHz. Due to the timeliness of arc detection, in order to meet the needs of arc-fault detection accuracy and detection efficiency, the influence of group 1 on test accuracy is not considered. In order to meet the timeliness of arc detection, the above frequency bands are divided into three levels, A, B, and C, according to the degree of attention influence, as shown in Table 6.
It can be seen in Table 7 that A, B, and C have a certain influence on the accuracy of the model proposed in this paper. In the case of pairwise combinations, AB has the highest accuracy, AC is the second highest, and BC is the lowest. Because A has a great influence on the frequency band of the test data and the attention weight accounts for a high proportion, when the data tested in the model include the data of the middle frequency band of A, it will have a positive impact on the accuracy of the results of the whole model’s operation. Similarly, because the influence weight of the C middle-frequency band on the whole test data band is very small, and the proportion of the attention weight is very low, when the data tested in the model include C middle-frequency band data, it will not be conducive to the accuracy of the whole model for arc-fault judgment. Because the corresponding data in the frequency band of B have a smaller influence weight on the attention of the whole model than A, it is larger than C, and the influence weight of the corresponding frequency band is moderate compared with the data in A and C. Therefore, the accuracy of the combination of A and C is higher than that of the combination of B and C; the accuracy of the combination of A and B is higher than that of the combination of A and C.
Since the three different classifications of A, B, and C represent the corresponding frequency band data under different attention weight distributions, when the frequency band data under each weight distribution are input, the model proposed in this paper can maximize the influence of the data. The processing volume of the model network is reasonably allocated to improve the operating efficiency of the model. At the same time, because the data input for the model takes into account different influence weights, the output of the proposed model has the highest accuracy. Because AB has the highest accuracy, it shows that the attention mechanism proposed in this paper has a significant effect. The experimental results show that the characteristic frequency band of the arc critical energy spectrum based on interpretability extraction can accurately characterize arc characteristics and reduce the network parameters and calculation amount while maintaining the accuracy of network identification. When the data with the highest weight ratio of the frequency band are used, that is, the data with frequency bands of 5–10 khz and 15–20 khz, the amount of data input to the model is reduced by 80%. After inputting these data into the model with only one convolution layer and one maximum pooling layer, the accuracy rate is only reduced by 0.32%. This proves that the light weight of the model proposed in this paper is effective.

5. Prototype Design and Experimental Verification

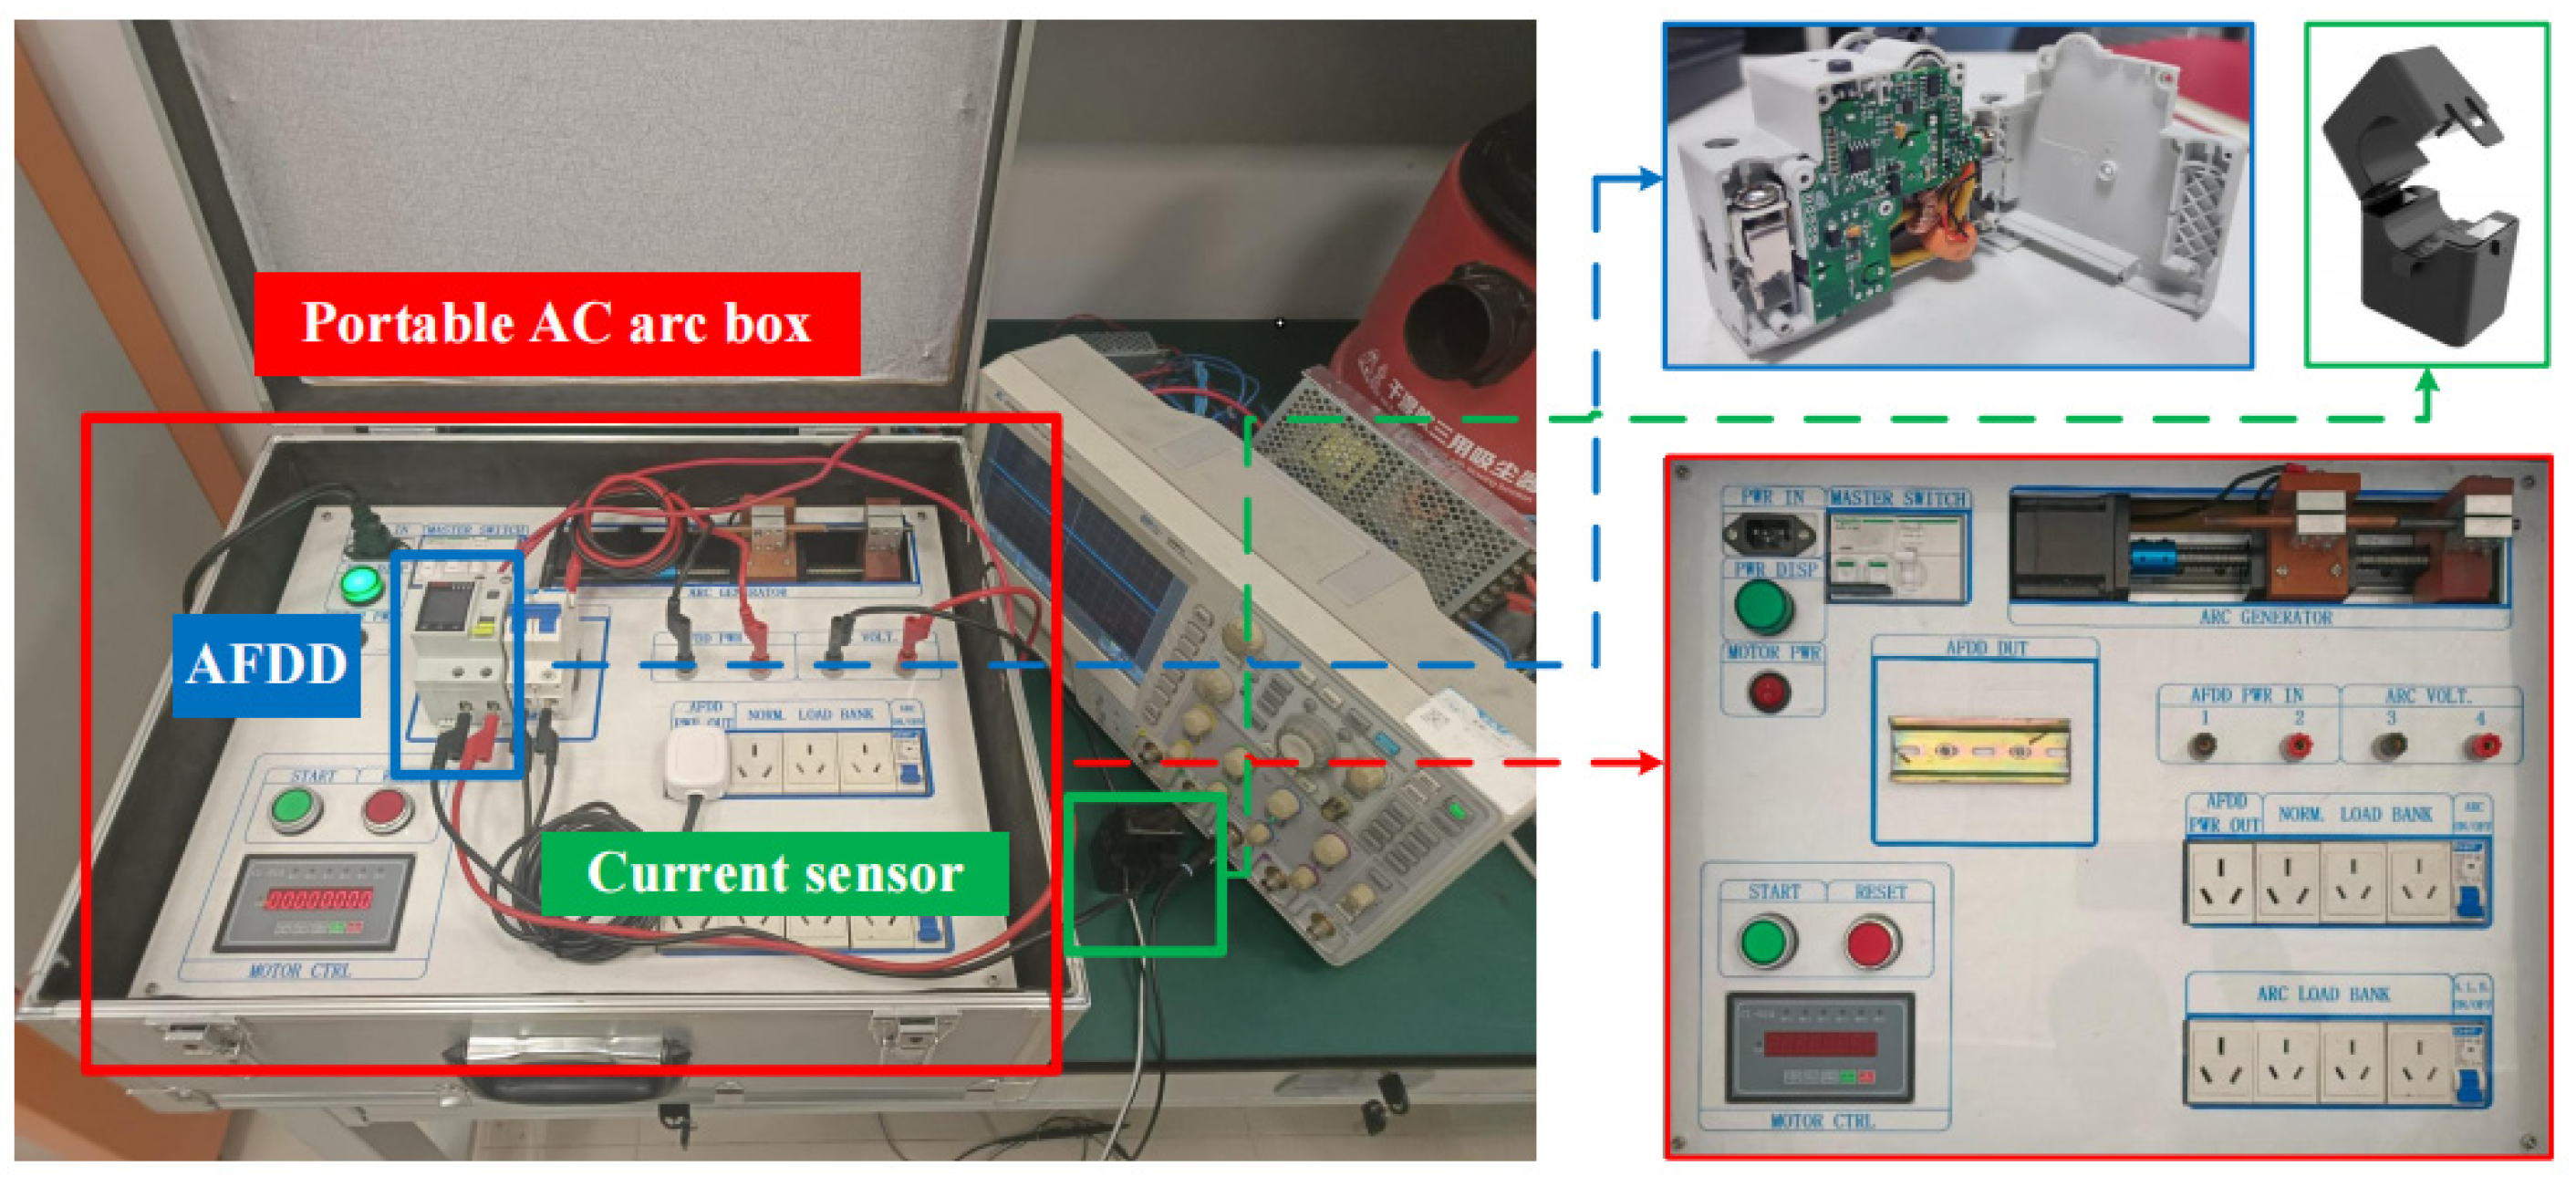
In order to evaluate the performance of the model proposed in this paper, intelligent circuit breakers and low-voltage AC arcing devices are selected to verify the effectiveness of the proposed model, as shown in Figure 10. Firstly, the AC power supply, low-voltage AC arcing device, and intelligent circuit breaker are connected to the multi-load topology. The reliability and effectiveness of the proposed model are verified by testing the breaking of the intelligent circuit breaker under multi-load conditions. Among them, the electrical signal processing module of the intelligent circuit breaker is added to the relevant algorithm of the arc-fault judgment model proposed in this paper. The test samples obtained by different arcing methods are preprocessed by the algorithm and input into the model proposed in this paper for testing. The tripping time of the intelligent circuit breaker meets the IEC62606 standard.
The sampling results of the oscilloscope are displayed in Figure 11.
After testing, the intelligent circuit breaker can meet the requirements of detection accuracy in actual production when using the relevant algorithm of the model proposed in this paper to detect the low-voltage AC series arc fault. The tripping situation of the intelligent short circuit breaker is shown in Table 8.
In order to better illustrate the effectiveness of the proposed algorithm, it is compared with other low-voltage AC series arc-fault detection algorithms. This comparison covers a variety of factors, including the use of arc-fault feature data extraction methods, arc-fault identification methods, load types during detection, and the accuracy of different methods used. The test information related to the algorithm verification platform in Table 8 is from the original text.
The suggested technique is compared to previous algorithms that identify arc faults in low-voltage AC series circuits. The pertinent data are derived from the primary source, as indicated in Table 9. By comparing them, it is evident that this method has the best level of recognition accuracy. The method described in this paper has significant advantages, since it may fulfill the load type prescribed by IEC62606.
Table 9 shows the superiority of the proposed algorithm in detection accuracy. At the same time, this paper identifies the faults of several loads under the IEC62606 standard and has ideal accuracy. At the same time, the method used in this paper can meet the needs of circuit breakers for the timely tripping of arc faults, and the tripping time meets the IEC62606 standard. Therefore, the method proposed in this paper is superior to other methods.

6. Conclusions

This work presents a method for detecting lightweight AC arc faults that operate at a low voltage. The method is based on an interpretable approach. A data-gathering platform designed explicitly for arc faults was constructed, and a comprehensive data set of low-voltage AC arc faults was established. The frequency domain characteristics of various load types are determined by STFT analysis, yielding the spectrum distribution of distinct loads during regular operation and in the event of a fault. The arc-fault detection model is constructed by integrating the attention mechanism module with the neural network model, resulting in a model accuracy of 99.69%. Sub-band attention weight analysis optimizes the input data, reducing network parameters and computation without compromising network accuracy. The experimental results demonstrate that this approach satisfactorily fulfills the criteria set by the IEC 62606 standard and possesses practical utility.
This paper provides an implementation scheme for the arc-fault protection of a low-voltage distribution network. Because the algorithm does not require high computing power, the cost of the required deployment platform is effectively reduced, and the arc-fault protection device has the possibility of distributed large-scale deployment, which is necessary for the detection of arc faults with strong randomness of location. When the arc fault is detected, the protection device of this algorithm can remove the arc current in time, and can avoid the arc fault from developing into other electrical faults, such as overcurrent and luminous connection, and provide information for the maintenance and troubleshooting of the line. Once the algorithm is deployed in large quantities, it can also provide a certain reference value for the location of the fault’s location. Therefore, the proposed method has a positive effect on the design and maintenance of the low-voltage distribution network.

Author Contributions

Conceptualization, X.N. and D.S.; methodology, T.L.; software, D.S.; validation, X.N., D.S. and T.L.; formal analysis, T.L.; investigation, D.S.; resources, Y.W.; data curation, D.S.; writing—original draft preparation, W.H.; writing—review and editing, J.X.; visualization, X.N.; supervision, Y.W.; project administration, Y.W.; funding acquisition, Y.W. All authors have read and agreed to the published version of the manuscript.

Funding

This article is supported by the State Grid Corporation of China’s scientific and technological project (project name: “Research and Application of Key Technologies for Fire Protection and Fire Disposal of Electrical Faults Caused by Fire in Low-voltage Distribution Networks”; project number: 5400-202326208A-1-1-ZN).

Data Availability Statement

The original contributions presented in the study are included in the article; further inquiries can be directed to the corresponding author.

Conflicts of Interest

Author W.H. was employed by the company Ganzi Power Supply Company, State Grid Sichuan Electric Power Company. The remaining authors declare that the research was conducted in the absence of any commercial or financial relationships that could be construed as a potential conflict of interest.

References

  1. Fire Department 2023 Fire Statistics. Available online: https://www.119.gov.cn/qmxfgk/ (accessed on 9 November 2023).
  2. Xiang, L.; Du, Y.; Wang, X.; Chen, M. Tripping Characteristics of Residual Current Devices under Non-sinusoidal Currents. IEEE Trans. Ind. Appl. 2011, 47, 1515–1521. [Google Scholar] [CrossRef]
  3. Kim, J.C.; Neacşu, D.O.; Lehman, B.; Ball, R. Series AC Arc Fault Detection Using Only Voltage Waveforms. Proceedings of IEEE Applied Power Electronics Conference and Exposition (APEC), Anaheim, CA, USA, 17–21 March 2019; pp. 2385–2389. [Google Scholar]
  4. Zhao, H.; Liu, J.; Lou, J. Series Arc Fault Detection Based on Current Fluctuation and Zero-current Features. Electr. Power Syst. Res. 2022, 202, 107626. [Google Scholar] [CrossRef]
  5. Xiong, Q.; Feng, X.; Gattozzi, A.L.; Liu, X.; Zheng, L.; Zhu, L.; Ji, S.; Hebner, R.E. Series Arc Fault Detection and Localization in DC Distribution System. IEEE Trans. Instrum. Meas. 2020, 69, 122–134. [Google Scholar] [CrossRef]
  6. Siddique, M.F.; Ahmad, Z.; Kim, J.M. Pipeline Leak Diagnosis Based on Leak-augmented Scalograms and Deep Learning. Eng. Appl. Comput. Fluid Mech. 2023, 17, 2225577. [Google Scholar] [CrossRef]
  7. Yu, W.; Zhao, C. Broad Convolutional Neural Network Based Industrial Process Fault Diagnosis with Incremental Learning Capability. IEEE Trans. Ind. Electron. 2020, 67, 5081–5091. [Google Scholar] [CrossRef]
  8. Yu, W.; Zhao, C. Robust Monitoring and Fault Isolation of Nonlinear Industrial Processes Using Denoising Autoencoder and Elastic Net. IEEE Trans. Control. Syst. Technol. 2020, 28, 1083–1091. [Google Scholar] [CrossRef]
  9. Yu, W.; Zhao, C.; Huang, B. MoniNet with Concurrent Analytics of Temporal and Spatial Information for Fault Detection in Industrial Processes. IEEE Trans. Cybern. 2022, 52, 8340–8351. [Google Scholar] [CrossRef] [PubMed]
  10. Wang, Y.; Sheng, D.; Hu, H.; Han, K.; Zhou, J.; Hou, L. A Novel Series Arc Fault Detection Method Based on Mel-Frequency Cepstral Coefficients and Fully Connected Neural Network. IEEE Access 2022, 10, 97983–97994. [Google Scholar] [CrossRef]
  11. Zhou, G.; Fu, G.; Han, B.; Wang, W.; Liu, C. Series Arc Fault Detection Based on Dual Filtering Feature Selection and Improved Hierarchical Clustering Sensitive Component Selection. IEEE Sens. J. 2023, 23, 6050–6060. [Google Scholar] [CrossRef]
  12. Wang, Y.; Hou, L.; Paul, K.C.; Ban, Y.; Chen, C.; Zhao, T. ArcNet: Series AC Arc Fault Detection Based on Raw Current and Convolutional Neural Network. IEEE Trans. Ind. Inform. 2022, 18, 77–86. [Google Scholar] [CrossRef]
  13. Yu, Q.; Zhao, L.; Yang, Y. Three-Phase Fault Arc Phase Selection Based on Global Attention Temporal Convolutional Neural Network. Appl. Sci. 2022, 12, 11280. [Google Scholar] [CrossRef]
  14. Prasad, C.D.; Biswal, M.; Mishra, M.; Guerrero, J.M.; Malik, O.P. Optimal Threshold-Based High Impedance Arc Fault Detection Approach for Renewable Penetrated Distribution System. IEEE Syst. J. 2022, 17, 2971–2981. [Google Scholar] [CrossRef]
  15. Wang, Y.; Zhang, F.; Zhang, S. A New Methodology for Identifying Arc Fault by Sparse Representation and Neural Network. IEEE Trans. Instrum. Meas. 2018, 67, 2526–2537. [Google Scholar] [CrossRef]
  16. Cai, X.; Wai, R. Intelligent DC Arc-fault Detection of Solar PV Power Generation System Via Optimized VMD-based Signal Processing and PSO-SVM Classifier. IEEE J. Photovolt. 2022, 12, 1058–1077. [Google Scholar] [CrossRef]
  17. Zhang, Q.; Wu, Y.; Zhu, S. Interpretable Convolutional Neural Networks. In Proceedings of the 2018 IEEE/CVF Conference on Computer Vision and Pattern Recognition, Salt Lake City, UT, USA, 18–23 June 2018; IEEE: Piscataway, NJ, USA, 2018; pp. 8827–8836. [Google Scholar]
  18. IEC 62606; General Requirements for Arc Fault Detection Devices. IEC: Geneva, Switzerland, 2017.
  19. Xu, N.; Yang, Y.; Jin, Y.; He, J. Identification of Series Fault Arc of Low-voltage Power Cables in Substation Based on Wavelet Transform. In Proceedings of the 2020 IEEE 5th International Conference on Integrated Circuits and Microsystems (ICICM), Nanjing, China, 23–25 October 2020; pp. 188–192. [Google Scholar]
  20. Galassi, A.; Lippi, M.; Torroni, P. Attention in Natural Language Processing. IEEE Trans. Neural Netw. Learn. Syst. 2021, 32, 4291–4308. [Google Scholar] [CrossRef] [PubMed]
  21. Lian, D.; Yu, Z.; Sun, X.; Gao, S. As-mlp: An Axial Shifted Mlp Architecture for Vision. arXiv 2021, arXiv:2107.08391. [Google Scholar]
  22. Zhu, C.; Peng, H.; Liu, X. Fine-grained Image Classification Based on Bi-attention Kernelized Bilinear Network. Comput. Eng. Des. 2022, 43, 2007–2014. [Google Scholar]
  23. Chu, R.; Zhang, J.; Yang, K.; Xiao, J. A Series Arc Fault Detection Method Based on Multi-layer Convolutional Neural Network. Grid Technol. 2020, 44, 4792–4798. [Google Scholar]
  24. Gong, Q.; Peng, K.; Chen, Y. AC Series Arc Fault Identification Method Based on Arc Randomness and Convolutional Network. Power Syst. Autom. 2022, 46, 162–169. [Google Scholar]
  25. Hu, C.; Qu, N.; Zhang, S. Application of Continuous Wavelet Transform and Deep Residual Shrinkage Network with Attention Mechanism in Low Voltage Series Arc Fault Detection. Grid Technol. 2023, 47, 1897–1905. [Google Scholar]
  26. Zhang, P.; Qin, Y.; Song, R. Time-frequency Analysis and Identification of Series Fault Arc under Generalized S Transform. Grid Technol. 2024, 1–11. [Google Scholar] [CrossRef]
Figure 1. The flow chart of the method proposed in this paper.
Electronics 13 02662 g001
Figure 2. The flow chart of the algorithm proposed in this paper.
Electronics 13 02662 g002
Figure 3. Arc-fault test platform.
Electronics 13 02662 g003
Figure 4. Spectrum diagram of normal and arc fault conditions under different loads.
Electronics 13 02662 g004aElectronics 13 02662 g004b
Figure 5. Short-time Fourier transform analysis results of different load data.
Electronics 13 02662 g005aElectronics 13 02662 g005b
Figure 6. Schematic diagram of the calculation process of the scaled dot-product attention.
Electronics 13 02662 g006
Figure 7. The network structure of the proposed model.
Electronics 13 02662 g007
Figure 8. Confusion matrix distribution diagram.
Electronics 13 02662 g008
Figure 9. Attention weight spectrum.
Electronics 13 02662 g009
Figure 10. Hardware connection diagram.
Electronics 13 02662 g010
Figure 11. Waveform diagrams of intelligent circuit breaker before and after tripping.
Electronics 13 02662 g011aElectronics 13 02662 g011b
Table 1. Experimental load type.
BrandLoad TypeRated Power/W
RenjuyiResistors-
MeilingVacuum cleaners1400
OTUSAir compressors2200
DongchengHandheld drills500
PhilipsFluorescent lamps600
OppelDimming lamps800
MingweiSwitching power supplies500
PhilipsHalogen lamps700
Table 2. Comparison of the advantages and disadvantages of the three methods.
AdvantagesDisadvantages
MLPStrong expressiveness; can process multi-dimensional dataThe training time is long and requires a lot of resources
BilinearGeneralizes multiple order-independent featuresFocuses on global features; subtle features cannot be captured
Dot ProductHigh computational efficiency; can process one-dimensional time-series signalsLong sequences may have gradient explosion problems
Table 3. Summary of experimental data set feature distributions.
Data setLabelSample NumberTotal NumberTest Conditions
Training setArc23,00045,000The proposed model is verified on the specified load according to the IEC62606 standard
No arc22,000
Validation setArc31006000
No arc2900
Test setArc46009000
No arc4400
Table 4. The network structure parameters proposed in this paper.
TypeResultTypeResult
Number of attention modules1Number of convolution layers3
Number of maximum pooling layers3Number of fully connected layers3
Number of convolution layers filters288Number of fully connected layers neurons122
Strides of convolution layers1Strides of polling layers1
22
Initial learning rate0.01Minimum learning rate0.00001
Table 5. Distribution table of precision, recall, and accuracy of the proposed model.
Prediction CategoryTotal
Actual Category ArcNo Arc
Arc28,85912428,983
No arc6230,95531,017
Total28,92131,07960,000
Precision99.78%
Recall99.57%
Accuracy99.69%
Table 6. Classification of the degree of attention influence of multiple frequency bands.
LevelFrequency Band/kHzAttention Weight Ratio
A5–10, 15–25High (weight distribution in the range of 0.1–0.35)
B10–15, 25–35Medium (weight distribution in the range of 0.05–0.1)
C35–50Low (weight distribution in the range of 0–0.05)
Table 7. Results of the classification test of different attention frequency bands.
Combination ModeAccuracy/%
AB99.76
AC83.58
BC76.74
Table 8. Smart circuit breaker tripping results.
Load TypeTest 1 Tripping Time/msTest 2 Tripping Time/msTest 3 Tripping Time/ms
Resistive load177.7180186
Switching power supply8890.594
Dimming lamp104.2108110.9
Handheld electric drill69.771.579
Air compressor63.56770
Halogen lamp657072
Vacuum cleaner86.591.896
Fluorescent lamp687072.6
Table 9. Comparison of the effects of different methods.
Recognition AlgorithmLoad TypeFeature Extraction MethodAccuracy
Proposed model8Single-head attention99.69%
Alexnet [24]5Time domain grayscale image97.7%
DRSN [25]9CWT98.5%
2D-CNN [26]4CWT98.5%
Disclaimer/Publisher’s Note: The statements, opinions and data contained in all publications are solely those of the individual author(s) and contributor(s) and not of MDPI and/or the editor(s). MDPI and/or the editor(s) disclaim responsibility for any injury to people or property resulting from any ideas, methods, instructions or products referred to in the content.

