1. Introduction
The advent of Industry 4.0 has brought about the intelligent integration of machines and processes through cutting-edge information and communication technologies (ICTs). However, small manufacturing enterprises still encounter numerous challenges such as variable production volumes, fluctuating priorities in customer orders, and diverse production capacities across different output levels. Additionally, frequent machine health issues, glitches, and major breakdowns further complicate the optimization of production scheduling, making it a critical yet complex task.
To enhance production in small-scale industries, manufacturing management must focus on two essential components: the distribution of manufacturing drawings and a machine monitoring subsystem. The distribution system ensures that production tasks are allocated efficiently to appropriate machines, while the monitoring subsystem continuously tracks machine health to maintain productivity and ensure smooth operations. Together, these components are vital for managing the dynamic and demanding environment of small-scale manufacturing effectively.
The term “distribution of manufacturing drawings” refers to the process by which detailed diagrams, blueprints, or technical drawings are shared and made accessible to the various teams, departments, or individuals involved in the manufacturing process. These drawings contain essential information about the product being manufactured, including dimensions, materials, assembly instructions, and tolerances, which are crucial for ensuring that each component is produced accurately and fits together correctly with other parts. This distribution can be achieved through several methods, including physical paper copies, digital files sent via email or shared over a network, or through a centralized digital management system that allows for real-time access and updates [
1,
2]. In traditional factory production modes, the distribution of manufacturing drawings is typically carried out by production planners based on fixed rules and experience, which presents numerous issues. Firstly, traditional allocation incurs high costs and is susceptible to subjective influences, making it difficult to adapt to rapid changes in the production environment [
3,
4,
5]. Secondly, due to the complexity and variability of the production process, traditional allocation often fails to optimally utilize equipment and human resources, resulting in a low production efficiency.
The goal of efficiently distributing manufacturing drawings is to ensure that everyone involved in the production process has the correct and most up-to-date information needed to carry out their tasks effectively, thereby minimizing errors, reducing waste, and optimizing production efficiency. In modern manufacturing environments, the use of digital technologies and systems for the distribution of manufacturing drawings is increasingly common. These systems offer advantages such as easier access to updated drawings, the ability to quickly share changes or corrections, and improved collaboration among different parts of the manufacturing team. Reasonable task allocation methods can optimize the allocation of production resources, thereby significantly improving the economic and social benefits of enterprises [
6,
7,
8,
9]. With the increasing level of informatization and automation, the intelligent distribution of manufacturing drawings has become an inevitable trend. Unlike large manufacturing enterprises with mature systems, small and micro enterprises (SMEs) face significant gaps in their manufacturing equipment, management systems, talent allocation, and capital [
10,
11,
12,
13]. For SMEs, in actual production processes, the production of a particular product typically involves multiple workpieces or multiple operations, and each operation may have multiple sets of parallel production equipment, requiring rational batch division of the product. Therefore, this type of distributing manufacturing drawings’ problem combines flow shop scheduling and parallel machine scheduling, known as the Hybrid Flow-shop Scheduling Problem (HFSP), with solutions falling into two categories: exact algorithms and approximate algorithms. Exact algorithms include branch and bound, integer programming, and Lagrangian relaxation [
14,
15,
16]. Gmys et al. [
17] proposed an improved branch and bound method, which effectively solves the permutation flow shop scheduling problem with completion time as the optimization objective. Meng et al. [
18] established eight mixed-integer linear programming models to handle mixed flow shop scheduling problems with unrelated parallel machines of various types. Cui et al. [
19] used Lagrangian relaxation to study the scheduling problem of continuous casting processes in steelmaking with completion time as the objective. Exact algorithms can provide exact solutions for the small-scale distribution of manufacturing drawings, but for more complex scenarios, they may require an exponential amount of time to find a solution and consume a large amount of memory space, making them unsuitable for large-scale production patterns. In contrast, genetic algorithms, as heuristic optimization algorithms, have lower computational requirements for large-scale problems, making them more suitable for handling large-scale problems [
20,
21,
22,
23]. By designing fitness functions and flexible chromosome encoding, genetic algorithms can adaptively conduct global searches in a wide solution space, making it easier to handle complex and variable constraints and helping to find global optimal solutions. Therefore, they have been widely used in engineering, economics, and other fields [
24,
25,
26]. With the development of deep learning, genetic algorithms are used to optimize hyperparameters, network structures, and enhance datasets to improve model performance and generalization ability [
27,
28,
29].
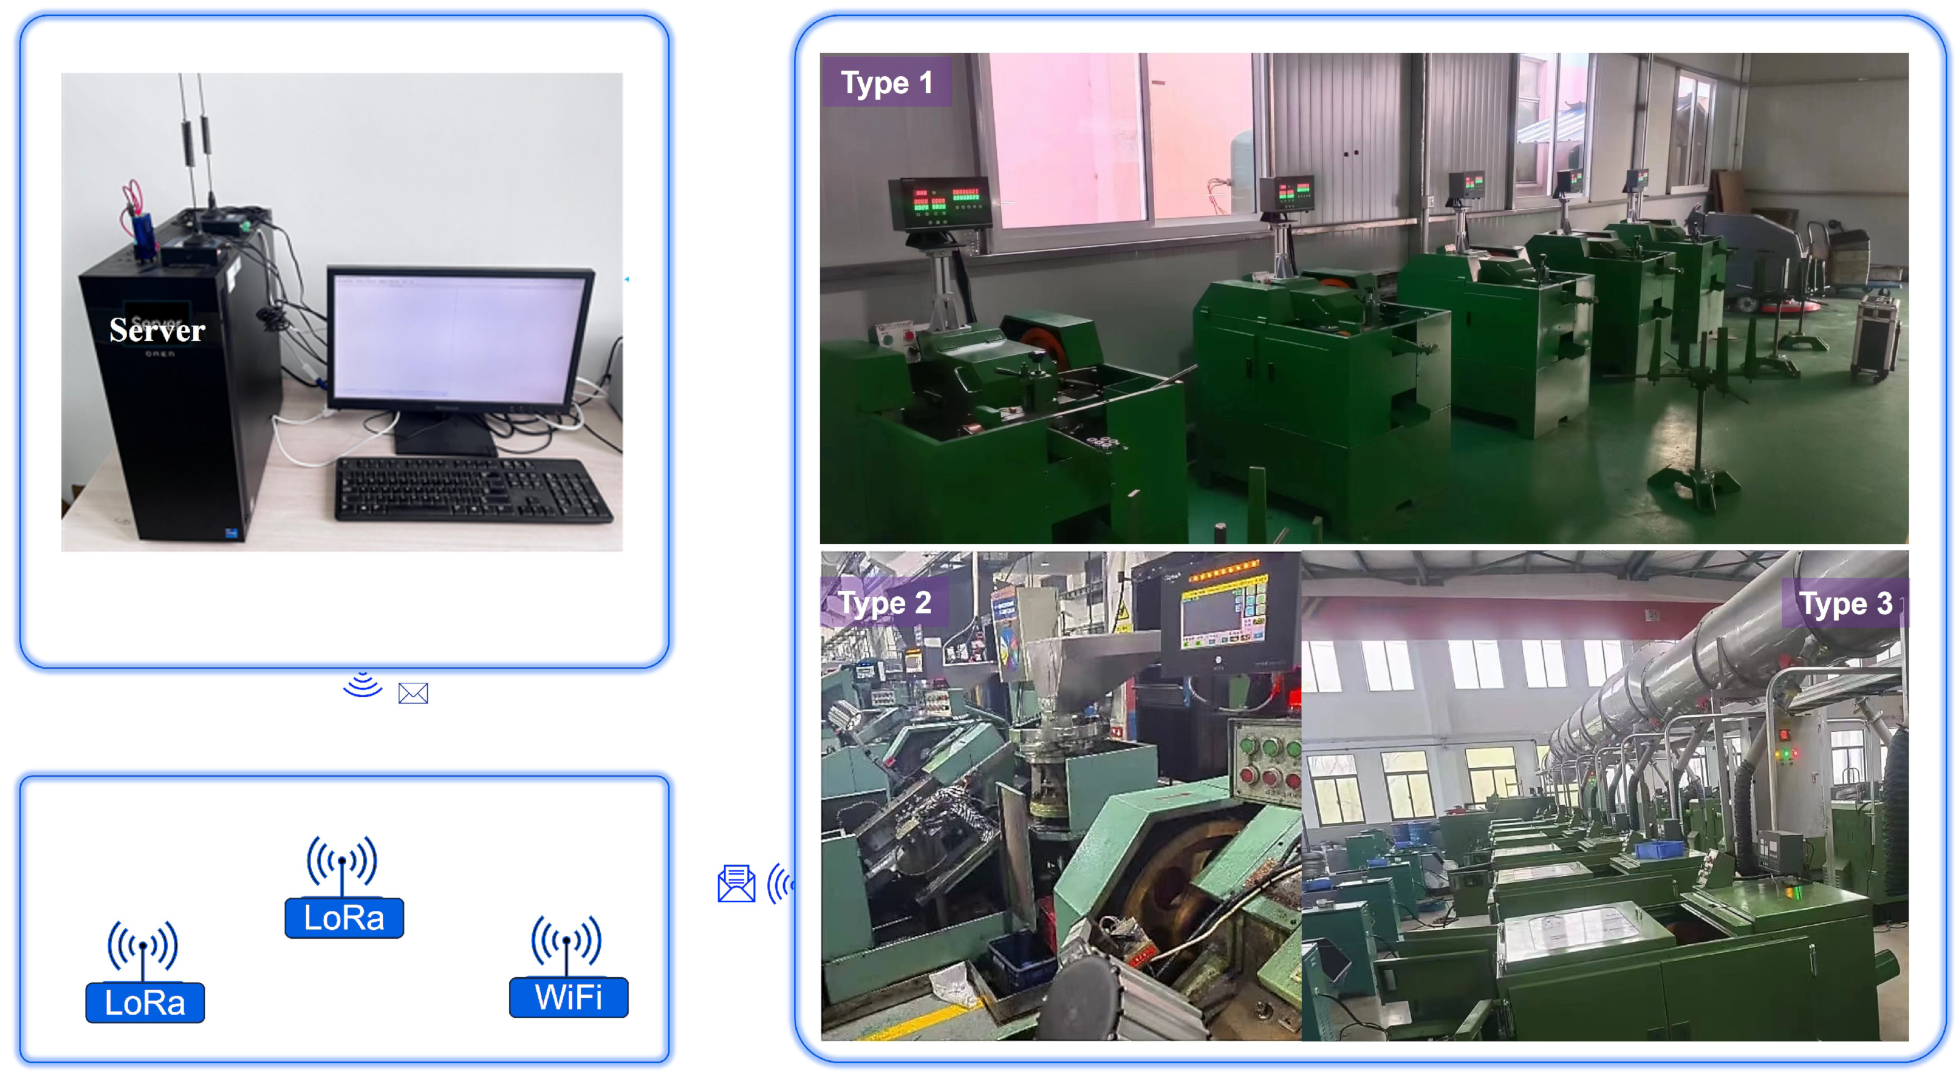
In summation, transitioning from conventional techniques to AI-enabled digital methodologies for the dissemination of factory manufacturing drawings signifies a seminal shift in manufacturing paradigms, ushering in an era of enhanced efficiency, superior data management capabilities, and the leveraging of predictive analytics. However, small mechanical manufacturing enterprises face significant challenges when transitioning to ICT-supported Industry 4.0 models. These challenges stem primarily from a lack of technical expertise, inadequate infrastructure, and the diversity of machinery types. Firstly, implementing advanced technologies such as real-time monitoring systems, IoT integration, and digital scheduling requires specialized knowledge and skills that are often lacking in smaller companies. The transition to digital systems necessitates understanding complex software and hardware interactions, which can be a steep learning curve for personnel who are accustomed to traditional manufacturing processes. Secondly, the infrastructure required to support such digital transformations can be prohibitively expensive. As illustrated in
Figure 1, the setup involves sophisticated servers, LoRa IoT technology, and various types of production machines that need to be integrated into a cohesive system. Small enterprises often lack the financial resources to invest in these technologies, which include not only the initial purchase of equipment but also ongoing maintenance and upgrades. Another significant challenge is the diversity of machinery types used in small manufacturing setups. These machines, often varying widely in age, make, and model, require different integration approaches, making the process complex and time consuming. As shown in the figure, different machine types (Type 1, Type 2, and Type 3) are present in the same facility, each with their own set of operational parameters and communication protocols. This heterogeneity complicates the implementation of a unified monitoring and control system.
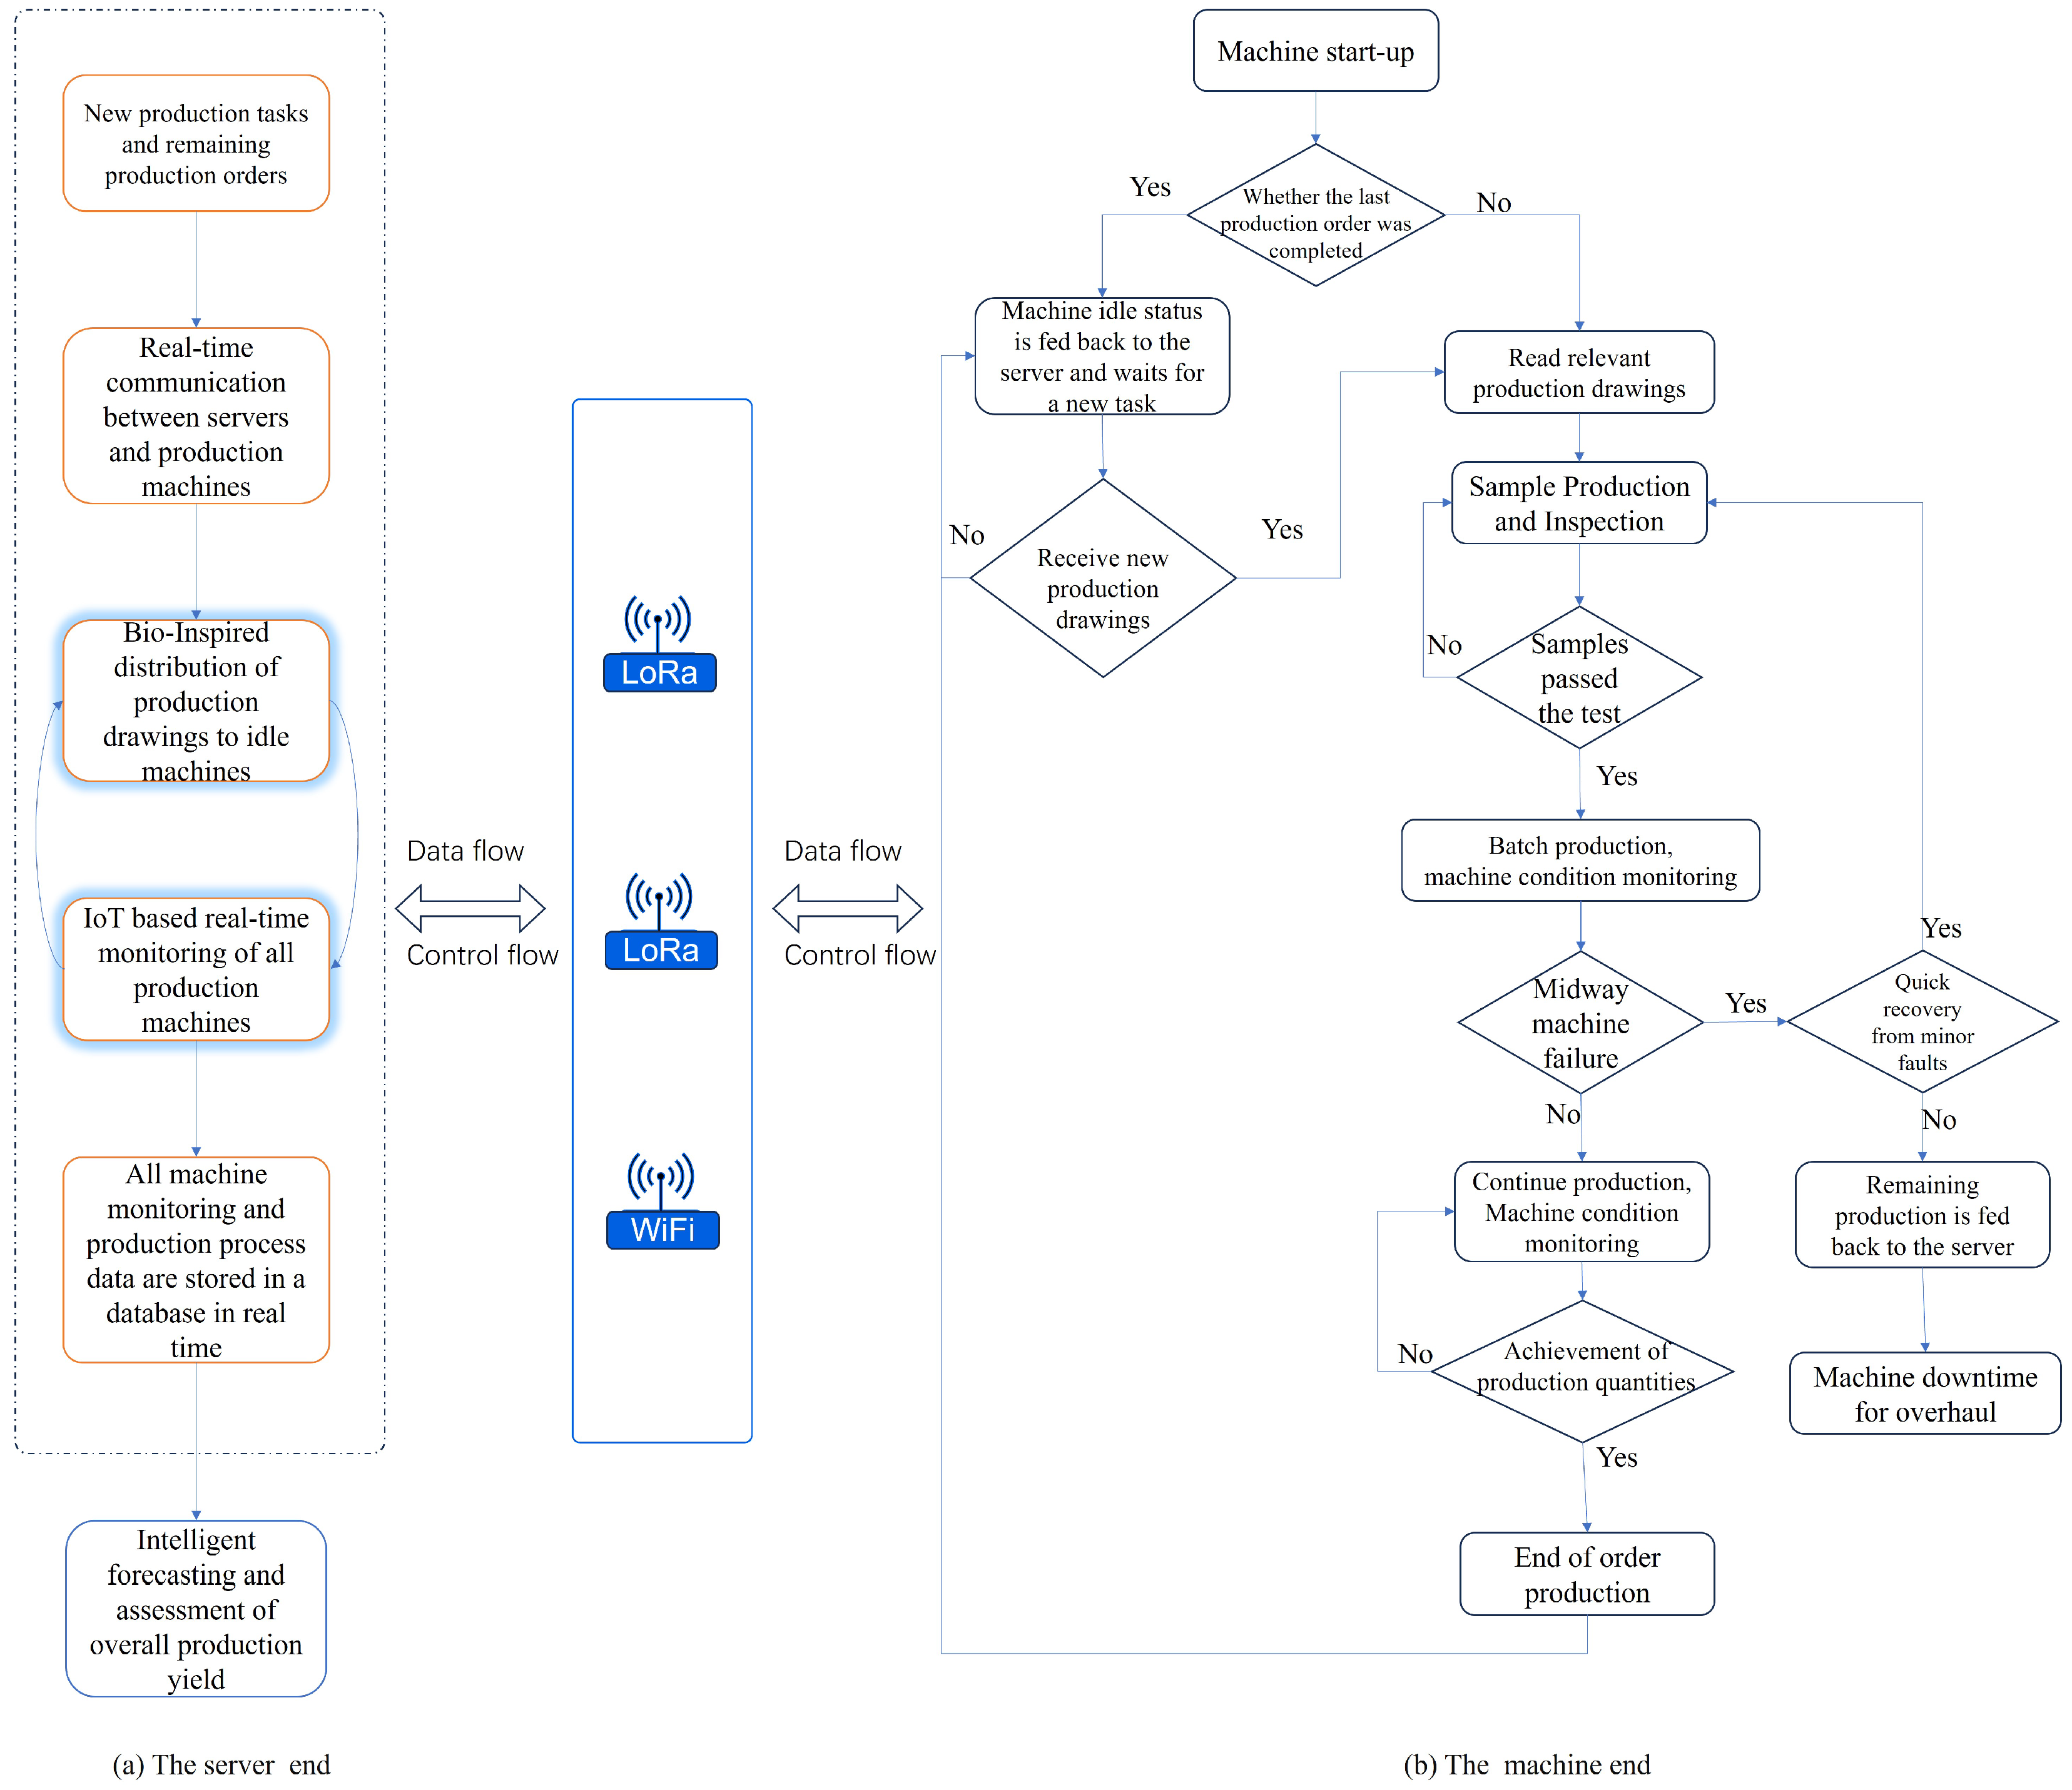
To address these challenges, this work presents a novel approach to production management that integrates bio-inspired methods and IoT technology for enhancing production in small-scale industries. The proposed framework includes a real-time monitoring subsystem for production machinery and an intelligent distribution of production orders subsystem, as outlined in
Section 2, and detailed in
Section 3 and
Section 4, respectively.
Section 5 will demonstrate the effectiveness of this integrated approach through case studies and experimental validations.
3. Real-Time Monitoring Subsystem for Production Machinery
The proposed methods consist of a LoRa wireless communication module, various sensors, a database, and host computer software. In the single-thread method, the host computer software sends status query commands to all sensors in a single-thread manner. In the single-channel, single-port method, the sending hardware layer uses only one central station to process commands sent by the host computer. In the multi-channel, multi-port, and multi-thread methods, the host computer creates multiple threads to send status query commands to all sensors. The sending end adopts a hardware parallel scheme, introducing
m central stations to process commands sent by the host computer, and sends the commands via LoRa wireless communication. At the receiving end,
n LoRa wireless communication modules receive the data. Each LoRa module communicates with the sensors via the Modbus RTU protocol, obtains the machine status data from the sensors, and feeds it back to the PC host computer, which eventually stores the data in a database for subsequent processing, as shown in
Figure 4.
3.1. LoRa Wireless Communication Module
The wireless communication module adopts the LoRa protocol. This module can achieve bidirectional transparent data transmission between the serial port and LoRa, operating in the 410–493 MHz frequency band. LoRa has strong anti-interference capabilities and long transmission distances, with the module’s transmit power reaching 30 dBm and a communication distance of up to 10 km.
LoRa communication operates in a master–slave mode. In this mode, the master must package the data according to the protocol format before sending it to the slave. When the slave sends data to the master, it can transmit the data directly without following the protocol packaging. To reduce the data packet loss rate from the master to the slave, the master end has a data retransmission mechanism, and the slave automatically responds upon receiving the data. To ensure data transmission security, an encryption key is set to keep the data transmitted between LoRa modules encrypted.
The communication between the wireless module and the sensors adopts the Modbus RTU protocol. Modbus is a standard serial communication protocol widely used in the industrial sector, supporting serial (mainly RS-485 bus) and Ethernet connections, with Modbus RTU, Modbus ASCII, and Modbus TCP being the most famous versions. Modbus RTU is widely used in data monitoring.
The Modbus RTU communication protocol uses a master–slave response method for data communication. Only the master (PC, HMI, etc.) can initiate requests using a unique slave address, and the slave (terminal device) responds based on the master’s request, which is a half-duplex communication. This protocol only allows the master to initiate requests, with the slave responding passively to prevent data collisions on the communication line. The structure of the data frame is shown in
Table 1. The slave address is the address of the wireless module, occupying 2 bytes; the detector address is the sensor address, occupying 1 byte; the data area frame is set according to the machine status to be queried; the check byte uses cyclic redundancy check (CRC-8) to ensure the correctness and integrity of data transmission.
3.2. Multithreading-Based Data Collection
Threads are the smallest unit of tasks executed in an operating system. Each thread has its own execution path, can execute code independently, and has its own registers and stack, but they share the same address space. Therefore, the thread switching overhead is small, and in modern multi-core processors, multithreading can better utilize this advantage by allocating different threads to different cores for execution, making full use of hardware resources. Multithreading can also prevent the main thread from blocking, and child threads do not affect GUI interface operations, avoiding program deadlock and lag, thus maintaining program smoothness.
Furthermore, tasks in different threads can be executed synchronously or asynchronously. In synchronous programming, tasks are executed one after another, with each task waiting for the previous one to complete before execution. In asynchronous programming, when one task is executed, it can switch to another task in a different thread without waiting for the previous task to be completed. To speed up data collection, threads execute tasks asynchronously.
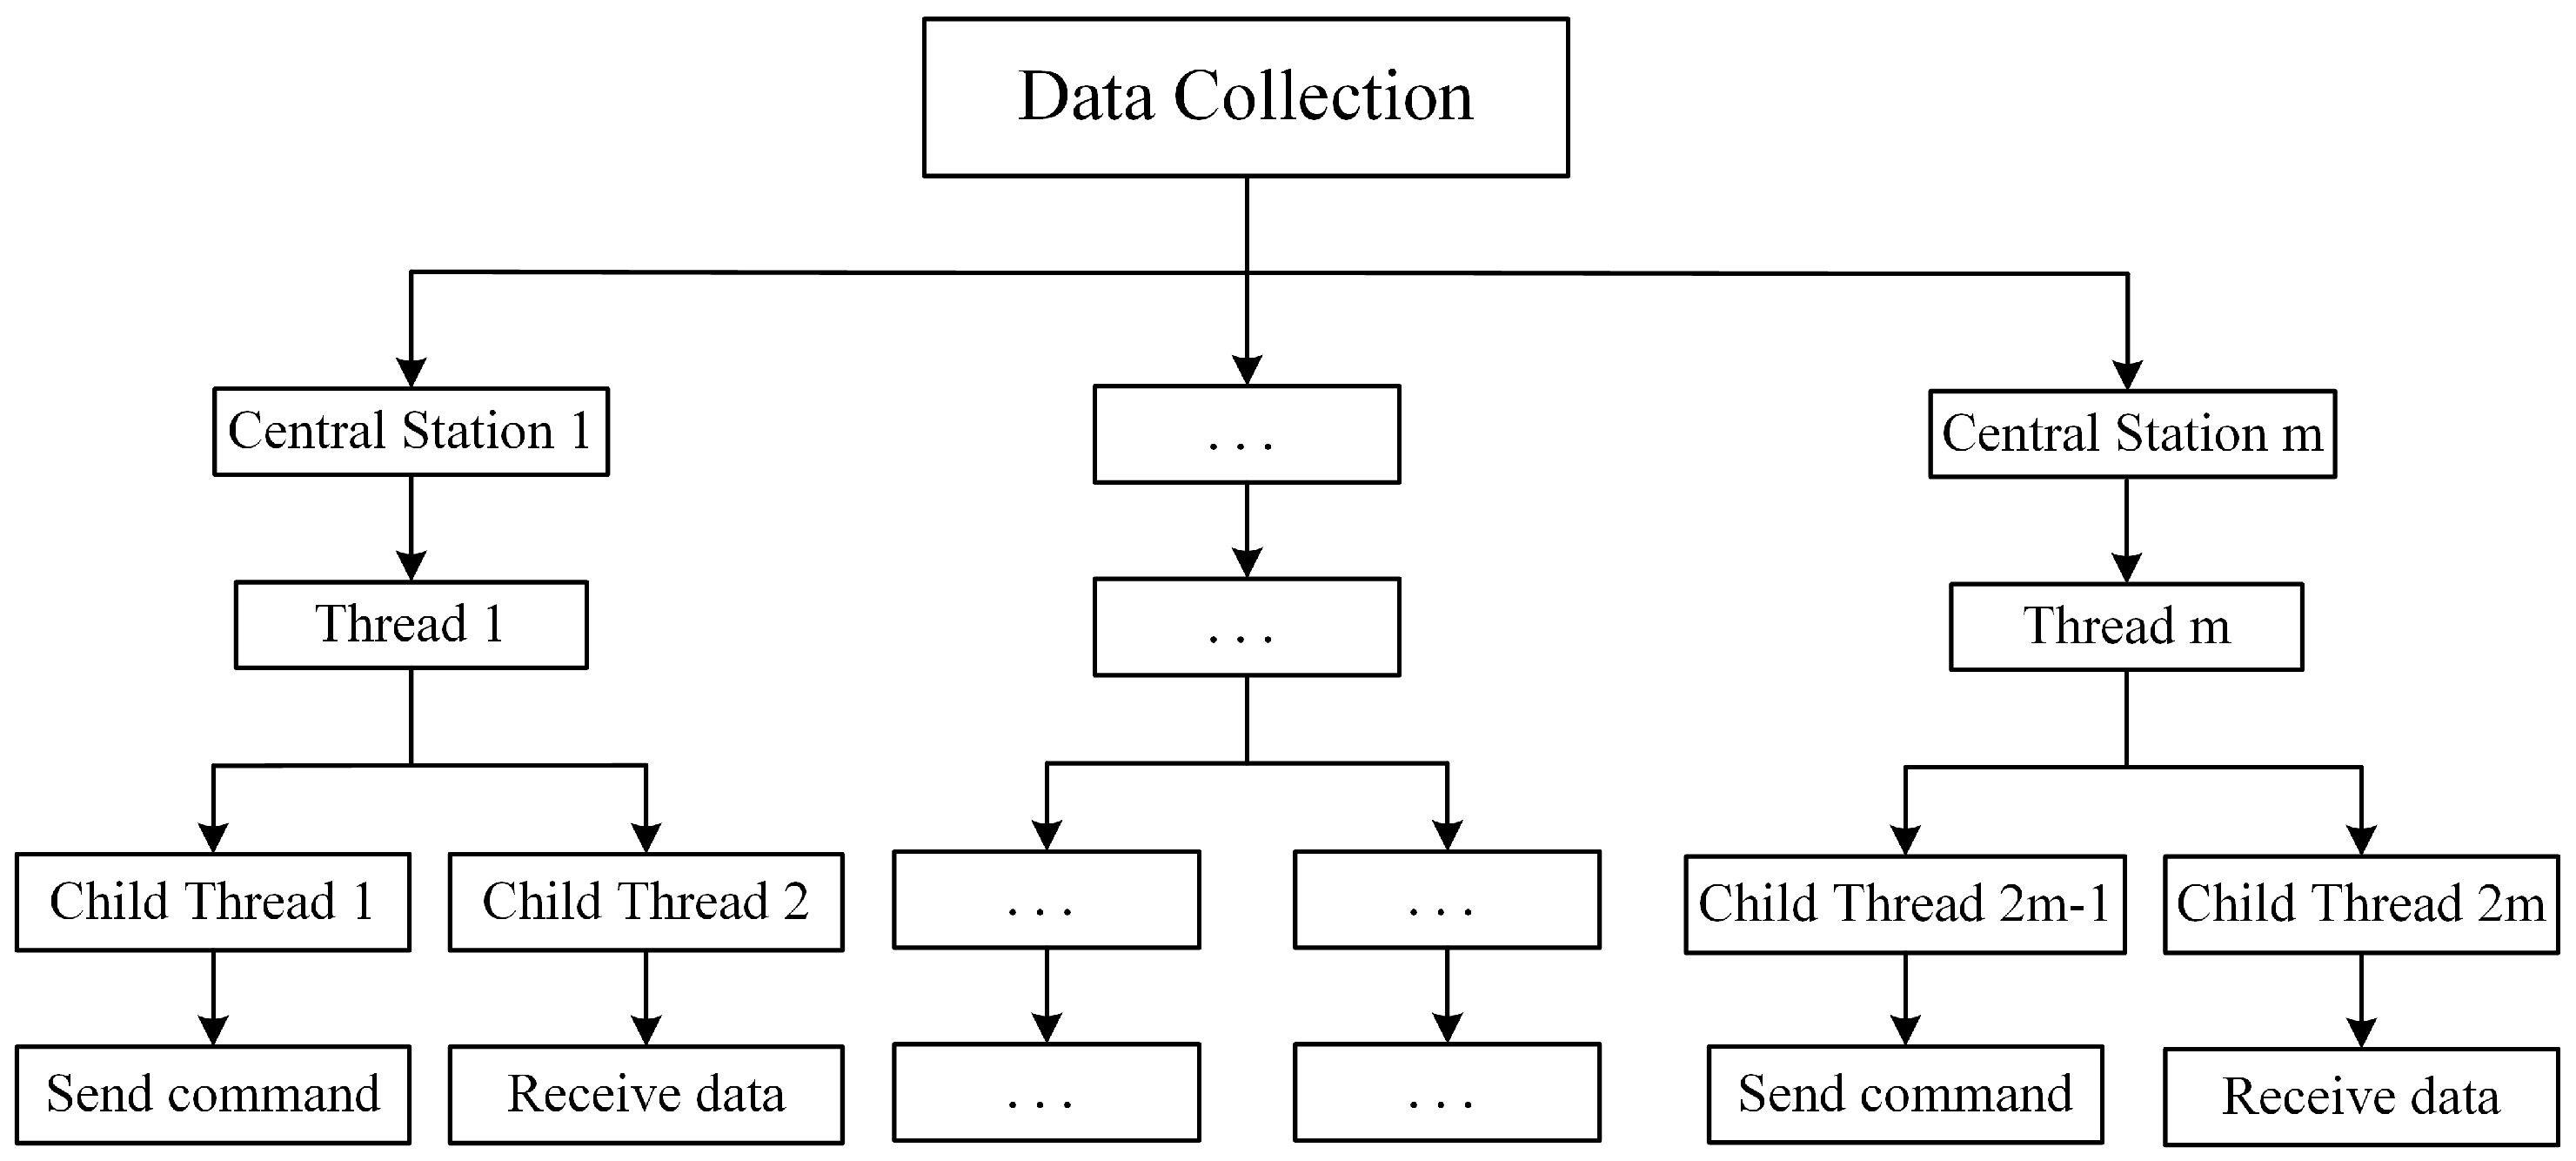
The multithreading scheme in the host computer software is shown in
Figure 5.
m threads, respectively, complete the communication between
m central stations and LoRa wireless modules. Considering the real-time nature of data collection, two sub-threads are created in each central station thread for sending query commands and receiving data.
The data collection process is shown in
Figure 6. In the multi-channel, multi-port, multi-methods, different serial ports are connected to different central stations. Each central station’s LoRa module is set with different parameters, including serial port baud rate, air rate, transmit power, and communication channel. After configuring the LoRa module, the PC host computer sends query commands to the LoRa module via the Serial module for serial communication. The write() function is called to poll different data query commands to the send buffer, and the slave reads the content of the serial port buffer through the read() function. If the serial port does not receive data within the specified time, the retransmission mechanism is enabled. After receiving the data, the data are parsed according to the frame structure. If the CRC check fails, the program returns and waits to receive again. Once successful, the data are stored in the database for the next poll.
3.3. Real-Time Production Machine Monitoring Experiments
To verify the performance of the four methods, experiments were conducted on heading machines and threading machines. For the sensors shown in
Figure 7, the heading machine detector used can detect abnormal conditions, including short material, broken needles, sticky material, no material, cracked angles, dropped material, short inch count, and abnormalities. It can also detect counter values and production speed. The threading machine counter used can not detect material anomalies and simultaneously perform counting and production speed detection.
Due to the different configurations of the four proposed methods at the hardware and software levels, the corresponding configurations of the four methods are as follows:
Single-channel, Single-port Method: The hardware layer’s sending end uses a single LoRa module as the central station to communicate with the heading machine and threading machine. Both ends use the same channel, set to 0. The PC communicates with the hardware layer through a single serial port using the Serial module.
Multi-channel, Multi-port Method: The sending end uses dual modules as two central stations for communication. The wireless communication module connected to the heading machine sets the channel to 0 (00000), while the module connected to the threading machine sets the channel to 31 (11111). The wireless modules at the sending and receiving ends communicate wirelessly via antennas.
Single-thread Method: This method sequentially executes collection tasks. After polling all the heading machine detector commands, it starts polling the threading machine counter commands.
Multi-thread Method: This method uses multithreading technology based on the QThread module of PyQt5, inheriting the thread class to create two QThread classes for collecting data from the heading machine and threading machine.
The results for the collection times of the four methods are shown in
Table 2. In the single-channel, single-port, single-thread method, the average time to collect 24 types of data is 6.2 s, with an average collection time of 0.258 s per type of data. If multi-channel and multi-port are used with single-thread, the collection time does not decrease. However, in the multi-channel, multi-port, multi-thread method, the average time is 3.4 s, with an average collection time of 0.141 s per type of data, reducing the collection time by about half compared to the single-channel, single-port, single-thread method.
4. Intelligent Distribution of Production Order Subsystem
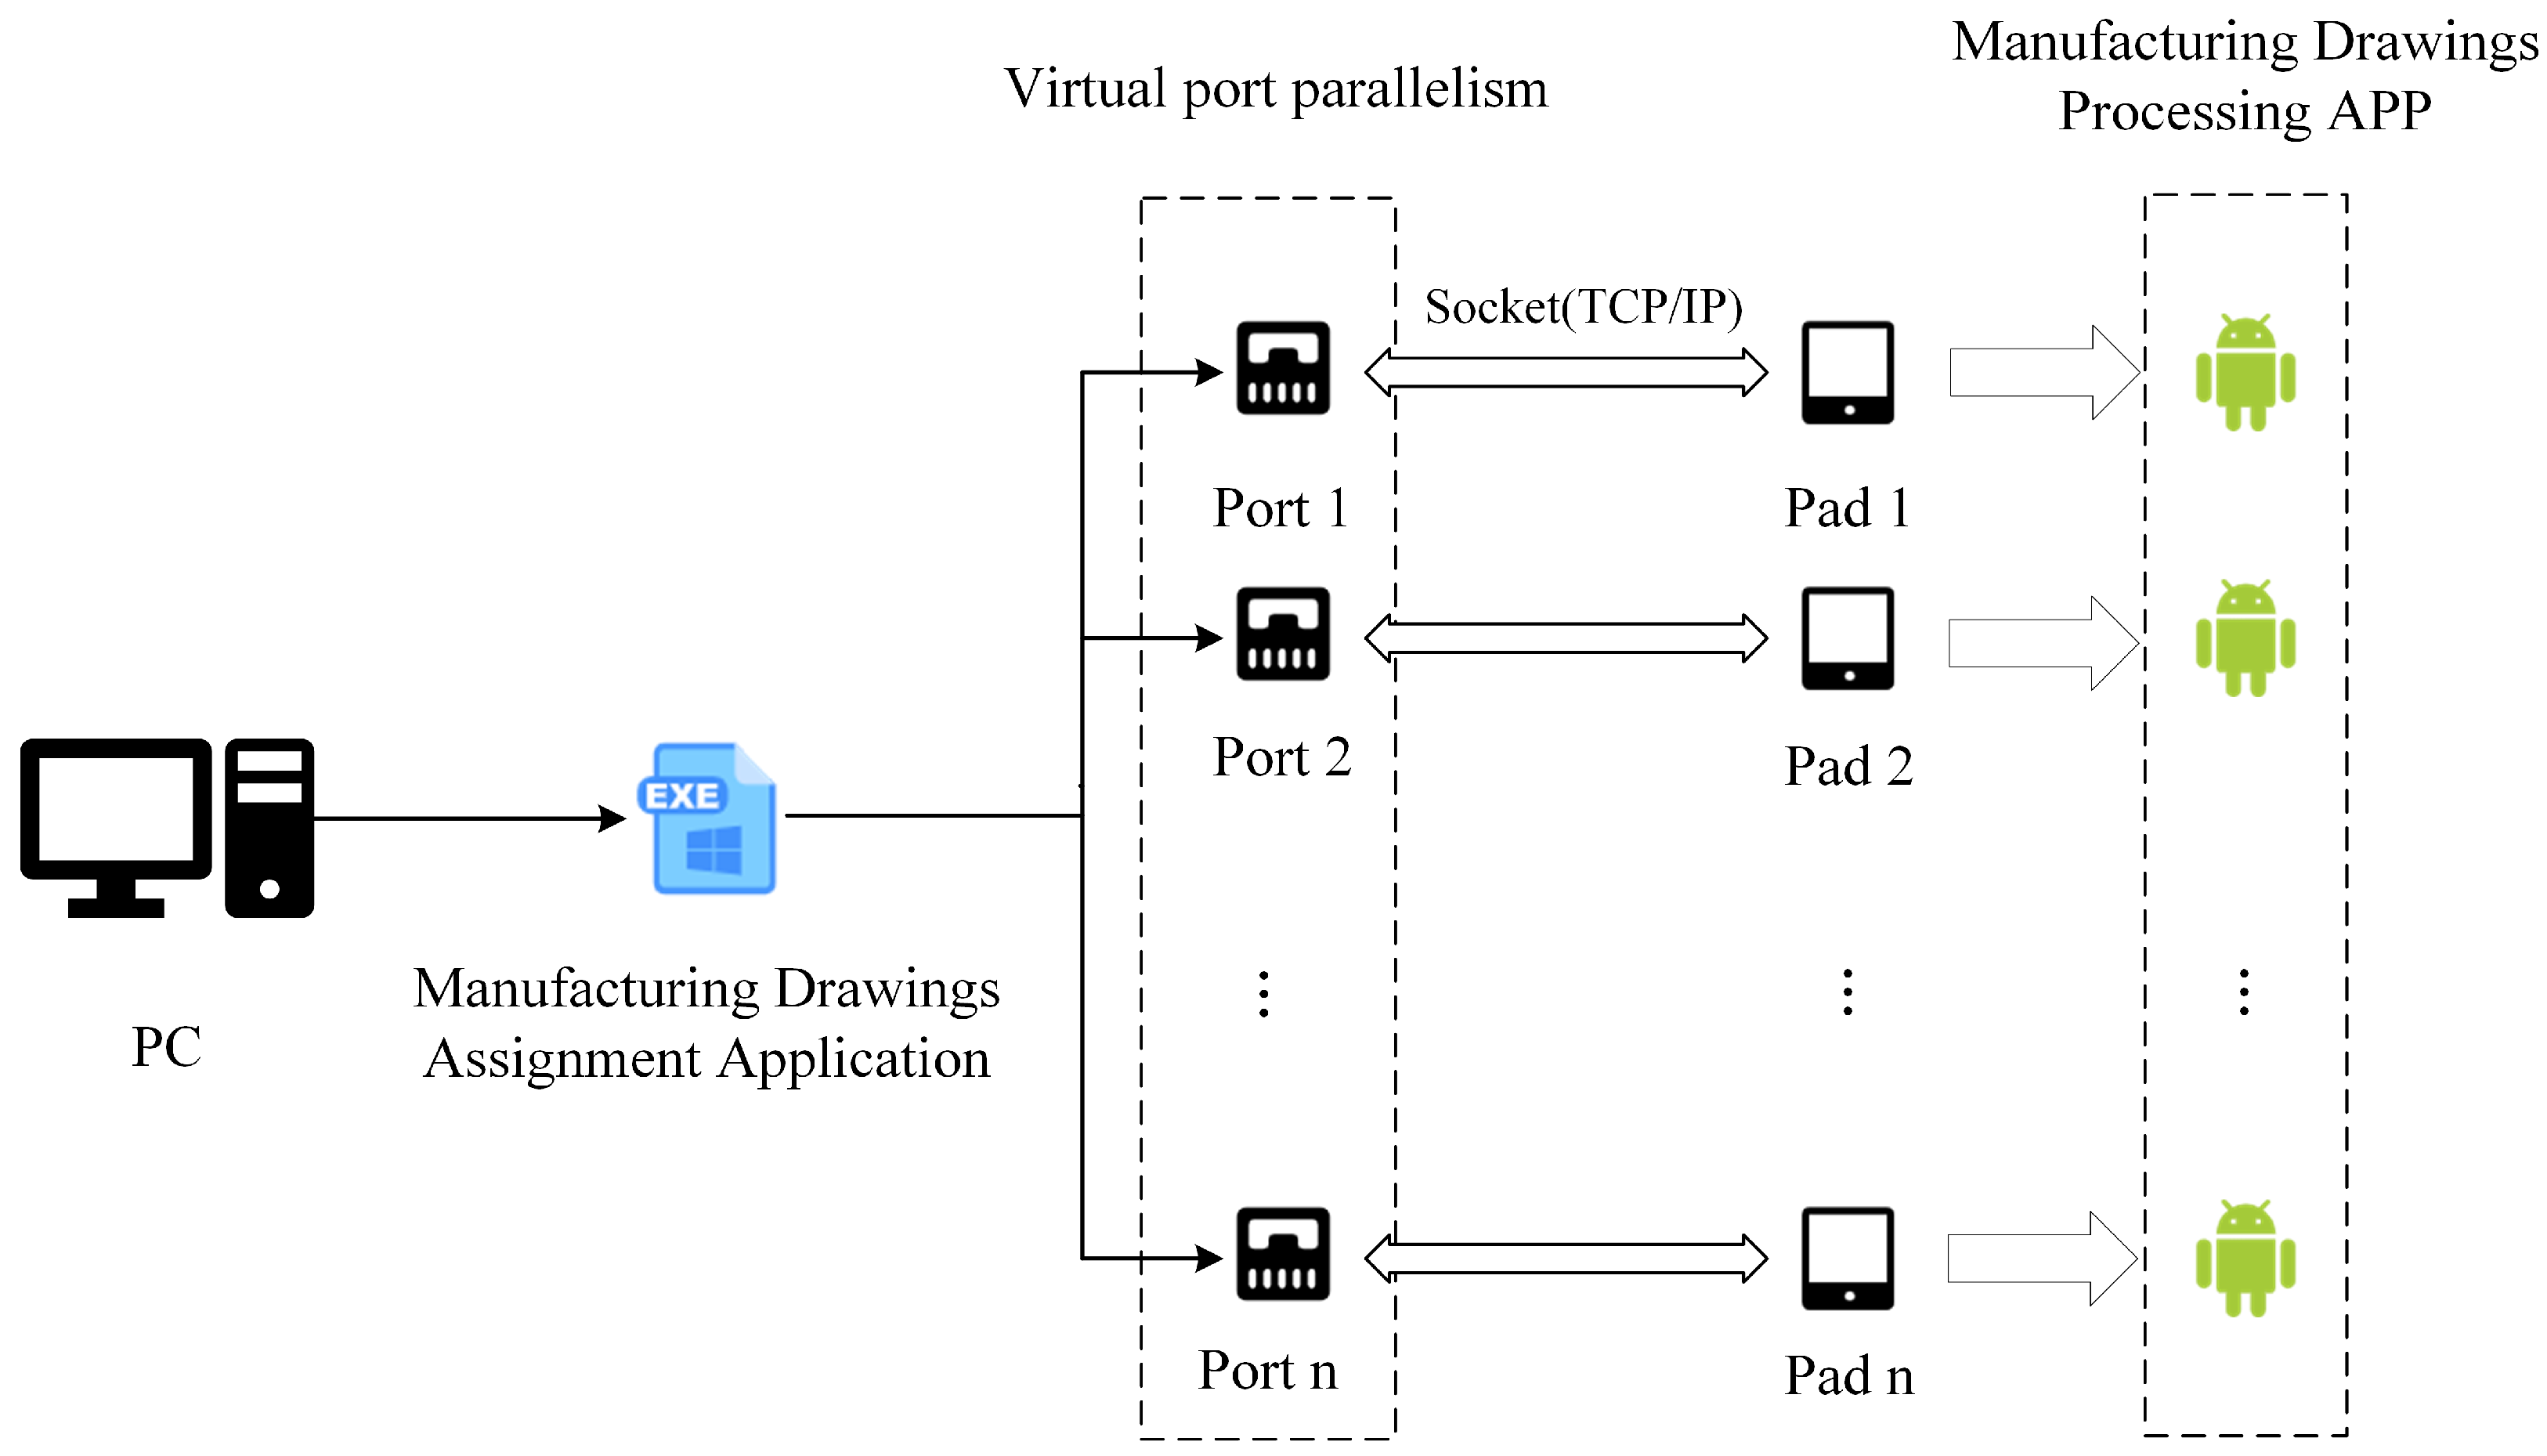
The scheme designed to address the distribution of production orders, including related manufacturing drawings, and apply it to real-world scenarios is illustrated in
Figure 8. The overall structural system can be divided into the production drawings sender and the production drawings receiver processors. The sender end utilizes a Windows application, which includes a solving module and a production task sending module. The solving module optimally solves the production tasks and determines allocation strategies, while the production task sending module assigns tasks to the corresponding machine receiver ends based on these strategies. The receiver processor receives production tasks via an app deployed on the PAD, and the corresponding machines process them based on the product-related parameters in the tasks. Before communication, the sender end creates multiple virtual ports using multithreading, with each port bound to a socket. These sockets listen for connections from the PAD end. Communication between ends occurs over the same Wi-Fi network using the TCP Socket protocol.
4.1. Problem Description
The production order scheduling problem, including related manufacturing drawings, considering machine failures, can be described as follows: At a given time, a factory has N different production orders, , that need to be completed. Each production order consists of the same P processes, and each process is handled by several machines, with varying processing times on each machine. During processing, machine failures may occur, and the repair time is predictable. The goal is to determine the processing sequence of the production orders and the allocation of different processes of each production order to machines, minimizing the total completion time of all production orders while considering the potential interference from machine failures.
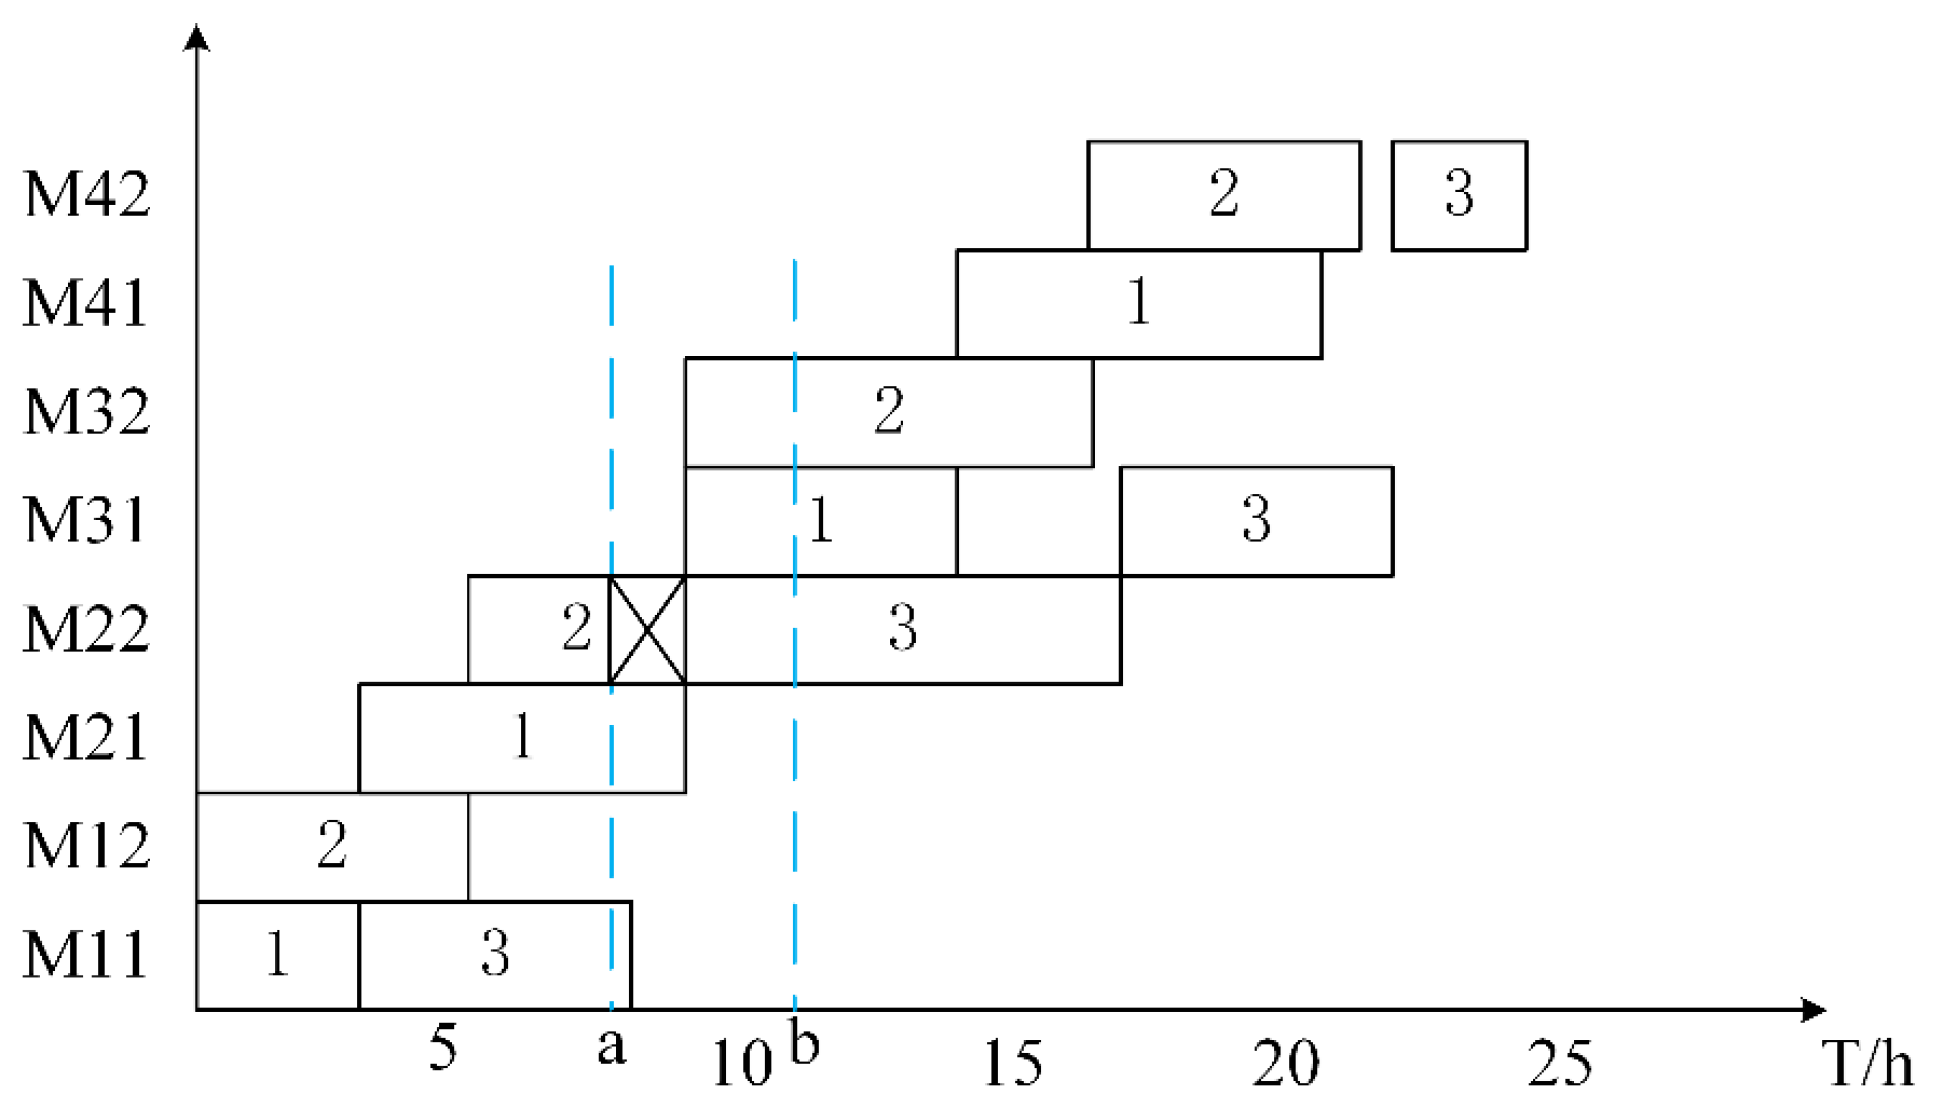
To illustrate the scheduling model under machine failure conditions,
Figure 9 shows the machine failure situation with three production orders (each production order contains four processes, with two machines for each process). The horizontal axis represents processing time, and the vertical axis represents machine numbers. At point
a, machine
(the second machine of the second process) fails, and at point
b, the repair is completed. The completed processes include the first process of production orders 1 and 2, and the ongoing processes include the first process of production order 3, the second process of production order 1, and the second process of production order 2. The remaining are unprocessed processes. The processes that were being processed on the faulty machine and the processes that started processing after point
a are constructed as the process set for the re-scheduling model.
The parameters defined in the scheduling model are defined in
Table 3.
The optimization goal for the distribution of production orders is to minimize the maximum production time. The objective function can be defined as
The main constraints in the above problem are as follows:
Equation (
2) indicates that any process within any production order must select and be processed by only one machine; equation (
3) shows that each production order is assigned sequentially. Equation (
4) states that on the same machine, the next production order can only start after the previous one finishes. Equation (
5) specifies that within the same production order, the next process can only start after the previous process completes. Equation (
6) ensures that at any given time, the number of production orders processed by the same process does not exceed the number of machines available for that process. Finally, equation (
7) establishes that the next production order can only be selected after the previous production order has selected its machine.
In addition to satisfying constraints (
2)–(
7), the model adds the following constraints:
Equation (
8) represents the proportion of the process completed before the machine failure; equation (
9) shows the remaining processing time of the production order on the faulty machine, depending on when the machine failure occurred; Equation (
9) indicates the remaining processing time of the production order on the faulty machine, depending on when the machine failure occurred; equation (
10) states that no processing occurs on the faulty machine during its failure period. Finally, equation (
11) indicates the completion time of the production order on the faulty machine.
4.2. Optimizing Production Order Scheduling Using a Genetic Algorithm
To address the production order scheduling problem under machine failures, we propose an enhanced genetic algorithm called the dynamic combination genetic algorithm (DC-GA). This algorithm dynamically allocates production orders based on the current status of machines. During the pre-scheduling phase, an improved elite selection strategy is employed, replacing the traditional roulette wheel selection method with a ranking-based selection. In the re-scheduling phase, the algorithm advances the traditional right-shift re-scheduling approach by incorporating a re-scheduling mechanism that accounts for the impact of each process.
To handle the re-allocation of production orders under machine failure, a single-layer encoding scheme is used. The machines and processes are encoded together to save computational memory. For an allocation problem with N production orders, each with M processes, the chromosome consists of genes, each representing the assigned machine number. For example, an encoding , with nine genes, represents three production orders, each with three processes, where the number with an underscore represents the second production order’s second process handled by machine 3.
Table 4 further explains the processing time of each production order’s process on different machines (unit time: hours).
represents the
j-th process of the
i-th production order, and
represents the
j-th machine for the
i-th process.
The traditional genetic algorithm uses a roulette wheel selection method during the selection operation. First, the population is randomly initialized. Based on the fitness function (1), the fitness
of each individual in the initial population is calculated (
, where
N is the number of individuals in the initial population). The probability function (8) is used to calculate the probability
that each individual is retained in the crossover stage. The lower the fitness (the shorter the completion time), the greater the probability.
The elite selection strategy sorts the fitness of individuals in the initial population in ascending order, retaining the individuals with the best fitness as parent chromosomes. However, simply selecting individuals with the best fitness may cause the algorithm to quickly converge to a suboptimal solution rather than a global optimal solution, known as premature convergence. To overcome this, the improved elite selection strategy not only retains individuals with the best fitness but also considers individuals with suboptimal fitness.
First, the fitness of the parent chromosomes is calculated and sorted in ascending order by fitness. The total number of elite individuals to be selected from the parent population is calculated using Equation (
9), where
is a random number between 0.7 and 1.
represents the total number of individuals in the parent population.
Next, the top
s individuals with the best fitness
are selected, and individuals ranked
to
are retained as the remaining population
. The selected populations are merged to form the offspring population
. After crossover and mutation operations, the new offspring population
is obtained. Finally,
and
are merged to form the new parent population for the next iteration. The specific steps are summarized in
Figure 10.
The crossover stage exchanges genes between two parent chromosomes to produce better fitness. Multi-point crossover is used, randomly selecting r crossover points. The regions between crossover points are reversed between the two chromosomes to form two new offspring. A crossover probability value is pre-set to decide whether to perform crossover.
The mutation stage increases chromosome diversity and randomness, expanding the search space. Mutation involves randomly changing some genes or gene combinations in the chromosomes. A mutation probability value is pre-set to decide whether to perform a mutation.
The DC-GA process is illustrated in
Figure 11. The key steps are:
Initializing parameters such as the number of productions, number of processes, processing times, and number of machines.
Initializing the population using encoding rules.
Calculating the fitness for the initial population.
Using the improved elite selection strategy to determine the parent population.
Generating offspring through multi-point crossover and mutation.
Merging the parent and offspring populations for the next iteration.
If the maximum number of iterations is reached, the optimal solution is output; otherwise, the process continues iteratively.
5. Case Studies and Experimental Validations
Simulation experiments were carried out to assess the distribution efficiency of manufacturing drawings, using ten outstanding production tasks from a screw manufacturing facility as a case study. Each of these production tasks encompasses four distinct stages: heading, threading, heat treatment, and electroplating. Correspondingly, these stages are facilitated by a specific number of machines, with three machines allocated for both heading and threading stages, two for heat treatment, and three for electroplating.
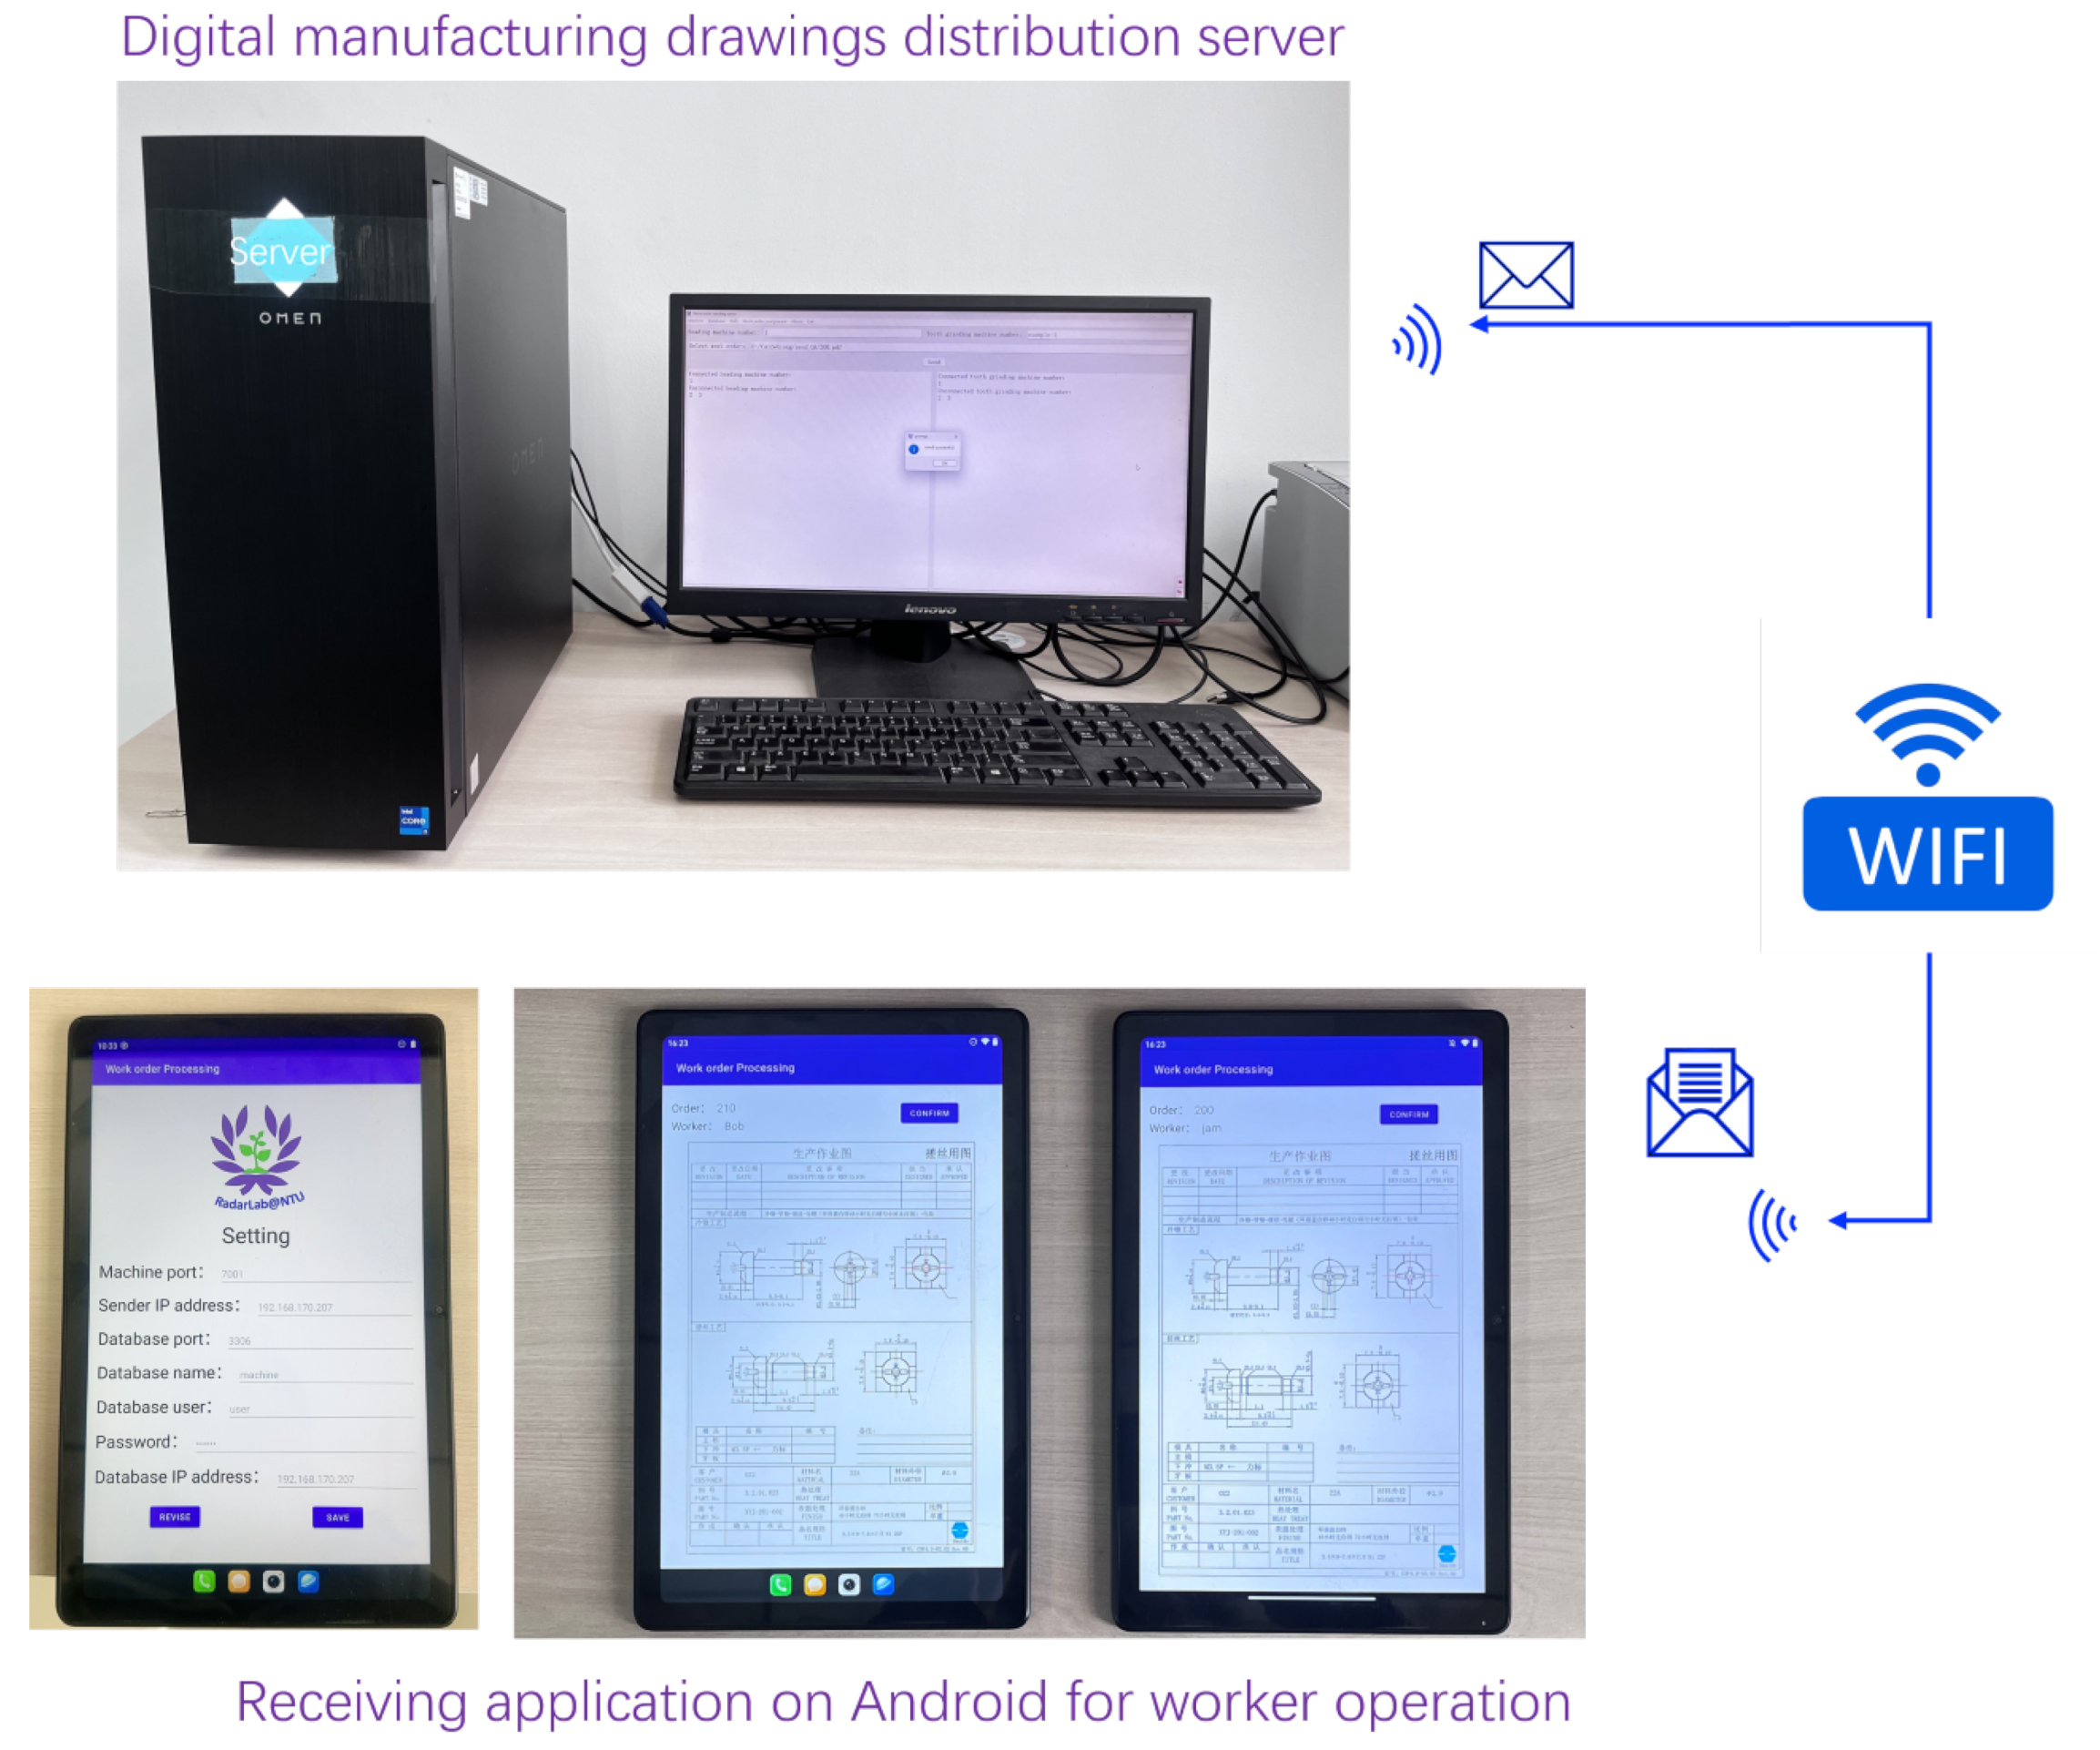
Figure 12 illustrates an experimental workflow for distributing digital manufacturing drawings using a server and Android devices. The process begins with a dedicated distribution server, depicted as a high-performance workstation. This server manages and sends the manufacturing drawings. Connected to a monitor, keyboard, and mouse, the server’s interface is designed to control the distribution process. The server transmits the drawings via a Wi-Fi network, visually represented by arrows and a Wi-Fi icon, indicating that it can send drawings directly to the workers’ devices.
The server employs a wireless data transfer to ensure that workers receive the necessary information flexibly and efficiently. On the receiving end, Android devices equipped with a specialized application for worker operations are used. Three Android devices are shown, each illustrating different stages of the application. The first device displays a settings interface where users can configure parameters such as the machine port, sender IP address, database name, user credentials, and database IP address. The second and third devices showcase the “Work order Processing” interface, which presents the detailed manufacturing drawings that workers need to follow. This experimental setup highlights a modern, efficient, and paperless method for distributing and utilizing manufacturing drawings in a work environment, enhancing productivity and reducing reliance on physical documents.
Each simulation case has a scale of
, where
n is the number of orders,
m is the number of machines, and
o is the maximum number of operations per order. The algorithm parameter settings are population size of 200, selection rate of 100, crossover rate of 0.8, and mutation rate of 0.2.
Figure 13 presents a comparison of the convergence between the proposed method and the traditional GA across four cases. The horizontal axis represents the number of generations, while the vertical axis indicates the fitness (completion time). From the figure, it can be seen that the traditional GA falls into local optima, while the proposed algorithm avoids premature convergence. In cases (a), (b), and (c), the convergence speed of the proposed algorithm is faster than the traditional GA, solving the issue of slow convergence.
Table 5 compares the results of the proposed method with the traditional GA, where the results are the best solutions found in 10 repeated runs for each case. From the table, it can be seen that the results obtained by the proposed method are better than those of the standard GA for different problem scales, especially for large-scale problems, showing significant improvement.
This work not only theoretically optimizes the management of the product generation process but also implements the proposed algorithms by integrating hardware and software, resulting in a solution suitable for small and medium-sized enterprises. Details of the implementation for the proposed intelligent manufacturing management system, including the real-time monitoring subsystem and the intelligent distribution of production orders subsystem, are available in the
Supplementary Materials.
6. Conclusions
This study outlines a comprehensive approach to boosting production efficiency in small-scale industries through the integration of real-time monitoring and intelligent production order distribution. Utilizing advanced LoRa wireless communication technology, multi-threaded data collection methods, and a dynamic genetic algorithm, our framework adeptly addresses the dual challenges of machine status monitoring and production scheduling.
Our proposed real-time monitoring subsystem leverages cutting-edge LoRa wireless communication technology, incorporating multiple sensors, a database, and host computer software. By employing a multi-channel, multi-port, and multi-thread strategy, the system efficiently collects data concurrently from various sensors, ensuring prompt and accurate machine status updates. The use of the Modbus RTU protocol for sensor communication via LoRa modules ensures reliable and standardized data transfer, thereby enhancing system robustness. Experimental results confirm the effectiveness of our method, demonstrating notable improvements in data collection speed and system responsiveness, which are crucial for maintaining optimal production conditions and promptly addressing machine failures.
Furthermore, our study advances the intelligent distribution of production orders using a novel algorithm—the dynamic combination genetic algorithm. This algorithm optimizes production scheduling by dynamically allocating tasks based on current machine statuses, incorporating sophisticated techniques such as improved elite selection and multi-point crossover and mutation. The experimental results showcase this algorithm’s ability to significantly decrease production completion times and reduce machine idle periods, as evidenced by its successful application in a screw manufacturing facility. The seamless integration of this scheduling algorithm with the real-time monitoring subsystem facilitates a coordinated and efficient production process, markedly enhancing productivity and resource utilization in small-scale manufacturing settings.
Overall, the robustness and efficiency of the proposed system highlight its potential to transform production management across similar industrial environments, promising significant advancements in operational efficiency and economic performance.


