Article

A Portable Agriculture Environmental Sensor with a Photovoltaic Power Supply and Dynamic Active Sleep Scheme

1
School of Electronic, Electrical Engineering and Physics, Fujian University of Technology, Fuzhou 350118, China
2
Fuzhou Industrial Integration Automation Technology Innovation Center, Fuzhou 350118, China
3
School of Mechanical and Automotive Engineering, Fujian University of Technology, Fuzhou 350118, China
*
Author to whom correspondence should be addressed.
Electronics 2024, 13(13), 2606; https://doi.org/10.3390/electronics13132606
Submission received: 3 June 2024 / Revised: 29 June 2024 / Accepted: 2 July 2024 / Published: 3 July 2024

Abstract

:
A portable environmental sensor for agricultural applications is proposed that addresses key challenges in power supply, data transmission, and monitoring efficiency. The sensor features a photovoltaic power supply and a PID-based dynamic active–sleep scheme for sustainable energy management, maintaining optimal battery levels under varying solar conditions. Its compact, waterproof, and dustproof design (90 mm × 90 mm × 150 mm, 844 g) ensures robust and reliable operation in diverse agricultural environments. High-precision digital sensors monitor temperature, humidity, light intensity, and CO2 concentration. Equipped with low-power NB-IoT technology, the sensor supports real-time remote environmental monitoring. Our experimental results show effective continuous operation, accurate environmental measurements, and performance comparable to established data loggers. The advanced power management and precise sensing capabilities make this sensor a competitive solution for improving smart agriculture practices, particularly in resource-limited or off-grid settings.

1. Introduction

Smart agriculture uses advanced information and communication technologies, artificial intelligence, automation, and the Internet of Things to increase agricultural productivity and sustainability [1,2]. This approach significantly improves the quality and quantity of agricultural products, promotes ecological and environmental improvements, and serves as a new key driver for economic growth in agriculture.
Agricultural environmental sensors are the core infrastructure of smart agriculture, acting as the “ears” and “eyes” of the system. These sensors are responsible for collecting various types of environmental data, such as temperature, humidity, soil moisture, and light intensity, from farms or agricultural production sites [3,4]. These data help the smart agriculture system make informed control and intervention decisions, including irrigation, fertilization, and pest control, to optimize crop health and yield [5,6].
Due to the critical and fundamental role of agricultural sensors, numerous studies have been conducted on various aspects, including communication protocols, system architecture design, and data processing. In communication protocols, Deng et al. [7] developed a sophisticated greenhouse environmental monitoring system using ZigBee technology, effectively regulating the internal temperature of greenhouses. Liu et al. [8] deployed a system that uses GPRS technology to enable communication between monitoring nodes and remote centers. Furthermore, Van Anh Vu et al. [9] created a data acquisition and automatic irrigation system for greenhouse crops using LoRa wireless communication technology, which improves communication stability. In self-sustaining energy solutions, the amount of energy remains low during the sleep state but increases significantly in the active state. Daning et al. [10] adopted solar photovoltaic (PV) self-powering technology as an effective solution to power supply challenges, reducing dependence on traditional power sources and minimizing environmental pollution. Similarly, Bouzguenda et al. [11] used solar photovoltaic technology to power nodes in smart irrigation systems, significantly boosting water efficiency in agriculture. For innovative applications, Zhu et al. [12] designed an unmanned temperature and humidity monitoring system, while Thompson et al. [13] using an ARDUINO-MC based system, collected critical data such as soil moisture, surface temperature, and environmental temperature and humidity. These systems provide essential data support for precision agriculture, enabling more targeted and efficient farming practices.
The integration of advanced technologies and innovative research in sensor development is transforming agricultural practices, promoting sustainability and productivity. However, challenges remain in areas such as efficient energy management, monitoring diversity, and miniaturization. Various studies have tackled these issues to improve sensor performance and usability. Wang et al. [14] combined solar energy harvesting with wireless battery charging in a hybrid wireless sensor network, achieving a 20% reduction in battery depletion and a 25% saving in deployment costs compared to previous models. Galmes et al. [15] developed an analytical model for duty cycle and initial energy storage in solar-based energy-harvesting wireless sensor networks, ensuring the self-sustained operation of TinyOS sensor nodes. Similarly, Fang et al. [16] introduced an energy-utilization-aware sleep scheduling algorithm for sustainable throughput in green wireless sensor networks, while Chien et al. [17] created a simple solar energy harvesting scheme that reliably powers a wireless sensor network. For multi-parameter monitoring in small, lightweight devices, Davcev et al. [18] developed an agricultural monitoring system based on the LoRa network, collecting key data such as air temperature, humidity, leaf moisture, and soil moisture. Gsangaya et al. [19] designed a portable, solar-powered wireless sensor network system for monitoring environmental parameters like temperature, humidity, light intensity, and soil moisture, easily deployable via a plug-and-play method. These studies emphasize the critical need for real-time, reliable wireless monitoring systems in agricultural environments, especially in areas without established power and communications infrastructure. Recently, several studies have highlighted the importance of CO2 in plant growth and disease prevention and control. For example, Quinn Bazinet et al. [20] examined the complex effects of elevated CO2 levels on plant–insect interactions and showed that elevated CO2 not only affects plant growth and the accumulation of defense metabolites, but also potentially increases pest populations and their efficiency in utilizing food resources. Robyn Anderson et al. [21] reviewed the impacts of climate change on agriculture, with a focus on CO2, and concluded that higher CO2 levels exacerbate plant diseases, alter plant–pathogen interactions, and pose significant challenges to agricultural sustainability in the face of a changing climate. Senthold Asseng et al. [22] conducted a comprehensive simulation study of global potato production under different climate change scenarios and showed that while elevated CO2 may enhance growth under certain conditions, high CO2 emissions could lead to a decline in crop yield by the end of the century. Yun-Ho Lee et al. [23] found that elevated CO2 levels generally improve potato crop growth, photosynthesis, and yield; however, the interaction with elevated temperature may alter these benefits, suggesting a nuanced balance of benefits and potential drawbacks that must be carefully considered in the context of the impacts of changing environmental parameters on potato agriculture. Despite the growing recognition of the role of CO2 in the prevention and control of plant diseases, few monitoring devices for multiple environmental parameters currently integrate CO2 detection. Therefore, the development of compact, reliable, self-powered devices, along with improvements in system portability, energy efficiency, and CO2 monitoring, is essential for the practical advancement of agriculture.
In this study, we propose a portable, energy-efficient sensor capable of monitoring four critical environmental factors. Equipped with a photovoltaic power supply and a dynamic active–sleep scheme, this sensor is designed to provide a self-sustaining energy supply, making it ideal for use in farming landscapes lacking pre-built power facilities. Using low-power-consumption NB-IoT technology, the sensor enables robust, real-time remote monitoring of key plant growth parameters, including temperature, humidity, light intensity, and carbon dioxide concentration. Additionally, the sensor is designed to be compact, waterproof, dustproof, and includes a scalable mounting rod for flexible deployment across various agricultural settings. This design ensures continued, reliable and appropriate monitoring in a variety of agricultural environments. We fabricated the prototype sensor uding circuit fabrication and 3D printing technology. To verify the performance and effectiveness of the proposed sensor, the prototype was tested in terms of it being waterproof and its self-powering capability, low-power operation, remote data transmission efficiency, and monitoring data accuracy.
The main contributions of our work include the following:
(1)
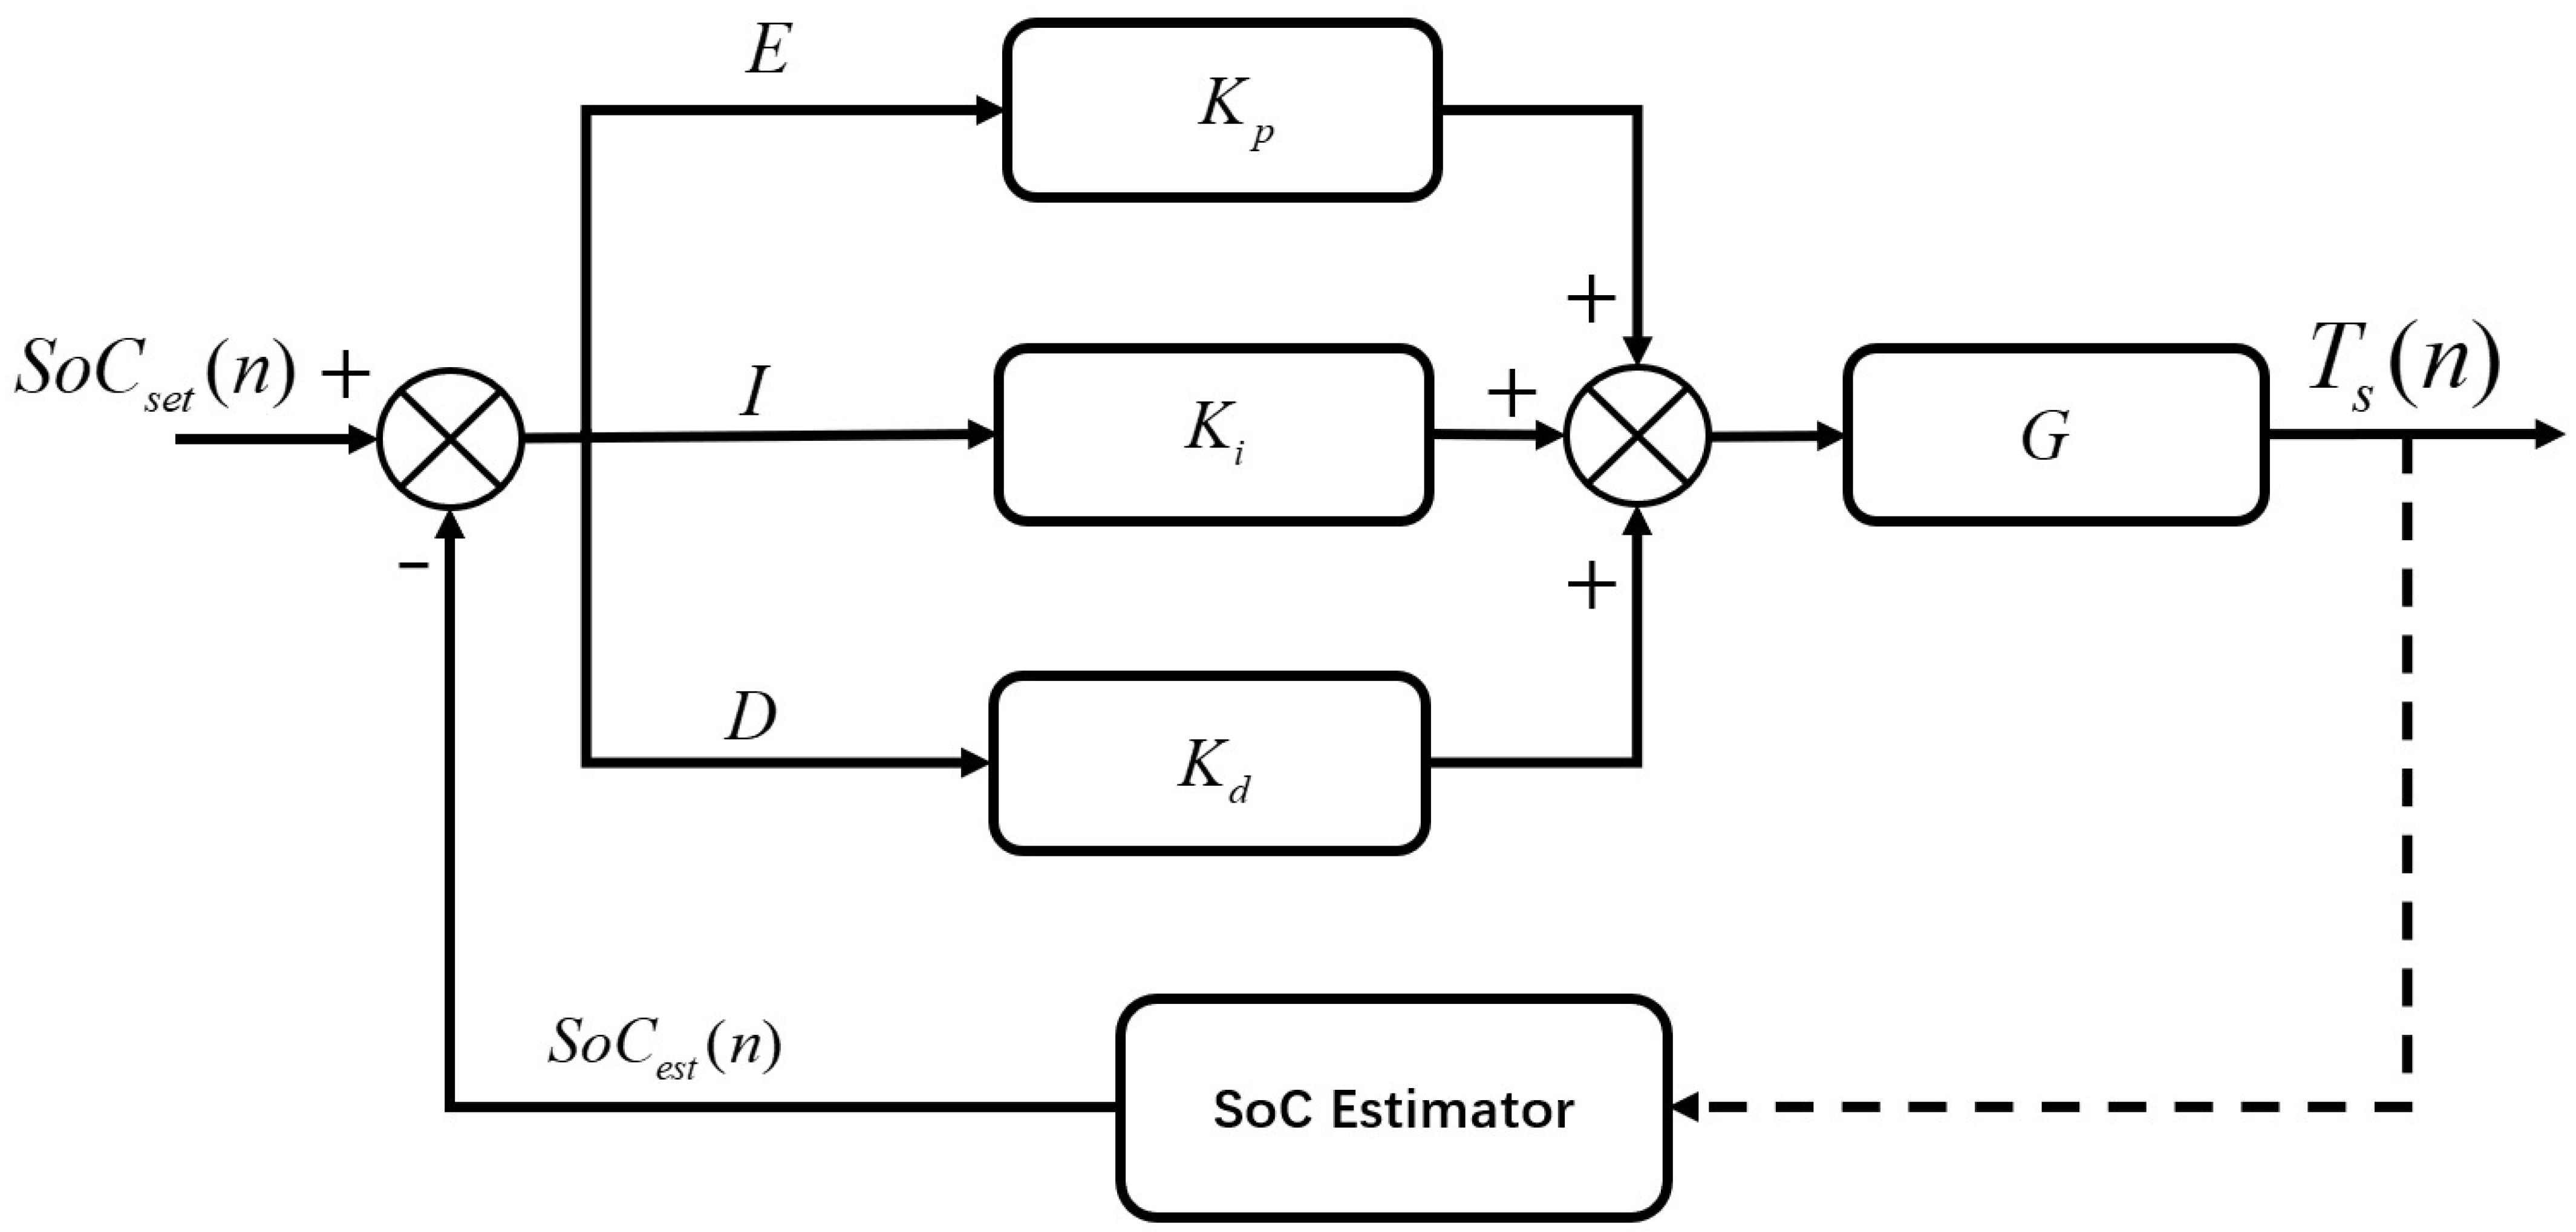
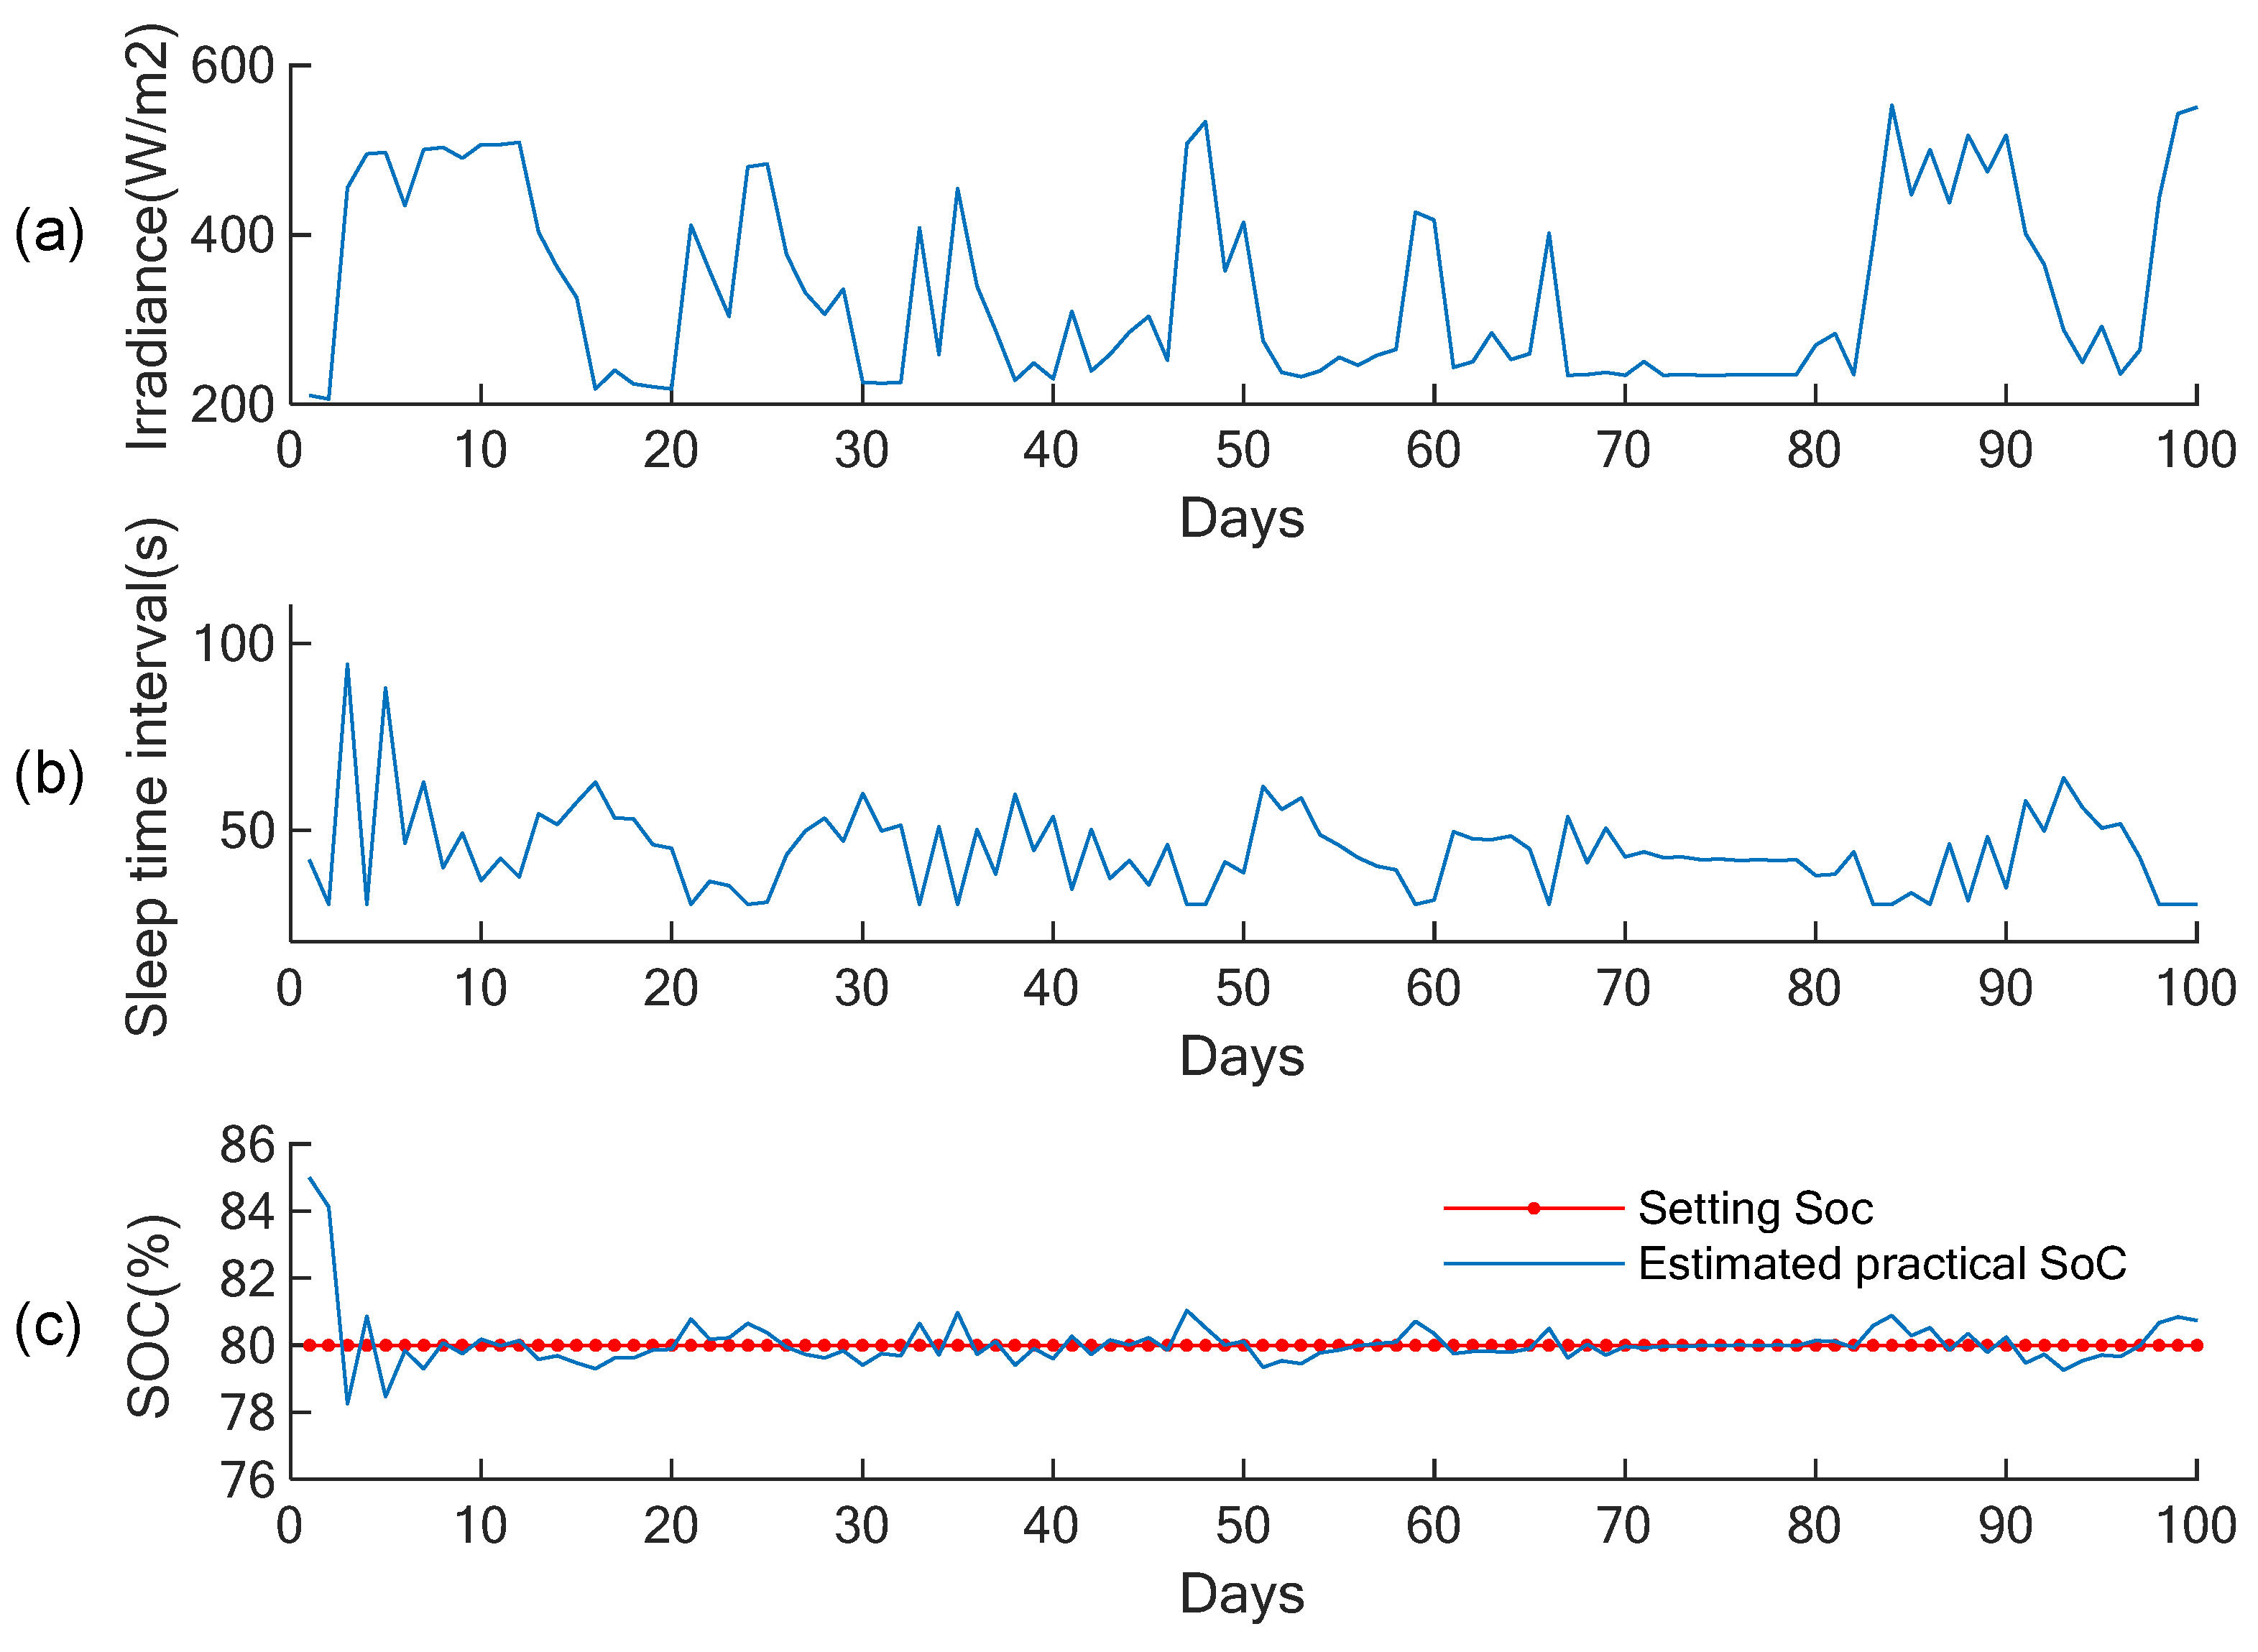
An innovative power management strategy: introducing photovoltaic power and using a PID-based dynamic active–sleep scheme to adjust the sleep time intervals according to assessments of the battery State of Charge (SoC), which significantly reduces the power consumption and maintains battery levels around 80% under fluctuating solar conditions, demonstrating that it is a sustainable method for energy management in smart agricultural devices.
(2)
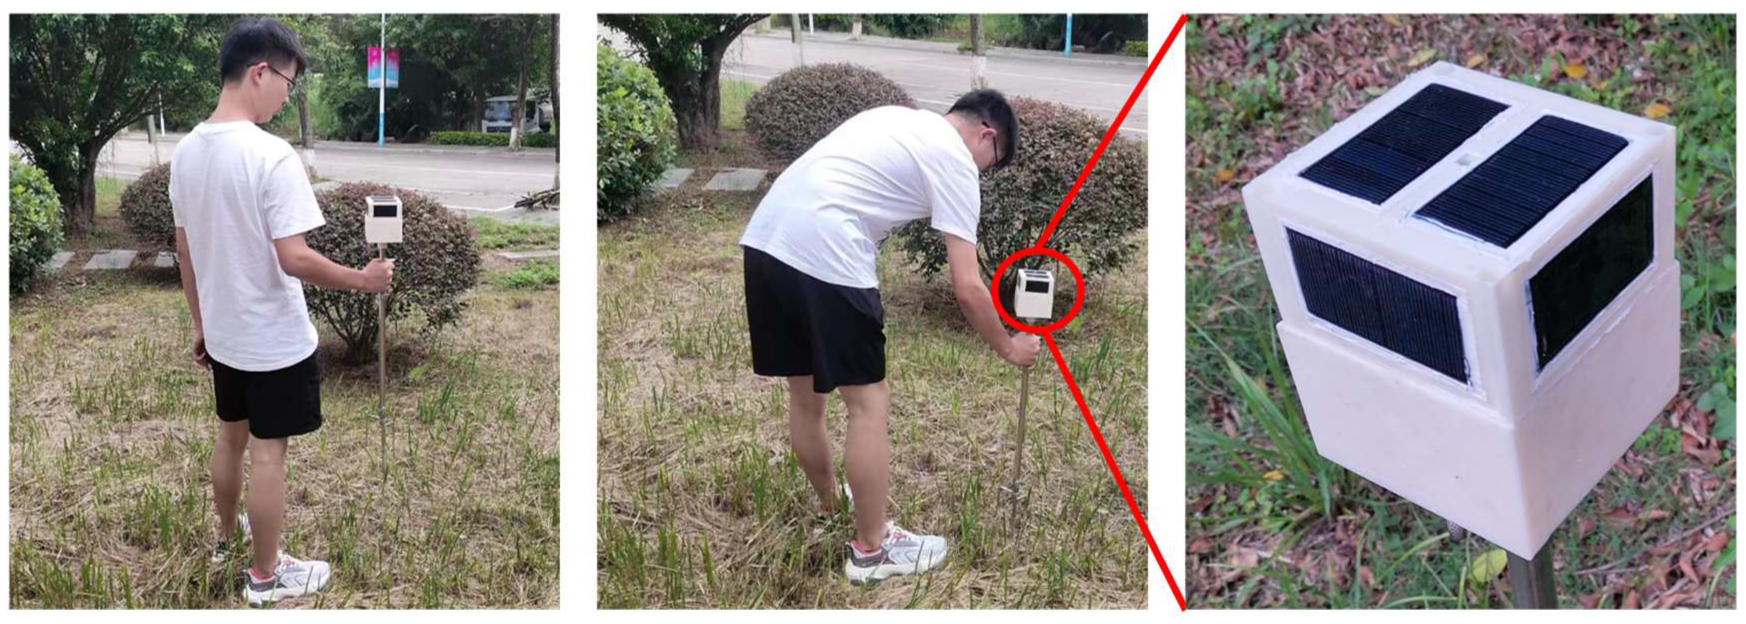
Portable, robust, and reliable design: following the principles of compactness, waterproofing, and dustproofing with stable connectivity and a self-sustaining power supply, the prototype measures 90 mm × 90 mm × 150 mm and weighs 844 g. In addition, the sensor is capable of autonomous remote sensing.
(3)
Reliable remote monitoring of four environmental parameters: integration of high-precision digital sensors to accurately measure vital environmental data such as temperature, humidity, light intensity, and CO2 levels, with performance consistently comparable to even the CR800 data logger.

2. Materials and Methods

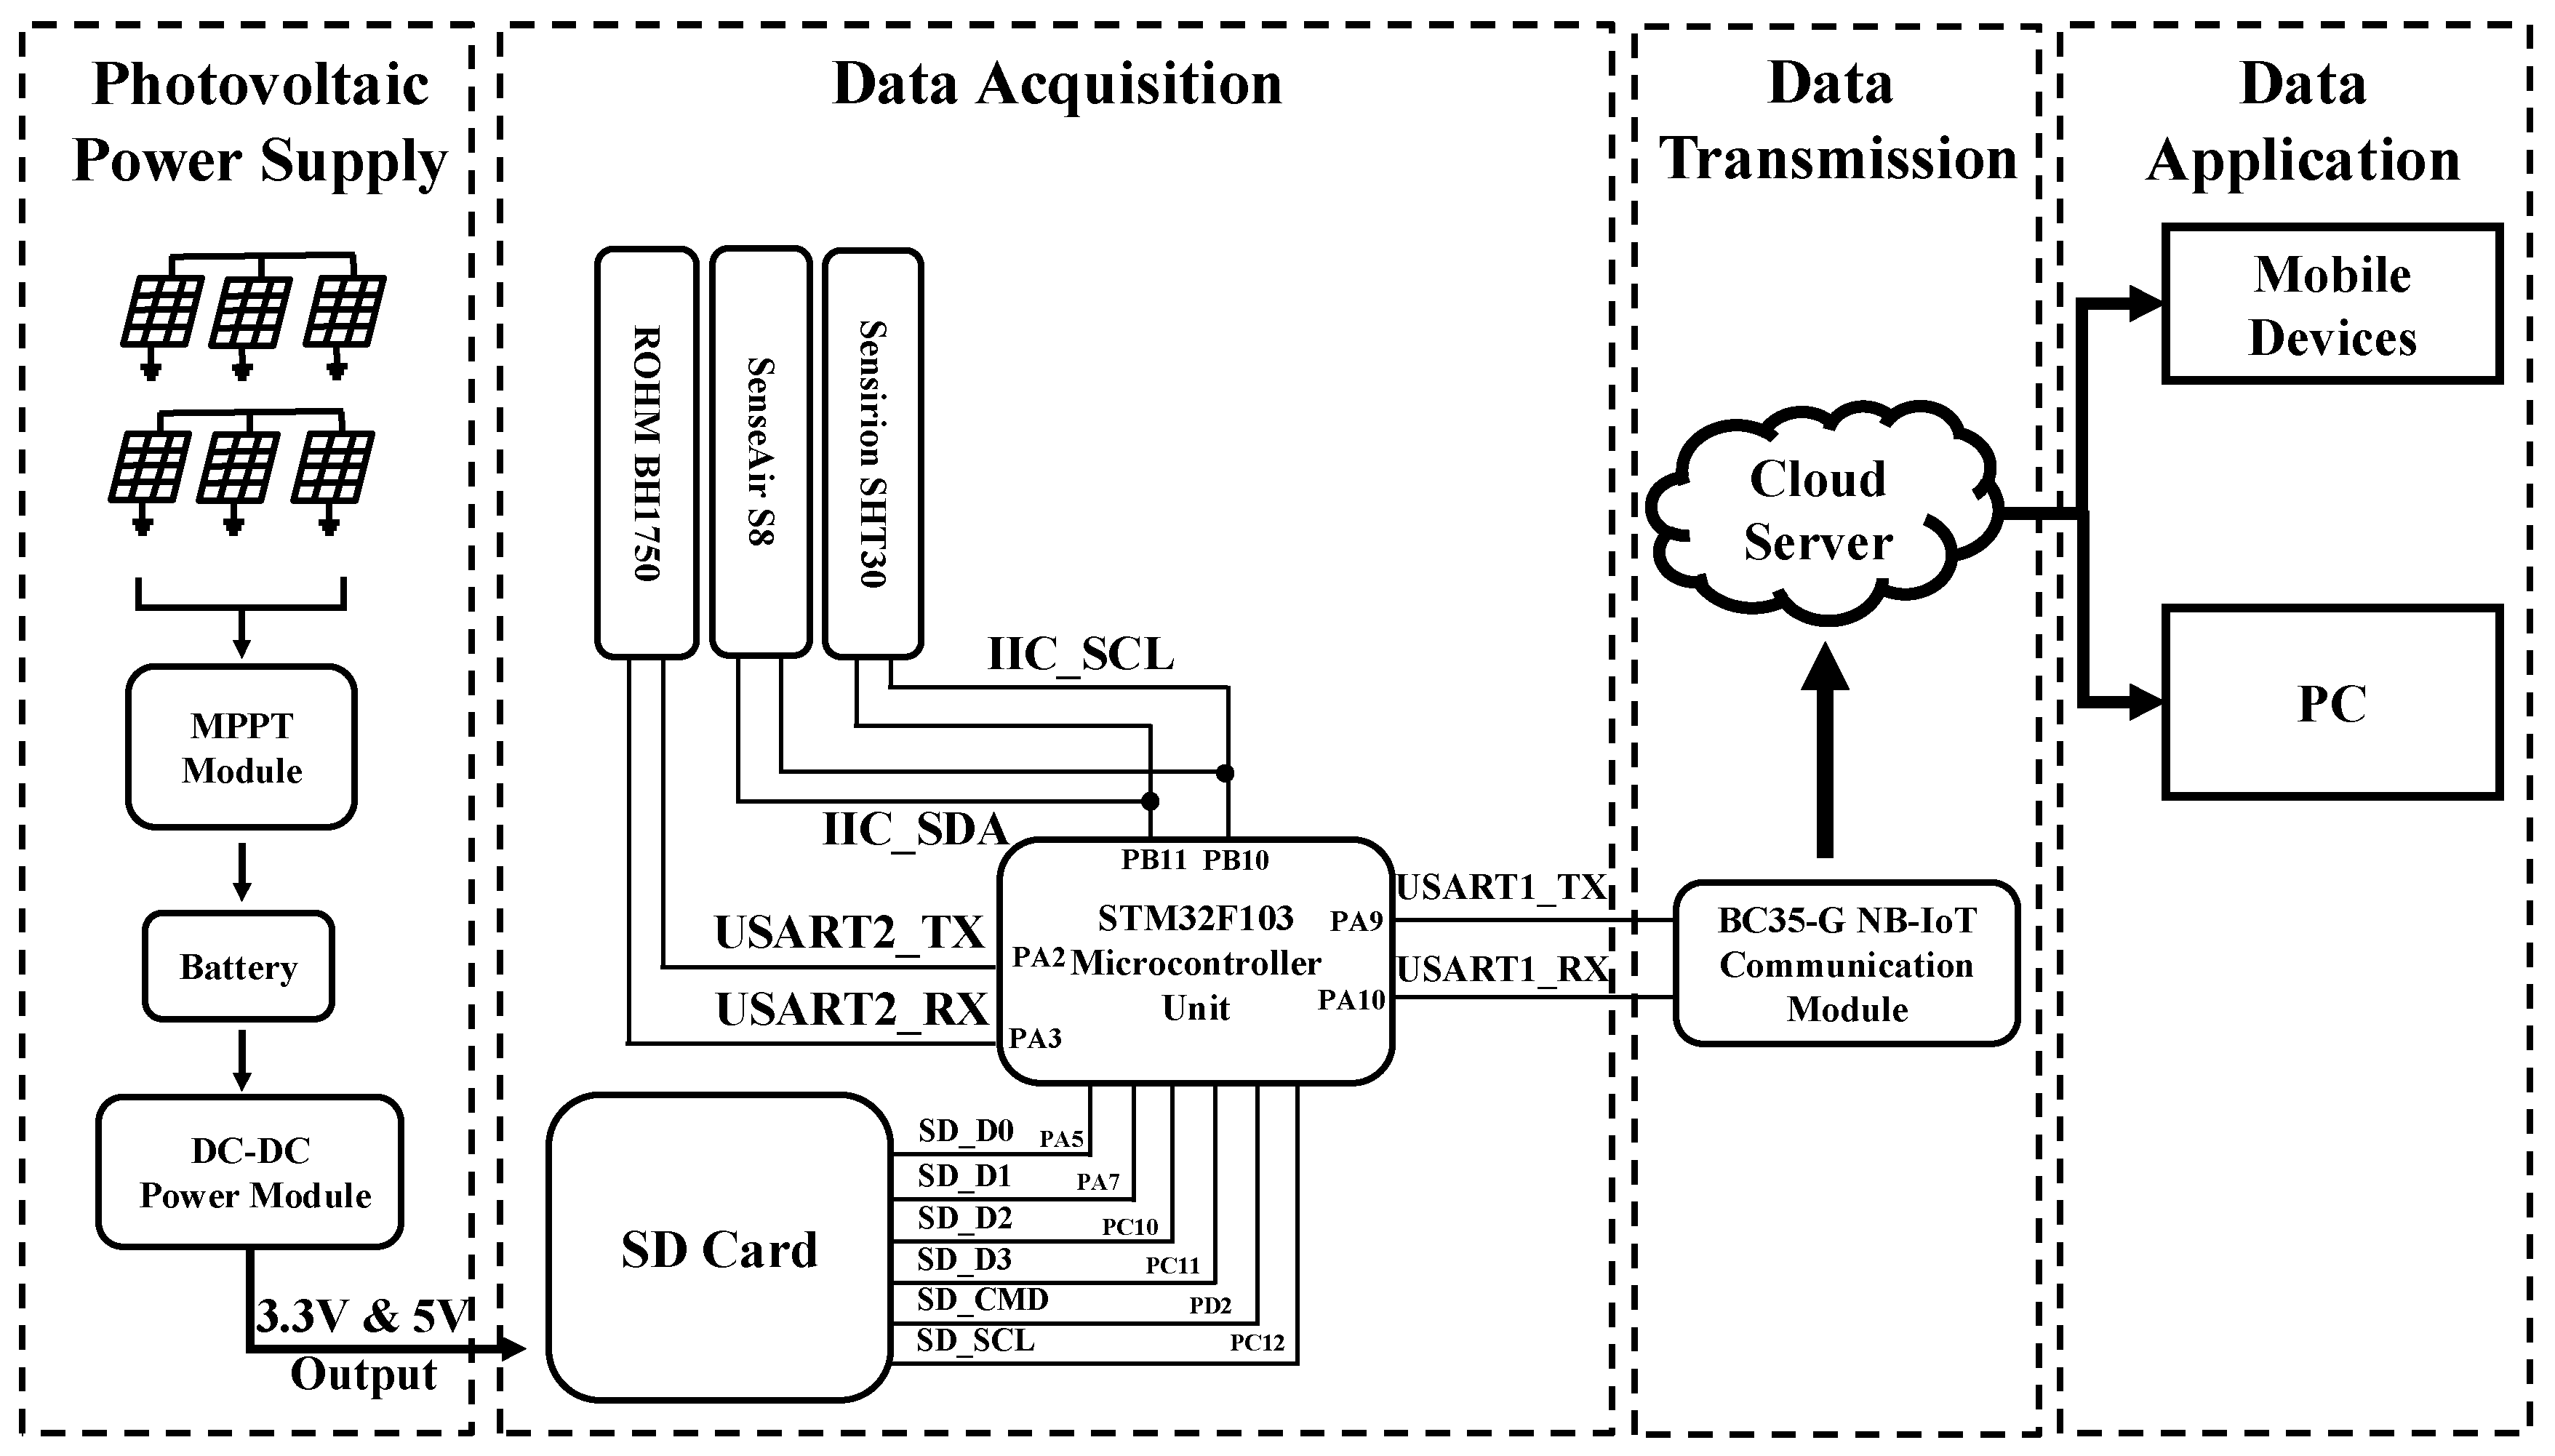
2.1. Overall Framework of the Sensor

The system architecture of the environmental monitoring sensor node, as shown in Figure 1, is structured into four main sub-modules: photovoltaic power supply, data acquisition, data transmission, and data application.
(1)
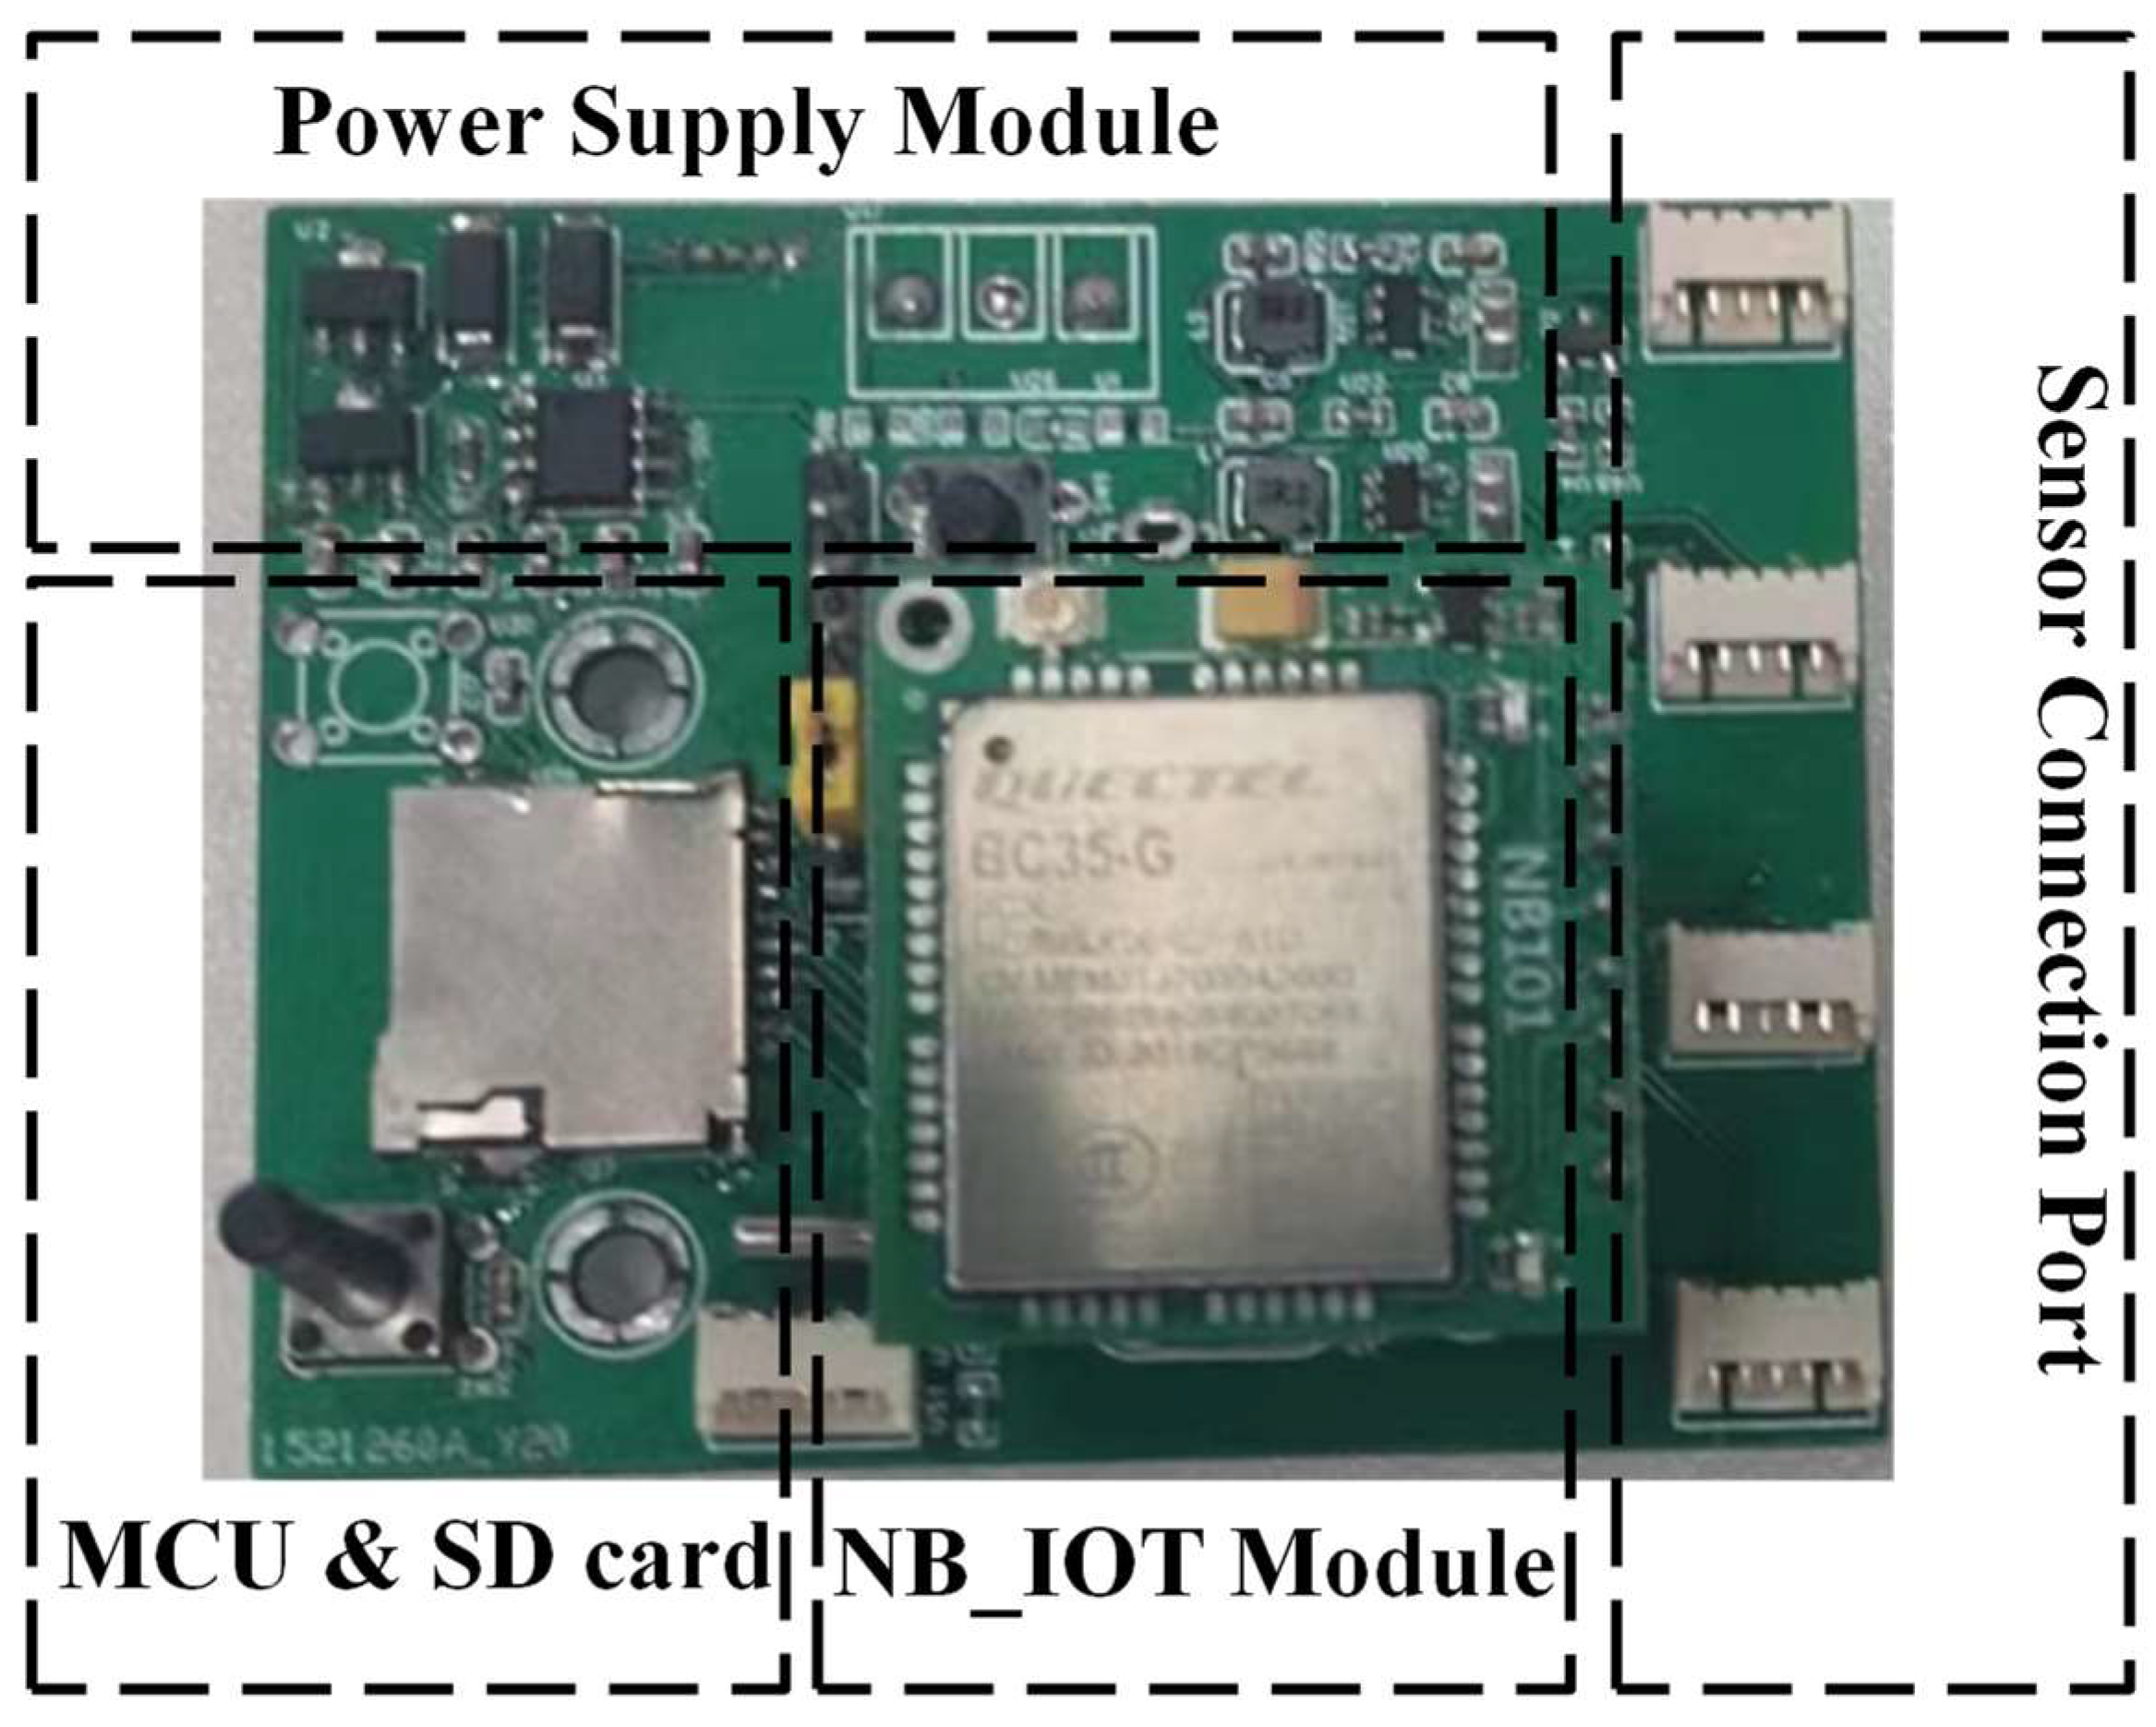
Photovoltaic Power Supply: This subsystem harvests solar energy and converts it into electrical power to operate the sensor. It primarily consists of six solar panels (5 V, 0.3 W each), a Maximum Power Point Tracking (MPPT) [24,25] circuit module, a 12,000 mAh lithium iron phosphate (LFP) battery, and a DC-DC power module with 5 V and 3.3 V output.
(2)
Data Acquisition: The STM32F103 microcontroller unit (MCU) is responsible for data acquisition, collecting environmental data from three digital sensors (Sensirion SHT30 [26], ROHM BH1750 [27], and SenseAir S8 [28]) connected via I2C and UART interfaces. These sensors measure parameters such as temperature, humidity, light intensity, and CO2 levels.
(3)
Data Transmission: The MCU transmits the data to a cloud server using the BC35-G NB-IoT communication module, which operates at 850 MHz, in a format that combines timestamp and data values after data acquisition. Simultaneously, the data are stored locally on an SD card for redundancy.
(4)
Data Application: Users can access the cloud host server via computer or mobile devices. The data can be retrieved through APIs for various applications, including real-time environmental monitoring, intelligent crop management, and environmental optimization.
In order to minimize power consumption, reduce board space, and improve resistance to electromagnetic interference, the agriculture environmental sensor is designed as an all-digital system. The detailed electrical circuit design includes digital sensors such as the temperature and humidity sensor (SHT30) and the light intensity sensor (BH1750), both of which use the I2C interface to connect to the controller via PB10 and PB11. The CO2 sensor (SenseAir S8) and the NB-IoT module (BC35-G) use the UART interface, and connect to UART1 (PA9, PA10) and UART2 (PA2, PA3), respectively. These designs ensure efficient and reliable data acquisition and transmission for optimal overall performance.

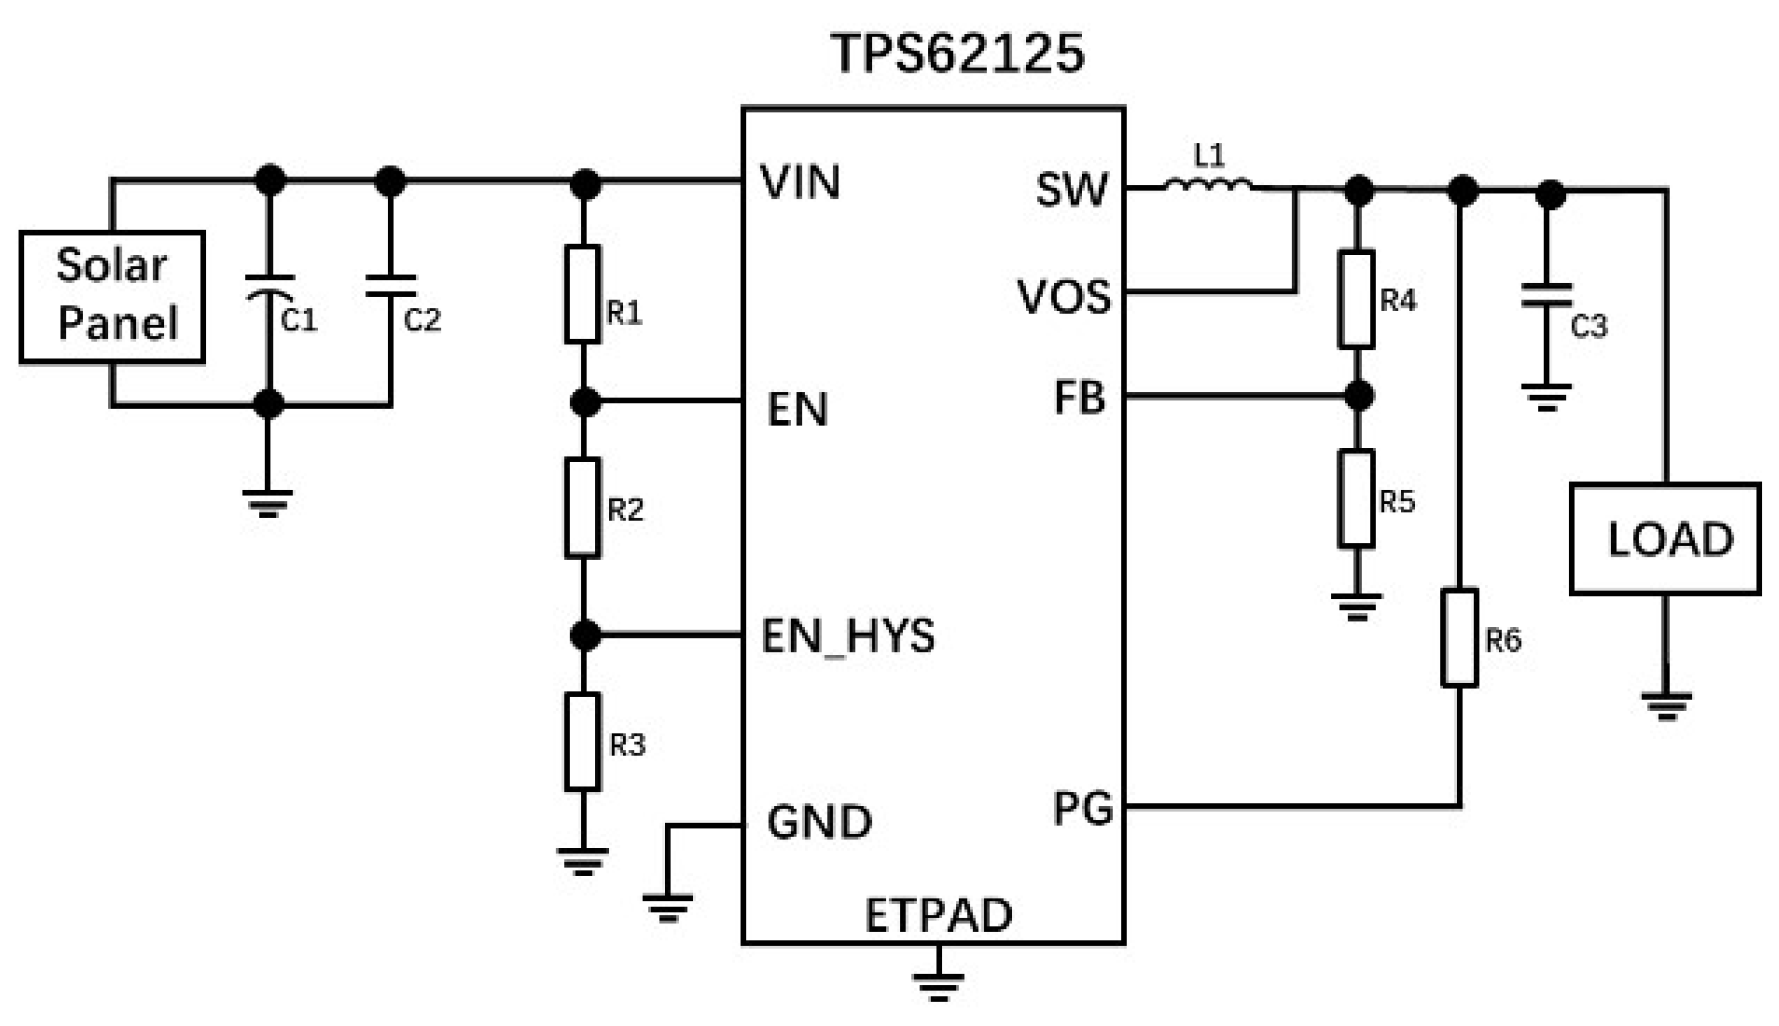
2.2. MPPT Based Photovoltaic Power Supply

The photovoltaic power supply system uses MPPT technology to maximize energy collection from solar panels. The MPPT control module continuously monitors the voltage and current of the photovoltaic components, ensuring that the power supply module operates at the maximum power point through pulse operation, and continually provides a reliable power supply for the environmental sensor. Here, we use six solar panels in the sensor, each with the following specifications: 68 mm × 37 mm, 5 V, 0.3 W. To meet the input voltage and current requirements for the TPS62125, the solar panels are arranged in a series-parallel configuration as follows: two panels in series increase the voltage, and then three series combinations in parallel increase the current. Thus, the combined output of the solar panel is 10 V, 1.8 W.
The TPS62125 (Texas Instruments) DC-DC converter is used to step down the input voltage to a suitable level for charging a Li battery, and the MPPT control optimizes the power output from the solar panels. The schematic of the TPS62125 is shown in Figure 2. In the circuit, resistors R1, R2, and R3 form the startup circuit, which enables the EN (enable) pin of the TPS62125 to initiate the MPPT operation. Resistors R4 and R5 are part of the feedback circuit that stabilizes the output voltage by adjusting the feedback pin (FB) voltage in response to changes in the output voltage, ensuring stable operation of the MPPT control module. And the feedback loop helps maintain the desired output voltage by regulating the duty cycle of the switch.
We chose R1 = 1 MΩ, R2 = 154 KΩ, R3 = 60.4 KΩ; the voltage values of “EN” and “EN_HYS” can be calculated by the following equations.
V E N = 1.20   V × ( 1 + R 1 / R 2 )
V E N _ H Y S = 1.15   V × ( 1 + R 1 / ( R 3 + R 2 ) )
According to Equations (1) and (2), the operating voltage range for the photovoltaic power supply circuit is from 6.5 V to 9.0 V. Furthermore, the voltage of the feedback point V F B is 0.8 V, the output of the circuit V o u t is
V o u t = V F B ( 1 + R 4 / R 5 )
Considering the charge voltage of the lithium battery and voltage drop across unidirectional charging diode are 4.2 V and 0.7 V, respectively, then V o u t = 4.9 V. We selected R4 = 100 KΩ, and according Equation (3), R5 is 16.2 KΩ. Other circuit parameters are set as C1 = 10 µF, C2 = 0.1 µF, C3 = 22 µF, L1 = 10 µH, R6 = 100 KΩ.
Following the TPS62125 circuit, an LFP battery charging management circuit based on the CN3158 chip was implemented, ensuring that the energy is efficiently stored in the lithium battery to support sensor operation.

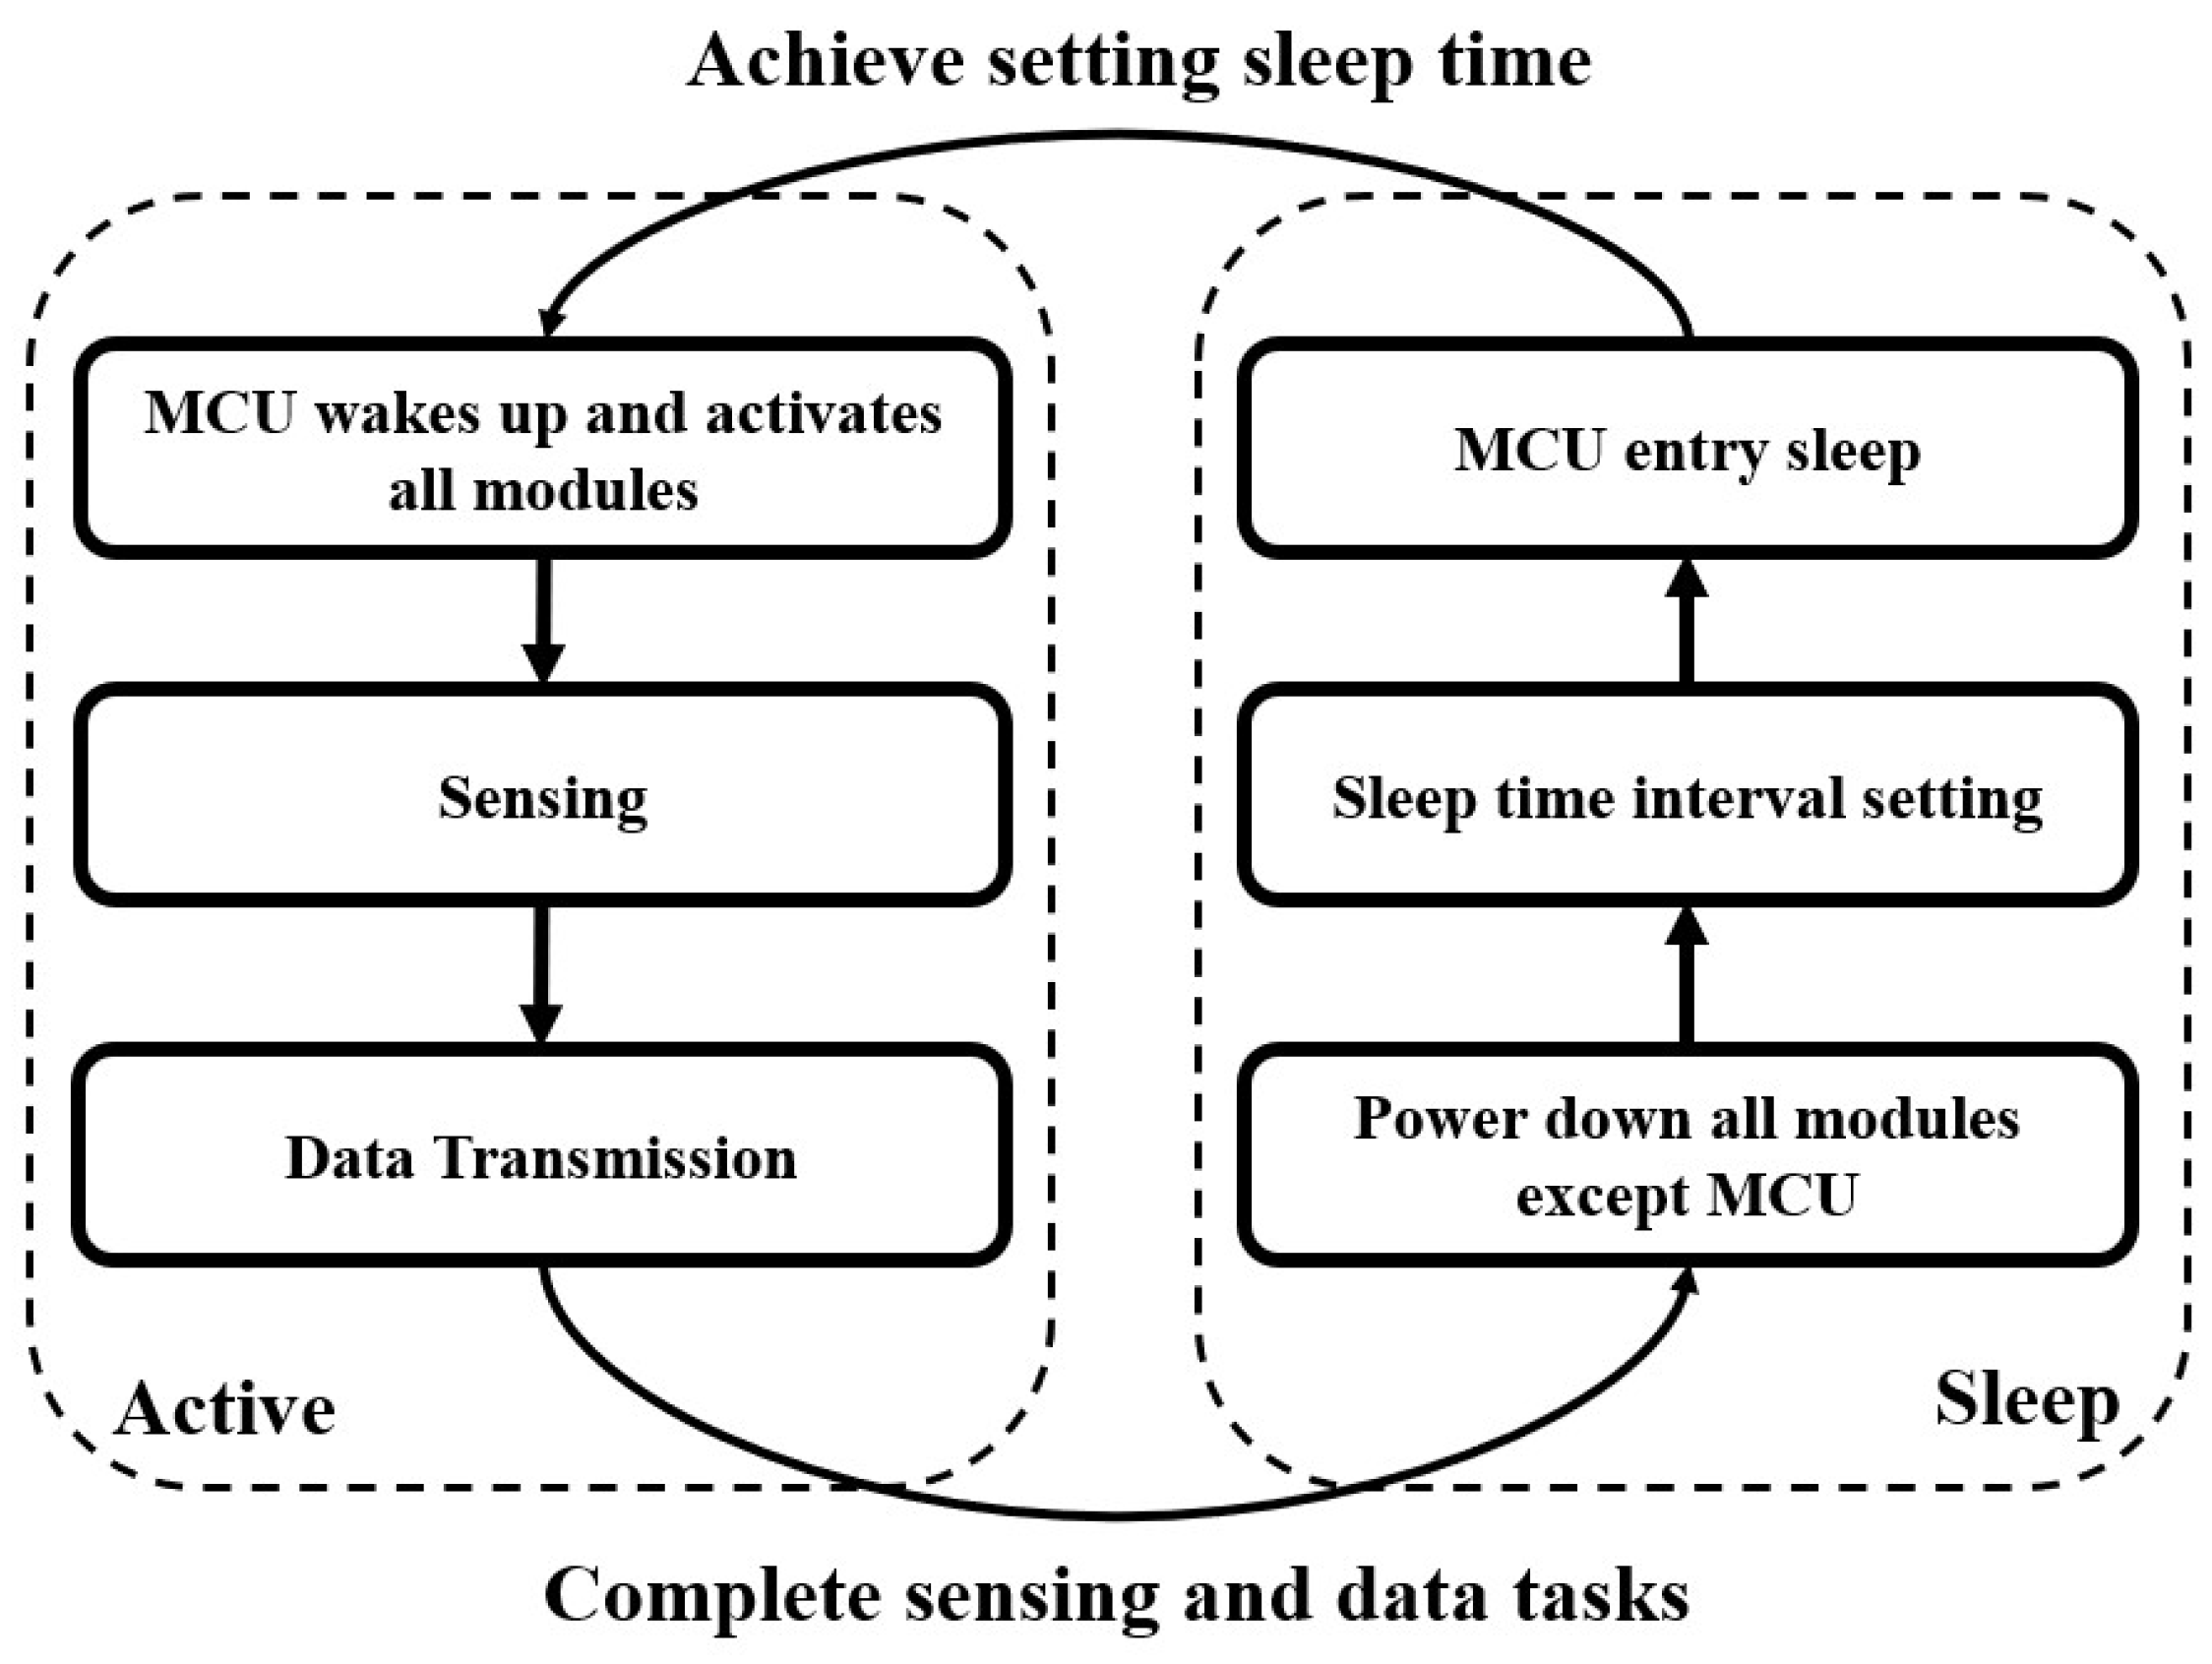
2.3. Dynamic Active Sleep Scheme for Optimal Energy Management

The sensor uses a photovoltaic power supply with a high-capacity lithium battery. However, without an efficient energy management stagey, the sensor may quickly run out of power because the maximum efficiency of solar energy harvesting is less than the power consumption of the sensor if it remains continuously active. To maximize its lifetime, the sensor node incorporates not only low-power hardware but also effective energy-saving software [29]. Sleep is one of the most efficient energy-saving methods for sensor nodes [30]. Hence, we proposed a dynamic active–sleep scheme to optimize the energy usage of the sensor. Considering that solar energy collection can vary significantly with lighting conditions, and the sensing parameters are not time sensitive, it is crucial to dynamically adjust the sensor’s sleep time interval to match the energy consumption with limited energy supply, thereby ensuring the maximal lifetime of the sensor.
As illustrated in Figure 3, the dynamic active–sleep scheme is designed to optimize energy usage by alternating the sensor between “Active” and “Sleep” states. Upon entering the “Active” state, the MCU wakes up from sleep mode and powers on all modules to initiate operations. This activation includes powering up digital sensors, communication interfaces, and any other peripheral modules required for data acquisition and transmission. The sensor node collects environmental data using its sensors, such as the SHT30, BH1750, S8, and BC35-G. After data collection, it transmits the collected data to a cloud server and backs them up to a local SD card, ensuring that the data are available for real-time analysis, monitoring, or other applications. Sensing and data tasks are performed within 2 s in the “Active” state. Once these tasks are completed, the sensor returns to the “Sleep” state. To conserve energy, the first step of the sleep state is to power down all modules except the MCU, then the sensor sets an appropriate sleep time interval based on the sensor’s energy status using a PID algorithm. This interval is dynamically adjusted according to the remaining battery capacity and the energy harvested from solar charging on the previous day. Finally, the MCU itself enters a low-power sleep mode to maintain minimal power consumption until the next wake-up. This dynamic active–sleep scheme ensures that the sensor remains in sleep mode much longer than in active mode. This maximizes the efficiency of the limited energy provided by the photovoltaic system, allowing the sensor to operate continuously.
Figure 4 illustrates the schematic of the discrete PID algorithm used for estimating the sleep time interval in the dynamic active–sleep scheme. The LFP battery is part of the photovoltaic power supply subsystem. Assume the expected SoC of the battery is S o C s e t ( n ) . The estimated practical SoC of the battery is S o C e s t ( n ) , which can be measured using a SoC estimator based on ampere-hour integration (AhI) [31]. The error between SoC set and estimated values is E , E ( n ) = S o C s e t ( n ) S o C e s t ( n ) . The integral of the error is denoted as I , I = i = 0 n E ( i ) , with upper and lower limits of I max and I min , respectively. The derivative of the error is D , D ( n ) = E ( n ) E ( n 1 ) . The control parameters of the PID algorithm are denoted as K p , K i , and K d , and G is a gain. The sleep time interval upper and lower limits are T s max and T s min , respectively. Then, the custom designed PID algorithm [32] is used to calculate the sleep time interval T s ( n ) as follows:
Step 1: calculate the error E ( n ) , the integral of the error I ( n ) , and the derivative of the error D ( n ) , respectively;
Step 2: limit the integral of the error: if I ( n ) > I max , then I ( n ) = I max ; if I ( n ) < I min , then I ( n ) = I min ;
Step 3: calculate the time interval as
T s ( n ) = G × [ K p × E ( n ) + K i × I ( n ) + K d × D ( n ) ] ;
Step 4: limit the time interval for balance real time sensing and energy saving: if T s ( n ) > T s max , then T s ( n ) = T s max ; if T s ( n ) < T s min , then T s ( n ) = T s min .
In particular, the upper limit I max and lower limit I min of the integral of the error are set to 2 and −2, respectively. The time interval upper limit T s max and lower limit T s min are set to 180 s and 30 s, respectively. Other parameters of K p , K i , K d , and G are 3.5, 1.9, 1.5, and 90, respectively.

3. Results

3.1. The Prototype Sensor Node

The printed circuit board (PCB) is the core of the sensor, which is designed according to modular principles to optimize the electronic circuit layout for compactness. As shown in Figure 5, the PCB integrates the photovoltaic power supply module, sensor interfaces, NB-IoT communication module, MCU, and SD card, all within a space of 60 mm × 50 mm. This compact PCB design is the foundation that ensures the portability and flexibility of the sensor.
Figure 6 shows the proposed prototype sensor node and its deployment method. The case and base of the sensor were manufactured using 3D printing technology. The close-up view reveals six solar photovoltaic panels embedded on the top and sides for efficient solar power harvesting from different angles. The base includes air vents, drip ledges, and insect screens, with sensors, wires, and a PCB installed inside. Additionally, to further protect the electronic circuit, a conformal coating is applied before assembly, to enhance the sensor’s waterproof, moisture-proof, and dustproof capabilities. The fully assembled prototype is compact and lightweight, with its size and weight being 90 mm × 90 mm × 150 mm and 844 g, respectively. When combined with a scalable metal mounting rod, the total weight of the sensor is 1759 g, ensuring easy single-handed carrying and convenient deployment in various environments. As shown in Figure 6, a young man can easily hold the sensor with one hand. The prototype sensor node is portable, robust, and reliable, ensuring its durability and continually reliable operation in harsh outdoor conditions.

3.2. Power Consumption and Energy Optimization Results

We measured the power consumption of each module in the sensor node, including the MCU, environmental parameter sensors, and the storage and communication module, in both the active and sleep states. The results are presented in Table 1. Significant differences in power consumption between sleep and active states were observed. In the sleep state, only the MCU consumes a small amount of energy, resulting in a total power consumption of 2.5 mW. In contrast, in the active state, the MCU’s power consumption rises to 101.3 mW, while the sensing and storage and communication modules increase to 137.2 mW and 226.5 mW, respectively, bringing the total power consumption to 465 mW. In particular, the CO2 sensor and wireless communication are the major energy consumers, using approximately 133.6 mW and 226.5 mW, respectively, and accounting for over two-thirds of the total power consumption.
Figure 7 shows the experimental data for a TPS62125-based photovoltaic power supply circuit tested under full sunlight conditions in Fuzhou, China, on 24 June 2024. The detailed experimental results corresponding to those in Figure 7 and the light intensity during the experimental period are shown in Table 2. The test, which started at 6:00 AM and ended at 6:00 PM, included hourly data recordings. The light intensity shows a strong correlation with the input voltage of the MPPT circuit. Figure 7a,b show the input and output voltages (Vin and Vout) and currents (Iin and Iout), respectively. Notably, at 6:00 and 18:00, the input voltages were below the circuit’s operating threshold of 6.5 V, at 5.7 V and 5.8 V, respectively, due to insufficient sunlight. The period of operation is indicated by dotted rectangles. Throughout the day, the output voltage remained stable at 5.0 V, while the input voltage, current, and output current varied with solar irradiance. Figure 7c shows the input power (Pin), output power (Pout), and conversion efficiency (E) of the MPPT circuit, which averaged 91.6% with a standard deviation of ±0.1%, demonstrating the reliable performance of the TPS62125 chip. Considering that the energy conversion efficiency of the solar panel is approximately 15% [33], the photovoltaic subsystem delivered an average power of 184 mW under full sunlight, with an overall conversion efficiency of approximately 70%.
The experimental results show that despite the use of low-power hardware and a solar photovoltaic power supply, the energy consumption of the proposed node (465 mW) exceeds its energy harvesting capacity (an average of 184 mW in full sunlight during daylight hours). Therefore, effective power management is critical. Without optimization, the sensor will quickly exhaust its energy within a few days.
To validate the effectiveness of the energy management of the proposed dynamic active–sleep scheme, we conducted a numerical experiment to evaluate the SoC of the sensor node battery. The power consumption setting is based on the specifications in Table 1. The overall harvesting electronic power conversion efficiency is 10%. The sunlight duration and intensity were obtained from Fuzhou Weather Bureau. The expected SoC was set to 80%, which is the optimal SoC level for LFP battery charging [34].
The experimental results are shown in Figure 8. Figure 8a represents the variation in the average irradiance data from meteorological records, showing significant fluctuations under different weather conditions. Figure 8b shows the sleep time interval output of the proposed energy optimization algorithm. In Figure 8a, the actual battery charge level variation curve for the node is displayed. It can be observed that the sleep time interval dynamically responds to changes in irradiance intensity, increasing during periods of low illumination and decreasing during periods of high illumination. This adjustment aligns the power consumption of the sensor node with the fluctuations in solar energy harvesting. As a result, Figure 8c demonstrates that the SoC of the battery remains relatively stable around 80%, with minor fluctuations and no downward trend. This promising result is attributed to the proposed dynamic active–sleep scheme. The experimental results validate the effectiveness of the proposed method, indicating that with proper energy management, the sensor can continue to operate efficiently.

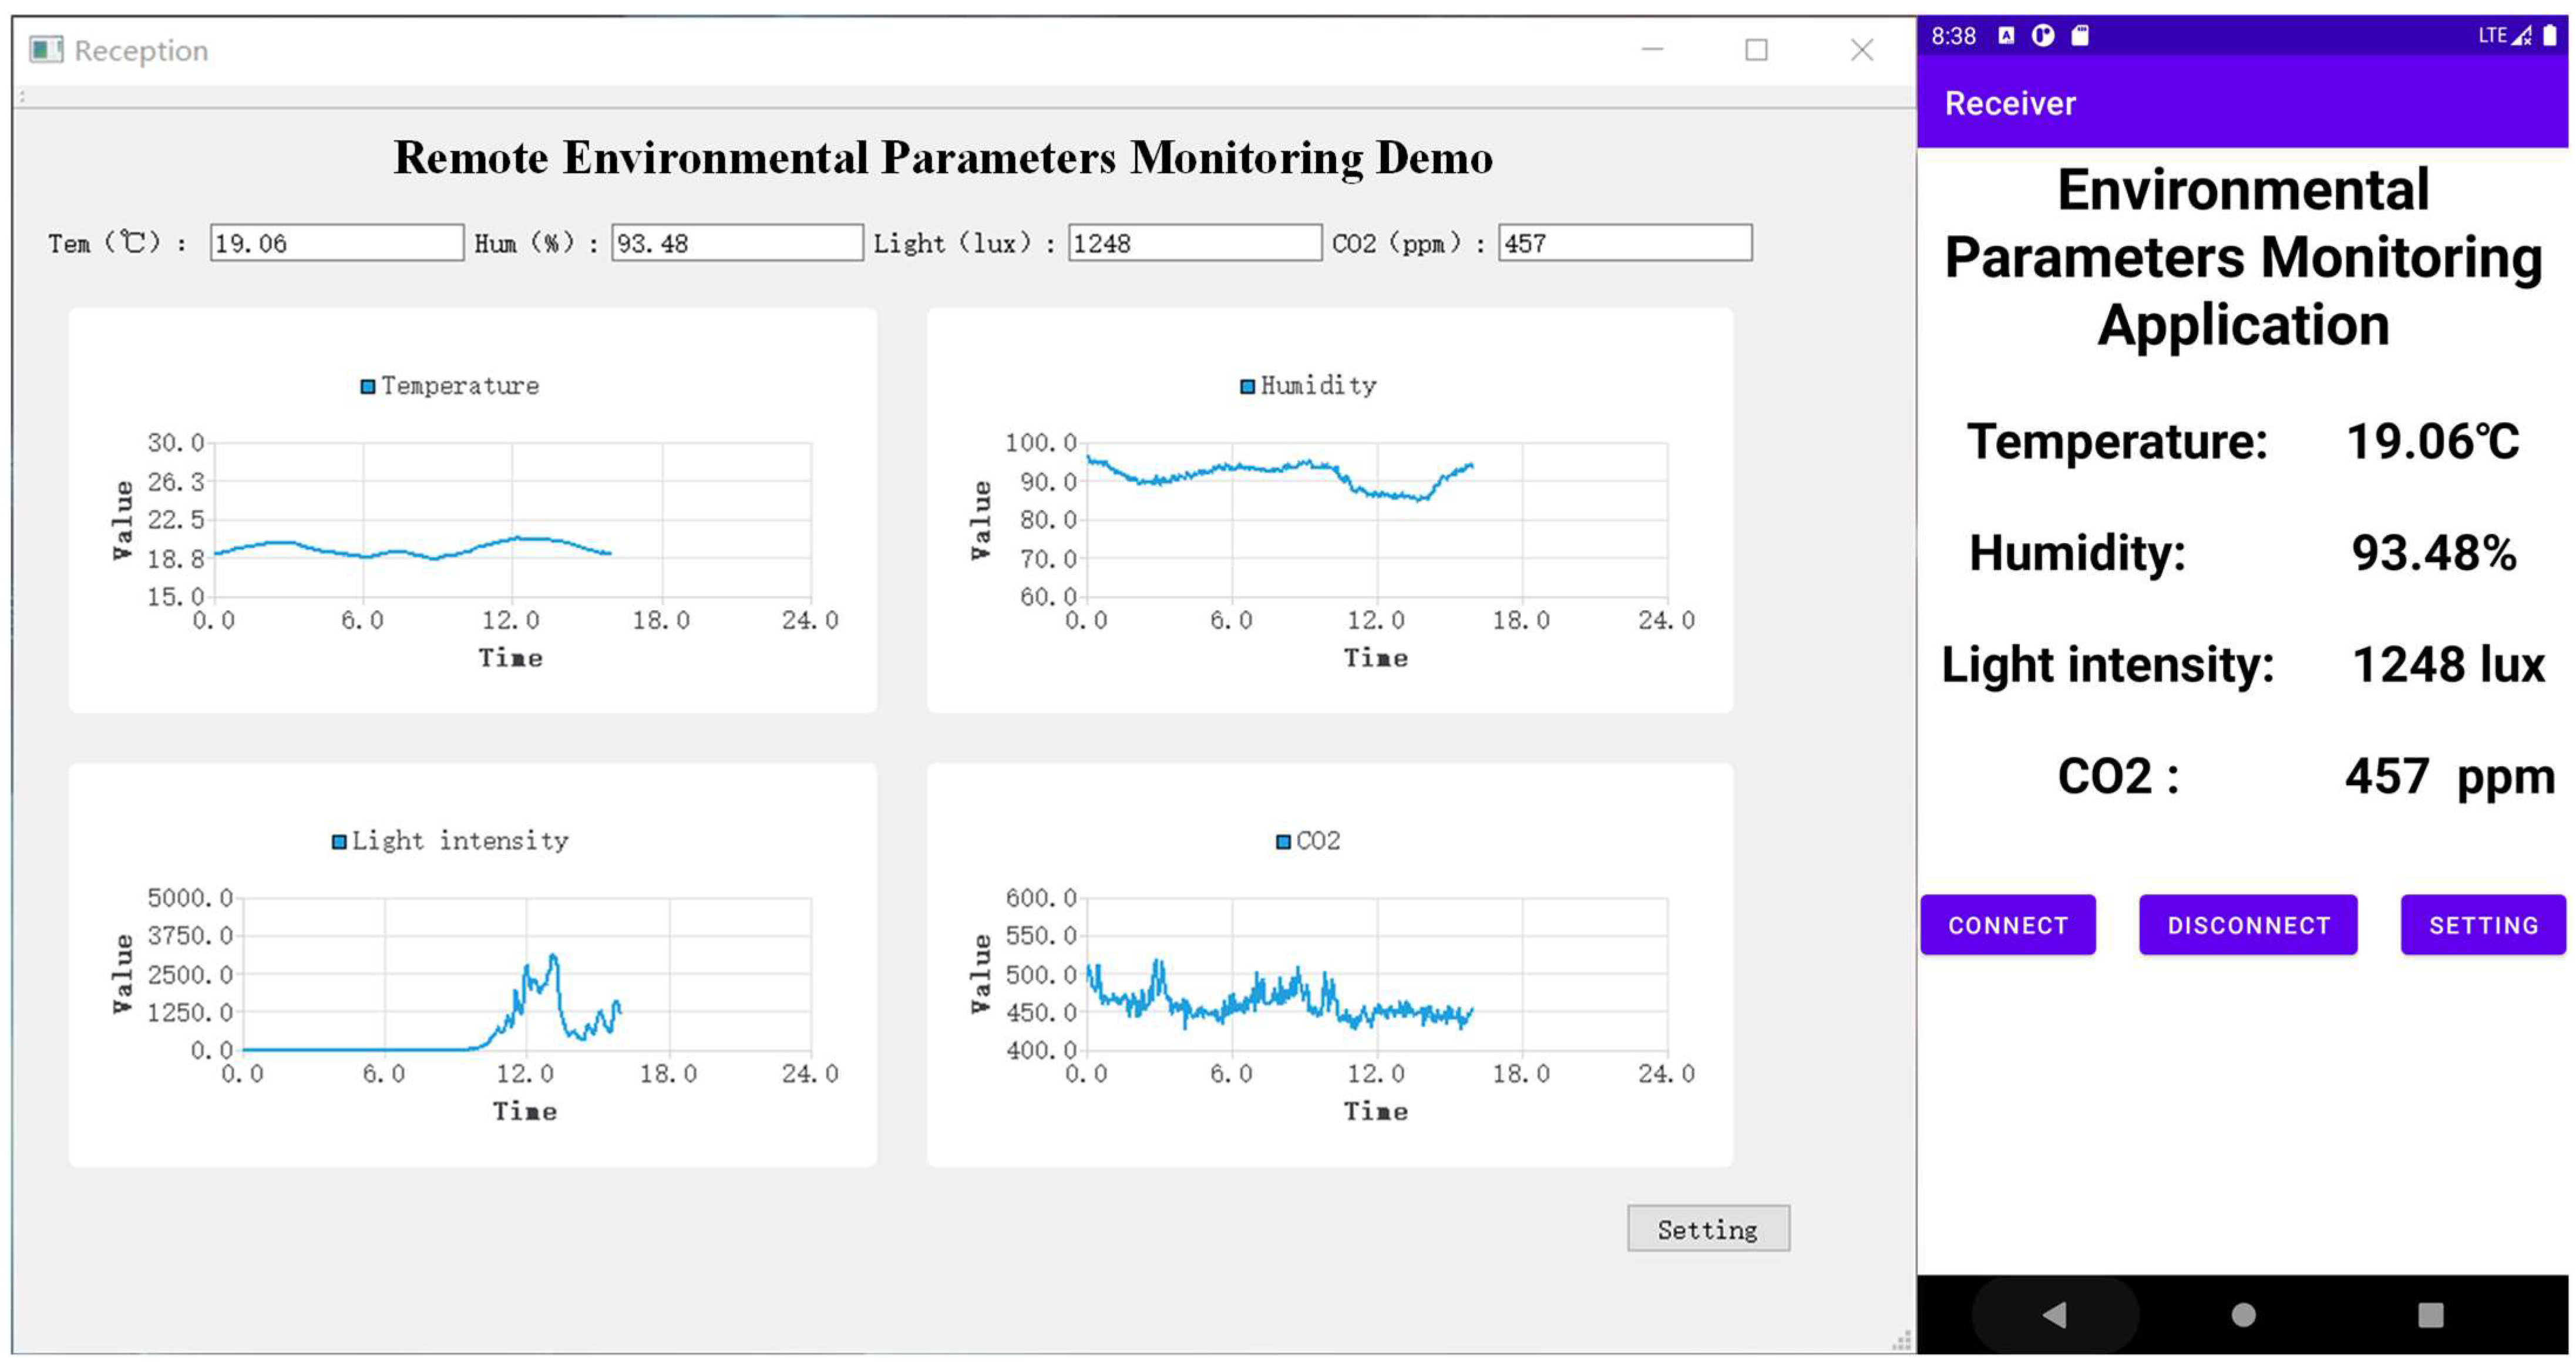
3.3. Remote Monitoring of Four Environmental Parameters

To verify the remote sensing function of the sensor and the accuracy of its environmental parameter measurements, we simulated a real-world sensing scenario and deployed the prototype sensor node at the weather station of Fujian Agriculture and Forestry University (FAFU) located at No. 15, Shangxiadian Road, Cangshan District, Fuzhou City, Fujian Province, China. This deployment allows the sensor node to collect data, which are then remotely transmitted to the laboratory via the public network using the BC35-G NB-IoT wireless communication module. The weather station of FAFU provides data recorded by a CR800 for comparison. The outdoor environment is shown in Figure 9. The experiment was conducted from 12 April 2023, 0:00 to 14 April 2023, 0:00.
Figure 10 shows a comparison of the outdoor environmental parameter measurement results between the CR800 data logger and the proposed sensor node at the same location. The comparison also includes data from the weather forecast report.
Figure 10a displays the light intensity data, with peaks appearing around noon, consistent with the general pattern of light intensity variation with the position of the sun. The curve experiences fluctuations at certain times, probably due to natural phenomena such as cloud cover. The points where the curve crosses zero correspond to the times of sunrise and sunset each day. Figure 10b–d present the CO2, temperature, and humidity curves, respectively. The data recorded by the proposed sensor node demonstrates good consistency with the CR800 records and provides more detailed variations due to its higher data update rate. Among them, Figure 10b shows CO2 concentrations ranging from around 400 ppm to just above 500 ppm. The measured CO2 levels fall within the expected natural range, with both devices displaying consistent trends. The proposed sensor node generally shows slightly lower values than the CR800, probably due to differences in the sensors used. Figure 10c shows temperature variations over the experimental period, including maximum and minimum temperature lines with data from the weather forecast. The temperature ranged from approximately 16 °C to 23 °C. The measurements taken by the prototype sensor align well with the forecasted temperature trends, reliably capturing the natural fluctuations. Figure 10d compares the humidity levels recorded by both devices. The records of humidity levels from the two devices show a good consistency. The comparison of the results indicates that the proposed sensor node provides accurate and reliable measurements, effectively capturing natural environmental fluctuations.
Figure 11 shows demo examples of a PC client and a monitoring app for mobile devices. These examples verify that the sensor can successfully transmit collected environmental data to a cloud server via its NB-IoT module. Through an application programming interface (API), the recorded environmental parameter data can be streamed in real-time to terminal PCs or mobile devices.

4. Discussion

Based on the experimental results and the performance of the prototype sensor node, we further discuss its advantages and shortcomings for remote environmental monitoring, focusing on the power consumption, the effectiveness of the dynamic active–sleep scheme, its remote sensing function, and the usability design.
First, as shown in Table 1, the total power consumption of the node remains low during the sleep state but increases significantly in the active state. This is primarily due to the S8 CO2 sensor, which operates on the non-dispersive infrared (NDIR) principle and consumes a considerable amount of power. Additionally, the wireless communication module also contributes to the high energy usage. The compact size of the node limits the area available for solar panels, resulting in insufficient energy harvesting to meet the sensor’s demands in the active state. Therefore, implementing effective energy management strategies is crucial for ensuring the sensor’s long-term continuous operation.
Second, we proposed an energy optimization algorithm called the dynamic active–sleep scheme for adaptively adjusting the sleep time interval of sensor nodes. While a higher sampling rate provides more detailed environmental data, it also consumes more energy. The proposed algorithm dynamically adjusts the sleep time interval using the PID control principle, ensuring that the SoC of the battery maintains an optimal charge level. And the sampling interval is synchronized with the sleep time interval, adjustable from 30 to 180 s. This configuration is ideal for environmental monitoring because it balances the need for timely data collection with energy efficiency, ensuring both detailed insights and an extended battery life. The experimental results demonstrate that the algorithm effectively balances the energy supply and consumption.
Third, the prototype sensor node showed a high level of consistency with the CR800 data logger and weather forecast data in the experiments. On April 12th, significant fluctuations in the humidity and CO2 concentration due to heavy rain were accurately recorded, reflecting the weather’s impact on environmental conditions. This indicates that the sensor’s monitoring data reliably reflect the true outdoor situation. Of course, we also note the discrepancy between our data and the reference data. The reasons for the differences in Figure 10 may include the fact that the weather bureau’s forecast data reflect a district-wide average, while our sensor node and CR800 logger provide localized microclimate measurements; our sensor node uses digital chips from trusted manufacturers that are carefully calibrated to ensure accuracy according to their specifications. In contrast, the CR800, which has been in use for over ten years, relies on analog sensors that have not been recently calibrated. Further data collection and verification should be performed in future work to confirm the long-term accuracy of the proposed node.
Finally, the prototype sensor node is portable, robust, scalable, and easy to use. With stable wireless connectivity and self-sustaining power supply, the sensor is capable of autonomous remote sensing. In the node, the fully digital interface for sensing allows the MCU to connect to a variety of sensors using digital protocols such as IIC, SPI, and UART. These digital interfaces can naturally support multiple devices, so the node can then be easily expanded to include additional sensors in addition to the current suite that measures temperature, humidity, light intensity, and CO2 levels. As long as new digital sensors conform to the interface standards of the node, they can be seamlessly integrated.
Overall, advanced sensing capabilities, effective energy management, accuracy, and reliable design make the proposed sensor a potential candidate for remote environmental monitoring, particularly in resource-limited or off-grid agricultural environments.
Table 3 presents a detailed comparison of various environmental monitoring devices. The table details device names, sensor types, size, battery life, photovoltaic (PV) support, cost, and ease of installation across seven columns. The SoilH2O [13] device monitors temperature, humidity, and soil moisture, while the LoRaWAN Node [36] has expanded sensing capabilities that include light, pressure, and wind speed, in addition to temperature and humidity. The LoRaWAN Node is designed for miniaturization and low power consumption, measuring 85 × 65 × 35 mm3 and offering a battery life of 6 months. In contrast, the Climatic Station [37] prioritizes functionality and reliability but requires a more complex installation and incurs higher costs. LOCOS [38] measures temperature, humidity, and wind but lacks energy-saving features, resulting in the shortest battery life among the compared devices and a cost second only to the Climatic Station. Our proposed sensor node excels in monitoring temperature, humidity, light intensity, and CO2 levels, which are crucial for plant disease prevention and control. Similar to the LoRaWAN Node, our device is compact and affordable, with dimensions of 90 × 90 × 150 mm3 and a cost of about USD 40. Our proposed node stands out in terms of its ease of installation, being portable and designed for standalone deployment without additional accessories. It also features a large battery, PV charging, and optimized energy management, making it highly suitable for practical applications in agriculture environmental monitoring. This comparison highlights the advantages of our device in terms of portability, miniaturization, low power consumption, low cost, and the ability to wirelessly monitor multiple environmental parameters.
The shortcomings of the proposed sensor node are the limited variety of parameter measurements and the energy consumption of measuring CO2. In addition, there is room for improvement in size, robustness, and compactness. Our future research will focus on miniaturization, improving sensing capabilities, and refining power management strategies to enhance performance and usability. Furthermore, while the current 3D-printed polylactic acid shell facilitates rapid prototyping and expedites the production and testing process, we recognize its durability limitations. To overcome this, we plan to use plastic injection molding with high-strength materials in subsequent versions, thereby increasing the sensor’s practicality for real-world agricultural use.

5. Conclusions

In this study, we developed a portable environmental sensor for agricultural applications, addressing key challenges such as power supply, data transmission, and monitoring efficiency, which ensures sustainable energy management and maintains battery levels at around 80% under varying solar conditions. The experiments confirmed the sensor’s robustness, portability, and accuracy in measuring environmental parameters, with performance comparable to established data loggers. The successful integration of advanced power management and precise sensing capabilities makes this sensor a competitive solution for improving smart agriculture practices, particularly in resource-limited or off-grid settings.

Author Contributions

K.L.: Conceptualization, Methodology, Software, Supervision, Writing—original draft, Writing—review and editing, Project administration. Y.C.: Data curation, Methodology, Software, Writing—original draft. R.L.: Methodology, Validation, Writing—original draft, Writing—review and editing. C.L.: Supervision, Writing—review and editing, Validation. Q.Z.: Data curation, Software, Visualization. All authors have read and agreed to the published version of the manuscript.

Funding

This research was supported by Grant 2021J011078 from the Natural Science Foundation of Fujian Province, China, Grant 61601124 from the NSFC, China, and Grant 2023C007 from Ningde Science and Technology Bureau, China.

Data Availability Statement

Data will be made available on request.

Conflicts of Interest

The authors declare no conflicts of interest.

References

  1. Syrový, T.; Vik, R.; Pretl, S.; Syrová, L.; Čengery, J.; Hamáček, A.; Kubáč, L.; Menšík, L. Fully Printed Disposable IoT Soil Moisture Sensors for Precision Agriculture. Chemosensors 2020, 8, 125. [Google Scholar] [CrossRef]
  2. Ullo, L.; Silvia; Sinha, P.G. Advances in IoT and Smart Sensors for Remote Sensing and Agriculture Applications. Remote Sens. 2021, 13, 2585. [Google Scholar] [CrossRef]
  3. Brewster, C.; Roussaki, I.; Kalatzis, N.; Doolin, K.; Ellis, K. IoT in Agriculture: Designing a Europe-Wide Large-Scale Pilot. IEEE Commun. Mag. 2017, 55, 26–33. [Google Scholar] [CrossRef]
  4. Karthikamani, R.; Rajaguru, H. IoT based Smart Irrigation System using Raspberry Pi. In Proceedings of the 2021 Smart Technologies, Communication and Robotics (STCR), Sathyamangalam, India, 9–10 October 2021; pp. 1–3. [Google Scholar]
  5. Doshi, J.; Patel, T.; Bharti, S.k. Smart Farming using IoT, a solution for optimally monitoring farming conditions. Procedia Comput. Sci. 2019, 160, 746–751. [Google Scholar] [CrossRef]
  6. Sinha, B.; Dhanalakshmi, R. Recent advancements and challenges of Internet of Things in smart agriculture: A survey. Future Gener. Comput. Syst. 2021, 126, 169–184. [Google Scholar] [CrossRef]
  7. Deng, Y.; Zhu, C. Design of ZigBee IoT System in Smart Agricultural Greenhouses. Adv. Comput. Signals Syst. 2024, 8, 136–141. [Google Scholar] [CrossRef]
  8. Liu, L.; Jiang, W. Design of vegetable greenhouse monitoring system based on ZigBee and GPRS. In Proceedings of the 2018 4th International Conference on Control, Automation and Robotics (ICCAR), Auckland, New Zealand, 20–23 April 2018; pp. 336–339. [Google Scholar]
  9. Trinh, D.C.; Truvant, T.C.; Bui, T.D. Design of automatic irrigation system for greenhouse based on LoRa technology. In Proceedings of the 2018 International Conference on Advanced Technologies for Communications (ATC), Ho Chi Minh City, Vietnam, 18–20 October; pp. 72–77.
  10. Hao, D.; Qi, L.; Tairab, A.M.; Ahmed, A.; Azam, A.; Luo, D.; Pan, Y.; Zhang, Z.; Yan, J. Solar energy harvesting technologies for PV self-powered applications: A comprehensive review. Renew. Energy 2022, 188, 678–697. [Google Scholar] [CrossRef]
  11. Bouzguenda, M.; Rajamohamed, S.; Shwehdi, M.; Aldalbahi, A. Solar powered smart irrigation system based on low cost wireless network: A senior design project experience. Int. J. Electr. Eng. Educ. 2019, 59, 002072091986041. [Google Scholar] [CrossRef]
  12. Zhu, Y.; Song, J.; Dong, F. Applications of wireless sensor network in the agriculture environment monitoring. Procedia Eng. 2011, 16, 608–614. [Google Scholar] [CrossRef]
  13. Thompson, A.I.; Schomberg, H.H.; Evett, S.R.; Fisher, D.K.; Mirsky, S.B.; Reberg-Horton, S.C. Gateway-node wireless data collection system for environmental sensing. Agrosystems Geosci. Environ. 2021, 4, e20219. [Google Scholar] [CrossRef]
  14. Wang, C.; Li, J.; Yang, Y.; Ye, F. Combining Solar Energy Harvesting with Wireless Charging for Hybrid Wireless Sensor Networks. IEEE Trans. Mob. Comput. 2018, 17, 560–576. [Google Scholar] [CrossRef]
  15. Galmés, S.; Escolar, S. Analytical Model for the Duty Cycle in Solar-Based EH-WSN for Environmental Monitoring. Sensors 2018, 18, 2499. [Google Scholar] [CrossRef] [PubMed]
  16. Fang, W.; Mukherjee, M.; Shu, L.; Zhou, Z.; Hancke, G. Energy utilization concerned sleep scheduling in Wireless Powered Communication Networks. In Proceedings of the 2017 IEEE International Conference on Communications Workshops (ICC Workshops), Paris, France, 21–25 May 2017; pp. 558–563. [Google Scholar]
  17. Chien, L.; Drieberg, M.; Sebastian, P.; Hai, l. A simple solar energy harvester for wireless sensor networks. In Proceedings of the 2016 6th International Conference on Intelligent and Advanced Systems (ICIAS), Kuala Lumpur, Malaysia, 15–17 August 2016; pp. 1–6. [Google Scholar]
  18. Davcev, D.; Mitreski, K.; Trajkovic, S.; Nikolovski, V.; Koteli, N. IoT agriculture system based on LoRaWAN. In Proceedings of the 2018 14th IEEE International Workshop on Factory Communication Systems (WFCS), Imperia, Italy, 13–15 June 2018; pp. 1–4. [Google Scholar]
  19. Gsangaya, K.R.; Hajjaj, S.S.H.; Sultan, M.T.H.; Hua, L.S. Portable, wireless, and effective internet of things-based sensors for precision agriculture. Int. J. Environ. Sci. Technol. 2020, 17, 3901–3916. [Google Scholar] [CrossRef]
  20. Bazinet, Q.; Tang, L.; Bede, J.A.-O. Impact of Future Elevated Carbon Dioxide on C(3) Plant Resistance to Biotic Stresses. Mol. Plant-Microbe Interact. 2022, 35, 527–539. [Google Scholar] [CrossRef]
  21. Anderson, R.; Bayer, P.E.; Edwards, D. Climate change and the need for agricultural adaptation. Curr. Opin. Plant Biol. 2020, 56, 197–202. [Google Scholar] [CrossRef]
  22. Raymundo, R.; Asseng, S.; Robertson, R.; Petsakos, A.; Hoogenboom, G.; Quiroz, R.; Hareau, G.; Wolf, J. Climate change impact on global potato production. Eur. J. Agron. 2018, 100, 87–98. [Google Scholar] [CrossRef]
  23. Lee, Y.-H.; Sang, W.-G.; Baek, J.-K.; Kim, J.-H.; Shin, P.; Seo, M.-C.; Cho, J.-I. The effect of concurrent elevation in CO2 and temperature on the growth, photosynthesis, and yield of potato crops. PLoS ONE 2020, 15, e0241081. [Google Scholar] [CrossRef] [PubMed]
  24. Motahhir, S.; El Hammoumi, A.; El Ghzizal, A. The most used MPPT algorithms: Review and the suitable low-cost embedded board for each algorithm. J. Clean. Prod. 2020, 246, 118983. [Google Scholar] [CrossRef]
  25. Siddique, M.A.B.; Zhao, D.; Rehman, A.U.; Ouahada, K.; Hamam, H. Author Correction: An adapted model predictive control MPPT for validation of optimum GMPP tracking under partial shading conditions. Sci. Rep. 2024, 14, 11107. [Google Scholar] [CrossRef] [PubMed]
  26. Sensirion SHT30. Available online: https://mm.digikey.com/Volume0/opasdata/d220001/medias/docus/1067/HT_DS_SHT3x_DIS.pdf (accessed on 12 August 2023).
  27. ROHM BH1750. Available online: https://mm.digikey.com/Volume0/opasdata/d220001/medias/docus/6165/bh1750fvi-e.pdf (accessed on 12 August 2023).
  28. SenseAir S8. Available online: https://senseair.com/product/s8 (accessed on 12 August 2023).
  29. Bhargav, A.; Basiri, M.M. Guarded Low Power Hardware Implementations. In Proceedings of the 2023 IEEE 7th Conference on Information and Communication Technology (CICT), Jabalpur, India, 15–17 December 2023; pp. 1–5. [Google Scholar]
  30. Yazicioglu, R.; Torfs, T.; Penders, J.; Romero, I.; Kim, H.; Merken, P.; Gyselinckx, B.; Yoo, H.J.; Van Hoof, C. Ultra-low-power wearable biopotential sensor nodes. In Proceedings of the 2009 Annual International Conference of the IEEE Engineering in Medicine and Biology Society, Minneapolis, MN, USA, 3–6 September 2009; pp. 3205–3208. [Google Scholar] [CrossRef]
  31. Guo, L.; Hu, C.; Li, G. The SOC estimation of battery based on the method of improved Ampere-hour and Kalman filter. In Proceedings of the 2015 IEEE 10th Conference on Industrial Electronics and Applications (ICIEA), Auckland, New Zealand, 15–17 June 2015; pp. 1458–1460. [Google Scholar]
  32. Xing, J.; Wu, P. State of Charge Estimation of Lithium-Ion Battery Based on Improved Adaptive Unscented Kalman Filter. Sustainability 2021, 13, 5046. [Google Scholar] [CrossRef]
  33. Maka, A.O.M.; O’Donovan, T.S. Effect of thermal load on performance parameters of solar concentrating photovoltaic: High-efficiency solar cells. Energy Built Environ. 2022, 3, 201–209. [Google Scholar] [CrossRef]
  34. Li, Y.; Guo, J.; Pedersen, K.; Gurevich, L.; Stroe, D.-I. Recent Health Diagnosis Methods for Lithium-Ion Batteries. Batteries 2022, 8, 72. [Google Scholar] [CrossRef]
  35. The Weather Channel. Available online: http://www.weather.com.cn/weather1d/101230112.shtml#search (accessed on 12 August 2023).
  36. Valente, A.; Silva, S.; Duarte, D.; Cabral Pinto, F.; Soares, S. Low-Cost LoRaWAN Node for Agro-Intelligence IoT. Electronics 2020, 9, 987. [Google Scholar] [CrossRef]
  37. Botero-Valencia, J.S.; Mejia-Herrera, M.; Pearce, J.M. Low cost climate station for smart agriculture applications with photovoltaic energy and wireless communication. HardwareX 2022, 11, e00296. [Google Scholar] [CrossRef] [PubMed]
  38. McCauley, D.M.; Nackley, L.L.; Kelley, J. Demonstration of a low-cost and open-source platform for on-farm monitoring and decision support. Comput. Electron. Agric. 2021, 187, 106284. [Google Scholar] [CrossRef]
Figure 1. Overall framework diagram of the proposed agriculture environmental sensor.
Electronics 13 02606 g001
Figure 2. Schematic of MPPT photovoltaic power supply module.
Electronics 13 02606 g002
Figure 3. Flowchart of dynamic active–sleep scheme for optimal energy management.
Electronics 13 02606 g003
Figure 4. The schematic of the discrete PID algorithm used for estimating the sleep time interval.
Electronics 13 02606 g004
Figure 5. Prototype sensor node printed circuit board.
Electronics 13 02606 g005
Figure 6. The proposed prototype sensor node and its deployment method.
Electronics 13 02606 g006
Figure 7. The experimental results of testing the TPS62125-based photovoltaic power supply circuit under the condition of full sunlight. (a) The recorded input voltage (Vin) and current (Iin); (b) the recorded output voltage (Vout) and current (Iout); (c) the input power (Pin), output power (Pout), and the conversion efficiency (E) of the MPPT circuit.
Electronics 13 02606 g007
Figure 8. The experimental results of dynamic active–sleep scheme evaluation. (a) Average irradiance from Fuzhou Weather Bureau. (b) Output sleep time interval of the proposed algorithm. (c) Setting SoC and estimated practical SoC of the battery.
Electronics 13 02606 g008
Figure 9. Outdoor deployment experimental environment.
Electronics 13 02606 g009
Figure 10. Comparison of environmental parameter records between the proposed sensor node, CR800, and weather forecast report [35]. (ad) are the comparison results corresponding to light, CO2, temperature, and humidity, respectively.
Electronics 13 02606 g010
Figure 11. Remote environmental parameters monitoring demo examples.
Electronics 13 02606 g011
Table 1. Power consumption of the prototype sensor node (mW).
ModuleFunctionSleepActive
MCUControlling2.5101.3
S8 CO20133.6
SHT30Temperature and Humidity 02.1
BH1750Light intensity01.5
SD Card and BC35-GStorage and Communication0226.5
Total2.5465
Table 2. The light intensity and MPPT circuit testing results.
TimeLight Intensity
(Lux)
InputOutputPout/Pin
(mW)
Efficiency (%)
Vin (V)Iin (mA)Vout (V)Iout (mA)
6:0026955.9 0.0 0.00.0 --
7:0060536.5 26.2 5.0 30.4 153.1/169.7 90.2
8:0010,4587.1 25.9 5.0 32.8 164.8/182.790.2
9:0014,6507.5 25.8 5.0 35.4 178.2/194.591.6
10:0025,2718.0 25.8 5.0 37.3 187.8/205.191.5
11:0041,2568.5 25.5 5.0 39.8 200.7/217.392.3
12:0048,6528.7 25.4 5.0 40.6 204.4/220.692.7
13:0054,6129.0 25.4 5.0 42.4 213.6/227.493.9
14:0050,1698.7 25.4 5.0 40.6 204.4/221.792.2
15:0037,6818.3 25.8 5.0 38.8 195.5/214.791.0
16:0013,0567.3 25.9 5.0 34.2 172.3/189.391.0
17:0072656.7 26.3 5.0 31.5 158.3/175.690.2
18:0020735.8 0.0 0.00.0 --
Average *-8.9 25.8 5.0 36.7 184.8/201.791.6
Std *-0.80.30.03.919.7/19.30.1
* indicates that the results are based on data when the MPPT circuit is operating.
Table 3. Comparison of environmental monitoring devices.
DeviceSensor Types Size
(mm3)
Battery Life *PVCost
(USD)
Easy to Install
SoilH2O [13]SW, ST, T, H-20 daysNo~100
Low-Cost LoRaWAN Node [36]T, H, I, P, W85 × 65 ×356 monthsYes~50☺☺
Climatic Station [37]T, H, I, P, W-30 hYes~565
LOCOS [38]T, H, W-6 daysYes~144☺☺
ProposedT, H, I, CO290 × 90 × 150~2 monthsYes~40☺☺☺
SW: Soil water; ST: Soil surface temperature; T: Temperature; H: Humidity; I: Light; P: Pressure; W: Wind speed; “-’’ indicates no report; and “*’’ indicates use of internal battery only. The proposed node is tested under the condition of 2 s active and 30 s sleep.
Disclaimer/Publisher’s Note: The statements, opinions and data contained in all publications are solely those of the individual author(s) and contributor(s) and not of MDPI and/or the editor(s). MDPI and/or the editor(s) disclaim responsibility for any injury to people or property resulting from any ideas, methods, instructions or products referred to in the content.

