Article

Prediction of Health Status of Small-Tailed Cold Sheep Based on Improved BP Neural Network

1
College of Electronic Information Engineering, Inner Mongolia University, Hohhot 010021, China
2
Three Gorges Onshore New Energy Investment Co., Ltd., Hohhot 010021, China
3
State Key Laboratory of Reproductive Regulation and Breeding of Grassland Livestock, Hohhot 010021, China
*
Author to whom correspondence should be addressed.
Electronics 2024, 13(13), 2602; https://doi.org/10.3390/electronics13132602
Submission received: 19 April 2024 / Revised: 14 May 2024 / Accepted: 26 June 2024 / Published: 2 July 2024

Abstract

:
According to related research, different body temperatures, heart rates, and locomotor behaviors of small-tailed cold goats can represent the physical condition of the goats themselves and are used as direct evidence for evaluating the physical health status of small-tailed cold goats. In this paper, we designed and tested a system for predicting the health status of small-tailed cold sheep based on wearable information monitoring technology. To test the system, sheep wearable devices were worn on 36 small-tailed cold sheep of different ages and inconsistent health conditions at different time points from May to October. A SLBAS-BP neural network model for predicting the health condition of small-tailed cold sheep was established using the collected and processed data, which overcame the problem that the traditional gradient descent method in the BP neural network is prone to fall into local optimization leading to insufficient prediction ability. The correct prediction rates of the improved BP neural network for the four health conditions of healthy, sub-healthy, fever, and disease were 98.4%, 94.5%, 90.4%, and 98.7%, respectively, and the average correct prediction rate of the four conditions was 5.8% higher than that before the improvement, reaching 95.2%.

1. Introduction

Small-tailed cold sheep occupy a major position in the livestock breeding structure of the Inner Mongolia Autonomous Region, and its advantages of fast growth, adaptability, and reproduction ability have made it listed as an excellent livestock breed by the state. Small-tailed cold sheep breeding profit is closely related to its health condition, and physiological signs (body temperature, heart rate) and changes in locomotor behavior (lying down, standing, walking, and running) can effectively reflect the health condition of small-tailed cold sheep. In the traditional small-tailed cold sheep breeding process, a veterinary thermometer is manually used to measure the body temperature in the rectum of the small-tailed cold sheep, the heart rate is measured by palpating the arteries on the inner side of the femur of the sheep by hand, and the observation of the locomotor behaviors is done by manual observation. This measurement method is not only inefficient and labor intensive, but also easily causes cross-infection during the measurement process, which can easily lead to the high incidence of various types of epidemics, seriously affecting the healthy development of the small-tailed frigid sheep breeding industry. In recent years, with China’s strong support for animal husbandry in Inner Mongolia, the need to realize the automation, scientification, and informatization of the farming industry has become increasingly urgent. In China, wearable information intelligent monitoring methods accelerate the development of this intelligent technology has become a trend; if it is applied to small-tailed chilly sheep farming, it will help to solve the problem of backwardness of small-tailed chilly sheep farming technology in the autonomous region.
In recent years, With the continuous forward development of sensor technology and data analysis methods, domestic and foreign scholars have studied the monitoring of animal physiological information and behavioral information [1] more and more extensively. researchers at home and abroad have applied wearable monitoring technology based on sensing devices [2] to the process of animal breeding [3] to monitor physiological indicators such as body temperature [4], heart rate [5], respiratory rate [6] and behavioral information such as behavioral habits [7,8] and activity trajectory [9], and to judge the estrus, delivery, and physical condition of animals based on this information so as to provide the animal husbandry industry with scientific and accurate monitoring results and management recommendations. There are various wearable monitoring methods for animals, including ear tag type, strap type [10], implant type [11], and collar type [12]. The ear tag type monitoring method is to install the sensor and battery on the ear tag and transmit the data through wireless communication, which is suitable for large animals, such as cows, horses, and so on. Foreign scholars Tsenkov [13] and others developed a miniaturized ear tag device to monitor the movement and posture of animals by recording sensor data such as accelerometers and gyroscopes. Bundled monitoring is conducted by mounting the sensors and batteries on the animal’s body and securing them to the animal’s body surface through straps and other means. In 2003, Nagl [14] designed a wearable sensor system for wireless health status determination in cattle in order to improve the ability to cope with and predict disease episodes and other epidemiological spreads during cattle farming. In 2005, McCauley [15] et al. used WSN to monitor the location, activity level, body temperature, and air quality of the environment in which the pigs were housed and could provide more accurate and detailed data. In the same year, Fahey [16] et al. used acoustic radiation force pulse imaging for real-time monitoring of radiofrequency ablation of sheep myocardium, which is a convenient way to monitor the formation of lesions in the body of sheep. In 2006, Smith [17] developed an integrated herd health monitoring system, which consists of multiple sensors that can be used to monitor herd behavior, dietary intake, body weight, body temperature and heart rate, and other physiological parameters. The system sends timely alerts to the user in case of any abnormalities in the herd to facilitate rapid intervention and treatment. In 2007, Venkatraman [18] described a method for monitoring animal behavior using wireless inertial sensors. This system allows real-time monitoring of the animal’s locomotion, posture and activity level by recording data such as acceleration, angular velocity and change in direction. In 2010, Majerus [19] described a miniature wireless pressure sensing system applied to mice, this system successfully monitored the pressure changes in the bladder of mice. In 2014, RitaBrugarolas [20] mounted PPG and ECG sensors on a chest strap, which was strapped to a dog in order to measure its ECG signal that served the purpose of monitoring the dog’s vital signs (heart rate, heart rate variability, and respiratory rate). In 2019, Taneja [21] et al. proposed an end-to-end IoT application based on a wearable lameness detection device for cattle in order to help farms improve their profitability. In 2022, literature [22] introduced a mouse behavior recognition system based on wireless AI and IoT technologies, which can monitor the information of mice in terms of trajectory, posture, speed, and intensity of activity, and upload these data to the cloud for processing, which can ultimately lead to the automatic categorization of different behaviors of mice, such as exploring, walking, and running. These monitoring modalities allow real-time monitoring and recording of animal behavior, health, and physiological indicators in different scenarios, providing data support and management tools for animal research and animal husbandry.
With the continuous development of smart animal husbandry, researchers have gradually increased the number of methods for analyzing and modeling physiological [23] and behavioral [24] data of animals. These models can be used to assess the health level of animals, as well as for animal protection and management, among others. Figure 1 shows a typical flowchart of animal activity recognition based on wearable sensors and deep learning methods. Certain literature [25] proposed a novel model for predicting carbon dioxide concentration in swine barns, which analyzes and predicts the environmental parameters of the barn and the physiological indicators of pigs through deep learning algorithms. Certain literature [26] introduced a data mining method using infrared spectra and animal characterization data in milk to improve the accuracy of cow weight prediction. Certain literature [27] established five dairy cow feed intake prediction models based on linear regression model (LRM), artificial neural network model, support vector machine model, k-nearest neighbor model, and chi-square automated interaction detector model for the prediction of cow estrus and health status. Certain literature [28] established a generalized neural network (GRNN) prediction model based on environmental and physiological parameters and a comfort and health evaluation prediction model based on a back-propagation neural network (BPNN) for the uncertainty of the transportation environment during the transportation of live meat sheep based on the continuous and real-time environmental and physiological parameter data obtained from the transportation monitoring experiment.
This research mainly solves a series of problems caused by the backwardness of small-tailed cold sheep breeding technology and applies wearable information monitoring technology and BP neural network to small-tailed cold sheep breeding, and the specific research content is shown in Figure 2.
(1) Aiming at the deficiencies in the traditional methods of monitoring physiological data (body temperature and heart rate) and behavioral data (lying, standing, walking, and running) of small-tailed cold sheep, a portable, intelligent and high-precision wearable continuous data acquisition device for small-tailed cold sheep was specially designed, and equipment testing experiments were conducted. The device testing experiments were aimed at verifying the device performance and obtaining continuous real-time data of physiological and behavioral parameters during the breeding process.
(2) Research on the prediction model of health condition of small-tailed cold sheep based on BP neural network. Aiming at the problem of poor prediction effect of BP neural network using the traditional gradient descent method, an improved social-learning beetle antennae search algorithm is designed to optimize the initial weights and thresholds of BP neural network. Through the fusion of the two algorithms, a prediction model of the health effects of physiological and behavioral changes of sheep can be established, which can provide the relevant practitioners with a basis for sheep welfare management and decision-making.
The thesis is organized as follows: Section 1 introduces the background and significance of the study and introduces the research content; Section 2 introduces the hardware and software design of the wearable data acquisition device; Section 3 introduces the principles of the health prediction model based on BP neural network and the improved SLBAS-BP algorithm, respectively; Section 4 carries out the analysis and discussion of the results; and Section 5 leads to the conclusion.

2. Materials and Methods

2.1. General Description of the Wearable Multi-Sensor System

Based on GPRS communication technology, real-time monitoring, storage and analysis of body temperature, heart rate and behavior of small-tailed cold sheep are realized by using wearable hardware acquisition device and cloud-based real-time control platform. The overall scheme design of the wearable data acquisition device for small-tailed cold sheep is shown in Figure 3, which is divided into three major parts: the design of the wearable device for sheep, the hardware acquisition circuit and the cloud platform remote monitoring center.
The wearable data acquisition device for small-tailed cold sheep needs to be able to work normally under an environment of −20 °C to 50 °C. Since the acquisition device needs to be worn on the body of small-tailed cold sheep, its influence on the normal physiological activities of small-tailed cold sheep must be taken into consideration as well. Therefore, in the design of a wearable data acquisition device for small-tailed cold sheep, it is necessary to take into account its economy, comfort, low power consumption, crashproof, and waterproof factors. In summary, this paper adopts the relevant sensors to collect the body temperature, heart rate, and behavioral data of the small-tailed cold sheep and uses the wireless transmission method to transmit the data, so as not to restrict the activities of the small-tailed cold sheep. In addition, the microcontroller and each sensor module are integrated into a protective device (closed locket), which is then built-in and fixed in the wearable device, so as to achieve the purpose of anti-collision and waterproofing. After the data are transferred to the cloud, the body temperature, heart rate, and movement behavior data of each experimental small-tailed cold sheep are stored in chronological order. Farmers only need to log in to the cloud platform on their PC to access the monitoring page of the physiological data (body temperature and heart rate) and behavioral data (lying down, standing up, walking, and running) of the small-tailed cold sheep, where they can see the body temperature data of the small-tailed cold sheep of different numbers in each time period, heart rate simulation voltage data, and behavioral category data, providing data basis for the formulation of subsequent healthy breeding measures.

2.2. Hardware Design

2.2.1. Wearable Device Design

In this paper, a wearable collection device for small-tailed cold sheep was hand-designed based on the requirements of small-tailed cold sheep body size, as shown in Figure 4.
Firstly, the collection device is put on the body of the little-tailed cold sheep, and each data collection node corresponds to the measured part for data collection. Then, the central processor and the wireless network node upload the collected data to the cloud platform through the MQTT protocol by means of serial communication and finally store the collected data on the cloud platform in chronological order and by sheep number for follow-up. Then, the central processor and the wireless network node upload the collected data via MQTT protocol through serial communication to the cloud platform, and finally, the collected data are stored on the cloud platform in chronological order and sheep number for subsequent pre-processing of the data. Finally, the collected data are stored on the cloud platform in chronological order and sheep number for subsequent pre-processing and establishing a prediction model of the health status of the small-tailed cold sheep based on the processed data.

2.2.2. Critical Node Design

The wearable device designed in this paper consists of several key nodes, and the respective installation positions are designed according to the different sensors to reduce some of the factors that may cause measurement errors during the measurement process.
(1) Body temperature node. This design selects the non-contact type MLX90614 infrared temperature measurement sensor with digital signal output. Its physical diagram is shown in Figure 5a. Due to the small-tailed cold sheep being in a complex environment, their own hair is relatively thick, which may have an impact on the measured temperature. Through repeated experiments in various parts of the body of the lamb, the sensor was finally selected to be installed in the armpit of the hind limb, where the hair is sparse and private so as to avoid the interference of the hair and be the closest to the real body temperature.
(2) Heart rate node. AD8232 can maximize the weak noise and filter it out when acquiring heart rate signals accompanied by noise, and its physical diagram is shown in Figure 5b. In this paper, the pressurized single-stage limb lead in the commonly used measurement method of ECG signals was used to measure the ECG signals of the small-tailed cold sheep, and the red electrode of the AD8232 sensor was attached to the junction of the sheep’s inner left forelimb and trunk, the yellow electrode was attached to the junction of the sheep’s inner right forelimb and trunk, and the green electrode was attached to the junction of the inner left hindlimb and trunk, respectively.
(3) Behavior node. In this paper, the ADXL345 three-axis acceleration sensor is used to monitor the movement behavior of the small-tailed cold sheep, and the ADXL345 sensor is shown in Figure 6a. The collection device is fixed at the junction of the root of the hind limb and the torso of the small-tailed cold sheep, and the movement, drinking, and feeding behaviors of the small-tailed cold sheep will only lead to a small offset of the collection device so that the accuracy of the collected data is higher.
(4) Transmission node. This design finally decided to choose the low-power, ultra-small size, and high-performance YED GPRS wireless communication module YED-C724 core board to realize the data transmission, which is shown in Figure 6b. This module supports DTU transmitting firmware: first, we added the target transmission device and set its corresponding parameters, then we configured the server and built the MQTT server through the AliCloud platform, and then the DTU platform accessed the web console of the MQTT server through the MQTT communication protocol to realize the transmitting function.

2.3. Cloud-Based Data Processing and Monitoring

(1) Web. After the data were transferred to the cloud, the body temperature, heart rate, and exercise behavior data of each experimental small-tailed cold sheep were stored in chronological order, and the breeders only needed to log in to the cloud platform with their own accounts on the PC to view the specific temperature data, heart rate data, and behavior data of each small-tailed cold sheep, and the login entrance is shown in Figure 7.
(2) Home page. The home page has a simple navigation bar for navigating the web application through the registration and login buttons. It introduces the product to the visitor. It provides basic information about all the features of the product. The “Health Waring Platform for small-tailed cold sheep” will provide information on how to use the product and any precautions to be taken to avoid any damage. It will provide the option to contact the development team if the user has any questions.
(3) Functional interface. The user dashboard interface has a side drawer for navigation. The home page displays the user’s profile picture, username, and email. It provides aggregate data on healthy and sick sheep as well as active or offline devices. All the sheep tracked by the project are contained in a table with their ID, temperature, heart rate, and behavioral status, as shown in Figure 8 and Figure 9. The user can click on any entry in the table to view the health data and analytics for that sheep.

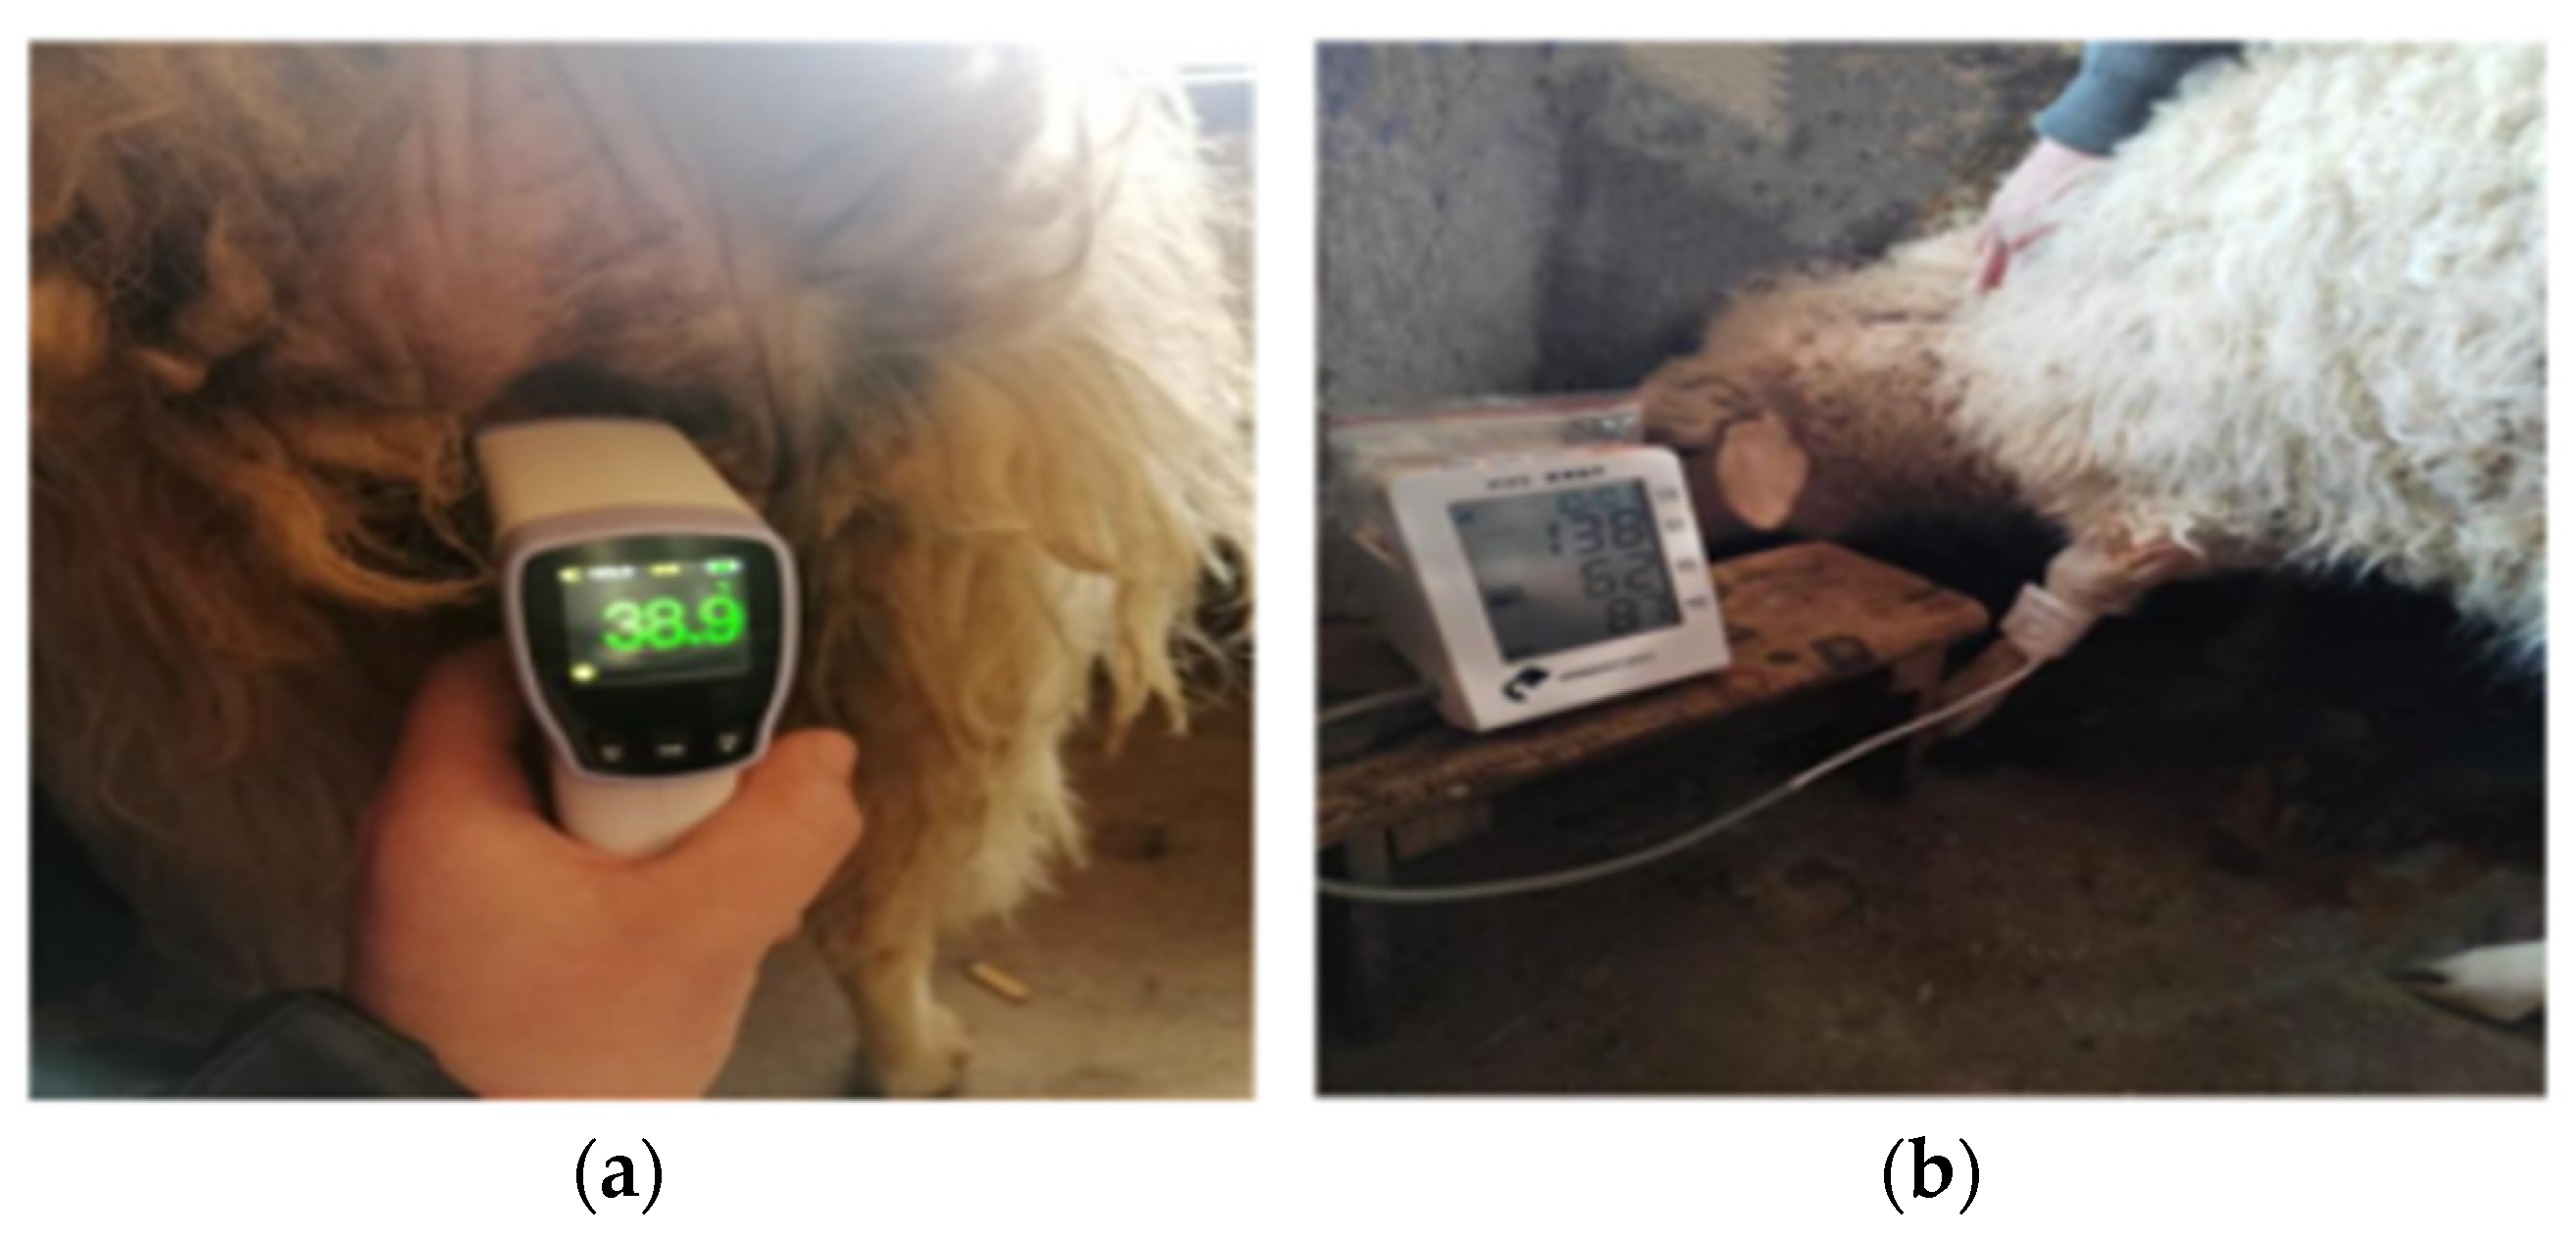
2.4. Experimental Environment and Objects

The experiment was conducted from May 2021 to October 2022 at the house of a farmer in Harbquan Village, Huangyang Township, Chahar Right Wing Middle Banner, Ulanqab City, Inner Mongolia Autonomous Region, where the latitude and longitude of the site were E: 117.447781, W: −117.447781, S: −40.945442, N: 40.945442.
Eighteen rams and ewes of small-tailed cold sheep that were 1–12 months old and 12 months old and above were selected for the experiment, and their physical conditions were inconsistent, some were healthy and some were sick, but their feeding conditions (ambient temperature, feed, and drinking water) were the same. They were given wearable data acquisition devices designed in Section 2.2 to collect their body temperature, heart rate, and behavioral data. At the same time of body temperature and heart rate data collection, the body temperature and heart rate data of the small-tailed cold sheep were synchronously calibrated using the Xinjing brand veterinary thermometer gun imported from Germany, which has an accuracy error of 0.05 °C, and the medical-grade Jing health brand veterinary heart rate meter, and the calibration experiment diagram is shown in Figure 10. Then, the collected behavioral acceleration data were combined with the video of the daily activities of the small-tailed cold sheep filmed, as shown in Figure 11, to find out what the acceleration signals corresponded to at each time point and to find out how the acceleration signals of the small-tailed cold sheep were measured. The point of the acceleration signal corresponds to the behavioral performance so as to classify and identify the locomotor behavior of the small-tailed cold sheep.

3. Model for Predicting the Health Status of Small-Tailed Cold Sheep

3.1. Description of Factors Influencing the Health Status of Small-Tailed Cold Sheep

The physical health status of small-tailed cold sheep can be reflected laterally by their body temperature, heart rate, and locomotor behaviors, so 31,910 physiological data (body temperature and heart rate) and 31,910 behavioral data (lying down, standing, walking, and running) of small-tailed cold sheep of different months of age and different genders, which were processed in the previous chapter, were used as the BP neural network-based prediction model for small-tailed cold sheep in this chapter. Input data: the specific effects of the health status of the small-tailed cold sheep are described in Table 1.

3.2. BP Neural Network Prediction Modeling

The BP neural network model is simple and well-established in terms of network performance and theory, so it is often used in various prediction models. The BP neural network model topology consists of three layers, which are the input layer, the implicit layer, and the output layer. The main feature of this network is that the signals propagate in the forward direction, and the errors propagate in the backward direction; this is the learning process of the BP neural network. Nonlinear mapping is an important ability of the BP neural network, which can make the mapping relationship between the mapping does not need to be represented by mathematical equations, a large number of input-output pairs can be stored and learned in the BP neural network, as long as the BP neural network is provided with enough samples for training and learning, it is capable of completely describing the nonlinear transformation of the input space to the output space. A typical BP neural network structure is shown in Figure 12.
In the BP neural network, the number of neurons in the input layer is the dimension of the input sample data, i.e., the number of attributes of the sample; the number of neurons in the output layer is the number of predicted nodes, i.e., the number of labels in the output; a single hidden layer is used, and the number of neurons in the hidden layer is obtained from the range based on the algorithm, which is then determined by comparing the convergence errors of the networks with different numbers of neurons.
Where φ is the excitation function of the hidden layer; ψ is the excitation function of the output layer; X n is the nth input neuron; Y m is the mth output neuron; and W i j and W j k are the weights from the input node i to the node j of the hidden layer and from the node j of the hidden layer to the output node k, respectively, in the BP neural network.
Before the BP neural network is trained, the weight threshold of the network is randomly initialized to start the forward propagation phase. In the forward propagation process, each neuron in the input layer receives the information that needs to be processed and transmits it to the hidden layer, and each neuron in the hidden layer is responsible for processing the information and transmits the processed information to the output layer, which outputs the processing results to the outside world; the error between the output value and the actual value is calculated, and if the error does not meet the accuracy requirements, then it enters the error back-propagation stage. In the error back-propagation stage, the gradient descent method is utilized to continuously correct the weights and thresholds of the connection of each layer, and the process of transferring the error from the output layer back to the implicit layer and the output layer. The process is repeated until the number of BP neural network training reaches the preset maximum number of iterations or the error of the output is reduced to the target.

3.2.1. Input Data Variable Representation

In this paper, locomotor behavior, season, age in months, sex, body temperature, and heart rate were used as input data for the prediction model, and the health status of the small-tailed cold sheep (healthy, sub-healthy, fever, and disease) was used as output variables for the prediction model.
First of all, the sample set needs to be selected; in order to facilitate the model building and validation, the sample set of this paper is selected as 31,910 data from the processed collection data, 70% (22,337 data) of which are selected to train the health status prediction model of the small-tailed cold sheep, and the remaining 30% (9573 data) of which are selected to test the health status prediction model of the small-tailed cold sheep, and part of the dataset is shown in Figure 13.
Secondly, the input data can be represented by numerical and linguistic variables in which the age of the month, body temperature, and heart rate can be represented by exact numerical values, while motor behavior, season, and gender are linguistic variables. In order for the BP neural network to recognize the processing, it is necessary to represent the motor behaviors, seasons, and genders in the input with specific numerical variables. The specific representation is to use “1”, “2”, “3”, and “4” for the four motor behaviors of lying down, standing, walking, and running, respectively, and “1”, “2”, “3”, and “4” for spring and winter. The four seasons of spring, summer, fall, and winter are represented by “1”, “2”, “3”, and “4”, respectively. The two sexes of rams and ewes are represented by the values “1” and “2”, respectively. For example, if a 12-month-old walking ewe with a body temperature of 38.2 °C and a heart rate of 89 beats/min was collected in summer, the corresponding input vector would be (2, 12, 3, 38.2, 89, 2).
Finally, the output variable is the health status level of the ewes, and the health status of the ewes is represented by the values “1”, “2”, “3”, and “4”; the larger the value, the worse the health status and the smaller the value, the better the health status. For example, “1” means healthy, “2” means sub-healthy, “3” means fever, and “4” means disease.

3.2.2. Selection of BP Neural Network Parameters

(1)
Function Selection
In the modeling process of BP neural networks, there are four common types of functions: transfer function, training function, learning function, and performance function. A suitable combination of functions can optimize the neural network, thus improving the performance and generalization ability of the neural network. Therefore, before building the model, this section is to experimentally select the appropriate function combination. The experimental equipment as well as the experimental environment are shown in Table 2.
Before the function combination, the first step is to set each parameter of the BP neural network prediction model. In this paper, 1 × 10⁻⁵ is set as the minimum performance gradient, the mean square error (MSE) is selected as the network performance function, the minimum error of the training objective is set to 0.0001, the training time is unlimited, the number of training times is set to 15,000, the maximum number of failures is 20, and the output layer transfer function is selected as the purelin function.
A total of 22,337 samples (70% of the collected data) were used as training data, and 48 different function combinations were verified, including the combination characteristics of 12 training functions, 2 learning functions, and 2 hidden layer transfer functions. Meanwhile, the convergence step size and mean square error (MSE) of different function combinations are compared, and the specific experimental results are detailed in Table 3.
According to the experimental results, the training function has the greatest impact on the learning rate of the model, while the transfer function and the learning function have a relatively small impact. In this experiment, when using the trainlm training function, the minimum error of the model is 0.058, and the convergence steps are all below 15. Meanwhile, when the trainlm training function, the learnngdm learning function, and the logsig hidden layer transfer function are used together, the model reaches the minimum error of 0.058 at step 7. In this paper, by considering the step length of reaching the minimum error and the minimum error, we can determine the trainlm training function, the learnngdm learning function, and the logsig hidden layer transfer function as the optimal function combination. transfer function as the best function combination.
(2)
Selection of the number of neurons
Usually there is not a fixed formula to determine the number of neurons, but you can use the empirical formula to calculate the number of neurons; the formula is as follows:
m = n + s + α
m = log 2 n
m = n s
A common method is to use the trial-and-error method to determine the number of neurons in the hidden layer. Firstly, according to the Formula (3), where the number of input layers n is 6 and the number of output layers s is 4, the number of neurons in the hidden layer m is restricted to a natural number α between 1 and 10, which provides the number of neurons that should be in the range of 3 to 13. In order to determine the most suitable number of neurons, experiments can be performed one by one in this range by the trial-and-error method and evaluated according to the error of the training results. In order to analyze and compare the performance with different number of neurons even further, a programming simulation can be performed using the Matlab 2022. The simulation results can be compared and analyzed by obtaining the minimum error and training time under different number of neurons. The comparison results obtained are shown in Figure 14 and Table 4 for a more visual comparison of the performance under different number of neurons.
From the results in Figure 14 and Table 4, it is obvious that there is a non-linear relationship between the training error value and the number of neurons. After many training sessions, the value of the training error is minimized when the number of neurons is 10; therefore, in this paper, 10 is determined as the number of neurons in the hidden layer.
(3)
Step size selection
In the BP neural network modeling and training process, the step size is also an important parameter, which determines the amount of change in each update of the weight coefficients. In this paper, we use the tool Matlab to carry out programming simulation, which can get the change rule of the mean square error of each step with the training step length, so as to determine the appropriate step length. The final simulation results are shown in Figure 15 and Table 5; from the trend of the mean square error in the figure and the values of the mean square error in the table, it can be seen that when the training step length to 273 steps, the decreasing trend of the mean square error gradually tends to stabilize; therefore, this paper selects 273 as the training step length.

3.3. Improved BP Neural Network-Based Modeling of Health Status of Small-Tailed Cold Sheep

In the previous section, the traditional gradient descent method of BP neural network was used to predict the health status of small-tailed cold sheep, and it was found that the initial weights and thresholds in the BP neural network were randomly initialized, which caused the BP algorithm to converge to the local optimal solution but not to the global optimal solution. Therefore, in order to address this deficiency, this chapter designs an improved socially learned aspen swarm search algorithm to optimize the weights and thresholds of the BP neural network and to improve its optimality seeking ability.

3.3.1. Beetle Antennae Search Algorithm

When feeding or searching for a mate, the beetle swing each tentacle on one side of their body to absorb odors and gain information. In other words, the beetle use both tentacles to randomly explore a nearby area. When the tentacle on one side detects a higher concentration of odor, the beetle will turn in the direction of that side; otherwise, it will turn to the other side. These two factors allow most tenrecs to successfully hunt for food or find mates, which inspired the tenrec whisker search algorithm. Table 6 shows the detailed flow of the BAS algorithm.
First, the random search direction of b is as follows:
b = r a n d s ( K , 1 ) r a n d s ( K , 1 ) 2
where rand() denotes the function that produces a K-dimensional column vector, and K is the dimension of the search space.
Let the dimension of the solution space be D and the location of the individual aspens be X = (x1, x2, x3, …, xD).
Create the left and right whisker space coordinates of the beetle as follows:
x l = x t + d 0 · b x r = x t d 0 · b
where t is the number of cycles of the algorithm, d is the spacing between the center of mass of the beetle and its tentacles, and b represents the orientation of the beetle, with the right whisker pointing to the left whisker being its orientation.
To update the next position of the beetle,
x t + 1 = x t δ t · s i g n f x l f x r
s i g n x = 1 , x > 0 0 , x = 0 1 , x < 0
where f ( x ) is the fitness value of x; δ t represents the search step length of the t cycle of the beetle; and sign(x) is the sign function. When f x l > f x r , then the tenebrion advances along the left side where the tentacles are located by s-steps and vice versa along the right side.
  • Adjustment of running parameters
In the BAS algorithm, the step length and the distance from the tentacle to the center of mass are not fixed; they have a linear relationship, which can be determined by Equation (8):
s t + 1 = α * s t
In the formula, the step factor is represented by α , which is generally set to 0.95, and it determines the magnitude of the parameter vector update in each iteration. If the value chosen is too small, the convergence speed will be slow; if the value chosen is too large, it may lead to the algorithm failing to converge or jumping out of the optimal solution, so it is adjusted according to the specific situation.
As shown in Figure 16. The five basic steps of the beetle antennae search algorithm are as follows:
(1)
Initialization. Define the hunting space, set the initial position information and step decay factor, and randomly generate an individual beetle.
(2)
Head Orientation. Randomly generate the orientation of the beetle head.
(3)
Two whisker stretching. Calculate the position of the left and right tentacles according to the orientation of the beetle head.
(4)
Movement update. Determine the next movement direction of the beetle by comparing the beetle two-whisker fitness values, update the current position, and record the historical optimal fitness values.
(5)
Termination conditions. Stop the algorithm execution when the termination condition is satisfied, otherwise re-execute step 2.

3.3.2. Improved Social Learning Beetle Antennae Group Search Algorithm

The beetle antennae search algorithm is a single search algorithm, which is suitable for dealing with low-dimensional problems and has the advantages of simplicity, few parameters, and small computation. However, in multidimensional function optimization, its efficiency is limited by the searching ability of a single beetle, and it is easy to fall into local extremes. In order to solve this problem, this paper designs an improved social learning beetle antennae search group algorithm (SLBAS) on the basis of the beetle antennae search algorithm, which improves the searching efficiency by mutual learning among the beetles.

Fundamentals of the SLBAS Algorithm

Compared with the traditional beetle antennae search algorithm, the improved beetle antennae group search algorithm incorporating social learning strategies designed in this paper first expands a single beetle into multiple beetles as shown in Figure 17a and randomly distributes the initial beetle s in the search area to improve the search capability. In Figure 17b, excellent beetles with strong odor concentration (adaptability) were screened from the beetle population to generate a high-quality beetle population. Ordinary beetles update their position by learning from the excellent beetles and skip the area with weak odor concentration (poor adaptability), thus improving the search efficiency and gradually approaching the area with stronger odor concentration (strong adaptability).

SLBAS Algorithm Convergence Process

Although the algorithm is able to accelerate the convergence process, it is prone to fall into local optimal solutions in high dimensional spaces. In addition, the convergence of the algorithm largely depends on the distribution of random seeds and initial positions of individuals. In the high-dimensional function, the learning ability of a single beetle individual is limited, and it is difficult to find the global optimal solution accurately. In this paper, we first design a swarm optimization-based beetle optimization method, which expands a single beetle individual into multiple beetle individuals, and improves the overall global optimization ability by using the idea of swarm intelligence, which can be expressed in the following matrix as a beetle swarm:
x 1,1 x 1 , d x n , 1 x n , d
X i = x i , 1 , x i , 2 , , x i , d
In the formula, the number of beetle s in the beetle s group is denoted by n, and d denotes the dimension. Equations (5) and (6) represents the position of the i beetle in the d-dimensional search space.
According to the objective function, the corresponding fitness value is calculated and represented by the vector P X :
P X = P x , 1 P x , 2 P x , n
where the value P X , i (1 ≤ i ≤ n) of each row in P X is the fitness value of the i beetle of the beetle matrix X.
During the iteration process, each beetle retains only the information of the optimal solution and does not fully utilize the interaction information between groups to guide the search. As a result, the algorithm may lose the global optimal solution in some cases, which leads to a less-than-expected convergence result. In order to improve this situation, this paper proposes a beetle swarming algorithm incorporating social learning strategies, which makes the beetle better utilize the information between groups by adding social learning behaviors to improve the global search efficiency. The improved algorithm is mainly divided into the following five steps:
(1) Generate the initialized population of beetle; the population of beetle can be represented by the following matrix H :
H = h 1,1 h 1 , d h l , 1 h l , d
where l denotes the number of beetles in the current iteration; d denotes the dimension of the target problem.
The corresponding fitness of these individual beetles is denoted as P H ; P h , i ( t ) (1 ≤ i ≤ l) is the fitness value of each beetle in H .
P X = P h , 1 ( t ) P h , 2 ( t ) P h , i ( t )
(2) The fitness of each beetle is calculated and ranked, and the fitness is measured as the prediction accuracy of the BP neural network in the test set. The fitness is finally defined as follows:
S = 1 n p n × 100 %
where the total number of test samples is denoted by n; n p   is the total number of correct predictions.
(3) Social learning probability P S
P S is the probability that represents the strength of learning ability of the individual beetle; only when the individual’s random behavior probability P i ( t ) is less than PS, it will acquire new knowledge through social learning. P S can be calculated using the following formula:
P s = 1 i 1 H α · log d l
Equation (15) shows that the larger i is, the smaller P S is, and the lower adaptation the is. There is a relationship between P S and S as well as problem dimensions, and the larger the number i is, the smaller 1 − (i − 1)/ H is, which indicates that this beetle individual is superior, but the ability to learn from other beetle individuals is weaker. In addition, the social learning probability is negatively correlated with d (problem dimension); the larger d is, the smaller P S is, which implies that in high-dimensional problems, the ability of learning among individual beetle is stronger, which helps to maintain the diversity of their population and prevent them from falling into local optimal solutions.
(4) Calculate the random probability P i ( t )
P h , j t = P h , i t 1 ,         i f     P i t > P s r 1 t · P h , i t + P h , i t ,       e l s e
P h , i t = r 2 t · I h , i t + r 3 t · ε · W h , i t
I h , i t = P k , j t P h , j t
W h , i t = G t P h , j t
where r 1 , r 2 are random numbers between (0, 1); ε is the social learning factor; P h , i ( t ) is a learned offset, which consists of two components, one is the local learning I h , i ( t ) , and the other is the global learning W h , i ( t ) , as can be seen from the Equation. The updated position is determined by three components, namely, the locally optimal position P h , i ( t ) , I h , i ( t ) representing the learning behavior of the current individual to the better individual k, and W h , i ( t ) as the learning behavior of the current individual to the whole group. I h , i ( t ) is measured by the distance between P h , i ( t ) and P k , i ( t ) ; W ( t ) is measured by the distance between the individual and the average optimal position of the group G ( t ) .
(5) Position update
Individual positions can be updated by bringing Equation (17) through (19) into Equation (16).

3.3.3. SLBAS-BP Based Health Status Prediction Model for Small-Tailed Cold Sheep

In this paper, the SLBAS algorithm is used to optimize the weights and thresholds of the BP neural network, and the optimized weights and thresholds are applied to the BP neural network so as to construct the SLBAS-BP neural network model. The schematic diagram of the model is shown in Figure 18.
The SLBAS algorithm optimizes the BP neural network, and its basic principle is as follows:
(1)
Process the dataset, determine the network structure and initial BP neural network weights and thresholds, and use the mean square error obtained from the training of the BP neural network as the adaptation value.
(2)
Aiming at the problem that a single beetle does not have enough searching ability, this paper introduces the concept of intelligent population and extends a single beetle to multiple beetles. The method does not require centralized constraints, and the error of a single beetle does not have an impact on the overall problem-solving.
(3)
The number of beetles and the number of iterations in the algorithm are initialized.
(4)
The population of beetle s is initialized and the fitness of each beetle s within the population is calculated.
(5)
The fitness values of the beetles were sorted by size.
(6)
The beetle with the largest fitness value randomly learns from individuals better than itself according to Equations (11)–(19) and thus updates its position.
(7)
Calculate the fitness value of the individual beetle after updating its position.
(8)
If the conditions for the end of the iteration are satisfied, then the algorithm will get the optimal result, if the algorithm does not reach the optimal result, then the algorithm will go to step (5) and carry out the next iteration.
(9)
The BP neural network uses the optimal aspen individual locations obtained from the SLBAS algorithm as new weights and thresholds to predict and analyze the test set and output the classification results.
To summarize, the flowchart of the algorithm for SLBAS-BP neural network is given as shown in Figure 19.

4. Results and Discussion

4.1. Results

4.1.1. BP Neural Network Prediction Model Training and Testing

After data preprocessing, the selection of BP neural network functions was then carried out, and after a series of simulation experiments, trainlm was selected as the training function, clearngd as the learning function and logsig as the transfer function. The number of neurons is 10 and the training step size of 273 steps are also determined by observing the trend of the training error. In this subsection, this paper will train and test the established BP neural network small-tailed cold sheep health status prediction model.
After the training of the BP neural network-based health status prediction model for small-tailed cold sheep is completed, this paper inputs 9573 (30% of the collected data) datasets into the model for testing and obtains the prediction results of the physical health status of all the test samples (small-tailed cold sheep), and this paper compares the final test results with the actual health status of the small-tailed cold sheep as determined by artificial breeding experience and calculates the prediction. The prediction accuracy rate is calculated.
The formula for the prediction accuracy is as follows (20):
P = n N * 100 %
where P is the prediction accuracy; n is the number of correctly predicted samples; and N is the total number of samples.
The dataset was input into the model for testing and the results obtained are shown in Figure 20, where the horizontal direction is the predicted classification results and the vertical direction is the actual classification results, the green squares indicate that the prediction results of the model are in accordance with the actual health status of the small-tailed cold goat, and the pink boxes indicate the number of discrepancies between the prediction and the actual, and in the lower-right corner, it shows that the model’s average prediction accuracy rate is 89.4%. Table 7 corresponds to it: the prediction rate of disease is the highest, 92.9%; the prediction rate of fever is the lowest, 82.3%; and the prediction rate of fever is lower, which may be due to the fact that the physiological performance and behavioral manifestations of the small-tailed cold sheep with fever are not obvious with the classification of the performance of the sub-healthy situation, so the fever is wrongly predicted as sub-healthy, which makes the prediction rate decrease correctly. The average prediction accuracy of the health status of the four types of small-tailed cold sheep was 89.4%, which still has room for further improvement.

4.1.2. SLBAS-BP Neural Network Prediction Model Training and Testing

In order to quantitatively evaluate the prediction effect of the optimized BP neural network model of the SLBAS algorithm, the same test data as that of the BP neural network was used to test it, and Table 8 shows the test results. From Table 8, it can be seen that the SLBAS-BP model has the highest correct prediction rate for disease, 98.7%, and the lowest correct prediction rate for fever, 90.4%; the correct prediction rate for health is again higher than that for sub-health, and this trend is the same before and after the algorithm improvement.
The prediction results of the health condition prediction model of small-tailed cold sheep before and after the improvement based on the BP neural network were compared, as shown in Table 9. It can be seen that the prediction rates of the four health conditions of the small-tailed cold sheep before the improvement of the BP neural network have been improved by 6%, 3.6%, 8.1%, and 5.8%, respectively, and the average prediction correctness rate has been improved by 5.8%, and the prediction accuracy rate of fever has been improved by 8.1% compared with that before the improvement, and the prediction results have shown the effectiveness of the improved algorithm applied to the prediction model for the physical health conditions of the small-tailed cold sheep established in this paper. The prediction results demonstrated the effectiveness of the improved algorithm applied to the established body health prediction model.

4.2. Discussion

In this study, we developed effective health prediction models using wearable devices to obtain physiological and behavioral parameters and a modified BP neural network to build a prediction model that was used to provide farmers with health information data on small-tailed cold goats. The health prediction model was validated in two different conditions. To the best of our knowledge, this is the first report of successful health prediction using physiological and behavioral parameters through machine learning.
Based on the experimentation of the health prediction model using only the BP neural network, it can be observed that a significant decrease in the mean square error occurs when the number of training sessions reaches 50, from 0.06 to about 0.053. The decreasing tendency slows down during subsequent training sessions and ultimately converges as a whole. After 273 training sessions, the training mean square error reaches 0.0538, which is basically consistent with the simulation results in Figure 21, which further proves the correctness of the selected network parameters.
The optimized network training results are shown in Figure 22. The training results show that when iterative training with the SLBAS-BP neural network prediction model, the optimal fitness value of 1.415 is reached at the 17th iteration, which means that the model is able to predict the target variable with high accuracy on this dataset, and the value of fitness tends to be stable after the 17th iteration, always around 1.415, and such a result helps to effectively optimize the training process of the BP neural network prediction model and improve its prediction accuracy and efficiency.
Overall, the SLBAS-BP model curve is more stable and close to the actual data, which is suitable for the situation of higher requirements on prediction accuracy. The improved model not only inherits the mapping ability of the original network on the relationship between the input variables but also obtains the optimal solution on the value of the network parameters so that the prediction ability of the BP model is effectively improved.

5. Conclusions

Firstly, this paper designs a wearable data acquisition device for small-tailed cold sheep, including the device structure, including sensor measurement node circuit, etc. After actual testing, it is shown that this device has the characteristics of high precision, easy to wear, low power consumption, collision, and is waterproof. Wearing this device on the body of a small-tailed frigid sheep, the body temperature, heart rate, and behavioral data of the small-tailed cold sheep can be collected and transmitted in real-time. Secondly, a health warning software platform for small-tailed cold sheep has been established. After data transmission to the cloud, the body temperature, heart rate, and pre-exercise behavior data of each experimental small-tailed cold sheep were stored in a logical chronological order, and the breeder only needed to log in to the cloud platform with his account on the computer to view the specific body temperature data, heart rate data, and behavior data of each small-tailed cold sheep. After actual testing, the platform can record and analyze the data in a stable, real-time, and clear way, providing a basis for subsequent decision-making. Finally, a model using the BP neural network to predict the health status of small-tailed cold sheep was constructed. For the problem of the BP neural network falling into local optimum, this paper designs an improved social learning beetle swarm searching algorithm (SLBAS) to optimize the initial weights and thresholds of the BP neural network and proposes a health status prediction model for small-tailed frigid sheep based on SLBAS-BP. prediction model. The optimized network training results are shown in Figure 22 The training results show that when the SLBAS-BP neural network prediction model is trained iteratively and the optimal fitness value of 1.415 is reached at the 17th iteration, which means that the model is able to predict the target variables with high accuracy on this dataset. In terms of prediction correctness, the average prediction correctness for the four different health conditions was improved by 5.8% compared to the pre-improvement period, which also demonstrates the effectiveness of the improved algorithm.

Author Contributions

Conceptualization, W.F., H.W. and D.H.; methodology, W.F., H.W. and D.H.; software, W.F., Y.H. and H.Z.; validation, W.F. and H.D.; formal analysis, W.F. and T.L.; investigation, W.F., T.L. and J.Y.; resources, W.F., D.H. and H.W.; data curation, W.F. and H.W.; writing—original draft preparation, W.F.; writing—review and editing, W.F., D.H. and H.W.; visualization, W.F., H.W. and D.H.; supervision, D.H., W.F. and H.W.; project administration, W.F. and D.H.; funding acquisition, D.H. All authors have read and agreed to the published version of the manuscript.

Funding

This research was funded by the National Key R&D Programme “Smart Restoration of Meadow Grassland and Synergistic Enhancement of Ecological-Productive Functions and Demonstration of Technology”, Sub-theme “Control and Smart Management of Grass-Livestock Balance in Meadow Grassland Ecological Pastures” under grant number 2022YFF1300604 and the major science and technology projects of Inner Mongolia Autonomous Region under grant number 2021ZD0019-4.

Institutional Review Board Statement

The animal study protocol was approved by the Ethics Committee of Inner Mongolia University protocol code [2021]048 and 30 April 2021).

Data Availability Statement

Some or all of the data, models, or code generated or used during the study are available from the corresponding author by request (raw data, site data, and algorithm model).

Conflicts of Interest

Author Haixia Wang was employed by the company Three Gorges Onshore New Energy Investment Co., Ltd. The remaining authors declare that the research was conducted in the absence of any commercial or financial relationships that could be construed as a potential conflict of interest.

References

  1. Navon, S.; Mizrach, A.; Hetzroni, A.; Ungar, E.D. Automatic recognition of jaw movements in free-ranging cattle, goats and sheep, using acoustic monitoring. Biosyst. Eng. 2013, 114, 474–483. [Google Scholar] [CrossRef]
  2. Nakagawa, K.; Kobayashi, H.H. Optimal Arrangement of Wearable Devices Based on Lifespan of Animals as Device Transporter Materials for Long-term Monitoring of Wildlife Animal Sensor Network. Sens. Mater. 2020, 32, 13–25. [Google Scholar] [CrossRef]
  3. Zhang, G.; Xiao, W. Development Status and Trends of Smart Animal Husbandry. China’s Natl. Cond. Strength 2019, 11, 33–35. [Google Scholar]
  4. Kumar, A.; Hancke, G.P. A Zigbee-Based Animal Health Monitoring System. IEEE Sens. J. 2015, 15, 610–617. [Google Scholar] [CrossRef]
  5. Zhang, X.; Beebe, T.; Liu, Y.; Park, J.; Hsiai, T.; Tai, Y.-C. Wearable flexible micro electrode for adult zebrafish long term ecgmonitoring. In Proceedings of the IEEE International Conference on Micro Electro Mechanical Systems (MEMS), Estoril, Portugal, 18–22 January 2015; IEEE: Piscataway, NJ, USA, 2015; pp. 690–693. [Google Scholar] [CrossRef]
  6. Sheng, H.; Tan, J. BioLogger: A wireless physiological sensing and logging system with applications in poultry science. In Proceedings of the 2009 Annual International Conference of the IEEE Engineering in Medicine and Biology Society, Minneapolis, MN, USA, 3–6 September 2009; pp. 4828–4831. [Google Scholar] [CrossRef]
  7. Moyers, S.C.; Adelman, J.S.; Farine, D.R.; Moore, I.T.; Hawley, D.M. Exploratory behavior is linked to stress physiology and social network centrality in free-living house finches (Haemorhous mexicanus). Horm. Behav. 2018, 102, 105–113. [Google Scholar] [CrossRef] [PubMed]
  8. Debauche, O.; Mahmoudi, S.; Andriamandroso, A.L.H.; Manneback, P.; Bindelle, J. Cloud services integration for farm animals’ behavior studies based on smartphones as activity sensors. J. Ambient Intell. Humaniz. Comput. 2019, 10, 4651–4662. [Google Scholar] [CrossRef]
  9. Le Roux, S.P.; Wolhuter, R.; Niesler, T. Energy-Aware Feature and Model Selection for Onboard Behavior Classification in Low-Power Animal Borne Sensor Applications. IEEE Sens. J. 2019, 19, 2722–2734. [Google Scholar] [CrossRef]
  10. Pandey, A.; Gupta, G.S.; Singh, P. Remotely operated mechanical nociceptive device for sheep: Preliminary investigations. In Proceedings of the 2017 IEEE Sensors Applications Symposium (SAS), Glassboro, NJ, USA, 13–15 March 2017; IEEE: Piscataway, NJ, USA, 2017; pp. 1–6. [Google Scholar] [CrossRef]
  11. Ramachandran, V.R.K.; Zhang, K.; Meratnia, N.; Havinga, P. Towards Implantable Body Sensor Networks—Performance of MICS Band Radio Communication in Animal Tissue. EAI Endorsed Trans. Cogn. Commun. 2016, 16, 2. [Google Scholar] [CrossRef]
  12. Greene, N.T.; Alhussaini, M.A.; Easter, J.R.; Argo, T.F., IV; Walilko, T.; Tollin, D.J. Intracochlear pressure measurements during acoustic shock wave exposure. Hear Res. 2018, 365, 149–164. [Google Scholar] [CrossRef] [PubMed]
  13. Zang, J.; Ye, S.; Xu, Z.; Wang, J.; Liu, W.; Bai, Y.; Yong, C.; Zou, X.; Zhang, W. Prediction Model of Carbon Dioxide Concentration in Pig House Based on Deep Learning. Atmosphere 2022, 13, 1130. [Google Scholar] [CrossRef]
  14. Zhang, L.; Tedde, A.; Ho, P.; Grelet, C.; Dehareng, F.; Froidmont, E.; Gengler, N.; Brostaux, Y.; Hailemariam, D.; Pryce, J.; et al. Mining data from milk mid-infrared spectroscopy and animal characteristics to improve the prediction of dairy cow’s liveweight using feature selection algorithms based on partial least squares and Elastic Net regressions. Comput. Electron. Agric. 2021, 184, 106106. [Google Scholar] [CrossRef]
  15. McCauley, I.; Matthews, B.; Nugent, L.; Mather, A.; Simons, J. Wired Pigs: Ad-Hoc Wireless Sensor Networks in Studies of Animal Welfare. In Proceedings of the Second IEEE Workshop on Embedded Networked Sensors, 2005. EmNetS-II, Sydney, NSW, Australia, 31 May 2005; IEEE: Piscataway, NJ, USA, 2005; pp. 29–36. [Google Scholar] [CrossRef]
  16. Fahey, B.J.; Nightingale, K.R.; McAleavey, S.A.; Palmeri, M.L.; Wolf, P.D.; Trahey, G.E. Acoustic radiation force impulse imaging of myocardial radiofrequency ablation: Initial in vivo results. IEEE Trans. Ultrason. Ferroelectr. Freq. Control 2005, 52, 631–641. [Google Scholar] [CrossRef] [PubMed]
  17. Smith, K.; Martinez, A.; Craddolph, R.; Erickson, H.; Andresen, D.; Warren, S. An Integrated Cattle Health Monitoring System. In Proceedings of the Conference International Conference of the IEEE Engineering in Medicine & Biology Society, New York, NY, USA, 30 August–3 September 2006; IEEE: Piscataway, NJ, USA, 2006; pp. 4659–4662. [Google Scholar] [CrossRef]
  18. Venkatraman, S.; Long, J.D.; Pister, K.S.J.; Carmena, J.M. Wireless inertial sensors for monitoring animal behavior. In Proceedings of the 2007 29th Annual International Conference of the IEEE Engineering in Medicine and Biology Society, Lyon, France, 22–26 August 2007; IEEE: Piscataway, NJ, USA, 2007; pp. 378–381. [Google Scholar] [CrossRef]
  19. Majerus, S.J.; Fletter, P.C.; Damaser, M.S.; Garverick, S.L. Low-Power Wireless Micromanometer System for Acute and Chronic Bladder-Pressure Monitoring. IEEE Trans. Biomed. Eng. 2011, 58, 763. [Google Scholar] [CrossRef] [PubMed]
  20. Li, S.; Zhang, C.; Wang, R.; Song, J.; Xin, H.; Zhang, Y.; Sun, Y. Establishment of a feed intake prediction model based on eating time, ruminating time and dietary composition. Comput. Electron. Agric. 2022, 202, 107296. [Google Scholar] [CrossRef]
  21. Tsenkov, Y.; Tsenev, V. Continuous analysis of free-roaming animals’ behavior with ear-tag device. In Proceedings of the 2017 40th International Spring Seminar on Electronics Technology (ISSE), Sofia, Bulgaria, 10–14 May 2017; pp. 1–5. [Google Scholar] [CrossRef]
  22. Chen, M.; Liu, Y.; Tam, J.; Chan, H.-Y.; Li, X.; Chan, C.; Li, W. Wireless AI-Powered IoT Sensors for Laboratory Mice Behavior Recognition. IEEE Internet Things J. 2022, 9, 1899–1912. [Google Scholar] [CrossRef]
  23. Rowland, M.A.; Perkins, E.J.; Mayo, M.L. Physiological fidelity or model parsimony? The relative performance of reverse-toxicokinetic modeling approaches. BMC Syst. Biol. 2017, 11, 35. [Google Scholar] [CrossRef] [PubMed]
  24. Leos-Barajas, V.; Gangloff, E.J.; Adam, T.; Langrock, R.; van Beest, F.M.; Nabe-Nielsen, J. Multi-scale Modeling of Animal Movement and General Behavior Data Using Hidden Markov Models with Hierarchical Structures. J. Agric. Biol. Environ. Stat. 2017, 22, 232–238. [Google Scholar] [CrossRef]
  25. Nagl, L.; Schmitz, R.; Warren, S.; Hildreth, T.S.; Erickson, H.; Andresen, D. Wearable sensor system for wireless state-of-health determination in cattle. In Proceedings of the International Conference of the IEEE Engineering in Medicine & Biology Society, Cancun, Mexico, 17–21 September 2003; IEEE: Piscataway, NJ, USA, 2003; pp. 3012–3015. [Google Scholar] [CrossRef]
  26. Brugarolas, R.; Dieffenderfer, J.; Walker, K.; Wagner, A.; Sherman, B.; Roberts, D.L.; Bozkurt, A. Wearable wireless biophotonic and biopotential sensors for canine health monitoring. In Proceedings of the Sensors, Valencia, Spain, 2–5 November 2014; IEEE: Piscataway, NJ, USA, 2014; pp. 2203–2206. [Google Scholar] [CrossRef]
  27. Taneja, M.; Jalodia, N.; Malone, P.; Byabazaire, J.; Davy, A.; Olariu, C. Connected Cows: Utilizing Fog and Cloud Analytics toward Data-Driven Decisions for Smart Dairy Farming. IEEE Internet Things Mag. 2019, 2, 32–37. [Google Scholar] [CrossRef]
  28. Huang, C.H.; Shen, P.Y.; Huang, Y.C. IoT-based physiological and environmental monitoring system in animal shelter. In Proceedings of the 2015 Seventh International Conference on Ubiquitous and Future Networks, Sapporo, Japan, 7–10 July 2015; IEEE: Piscataway, NJ, USA, 2015; pp. 317–322. [Google Scholar] [CrossRef]
Figure 1. Animal activity recognition based on wearable sensors and deep learning models.
Electronics 13 02602 g001
Figure 2. Specific research content of a wearable device-based health prediction system.
Electronics 13 02602 g002
Figure 3. Overall scheme design of wearable data acquisition system for small-tailed cold sheep.
Electronics 13 02602 g003
Figure 4. Overall design framework of the wearable device for the small-tailed frigid sheep.
Electronics 13 02602 g004
Figure 5. (a) MLX90614 infrared temperature sensor. (b) AD8232 heart rate sensor.
Electronics 13 02602 g005
Figure 6. (a) ADXL345 three-axis accelerometer. (b) Wireless communication module YED-C724 core board.
Electronics 13 02602 g006
Figure 7. Login entry interface.
Electronics 13 02602 g007
Figure 8. Physiological data monitoring page.
Electronics 13 02602 g008
Figure 9. Behavior data monitoring page.
Electronics 13 02602 g009
Figure 10. (a) temperature calibration. (b) Heart rate calibration.
Electronics 13 02602 g010
Figure 11. Partial behavioral dataset of small-tailed cold sheep.
Electronics 13 02602 g011
Figure 12. Structure of the BP neural network.
Electronics 13 02602 g012
Figure 13. Partial data sets.
Electronics 13 02602 g013
Figure 14. Trend of mean square error with the number of neurons.
Electronics 13 02602 g014
Figure 15. Trend of mean square error with training step.
Electronics 13 02602 g015
Figure 16. Flow chart of BAS algorithm.
Electronics 13 02602 g016
Figure 17. (a) Expanding a single beetle to multiple beetles. (b) Ordinary individuals learn from excellent individuals.
Electronics 13 02602 g017
Figure 18. SLBAS-BP neural network model.
Electronics 13 02602 g018
Figure 19. SLBAS-BP neural network algorithm flowchart.
Electronics 13 02602 g019
Figure 20. BP network prediction results.
Electronics 13 02602 g020
Figure 21. Variation of mean squared error with step size.
Electronics 13 02602 g021
Figure 22. Adaptability change curve.
Electronics 13 02602 g022
Table 1. Description of specific impacts on the health status of small-tailed cold sheep.
Physical
Condition
SpeciesBody
Temperature
Heart RateBehaviorOther
Influencing
Factors
HealthSheep38.5~39.7 °C74~116Walk, run or jumpGender.
Age.
Season.
Sub-health39.5~40.7 °CSlight
change
Increased
frequency of
sleeping.
Fever40.5~41.7 °CSignificantly
accelerate
Most of them are in a resting state.
IllnessAbove 41 °CIt depends
on the disease
It depends
on the disease.
Table 2. Experimental software and hardware environment.
HardwareSoftware
Graphics cardNVIDIA Geforce RTX 2080TiOperating systemWindows10
Graphics memory16 GOperating environmentMatlab 2022
CPUIntel(R) Core i7-9700F 3.00 HzGPUNVIDID Drivers
Memory32 G 516.94
Hard disk2 TProgramming LanguageC Language
Table 3. Function combination verification results.
NumberTraining
Function
Learning
Function
Hidden Layer Transfer Function
LogsigTansig
Step WidthMSEStep WidthMSE
1traingdlearngd15,0000.084215,0000.083
learngdm15,0000.07915,0000.0801
2traingdmlearngd15,0000.087815,0000.0803
learngdm15,0000.084515,0000.0835
3traingdalearngd1890.0651450.064
learngdm1880.06121720.0632
4traingdxlearngd980.09181870.0618
learngdm1030.08751630.0663
5trainlmlearngd110.062390.0612
learngdm70.058130.060
6trainbfglearngd200.0677410.0597
learngdm540.0678250.0651
7trainrplearngd350.0654210.0662
learngdm290.0661290.0642
8trainscglearngd360.0652410.0648
learngdm370.0654110.0668
9traincgblearngd420.0623120.0654
learngdm200.0654270.0642
10traincgflearngd170.0642230.0602
learngdm120.0649170.0662
11traincgplearngd450.0632200.063
learngdm240.0624230.064
12trainosslearngd810.0662250.0651
learngdm410.0654230.654
Table 4. Mean square error under different number of neurons.
Number of Neurons5678910111213
MSE0.05710.05680.05530.05460.05380.05370.05430.05400.0541
Table 5. Corresponding mean square error values at different step sizes.
Training Step100200273300400500600700800
MSE0.055500.054510.053800.053780.053780.053760.053740.053730.05373
Table 6. Beetle antennae search algorithm process.
BAS Algorithm Flow:
Input: Set   objective   function   f ( x ) ,   initialize   value   P ,   d ,   δ ;
Output: The   maximum   value   of   the   objective   function   X b e s ,   f b e s ;
01 b e g i n ;
02 w h i l e     t T m a x   o r   s t o p   c r i t e r i o n   d o ;
03    According to the Formula (4) generate random search direction b;
04 According   to   the   Formula   ( 5 )   calculate   the   position   of   the   left   and   right   whiskers   of   the   BAS   x l ,   x r ;
05    According to the Formula (6) update the position of the BAS;
06 i f       f x t < f b e s       t h e n
07 f b e s = f x t ;
08 X b e s = X t ;
09 According   to   the   Formula   ( 7 )   update   d t , δ t ,;
10 r e t u r e     X b e s ,   f b e s ;
11end
Table 7. BP network prediction model test results.
Physical
Condition
Test DataPredictive Health DataPredictive Sub-Health DataPredictive
Fever Data
Predictive Illness DataSingle Prediction
Accuracy
Average Prediction Accuracy
Health165215261260092.4%89.4%
Sub-health3011562736219090.9%
Fever250304432060082.3%
illness240700172223592.9%
Table 8. Classification and prediction results of the health status of small-tailed cold sheep based on SLBAS-BP algorithm.
Physical
Condition
Test DataPredictive Health DataPredictive Sub-Health DataPredictive
Fever Data
Predictive Illness DataSingle Prediction AccuracyAverage Prediction Accuracy
Health165215261260098.4%95.2%
Sub-health3011562736219094.5%
Fever250304432060090.4%
illness240700172223598.7%
Table 9. Comparison of prediction accuracy before and after improvement.
ArithmeticCorrect Rate of Health PredictionCorrect Rate of Sub-Health PredictionFever Prediction
Accuracy
Illness prediction
Accuracy
Average Prediction Accuracy
BP92.4%90.9%82.3%92.9%89.4%
SLBAS-BP98.4%94.5%90.4%98.7%95.2%
Lifting ratio6%3.6%8.1%5.8%5.8%
Disclaimer/Publisher’s Note: The statements, opinions and data contained in all publications are solely those of the individual author(s) and contributor(s) and not of MDPI and/or the editor(s). MDPI and/or the editor(s) disclaim responsibility for any injury to people or property resulting from any ideas, methods, instructions or products referred to in the content.

