Article

Symmetrical Multilevel High Voltage-Gain Boost Converter Control Strategy for Photovoltaic Systems Applications

by
Mohamed Lamine Touré
1,2,*,
Mamadou Baïlo Camara
1,* and
Brayima Dakyo
1
1
GREAH (Electrical Engineering and Automation Research Group)-Laboratory, University of Le Havre Normandie, 75 Rue Bellot, 76600 Le Havre, France
2
Conakry Polytechnic Institute, Gamal Abdel Nasser University, Dixinn Rue 14, 1147 Conakry, Guinea
*
Authors to whom correspondence should be addressed.
Electronics 2024, 13(13), 2565; https://doi.org/10.3390/electronics13132565
Submission received: 3 May 2024 / Revised: 6 June 2024 / Accepted: 24 June 2024 / Published: 29 June 2024
(This article belongs to the Special Issue Advancements in Power Electronics Conversion Technologies)

Abstract

This paper proposes a Symmetric High Voltage-Gain (SHVG) boost converter control for photovoltaic system applications. The concept is based on a multilevel boost converter configuration, which presents an advantage compared to a classic boost converter such as the ability to transfer a high amount of power with less stress on the power electronics components in the high voltage-gain conditions. This advantage allows the power losses in the converter to be reduced. A mathematical-based voltage model of the PV system using variable series resistance depending on solar irradiance and the temperature is proposed. This model is connected to an SHVG boost converter to supply the load’s power. A control strategy of the DC-bus voltage with maximum power point tracking (MPPT) from the PV system using PI controllers is developed. The contributions of the paper are focused on the SHVG operating analysis with the passive components’ sizing, and the DC-bus voltage control with maximum power point tracking of the PV systems in dynamic operating conditions. The performances of the proposed control are evaluated through simulations, where the results are interesting for high-power photovoltaic applications.

1. Introduction

Due to perpetual population growth in the world, energy requirements to accelerate development in underdeveloped countries with minimal greenhouse gas emissions are today a key issue. In developed countries, the challenge is how to maintain economic growth-based industrial activities without exacerbating the factors linked to global warming, in particular, the reduction in greenhouse gas emissions, which remains today a major issue for the international and scientific communities. The constraints associated with climate change have given rise to the concept of energy transition, the aim of which is to reduce the world’s energy consumption from fossil fuels and increase the generation of renewable energies. If mankind succeeds in replacing fossil fuels with renewables by 2050, we will have generated a saving of USD 12,000 billion, with an estimated world population of over 9 billion by that time [1,2]. In [3,4], the authors state that the contribution from renewable energy sources to global electricity production is estimated to be 14%, and this trend is set to rise to 70% by 2050, in order to keep global temperature increases below 2 °C. The production of renewable energy has made great strides in the last years, notably solar and wind systems, which saw their production capacity increase 10 and 3 times, respectively, between 2010 and 2016, thanks to the use of new technologies and the development of power electronics. However, 80% of the world’s energy consumption today is dependent on fossil fuels, which are the main source of CO2 emissions affecting global warming [5]. In [6], the authors state the use of nuclear energy and renewable energy sources reduced CO2 emissions by about 13% in 2018. Improving energy efficiency is also one of the solutions that can lead to energy savings of 20 to 30% [7]. In this context, photovoltaic solar energy is positioning itself as a major alternative solution for ensuring a successful energy transition, thanks to its abundant, estimated inexhaustible source, and on which recovery. In [8], the authors discuss the challenges and prospects of electrifying West Africa using renewable energies, focusing on microgrids and the difficulties encountered in developing these projects due to the low density of consumption points disproportionately spread over large areas. Figure 1 show a basic photovoltaic energy conversion principle used in microgrid applications [9].
To achieve the development of PV systems across the world, innovative material and technological solutions are needed to supply the power needed by consumers in DC or AC current form. For the PV systems-based DC configuration, the solar panels are connected to the load through a DC-DC converter such as a boost or buck converter according to the application’s requirements. However, due to the intermittent nature of solar irradiance, the implementation of PV systems requires an MPPT algorithm to extract the maximum power at any time of day, and in different weather conditions. This algorithm needs the information based on the current and/or voltage measurement to compute the control signal of the converter. It should also be noted that, depending on energy storage and output voltage regulation requirements, a bidirectional converter will be necessary to ensure, for example, the batteries’ module charge and discharge operations. It should also be noted that there are several topologies for integrating renewable energies in a multi-source configuration. The multi-source systems-based DC-bus configuration is the least restrictive in terms of various sources’ coupling, and the most flexible in terms of energy management [10]. For the PV systems-based AC configuration, an inverter can be used directly or added to the DC configuration to supply the power needed by consumers in AC current form. In this second configuration, using an MPPT algorithm is also necessary for optimal operation of the PV systems.
Generally, the classic boost converter is used for small-power PV installations. Dual buck/boost structures are also considered in the literature such as that presented in [11], where the boost mode is considered in the battery’s discharge stage to control the DC-bus voltage and the buck mode for the battery’s charge stage. However, for the high-power PV applications, the basic DC-DC converters present the limits in terms of power semiconductor technologies; but also, they present the critical constraints in terms of the passive components’ sizing. For this reason, and to increase their efficiency, one of the solutions proposed in the literature is multilevel DC-DC converters to reduce the current and voltage stress on the power components. To meet the growing demand of large consumers for DC power, one of the solutions is to use multilevel high voltage-gain boost converters, which can be isolated or non-isolated. In [12], a non-isolated high voltage-gain unidirectional DC-DC boost converter is proposed. This last one includes three inductors, three capacitors, four diodes and two symmetrically controlled switches for PV applications. Its high voltage-gain at a low duty cycle enables it to reduce conduction losses and increase converter efficiency. Another structure is proposed in [13] for the same purposes, based on an LC resonant circuit to achieve low-frequency switching at around 150 to 500 Hz through a capacitor placed in a half-bridge, using an 18 kW prototype.
In [14,15], a multilevel boost converter is proposed with a goal of reducing PV temperature using a snubber module for smooth switching. The results show a 12.9% reduction in the rate of excess heat in PVs, a 5% reduction in the rate of harmonic distortion and a 33% reduction in the number of switches. In [16], the authors propose boost converters with an interleaved configuration to reduce the input current ripple rate but that also offer the possibility of high voltage-gain when operating with a single source.
Most of the above-mentioned converters, despite their multilevel nature, cannot meet the demands of hundreds of kilowatts while remaining efficient. To achieve the requirements in terms of the current and voltage limits of power transistors, a new generation of symmetrical boost converters with a differential connection is proposed in [17,18]. One of the distinctive features of this study is the application of this novel generation of converters in high-power photovoltaic (PV) systems.
The originality of the paper is focused on two key contributions. The first concerns a new mathematical model of the PV-based voltage behavior emulator using variable series resistance, unlike the model-based current widely used in the literature. The second contribution concerns the Symmetric High Voltage-Gain (SHVG) boost converter sizing, behavior modeling, and the DC-bus voltage control strategy with the maximum power point tracking (MPPT) of the PV using PI controllers.
This paper is organized as follows: a behavior model of the PV systems is discussed in Section 2. DC-DC converter topologies for PV applications are discussed in Section 3 with new topology operating analysis, sizing and modeling. In Section 4, the PV system control strategy is presented. In Section 5, the simulation’s results are presented with discussions. The conclusions of the work are presented in Section 6

2. Behavior Model of the PV System

Several photovoltaic cell models are proposed in the literature with different parameters as presented in [19,20,21]. In general, these models include one or more diodes that characterize the diffusion of carriers in the base and emitter, the generation or recombination of carriers in the charge zone and the crystal grain boundaries: the series resistance Rs, which represents the resistance between the emitter and the base, and the shunt resistance Rsh, which represents the parallel resistance of the PV cell. Considering that some physical phenomena taking place in a PV system increase the complexity of the model, some more unknown parameters need to be determined. For single-diode models, the iterative estimation method gives good results for determining the series and shunt resistances [22,23] but is less efficient than the analytical method based on Lambert’s W function described in [24]. Its effectiveness has been demonstrated in solving the inaccuracy problem of Xiao et al’s method for determining the series resistance and ideality factor of the diode [25]. This method is adapted to evaluate the influence of the variations in saturation current, series resistance and ideality factor under intermittent irradiance and temperature conditions as shown in [26]. The compound method is applied to predict the output and accuracy of the single-diode model in [27]. An analytical approach is used to show the dependence of the series resistance Rs, the shunt resistance Rsh and the reverse saturation current I0 on variations in irradiance and temperature. This approach enables assessment of the reliability and accuracy of the single-diode model or via the open-circuit voltage, and the short-circuit current for predicting the electrical behavior of photovoltaic modules [28,29]. In [30], a review of one hundred PV models presented in the literature from 2011 to 2017 was conducted. The conclusions of this study show that the metaheuristic approach is the most cited compared to the analytical and numerical approaches. The Slime Mold [31] and Tabu search optimization algorithms assisted by differential evolution [32] are used to estimate the parameters of the single-diode model. It is also used in the energy management of multi-source systems with a frequency approach to the current supplied [33]. Alternatively, it can be used to power microgrids with fuel cell and supercapacitor storage systems [34]. For two-diode models, machine learning is used to predict the photovoltaic behavior [35]. A comparative study of the methods is proposed in [36]. A model for microgrid or distributed generation applications is proposed in [37].
For three-diode models, generally, many parameters are necessary. Due to their complexity, the equilibrium optimization algorithm [38] or combined analytical and algorithmic solar flux optimization methods are used to determine the parameters [39]. Other optimization algorithms are used to perform a comparative study between the PV models, such as the coyote optimization algorithm [40] or the three-tree growth algorithm [41]. For PV system control design such as that proposed in this paper, the PV model-based one-diode model as shown in Figure 2 is satisfactory.

2.1. PV Cell Series Resistance Modeling

To define the dependency relationship between the series resistance, solar irradiance and the temperature, the other models consider the data from the experimental study conducted in [42], where extracted data are given in Table 1. Using the sftool function in Matlab, we can determine the polynomial function corresponding to the data plotted in Figure 3. The resulting polynomial equation is given in Equation (1), where P00 = 0.0003111; P10 = 6.167 × 10⁻⁸; P01 = −1.081 × 10⁻⁵; P20 = −8.076 × 10⁻¹⁴; P11 = −5.996 × 10⁻¹¹; P02 = 3.819 × 10⁻²⁰; P30 = 7.377 × 10⁻¹⁷; P12 = −6.488 × 10⁻¹³; and P03 = −6.582 × 10⁻¹¹.
R s = P 00 + P 10 × I r r + P 01 × T + P 20 × I r r 2 + P 11 × I r r × T + P 02 × T 2 + P 30 × T 3 + P 12 × I r r × T 2 + P 03 × T 3

2.2. Proposed PV Cell Model

The mathematical model of the PV system-based Figure 3 is defined by Equations (2) to (5).
E g = E g 0 α × T 2 T + β
I p h = I s c + k i × T 298.15 × G 1000
I r s = I s c e q × V c o n × k × T 1
I 0 = I r s × T T r e f 3 × e q × E g 1 T r e f 1 T n k
The PV cell open-circuit voltage is given in Equation (6).
V o c = n × k × T q ln I s c I 0 × A + 1 A = T T r e f 3 × e q × E g 1 T r e f 1 T n × k
The power-voltage characteristics of a PV cell based on Equation (6) with temperature and irradiance variations are, respectively, shown in Figure 4 and Figure 5. Used parameters are extracted from the monocrystalline silicon cell (MSE335SO4J) datasheet, with an ideality factor of 1.3 and Isc = 9.5 A [43]. Figure 5 and Figure 6 show that under standard test conditions at 25 °C and 1000 W/m2, the power and voltage supplied by the PV cell depend on solar irradiance and the temperature. The PV power and voltage are more sensitive to variations in the solar irradiance compared to the temperature. On the other hand, Figure 5 and Figure 6 show that the voltage corresponding to the maximum power point decreases more when increasing the temperature than with increasing irradiance.

2.3. Proposed Model of the PV Module

The model of the PV cell under the load conditions is given in Equation (7).
V p v = n × k × T q ln I p h I p v I 0 × A + 1 I p v × R s × k lim v k lim v = V o c V m p V m p
The general model of the PV module based on the series and parallel PV system chain is given in Equation (8).
V p v = N S , c h a i n × N S , mod u l e × n × k × T q ln I p h I p v N P , c h a i n × k lim i N p , mod u l e × I 0 × A + 1 I p v N p , c h a i n × R s × N S , c h a i n e × N S , mod u l e × k lim v k lim i = I s c I m p I m p
In this paper, 7 PV modules in series and 80 modules in parallel (Ns,chain = 7, Np,chain = 80) based on the MSE345SO4J 345 W solar module are considered to obtain a PV system peak power of 204 kW with a voltage of 270 V. The characteristics of the MSE345SO4J module are shown in Table 2.
The power-voltage characteristics of the MSE345SO4J 345 W PV module-based temperature and solar irradiance variations are, respectively, plotted in Figure 6 and Figure 7. The power-voltage characteristics of the module are similar to those of the cell presented in Figure 4 and Figure 5.
In terms of the power-voltage characteristic, we can see that the minimum power supplied by the PV module at 200 W/m2 is just over 50 W, and that the maximum power at 1000 W/m2 is between 250 W and 300 W for a constant temperature of 25 °C. This information will help us to size the PV system for a requested power of 204 kW.

3. DC-DC Converters for PV Applications

3.1. DC-DC Converters’ Topologies

In this work, we will focus on boost converter structures used in typical non-isolated PV applications. Based on the different types of non-isolated boost converters discussed in the literature, we focus on an analysis whose main objective is always to obtain the highest voltage conversion gain compared to the classic DC/DC boost converter. However, if the high voltage gain is adapted to the low voltage PV system, it can increase the current in the input of the converter. In other words, key attention is necessary on the definition of the voltage gain limits because the current stress on inductors and switches becomes significant. To overcome this problem, one of the solutions proposed is to use multilevel structures with differential connections, which reduce the average value of the current flowing through each inductor and also the ripple rate of the current in the discharge phase of the coils. A classification of the different topologies of the DC-DC converter-based PV applications is shown in Figure 8.
For the high-power PV applications, it is generally recommended to use boost technology to extract the maximum power using the MPPT algorithm. Its design must be conducted with a standard input and output voltage for supplying loads. The usually required maximum voltage is about 1500 V for an optimal operating point of 1000 V. A summary of the different types of boost converter based on the inductor switching technique that is the subject of this study is given in Table 3.
Most DC-DC converters in the literature based on the switched inductor techniques have been tested for small powers with high switching frequencies. Contrary to the literature information, the proposed topology is designed for a high-power (204 kW) PV application with a switching frequency of 10 kHz. Some topologies presented in Table 3 have higher voltage gains compared to the proposed topology, but they are not adapted for high-power applications due to the high current stress on the passive components.

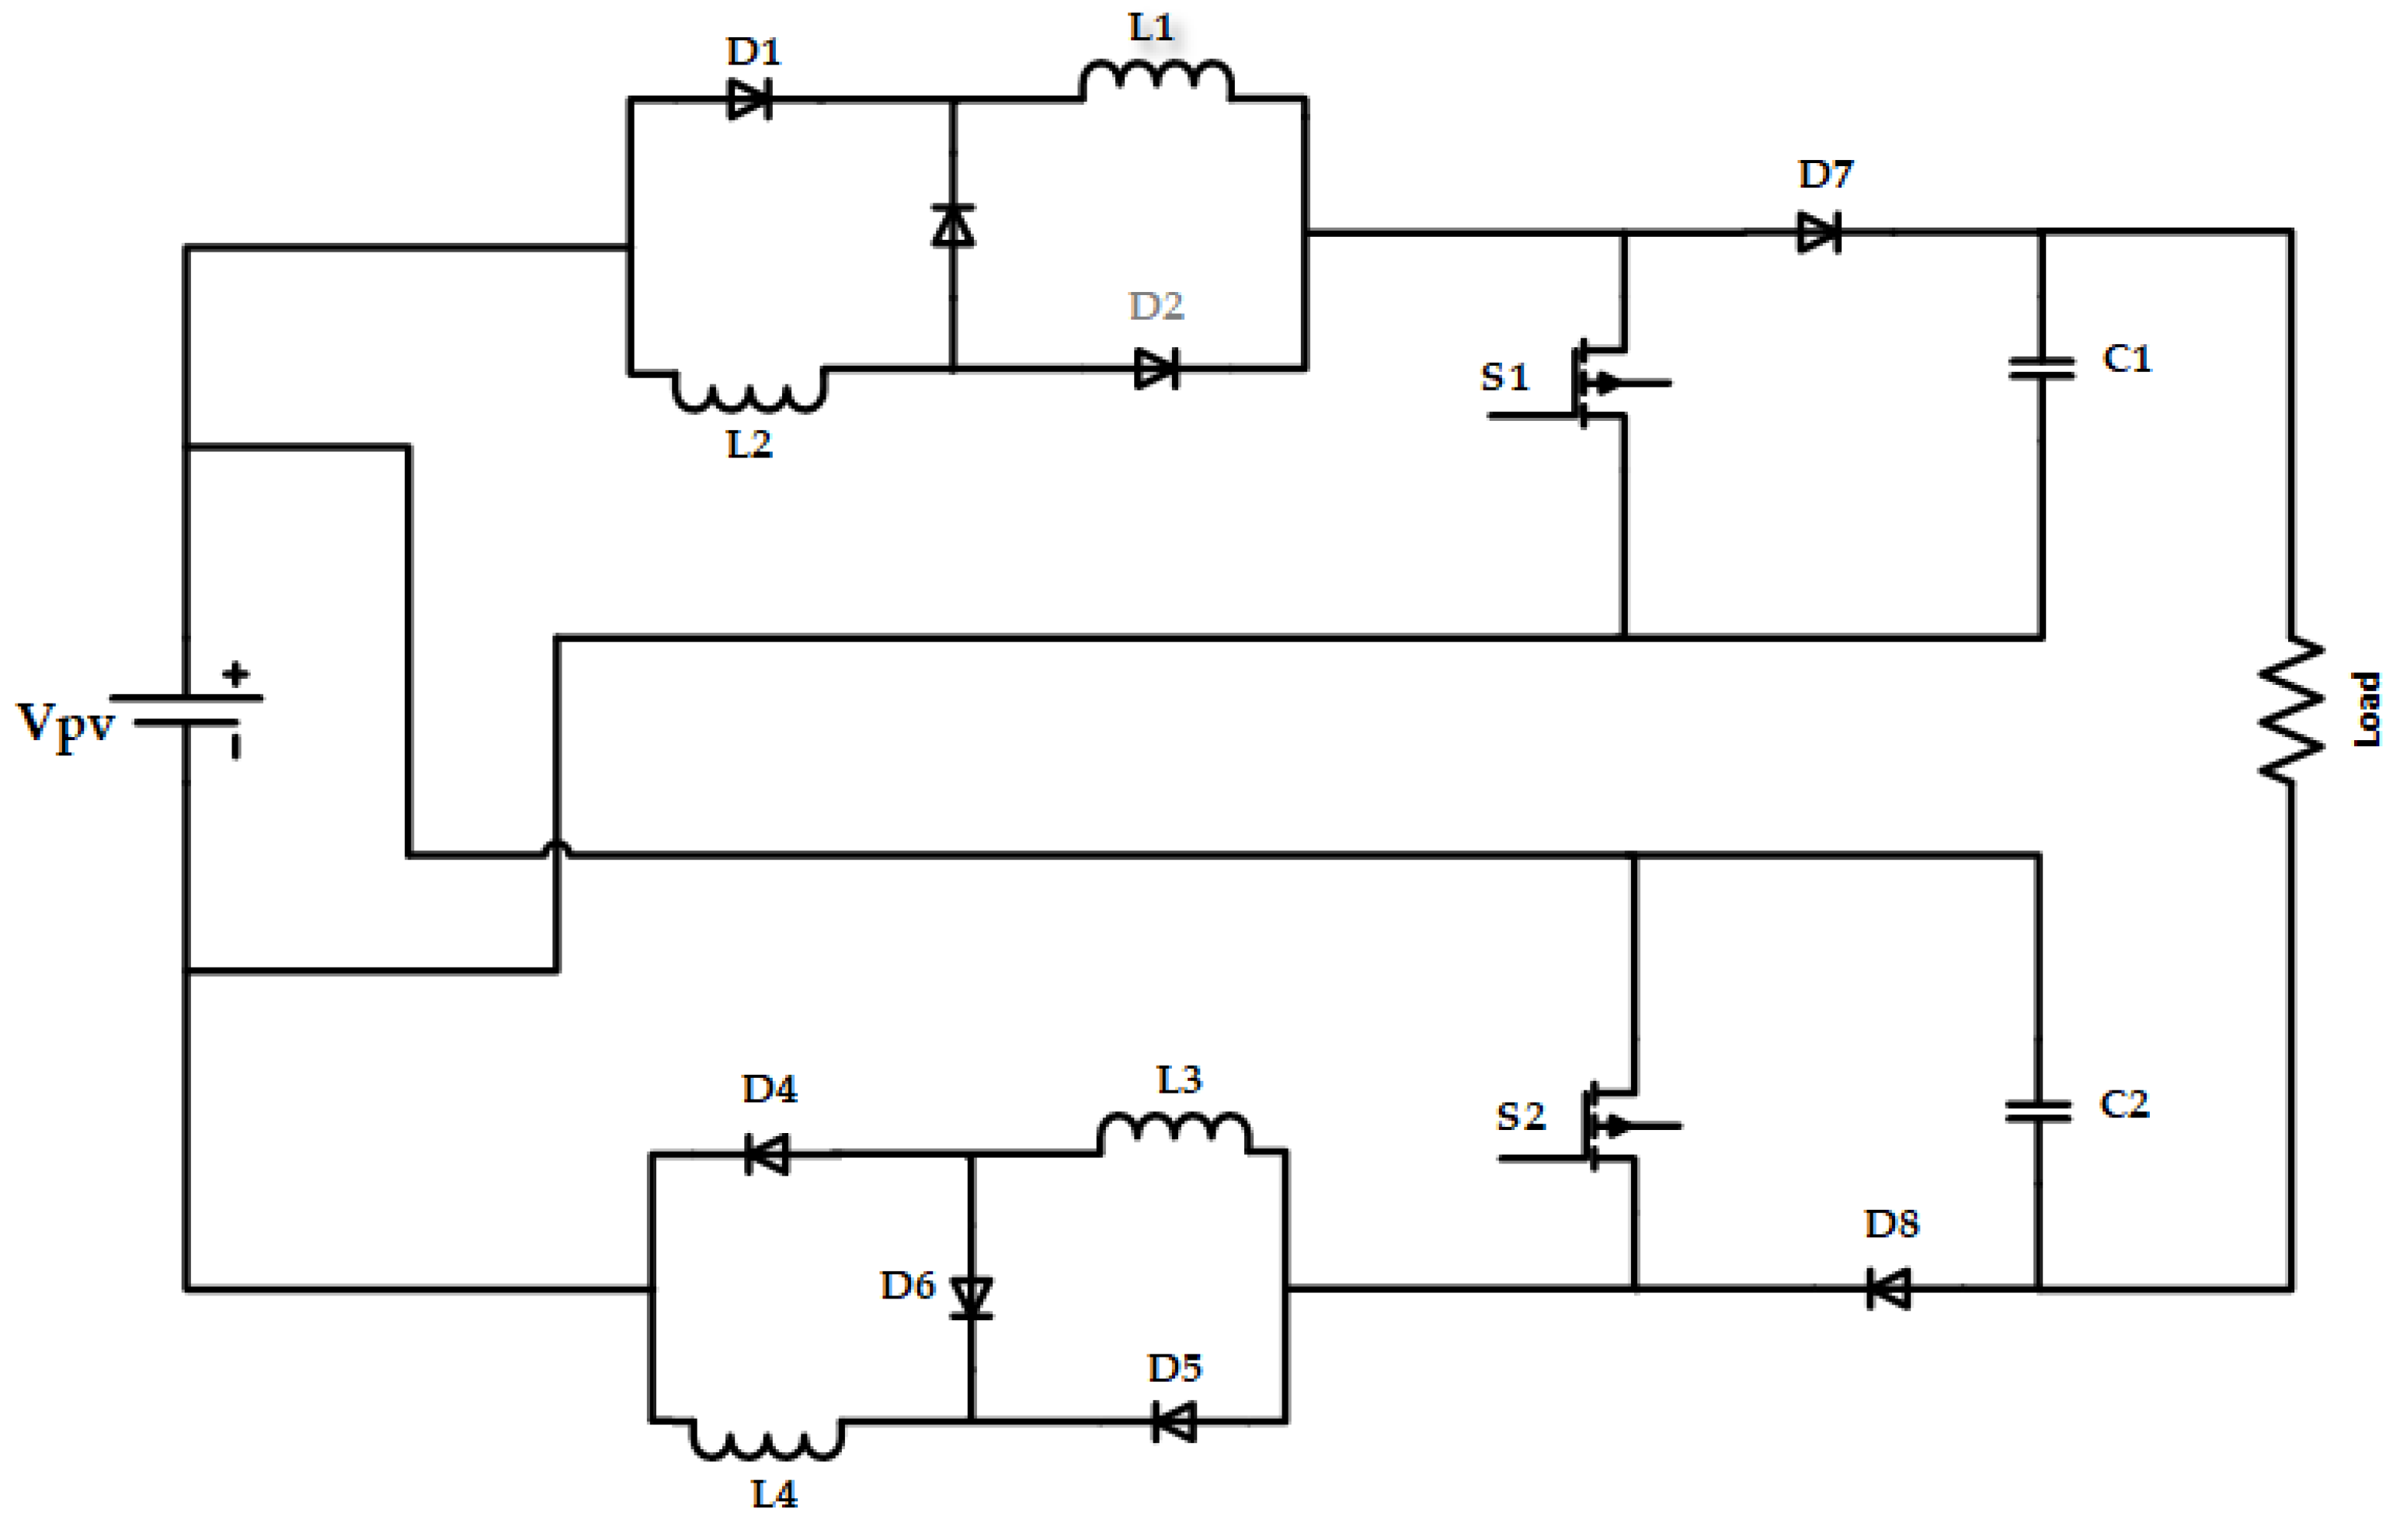
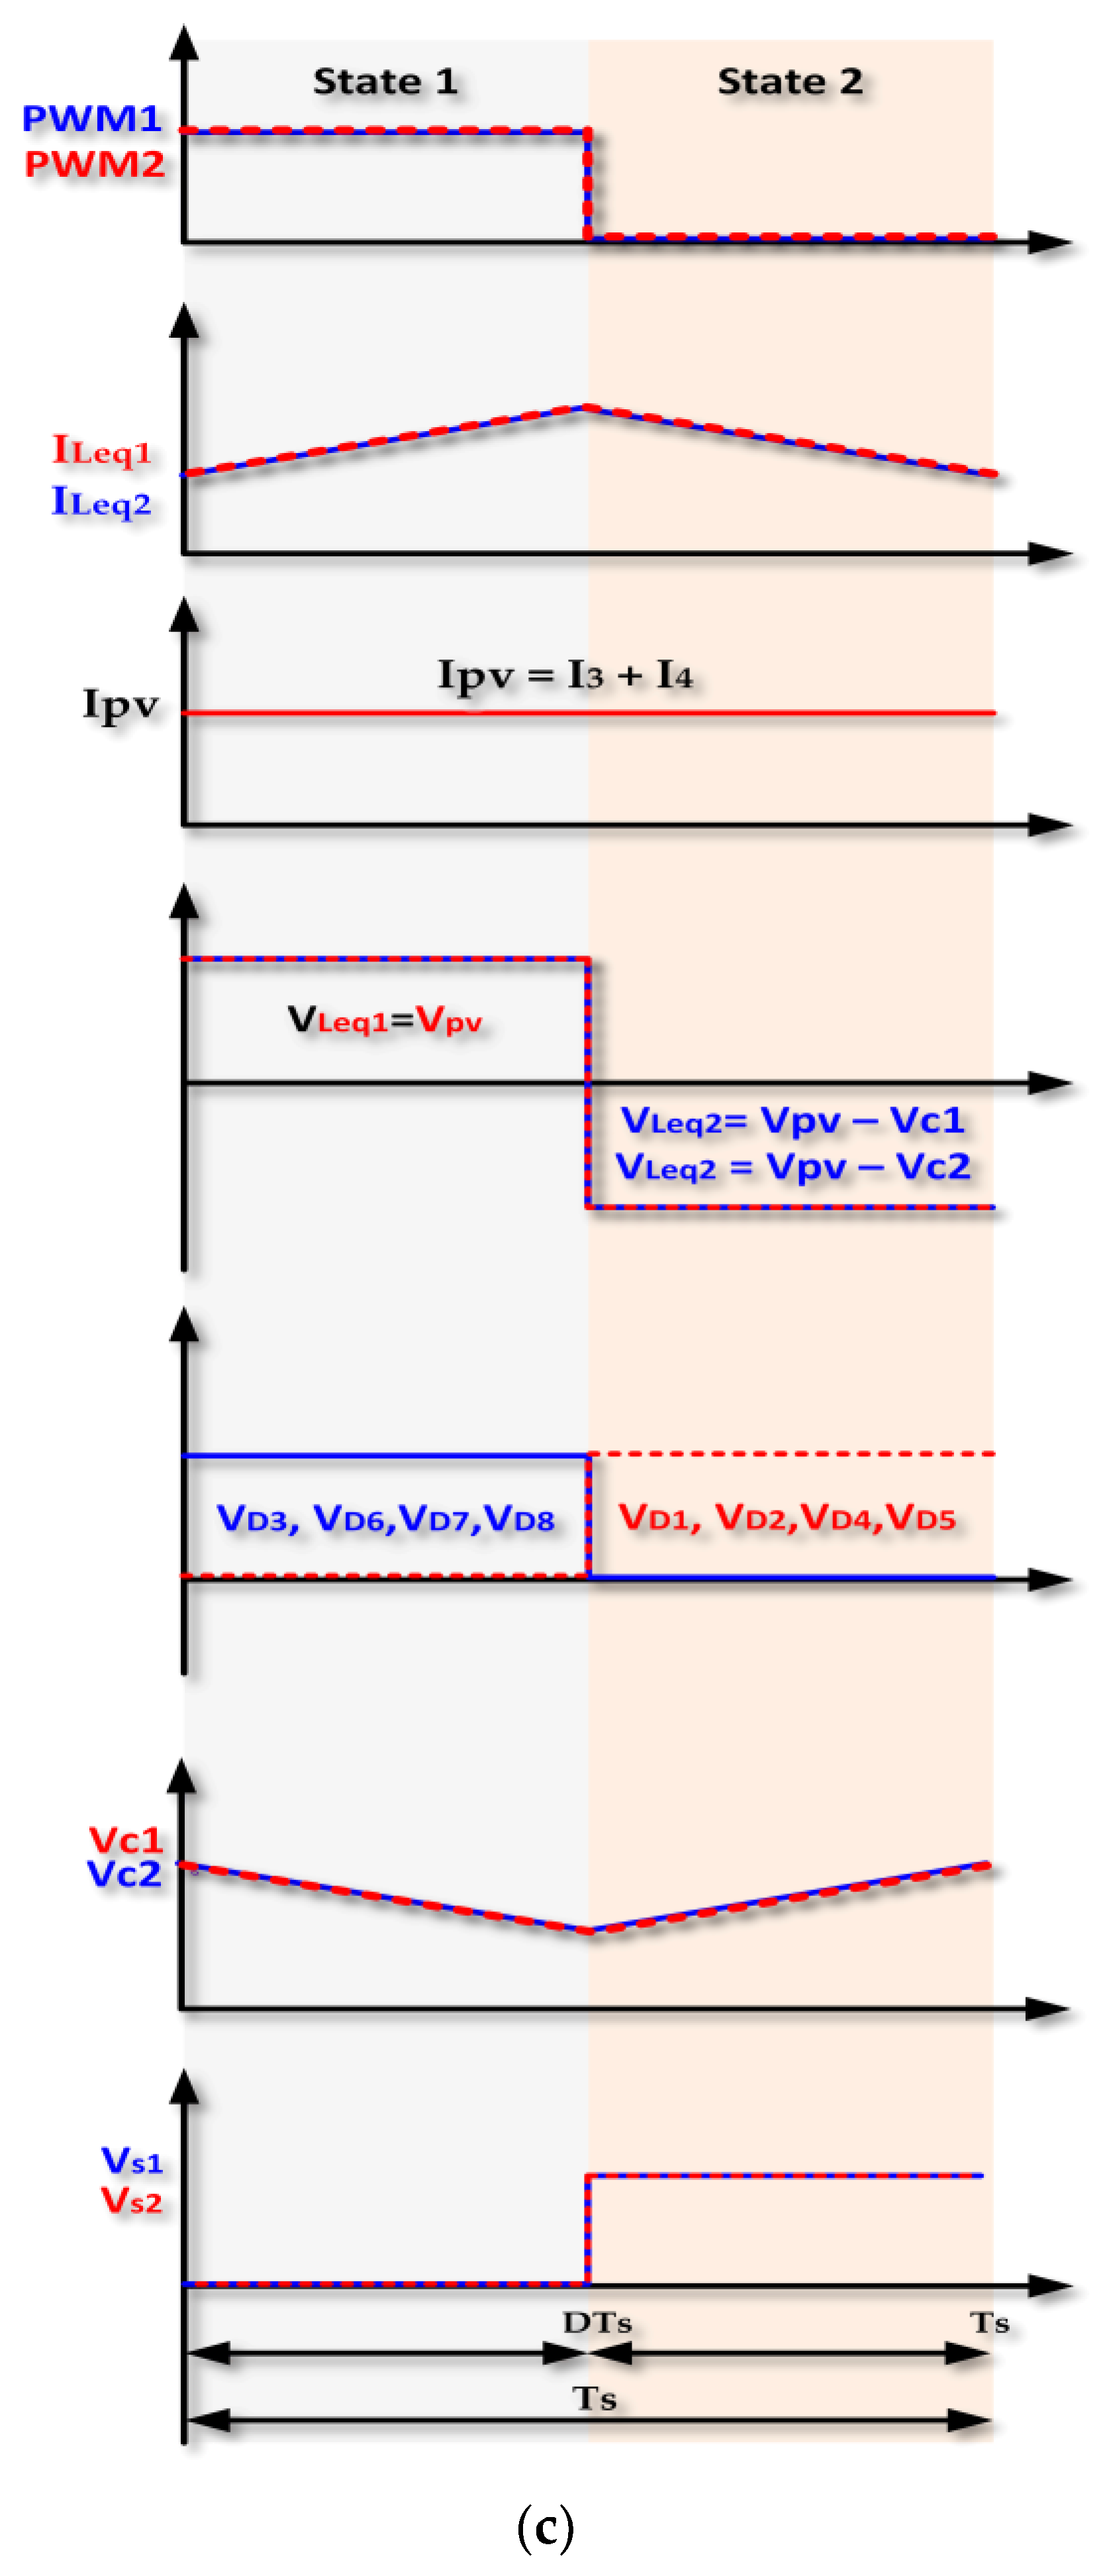
3.2. Considered DC-DC Converter Topology and Operating Analysis Based on Continuous Conduction Modes
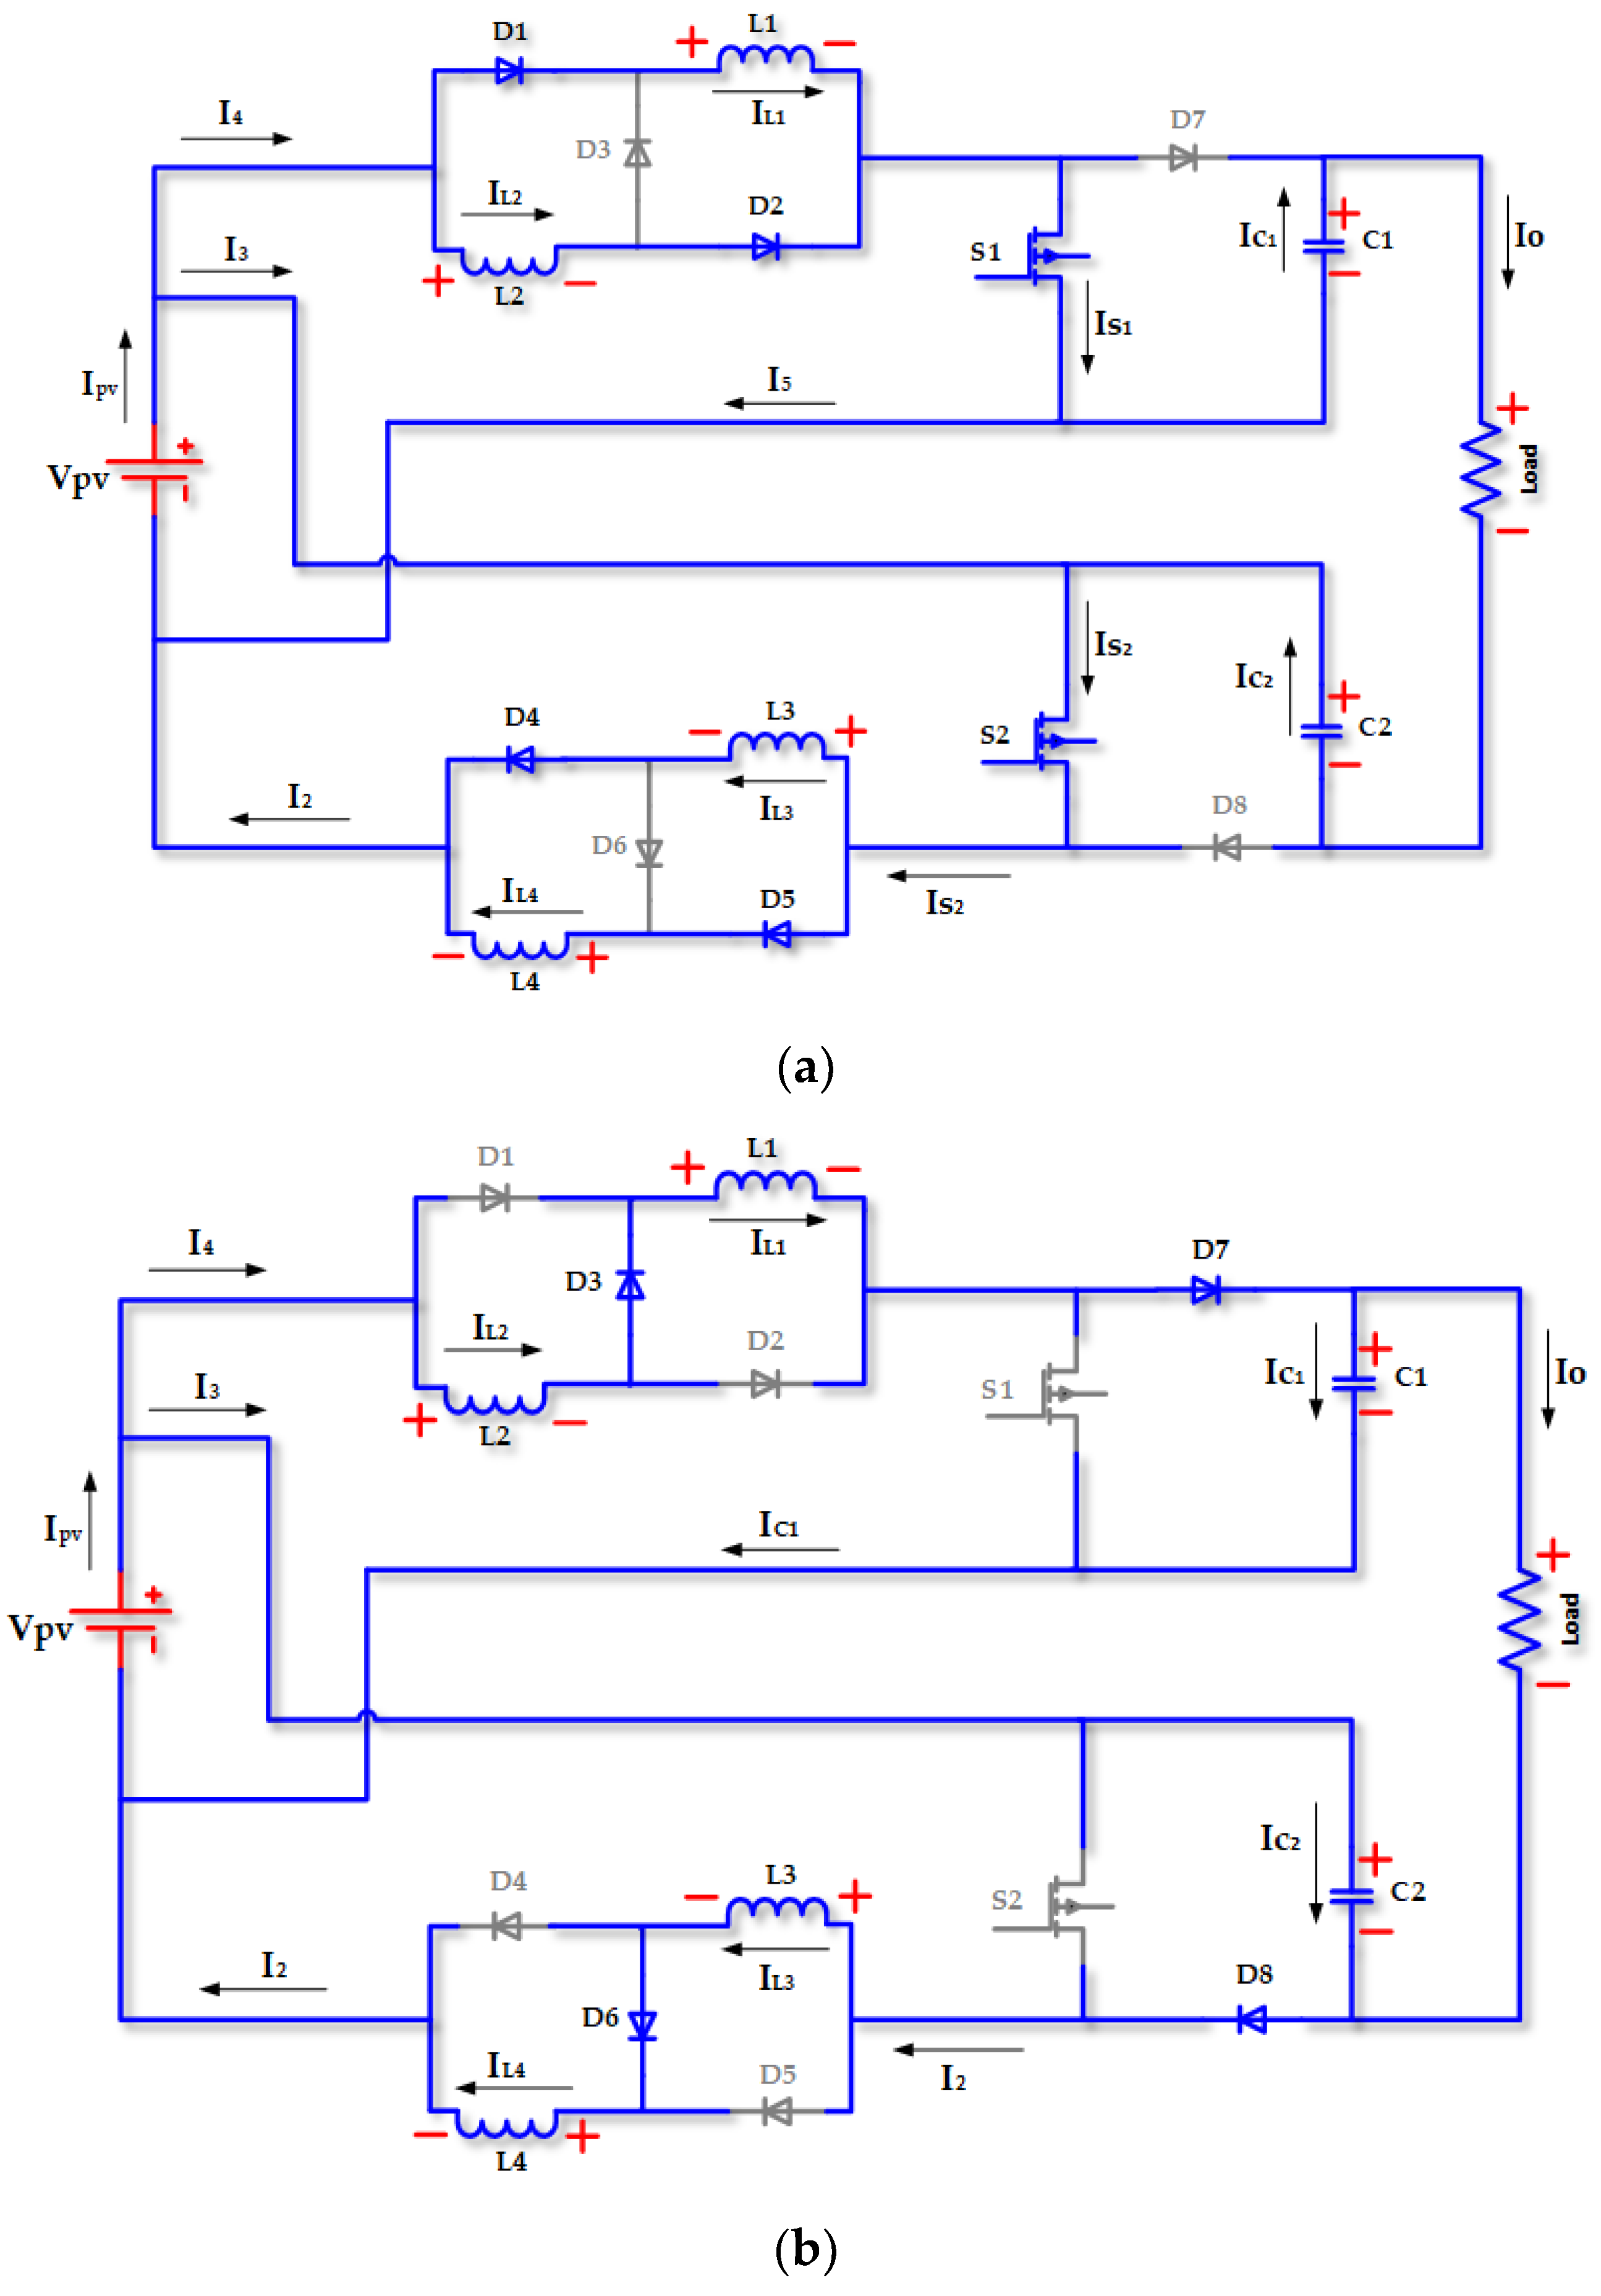
The symmetrical boost converter enables a low input current and output voltage ripple during in-phase and anti-phase switching. This characteristic also confers advantages, including the reduction in size of inductors, floating DC-bus capacitors and the constraints on the power semiconductors (switches) to adapt them to the current limits of the various technologies in the market. Although belonging to the same topology, the model presented in Figure 9 offers many more advantages, including its low number of capacitors and its ability to reduce current stresses during a half-period of the switching control duty cycle [40]. In addition, one of the prospects not elucidated in the literature is the continuous conduction operation mode and its application to a high-power PV system.
The SHVG boost converter model is obtained from the operating sequences analysis in continuous conduction mode. The equations corresponding to the two operating states of the power transistors give the model of the SHVG boost converter.
(a)
State 1 (0 < t < DTs)
During State 1, the power transistors S1 and S2 are closed, and the corresponding equivalent circuit is presented in Figure 10a. In this state, the diodes D3, D6, D7 and D8 are blocked, the paired inductors (L1, L2) and (L3, L4) will be, respectively, in parallel, and C1 discharges to the load, while C2 discharges to inductors L3 and L4 via switch S2. Then, the diodes D1, D2, D4 and D5 are in conduction mode. For this sequence, the equivalent inductor Leq1 can be expressed as shown in Equation (9).
L e q 1 = L 1 2 = L 3 2 L 1 = L 2 = L 3 = L 4
The voltages across the inductors are calculated using Equation (10).
V L 1 = V L 2 = V L 3 = V L 4 = V p v V L 1 = L e q 1 × d I 4 d t = L e q 1 × d I s 2 d t = V L 3
The voltages across the capacitors and the diodes are, respectively, given in Equations (11) and (12).
V C 1 + V C 2 = V 0 + V p v
V D 3 = V L 1 = V L 2 V D 6 = V L 3 = V L 4 V D 7 = V C 1 V D 8 = V C 2
The expressions for the various currents based on the equivalent circuit presented in Figure 10a are shown in Equation (13).
I 1 = I 4 + I 3 I 1 = I 2 + I 5 I 2 = I 3 + I C 2 I 4 = 2 I L 1 = 2 I L 2 I 2 = 2 I L 3 = 2 I L 4 I S 1 = I 4 = I 5 + I C 1 I 5 = I 3 I C 1 = I C 2 = I 0
(b)
State 2 (D × Ts < t < Ts):
During State 1, the power transistors S1 and S2 are open as presented in Figure 10b. The diodes D1, D2, D4 and D5 are blocked, and the paired inductors (L1, L2) and (L3, L4) are, respectively, in series. The C1 and C2 capacitors store energy from the source. At the same time, diodes D3, D6, D7 and D8 are in the conduction mode. For this sequence, the equivalent inductor Leq1 can be computed as shown in Equation (14).
L e q 2 = L 1 + L 2 = L 3 + L 4 L 1 = L 2 = L 3 = L 4
The voltages across the inductors are calculated using Equation (15).
V S 1 = V C 1 V S 2 = V C 2 V L 1 + V L 2 = V p v V C 1 V L 3 + V L 4 = V p v V C 2
The voltages across the capacitors are presented in Equation (16), and those of the diodes are shown in Equation (17).
V C 1 + V C 2 = V 0 + V p v
V D 1 = V L 2 V D 2 = V L 1 V D 4 = V L 4 V D 5 = V L 3
The expressions for the various currents based on the equivalent circuit presented in Figure 10b are given in Equation (18).
I 1 = I 4 + I 3 I L 1 = I L 2 = I D 7 I C 1 = I 4 I 0 I C 2 = I 2 I 0 I 1 = I 2 + I C 1 I 2 = I L 3 = I L 4
According to the periodical current in the inductor during the switching period, the sum of the voltages at these terminals is zero after each cycle. On the basis of this statement, we can determine the average voltage across the inductors based on Figure 10a,b. The currents and voltage wave forms based on the SHVG boost converter operating sequences analysis are presented in Figure 10c.
Due to the periodical behavior of the current in an inductor during the switching period, the average voltage across the inductors is zero, as given in Equation (19).
{ D × V Leq 1 + ( 1 D ) × V Leq 2 = 0 V Leq 2 = V pv V C 1 = V pv V C 2 , V L e q 1 = V p v
From Equations (10), (11) and (15), we can determine the voltages across the capacitors as given in Equation (20).
V C 1 = 1 + D 1 D × V p v V C 2 = 1 + D 1 D × V p v
The final expression of the voltage gain is presented in Equation (21), where the same duty cycle is applied to both switches, and then the circuits of converters 1 and 2 show similar operating states.
G = V o V p v = V C 1 V p v + V C 2 V p v 1 G = 1 + 3 × D 1 D
In other words, the charge and discharge times of the DC-bus capacitors are identical, the only difference being that the current from capacitor C2 does not flow through the load, but its voltage does contribute to the output voltage. This situation can lead to a power imbalance between the two converter circuits. The average current in the load can be computed using Equation (22).
I 0 = 1 D 1 + 3 × D × I p v
Figure 11a,b present the two converters’ (1 and 2) operating modes.
The performance of the SHVG boost converter compared to the classic boost converter in terms of the voltage gain as a function of the duty cycle is illustrated in Figure 12. This figure shows that the SHVG boost converter achieves a voltage gain of 5 with a duty cycle of 0.5, while the conventional boost converter achieves it with a duty cycle of 0.8. This is an advantage of the SHVG boost converter, as it enables high voltages to be obtained with a low duty cycle.

3.3. Passive Components-Based Inductors and Capacitances Sizing

Equation (23) represents the expression of the equivalent inductive tension. Following the operational sequences illustrated in Figure 10c and applying the mesh law to Figure 11a,b, we can derive the corresponding equations for each sequence.
V L e q = L e q × d d t ( i L e q )
The current ripples from the differential equations based on State 1 (0 < t < D*Ts) and State 2 (D*Ts < t < Ts) are, respectively, given in Equation (24).
Δ i L e q 1 = V L e q 1 L e q 1 × D × T s Δ i L e q 2 = V L e q 2 L e q 2 × 1 D × T s
Using Equations (19) and (24), the expressions of the current ripples in the inductors can be written as presented in Equation (25).
Δ i L e q 1 = D × V p v L e q 1 × f Δ i L e q 2 = D × V p v L e q 2 × f
The inductors corresponding to State 1 (0 < t < D × Ts) and State 2 (D × Ts < t < Ts) are, respectively, given by Equation (26).
L e q 1 = D × 1 D 2 × 1 + 3 × D × V 0 Δ i L e q 1 × f = k L e q 1 × V 0 Δ i L e q 1 × f L e q 2 = 4 × D × 1 D 1 + 3 × D × V 0 Δ i L e q 2 × f = k L e q 2 × V 0 Δ i L e q 2 × f
The inductors are at maximum for the maximum values of k L e q 1 , k L e q 2 which can be obtained by considering the derivative equation of Equation (26) as the function of the duty cycle D is zero, as translated by Equation (27).
d L e q 1,2 d D = 3 D 2 + 2 D 1 1 + 3 D 2 × V 0 Δ i L e q 1,2 × f = 0
A physical possible solution of Equation (27) is D = 0.33, and this last one gives the maximum values of kLeq1,max = 0.0055 and kLeq2,max = 0.44 as shown in Figure 13. Considering a DC-bus voltage of 1350 V with a control frequency of 10 kHz, and maximum PV current of 755 A with a current ripple rate of 1% (ΔiLeq1 = ΔiLeq2 = 7.5 A), the maximum values of the inductors in the two half-periods are given in Equation (28). Using Equations (9), (14) and (28), the maximal values of the inductors (L1max, L2max, L3max, L4max) corresponding to SHVG boost converter operating State 1 (0 < t < D × Ts) and State 2 (D × Ts < t < Ts) are, respectively, given in Equation (29), where L1max = L2max = L3max = L4max.
L e q 1 , m a x = 0.055 × 1350 7.5 × 10000 = 0.99   m H L e q 2 , m a x = 0.44 × 1350 7.5 × 10000 = 7.92   m H
{ L 1 max = 2 × L e q 1 , m a x = 1.98   mH   for   State 1 L 1 max = L e q 2 , m a x 2 = 3.96   mH    for   State 2   L 1 = L 2 = L 3 = L 4 L 1 m a x + L 1 m a x 2
The final values of the inductors (2.97 mH) are chosen from the average of the two maximum inductors as presented in Equation (29). The DC-bus voltage is fixed according to the MPPT voltage range of the inverter-based 4 MVA power rating, which varies between 933 V and 1350 V.
Considering the expressions of the currents in the capacitors (C1, C2) given in Equations (13) and (18), and by applying the principle of the capacitors’ charge and discharge, we obtain Equation (30). The relations between the converter input currents (I2, I4), and its output current I0 are derived by solving the system of equations presented in Equation (30).
{ D × ( I 0 ) + ( 1 D ) × ( I 4 I 0 ) = 0 D × ( I 0 ) + ( 1 D ) × ( I 2 I 0 ) = 0 ,   I 4 = I 0 1 D I 2 = I 0 1 D
Since both capacitors have the same operating modes in the different half-periods, State1 only is considered for the capacitors’ sizing. Considering the converter operating in State 1 with non-zero initial voltage condition, and solving the basic differential equation due to the capacitor, we obtain the expression of the voltage ripples ΔVc across the capacitors as shown in Equation (31), where the final expression of the capacitors is given.
Δ V C = V C m a x V C m i n Δ V C = I c C × D × T s V C = V C 1 = V C 2 I C 1 = I C 2 C = C 1 = C 2 = I 0 Δ V C × f × D 933   μ F
Considering a voltage ripple rate of 0.6% of the desired DC-bus voltage fixed to 1350 V, the value of the voltage ripple across the capacitors will be ΔVc ≈ 8 V. The final value of the capacitors based on Equation (31) with a converter control signal frequency of 10 kHz and duty cycle of 0.5 is about 933 μF.

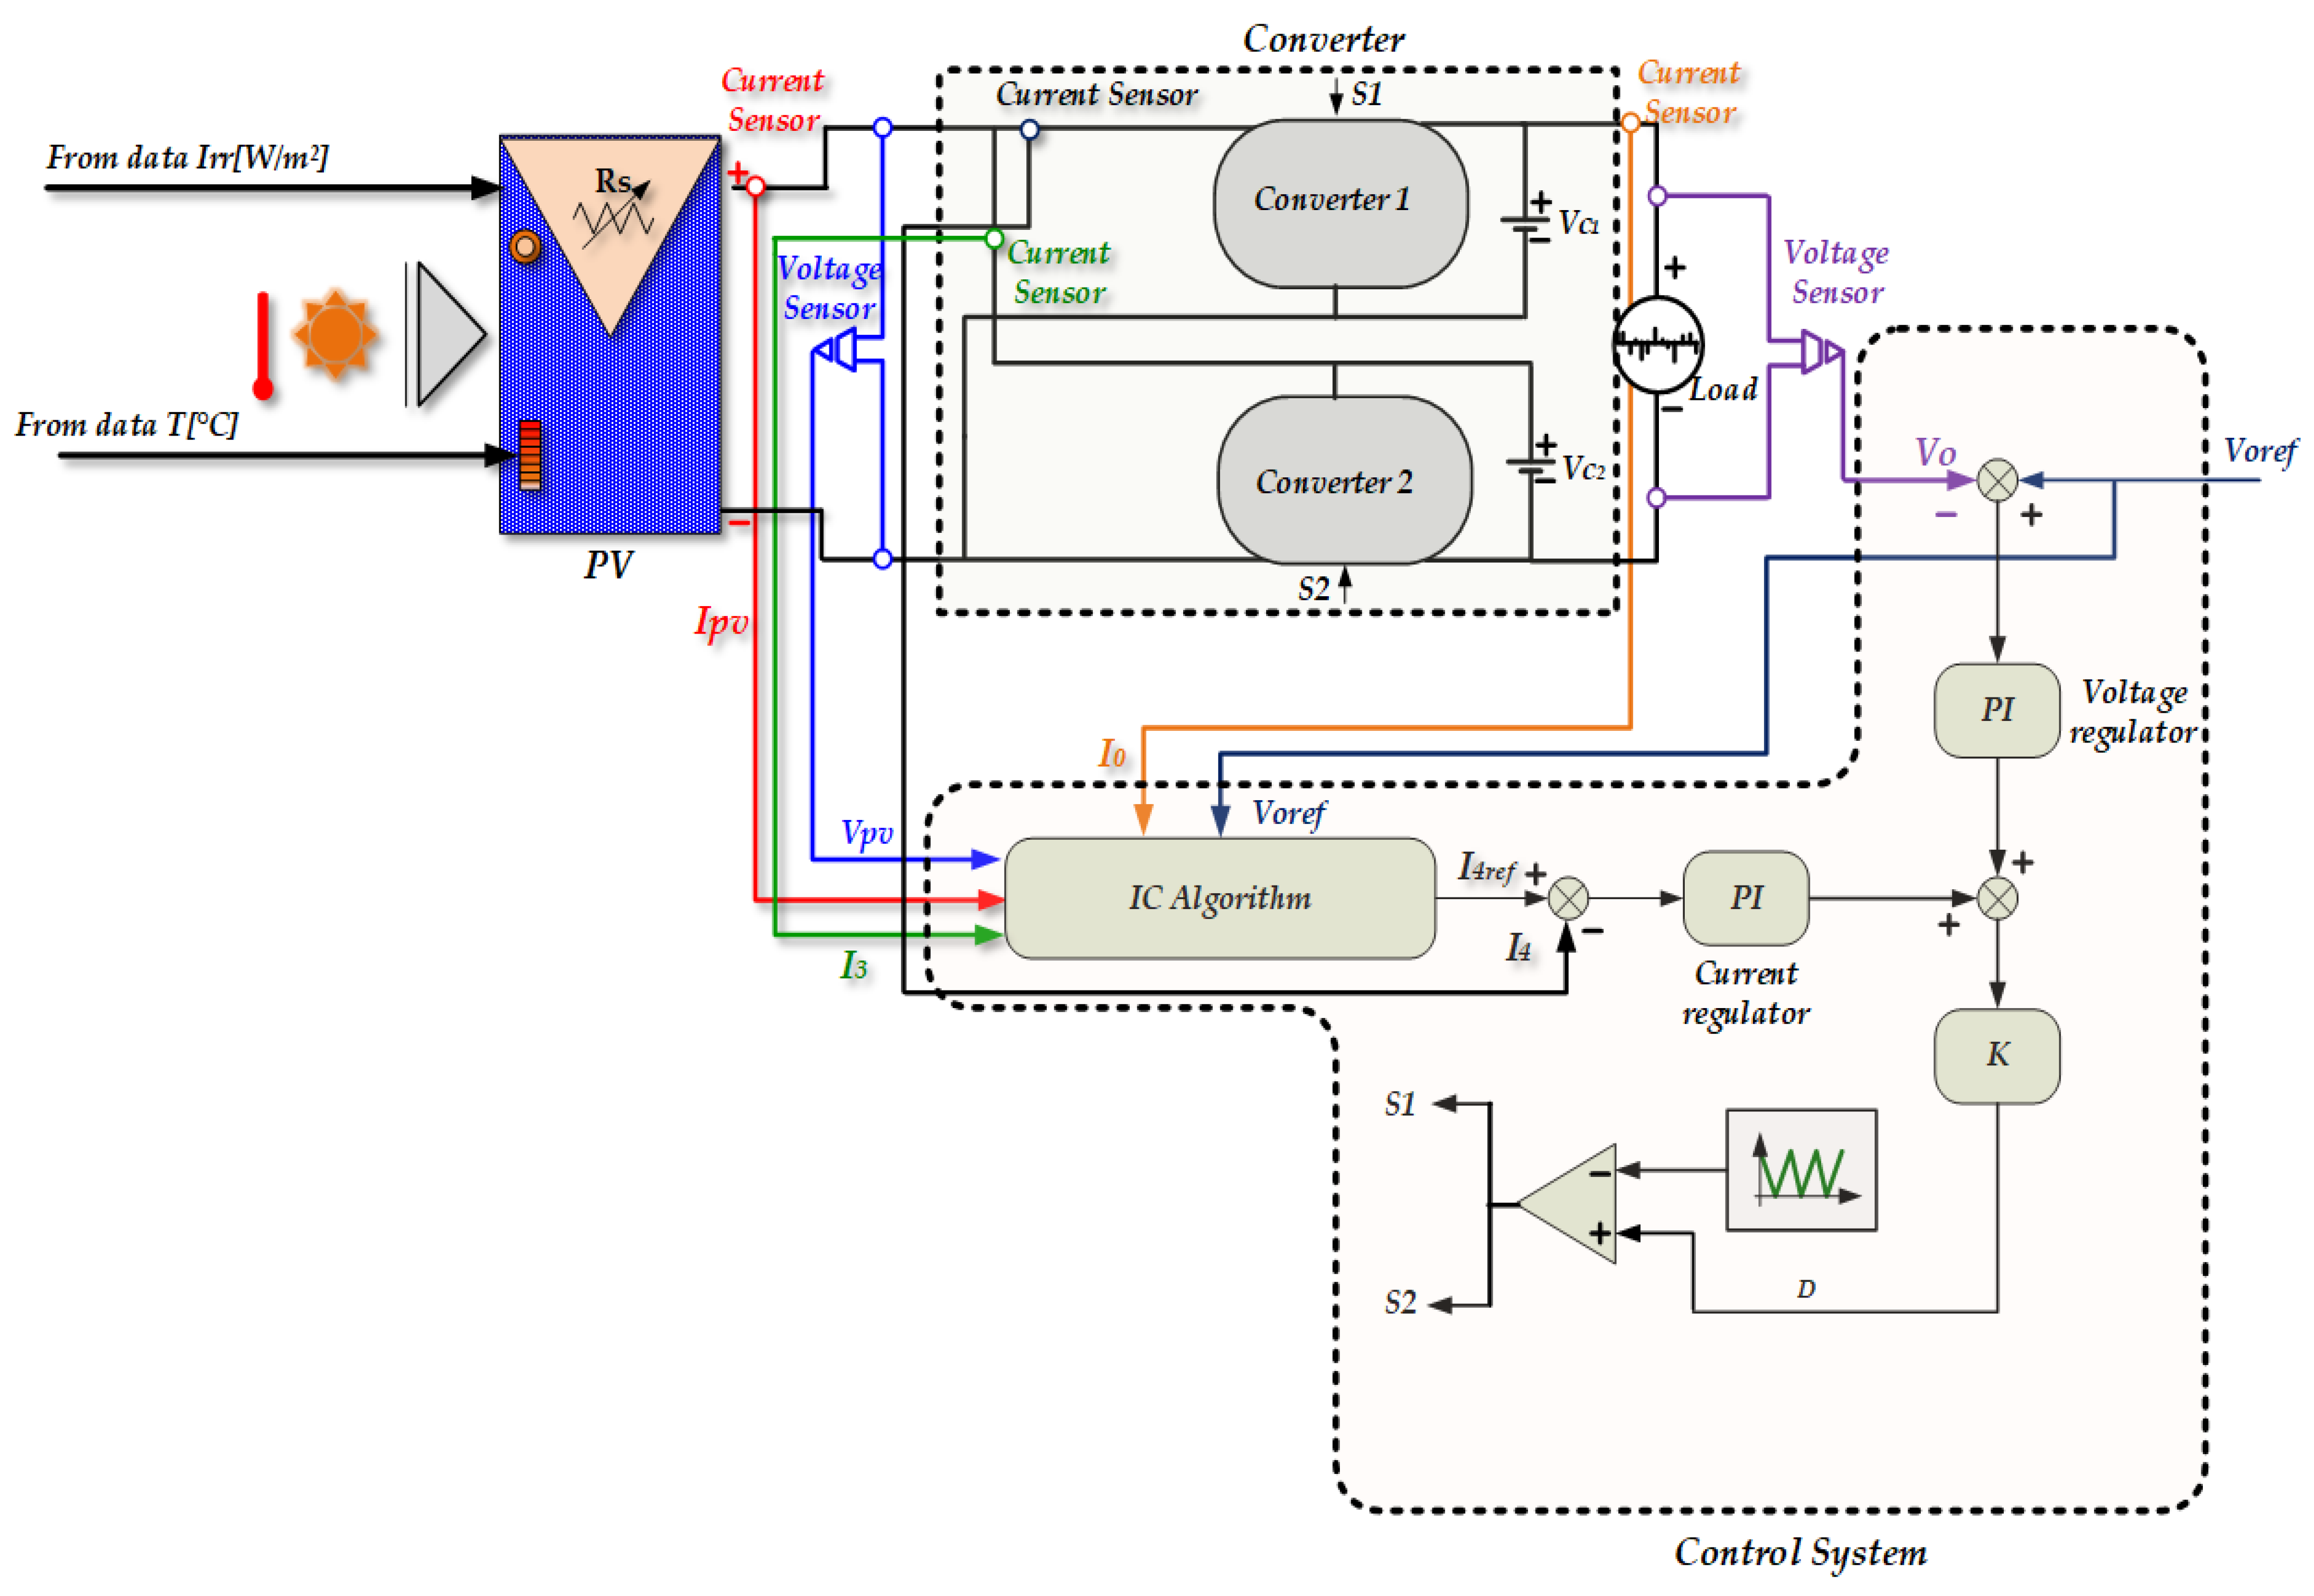
4. PV System Control Strategy

In the literature, several PV system control methods are proposed. In [55], for example, a three-level boost converter control system combined with the MPPT algorithm for maximum power extraction from PV systems is highlighted. Two switches are controlled in phase opposition, the first by a duty cycle derived from the MPPT and the second by the combination of the MPPT duty cycle and the error caused by the voltage imbalance between the two DC-bus capacitors. This error is attenuated through an integrator and added to the MPPT duty cycle to control the second switch in order to maintain the voltage balance between the two DC-bus capacitors. This approach is also used in [56,57] with a DC-DC buck/boost with the polynomial control method for the DC-bus voltage stabilizing including the maximum power point tracking of the PV.

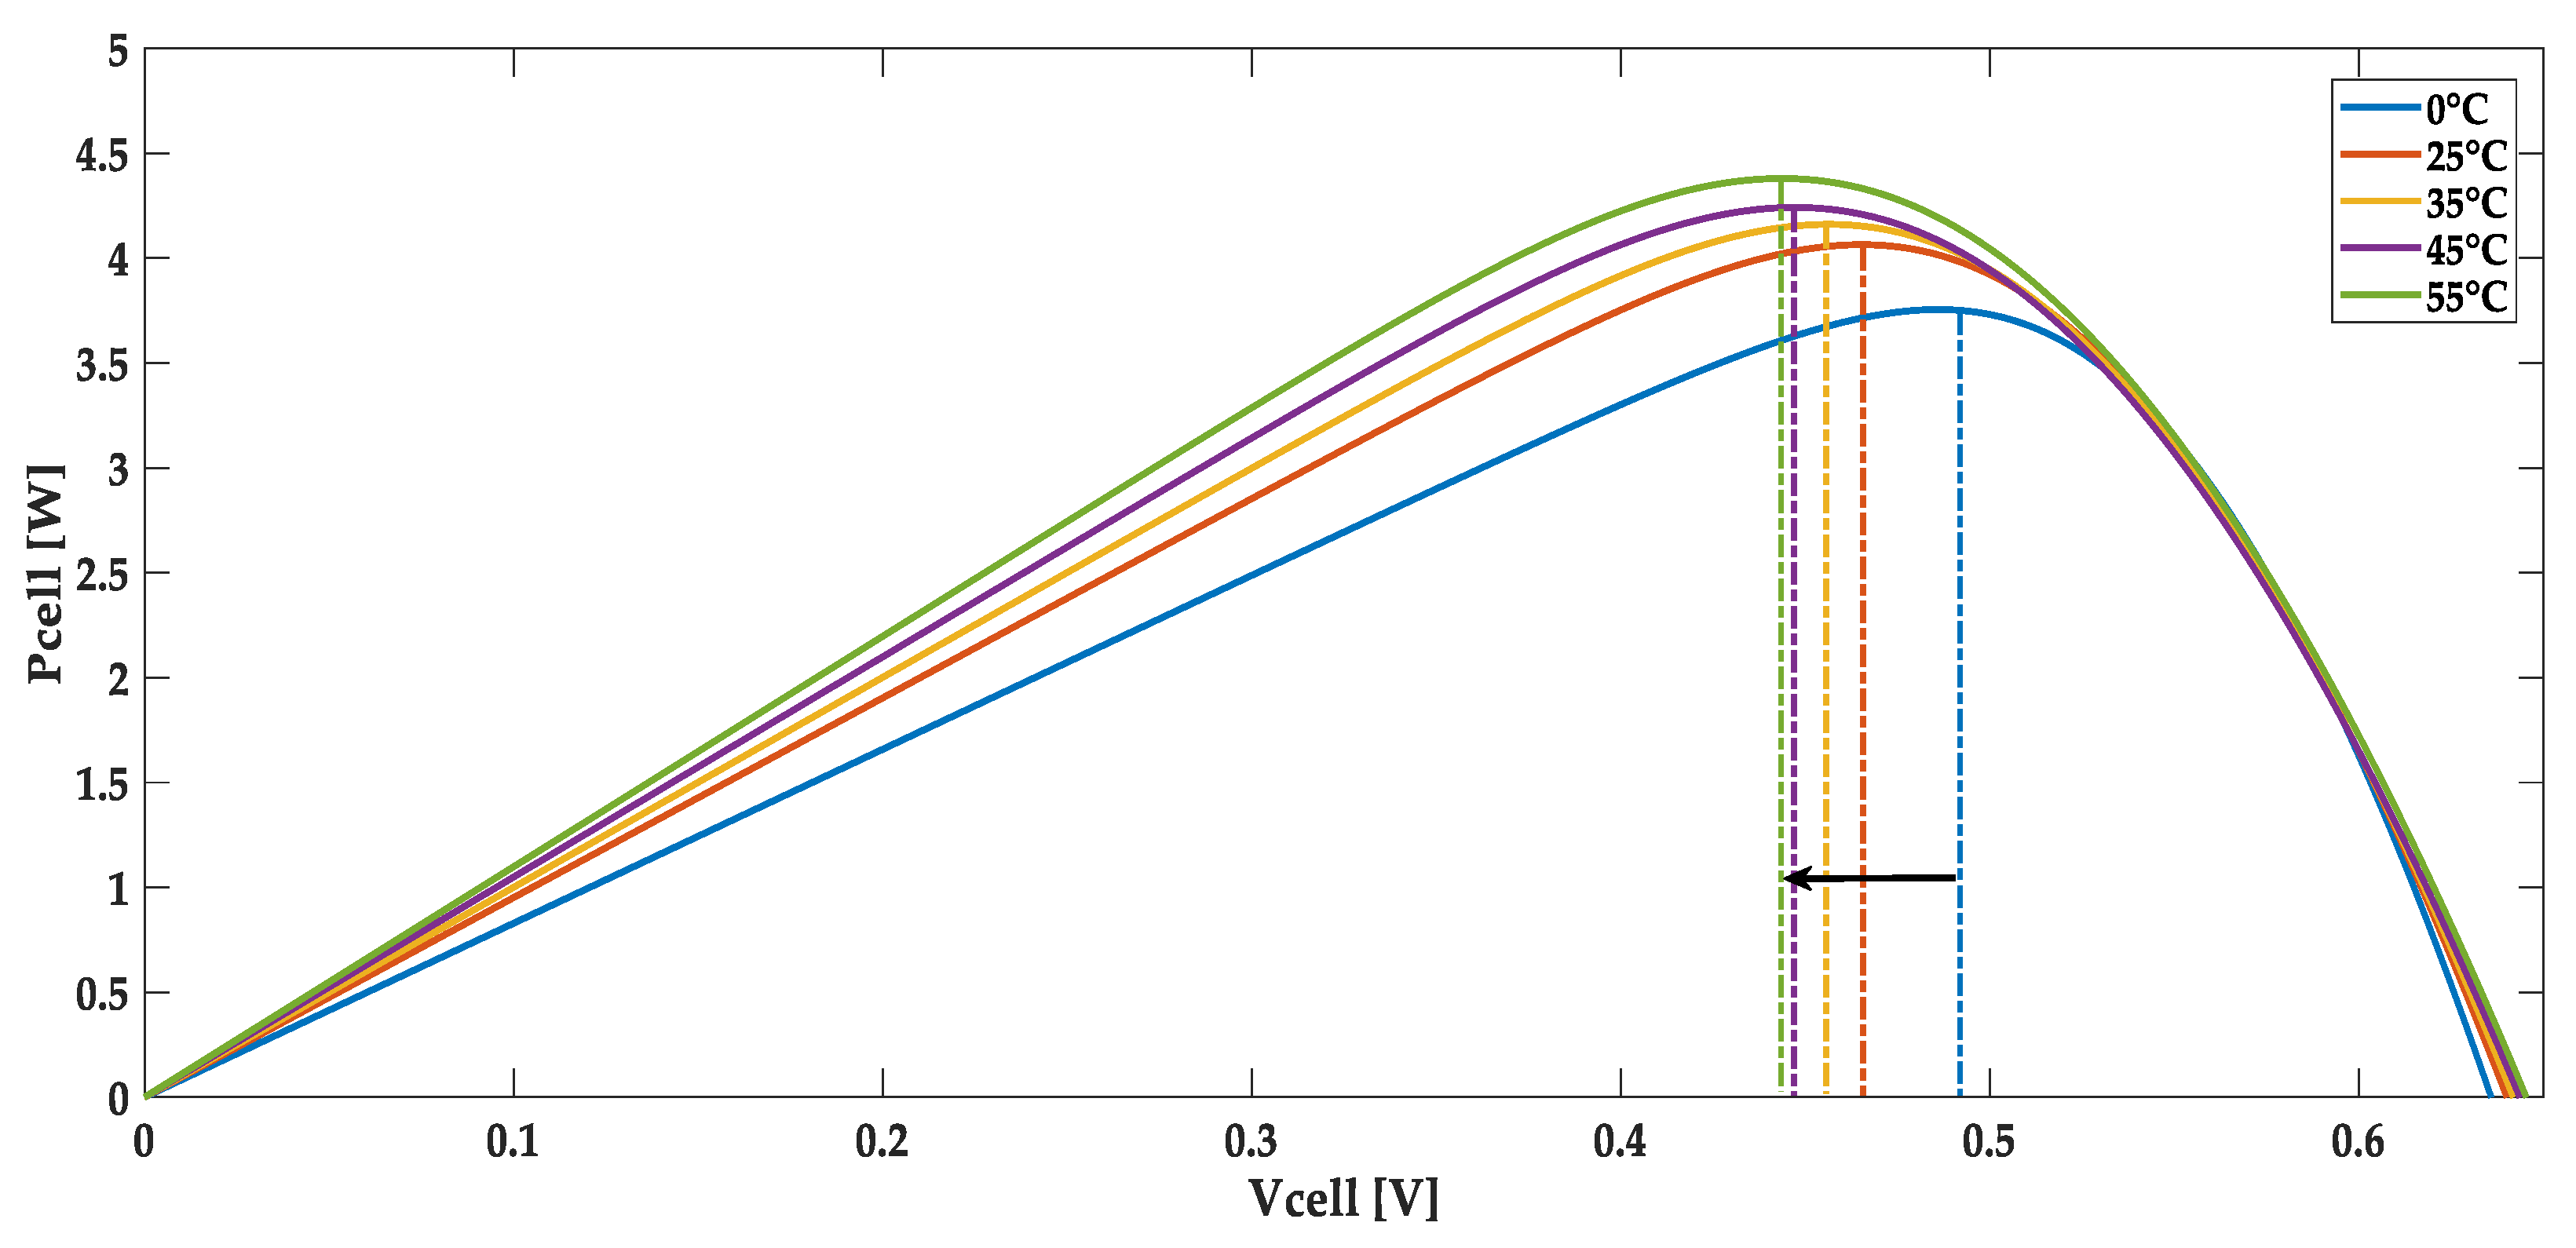
4.1. PV System MPPT Control in the Presence of Irradiance and Temperature Variations

For maximum power extraction in photovoltaic solar panels, we propose the conductance increment algorithm based on the current reference generation in a manner analogous to the methodology employed in [58]; the reference is generated by an algorithmic approach combining the fractional short-circuit current (FSCC) with a predictive control strategy. This reference is calculated from the DC-bus current and voltage measurements, the PV voltage and the current of the differential connection circuit that does not pass through the load. The advantage of this method compared to that with the reference voltage is that we can control the current in the inductors of the direct connection circuit which supply the load. This will also facilitate the sizing of the PI controllers for the PV system. This is a powerful algorithm, widely used to optimize the production of the photovoltaic systems. The principle is based on varying the conductance of the PV system by evaluating at each incremental step its conductance relative to the previous value. The flowchart of the proposed algorithm for the current reference generation is illustrated in Figure 14. Irradiance and temperature data are obtained from an open access database given in [59] for average annual sunshine from 2017 to 2022 based on the Dialakoro pilot site (Latitude: 11.46, Longitude: −8.91) in the Republic of Guinea. The collected data are used with the conductance increment algorithm to evaluate the performance of the proposed control method.

4.2. DC-Bus Voltage and Current Control Strategies

The proposed control strategy of the PV system is based on the DC-bus voltage control associated with an indirect control of the PV current, based on the Incremental Conductance Algorithm (IC Algorithm) which generates the reference current I4,ref as presented in Figure 14. The output of the IC Algorithm is compared to the measured current in the input of converter 1. The error is adjusted through a current regulator-based PI controller to generate a partial duty cycle component as shown in Figure 15. The second component of the duty cycle D is obtained from the DC-bus voltage control loop as illustrated in Figure 15. The transfer functions from the differential equations-based inductor and capacitor are, respectively, given as 1/(L × P) and 1/(C × P) where L is the inductor, C is the capacitor and P is the Laplace variable. Based on these transfer functions and the PI controllers’ sizing method described in [60,61], we obtain the coefficients of the controllers as presented in Equation (32), where L = L1, and C = C1.
k p i = L × ω n 2 k i i = L × ω n × 2 × ε k p v = C × ω n 2 k i v = C × ω n 2 × 2 × ε   ,   ω n = 2 × π × f 10 ε = 2 2 τ i , v = k p i , v k i i , v
Due to the variations in the equivalent inductor of the converter during each operating sequence (State 1 and State 2), different values of kpi and kii are possible with the same time constant. In this paper, we adopted the maximum value of the equivalent inductor (2 × 2.97 mH) to obtain the larger values of kpi and kii to guarantee the efficiency, stability and fast control of the system.

5. Simulation Results

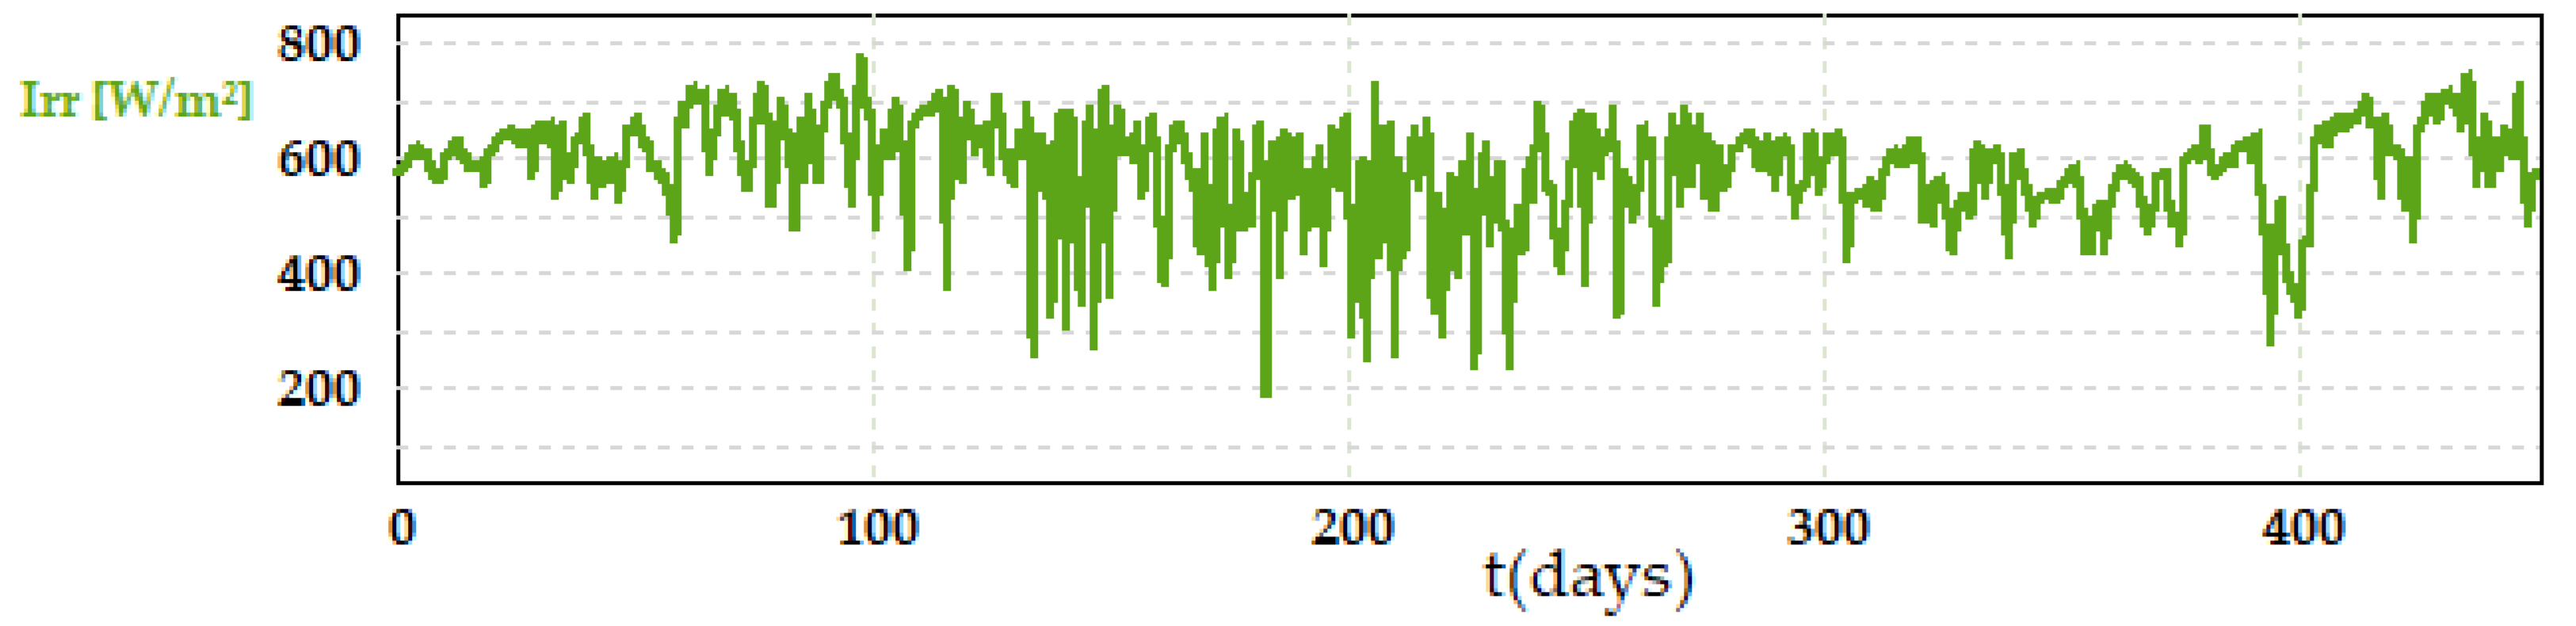
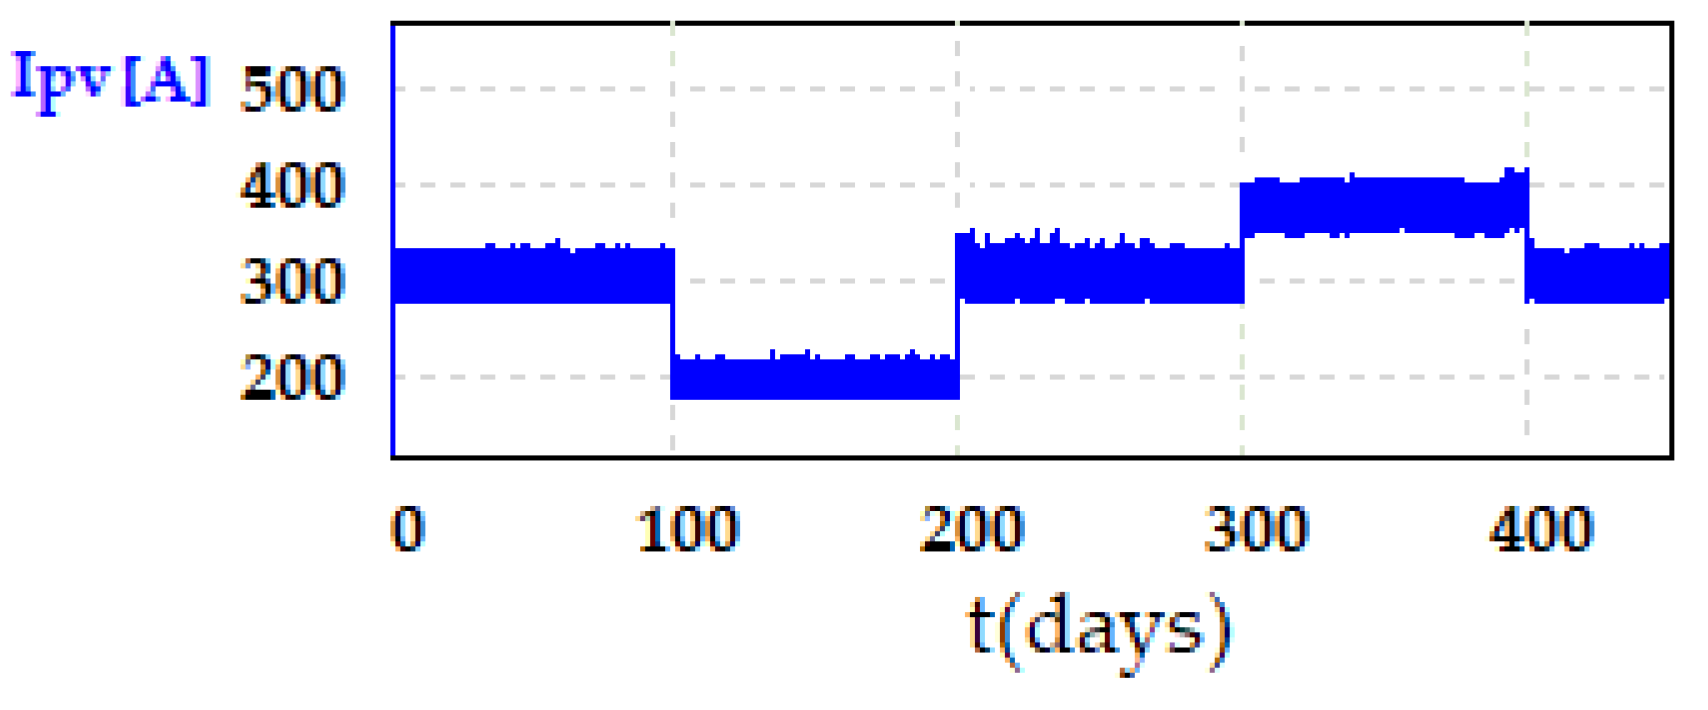
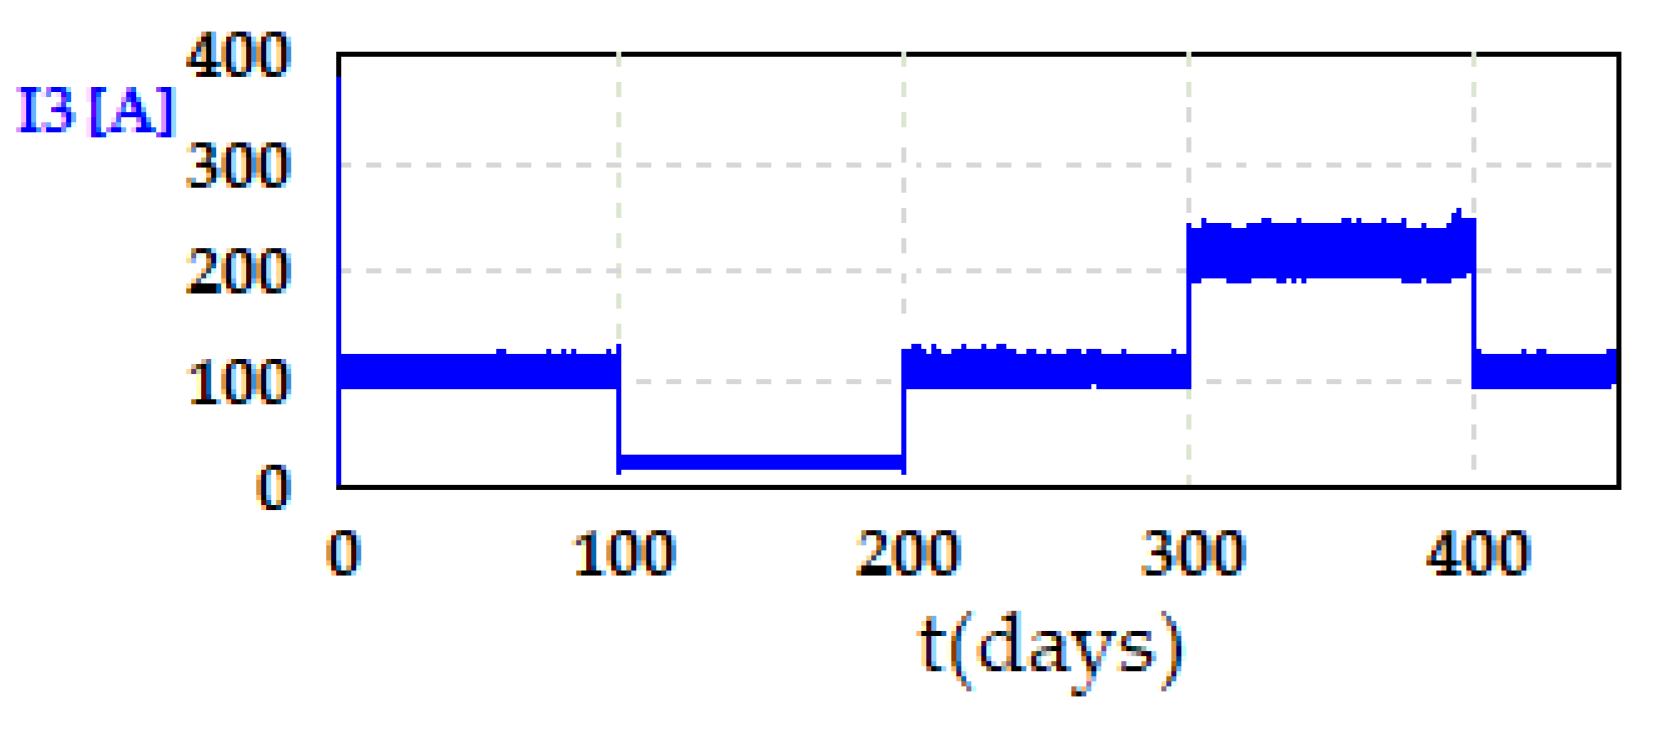
5.1. Simulation Conditions

To perform the PV system simulations, we consider the solar irradiance and the temperature from the Dialakoro pilot site (Latitude: 11.46, Longitude: −8.91) in the Republic of Guinea. The data are collected from January 2017 to December 2022, from an open access database given in [58]. Solar irradiance obtained from the database is presented in Figure 16, and that of the temperature is shown in Figure 17. These curves show the dynamic fluctuations according to the seasons and a periodical cycle based on the year. The computed series resistance of the PV system using the solar irradiance, the temperature and Equation (1) is plotted in Figure 18, where the wave form is similar to that of the temperature. In other words, the impact of the temperature is more significant compared to that of the solar irradiance. Solar irradiance and temperature presented, respectively, in Figure 16 and Figure 17 will be used as input data of the PV system simulations.
The PV system sizing is conducted for 204 kW pick power, considering an SHVG boost converter with an input voltage of 270 V and output of 1350 V. Simulations are performed for two scenarios based on the variable DC-bus voltage reference and variable load using the parameters presented in Table 4.

5.2. Simulation Results Based on DC-Bus Voltage Reference Sudden Change

Figure 19 shows the DC-bus voltage reference Voref compared to the measured DC-bus voltage VO. The reference value has been set at 1150 V from 0 to 100 days, 736 V from 100 to 200 days, 1150 V from 200 to 300 days, 1386 V from 300 to 400 days and 1150 V from 400 to 450 days. Figure 19 shows a good correlation between the measured DC-bus voltage and its reference. Figure 20 shows the voltages across the DC-bus capacitors (C1, C2). It can be seen that the voltage is balanced and varies in the same direction as the DC-bus voltage. Figure 21 shows the load’s current, which is maintained at 85 A during the simulations in all conditions. Figure 22 shows the current I4 from converter 1 and its reference I4ref. It can be seen that the measurement follows the reference current. The I3 current in converter 2 is shown in Figure 23. The sum of the currents from converters 1 and 2 is equal to the current supplied by the PV system Ipv, as illustrated in Figure 24.

5.3. Simulation Results Based on the Load’s Current Sudden Change

The load’s current profile is depicted in Figure 25, and is set to 85 A from 0 to 100 days, 20 A from 100 to 200 days, 85 A from 200 to 300 days, 165 A from 300 to 400 days and 85 A from 400 to 450 days. During the load’s current variations, the DC-bus voltage VO and its reference Voref are maintained at a constant level as shown in Figure 26. The same observations are found in Figure 27, where the voltages across the DC-bus capacitors C1 and C2 are the same. The current at the input of the converter I4 and its reference I4ref are compared as shown in Figure 28. The measured current I3 on converter 2 varies according to the load’s demand as shown in Figure 29. Figure 30 illustrates that the sum of the currents from the two converters (1 and 2) is equal to the current supplied by the PV system Ipv. These simulation results demonstrate the effectiveness of the proposed control strategy despite the constraints imposed by the load’s variations.

6. Conclusions

This paper presents a new generation of differential-connected multilevel boost converters and a control strategy for photovoltaic applications. An in-depth study of its operation and ability to manage the power with less stress on the coils and semiconductors is performed. The voltage gain of the converter depends on the used duty cycle of the transistors’ control, i.e., a high value of the duty cycle gives a high voltage gain. To evaluate the converter’s performance, a PV model-based voltage is developed considering a nominal power of 204 kW. The passive component (inductors and capacitors) sizing method is proposed based on the converter operating sequences’ analysis. PSIM software 2023.0 is used for the PV system simulations in closed-loop conditions, based on two PI controllers for DC-bus voltage and current control. The first loop is designed to stabilize the DC-bus voltage, while the second is assigned to the PV current indirect control using the current’s reference from the increment conductance algorithm. To evaluate the performances of the PV system control, two scenarios of the simulations are conducted. The results of the various tests show the performances of the proposed control strategy in maintaining the stability of the DC-bus voltage in dynamic operating conditions of large-scale photovoltaic systems. The converter under consideration offers considerable potential for addressing the integration challenges associated with large-scale photovoltaic systems for future industrial applications.

Author Contributions

Conceptualization, M.L.T.; methodology, M.L.T. and M.B.C.; software, M.L.T.; formal analysis, M.L.T.; data curation, M.L.T. and M.B.C.; writing—original draft preparation, M.L.T. and M.B.C.; writing—review and editing, M.L.T., M.B.C. and B.D.; visualization, M.B.C. and B.D.; supervision, M.B.C. and B.D.; project administration, M.B.C. and B.D. All authors have read and agreed to the published version of the manuscript.

Funding

This research received no external funding.

Data Availability Statement

Data is contained within the article.

Acknowledgments

This work was supported by the Guinean government through its Ministry of Higher Education, Scientific Research and Innovation (MESRI), and Normandy region in France.

Conflicts of Interest

The authors declare no conflicts of interest.

Abbreviations

ACAlternative current
CEquivalent capacity chosen
CCDirect current
CO2Carbon dioxide
IC algorithmConductance increment algorithm
PVPhotovoltaic
MPPTMaximum power point tracking

References

  1. Meshael, H.; Elkhateb, A.; Best, R. Topologies and Design Characteristics of Isolated High Step-Up DC–DC Converters for Photovoltaic Systems. Electronics 2023, 12, 3913. [Google Scholar] [CrossRef]
  2. Siirola, J.J. Speculations on global energy demand and supply going forward. Curr. Opin. Chem. Eng. 2014, 5, 96–100. [Google Scholar] [CrossRef]
  3. Watari, T.; McLellan, B.C.; Giurco, D.; Dominish, E.; Yamasue, E.; Nansai, K. Total material requirement for the global energy transition to 2050: A focus on transport and electricity. Resour. Conserv. Recycl. 2019, 148, 91–103. [Google Scholar] [CrossRef]
  4. Gielen, D.; Boshell, F.; Saygin, D.; Bazilian, M.D.; Wagner, N.; Gorini, R. The role of renewable energy in the global energy transformation. Energy Strategy Rev. 2019, 24, 38–50. [Google Scholar] [CrossRef]
  5. Ahmad, T.; Zhang, D. A critical review of comparative global historical energy consumption and future demand: The story told so far. Energy Rep. 2020, 6, 1973–1991. [Google Scholar] [CrossRef]
  6. Kober, T.; Schiffer, H.-W.; Densing, M.; Panos, E. Global energy perspectives to 2060—WEC’s World Energy Scenarios 2019. Energy Strategy Rev. 2020, 31, 100523. [Google Scholar] [CrossRef]
  7. Baqar, A.; Camara, M.B.; Dakyo, B. Energy Management in the Multi-Source Systems. Energies 2022, 15, 2713. [Google Scholar] [CrossRef]
  8. Kadri, S.M.; Bagre, A.O.; Camara, M.B.; Dakyo, B.; Coulibaly, Y. Electrical Power distribution status in West Africa: Assessment and Perspective Overview. In Proceedings of the ICRERA 2019 8th International Conference on Renewable Energy Research and Applications (ICRERA), Brasov, Romania, 3–6 November 2019; pp. 511–515. [Google Scholar] [CrossRef]
  9. Breyer, C.; Bogdanov, D.; Aghahosseini, A.; Gulagi, A.; Child, M.; Oyewo, A.S.; Farfan, J.; Sadovskaia, K.; Vainikka, P. Solar photovoltaics demand for the global energy transition in the power sector. Prog. Photovolt. Res. Appl. 2017, 26, 505–523. [Google Scholar] [CrossRef]
  10. Toure, M.L.; Camara, M.B.; Payman, A.; Dakyo, B. African Renewable Energy Potentialities Review for Local Weak Grids Reinforcement Study. In Proceedings of the 2023 11th International Conference on Smart Grid (icSmartGrid), Paris, France, 4–7 June 2023; ISBN 979-8-3503-1066-5. [Google Scholar] [CrossRef]
  11. Monteiro, J.; Pires, V.F.; Foito, D.; Cordeiro, A.; Silva, J.F.; Pinto, S. A Buck-Boost Converter with Extended Duty-Cycle Range in the Buck Voltage Region for Renewable Energy Sources. Electronics 2023, 12, 584. [Google Scholar] [CrossRef]
  12. Shahir, F.M.; Babaei, E. Application of high voltage gain DC-DC converter in photovoltaic system with energy storage. In Proceedings of the 2017 8th Power Electronics, Drive Systems & Technologies Conference (PEDSTC), Mashhad, Iran, 14–16 February 2017. [Google Scholar] [CrossRef]
  13. De Oliveira, F.J.; Ribeiro, E.K.d.B.; Luiz, A.-S.A.; Cupertino, A.F. Operation of a high gain bidirectional DC-DC converter for photovoltaic on-grid systems. In Proceedings of the 2017 IEEE 8th International Symposium on Power Electronics for Distributed Generation Systems (PEDG), Florianopolis, Brazil, 17–20 April 2017. [Google Scholar] [CrossRef]
  14. Uthirasamy, R.; Chinnaiyan, V.K.; Vishnukumar, S.; Karthick, A.; Mohanavel, V.; Subramaniam, U.; Muhibbullah, M. Design of Boosted Multilevel DC-DC Converter for Solar Photovoltaic System. Int. J. Photoenergy 2022, 2022, 1648474. [Google Scholar] [CrossRef]
  15. Barreto, L.H.S.C.; Praca, P.P.; Henn, G.A.L.; Camara, R.A.; Ranoyca, N.A.L.S.; Oliveira, D.S. High voltage gain boost converter battery charger applied to PV systems. In Proceedings of the 2011 Twenty-Sixth Annual IEEE Applied Power Electronics Conference and Exposition (APEC), Fort Worth, TX, USA, 6–11 March 2011. [Google Scholar] [CrossRef]
  16. Baddipadiga, B.P.R.; Prabhala, V.A.K.; Ferdowsi, M. A Family of High-Voltage-Gain DC–DC Converters Based on a Generalized Structure. IEEE Trans. Power Electron. 2018, 33, 8399–8411. [Google Scholar] [CrossRef]
  17. Allehyani, A. Analysis of a symmetrical multilevel DC-DC boost converter with ripple reduction structure for solar PV systems. Alex. Eng. J. 2022, 61, 7055–7065. [Google Scholar] [CrossRef]
  18. Mansour, A.S.; Amer, A.-H.H.; El-Kholy, E.E.; Zaky, M. High gain DC/DC converter with continuous input current for renewable energy applications. Sci. Rep. 2022, 12, 12138. [Google Scholar] [CrossRef] [PubMed]
  19. Bal, S.; Anurag, A.; Babu, B.C. Comparative analysis of mathematical modeling of Photo-Voltaic (PV) array. In Proceedings of the 2012 Annual IEEE India Conference (INDICON), Kochi, India, 7–9 December 2012; pp. 269–274. [Google Scholar] [CrossRef]
  20. Babu, B.C.; Gurjar, S. A Novel Simplified Two-Diode Model of Photovoltaic (PV) Module. IEEE J. Photovolt. 2014, 4, 1156–1161. [Google Scholar] [CrossRef]
  21. Lee, J.P.; Min, B.D.; Kim, T.J.; Yoo, D.W.; Yoo, J.Y. Design and Control of Novel Topology for Photo-Voltaic DC/DC Converter with High Efficiency under Wide Load Ranges. J. Power Electron. 2009, 9, 300–307. [Google Scholar]
  22. Chaibi, Y.; Allouhi, A.; Salhi, M. A simple iterative method to determine the electrical parameters of photovoltaic cell. J. Clean. Prod. 2020, 269, 122363. [Google Scholar] [CrossRef]
  23. Villalva, M.G.; Gazoli, J.R.; Filho, E.R. Modeling and circuit-based simulation of photovoltaic arrays. In Proceedings of the 2009 Brazilian Power Electronics Conference, Bonito-Mato Grosso do Sul, Brazil, 27 September–1 October 2009; pp. 1244–1254. [Google Scholar] [CrossRef]
  24. Nassar-eddine, I.; Obbadi, A.; Errami, Y.; El fajri, A.; Agunaou, M. Parameter estimation of photovoltaic modules using iterative method and the Lambert W function: A comparative study. Energy Convers. Manag. 2016, 119, 37–48. [Google Scholar] [CrossRef]
  25. Silva, E.A.; Bradaschia, F.; Cavalcanti, M.C.; Nascimento, A.J. Parameter Estimation Method to Improve the Accuracy of Photovoltaic Electrical Model. IEEE J. Photovolt. 2016, 6, 278–285. [Google Scholar] [CrossRef]
  26. Humada, A.M.; Darweesh, S.Y.; Mohammed, K.G.; Kamil, M.; Mohammed, S.F.; Kasim, N.K.; Tahseen, T.A.; Awad, O.I.; Mekhilef, S. Modeling of PV system and parameter extraction based on experimental data: Review and investigation. Sol. Energy 2020, 199, 742–760. [Google Scholar] [CrossRef]
  27. Bai, J.; Liu, S.; Hao, Y.; Zhang, Z.; Jiang, M.; Zhang, Y. Development of a new compound method to extract the five parameters of PV modules. Energy Convers. Manag. 2014, 79, 294–303. [Google Scholar] [CrossRef]
  28. Lo Brano, V.; Orioli, A.; Ciulla, G.; Di Gangi, A. An improved five-parameter model for photovoltaic modules. Sol. Energy Mater. Sol. Cells 2010, 94, 1358–1370. [Google Scholar] [CrossRef]
  29. Boutana, N.; Mellit, A.; Haddad, S.; Rabhi, A.; Pavan, A.M. An explicit I-V model for photovoltaic module technologies. Energy Convers. Manag. 2017, 138, 400–412. [Google Scholar] [CrossRef]
  30. Abbassi, R.; Abbassi, A.; Jemli, M.; Chebbi, S. Identification of unknown parameters of solar cell models: A comprehensive overview of available approaches. Renew. Sustain. Energy Rev. 2018, 90, 453–474. [Google Scholar] [CrossRef]
  31. Kumar, C.; Raj, T.D.; Premkumar, M.; Raj, T.D. A New Stochastic Slime Mould Optimization Algorithm for the Estimation of Solar Photovoltaic Cell Parameters. Optik 2020, 223. [Google Scholar] [CrossRef]
  32. Siddiqui, M.U.; Abido, M. Parameter estimation for five- and seven-parameter photovoltaic electrical models using evolutionary algorithms. Appl. Soft Comput. 2013, 13, 4608–4621. [Google Scholar] [CrossRef]
  33. Lawan, M.M.G.; Raharijaona, J.; Camara, M.B.; Dakyo, B. Power control for decentralized energy production system based on the renewable energies—Using battery to compensate the wind/load/PV power fluctuations. In Proceedings of the 2017 IEEE 6th International Conference on Renewable Energy Research and Applications (ICRERA), San Diego, CA, USA, 5–8 November 2017. [Google Scholar] [CrossRef]
  34. Baqar, A.; Camara, M.B.; Dakyo, B. Supercapacitors Fast Ageing Control in Residential Microgrid Based Photovoltaic/Fuel Cell/Electric Vehicle Charging Station. Energies 2023, 16, 5084. [Google Scholar] [CrossRef]
  35. Maria, M.; Yassine, M. Machine Learning Based Approaches for Modeling the Output Power of Photovoltaic Array in Real Outdoor Conditions. Electronics 2020, 9, 315. [Google Scholar] [CrossRef]
  36. Aoun, N.; Bailek, N. Evaluation of mathematical methods to characterize the electrical parameters of photovoltaic modules. Energy Convers. Manag. 2019, 193, 25–38. [Google Scholar] [CrossRef]
  37. Chowdhury, S.; Chowdhury, S.P.; Taylor, G.A.; Song, Y.H. Mathematical modelling and performance evaluation of a stand-alone polycrystalline PV plant with MPPT facility. In Proceedings of the 2008 IEEE Power and Energy Society General Meeting—Conversion and Delivery of Electrical Energy in the 21st Century, Pittsburgh, PA, USA, 20–24 July 2008; pp. 1–7. [Google Scholar] [CrossRef]
  38. Soliman, M.A.; Al-Durra, A.; Hasanien, H.M. Electrical Parameters Identification of Three-Diode Photovoltaic Model Based on Equilibrium Optimizer Algorithm. IEEE Access 2021, 9, 41891–41901. [Google Scholar] [CrossRef]
  39. Qais, M.H.; Hasanien, H.M.; Alghuwainem, S. Identification of electrical parameters for three-diode photovoltaic model using analytical and sunflower optimization algorithm. Appl. Energy 2019, 250, 109–117. [Google Scholar] [CrossRef]
  40. Diab, A.A.Z.; Sultan, H.M.; Do, T.D.; Kamel, O.M.; Mossa, M.A. Coyote Optimization Algorithm for Parameters Estimation of various Models of Solar Cells and PV Modules. IEEE Access 2020, 8, 111102–111140. [Google Scholar] [CrossRef]
  41. Diab, A.A.Z.; Sultan, H.M.; Aljendy, R.; Al-Sumaiti, A.S.; Shoyama, M.; Ali, Z.M. Tree Growth Based Optimization Algorithm for Parameter Extraction of Different Models of Photovoltaic Cells and Modules. IEEE Access 2020, 8, 119668–119687. [Google Scholar] [CrossRef]
  42. Wang, Z.; Zhang, H.; Dou, B.; Zhang, G.; Wu, W. Theoretical and experimental evaluation on the electrical properties of multi-junction solar cells in a reflective concentration photovoltaic system. Energy Rep. 2022, 8, 820–831. [Google Scholar] [CrossRef]
  43. Available online: https://fr.enfsolar.com/pv/panel-datasheet/crystalline/34981 (accessed on 22 March 2024).
  44. Jalilzadeh, T.; Rostami, N.; Babaei, E.; Maalandish, M. Ultra-step-up dc–dc converter with low-voltage stress on devices. IET Power Electron. 2019, 12, 345–357. [Google Scholar] [CrossRef]
  45. Mahajan, S.B.; Sanjeevikumar, P.; Wheeler, P.; Blaabjerg, F.; Rivera, M.; Kulkarni, R. X-Y converter family: A new breed of buck boost converter for high step-up renewable energy applications. In Proceedings of the 2016 IEEE International Conference on Automatica (ICA-ACCA), Curico, Chile, 19–21 October 2016; pp. 1–8. [Google Scholar]
  46. Okochi, S.; Koizumi, H. A High Step-Up Single Switch DC-DC Converter with Switched-Inductors and Switched-Capacitors. In Proceedings of the 2019 IEEE 4th International Future Energy Electronics Conference (IFEEC), Singapore, 25–28 November 2019; pp. 1–6. [Google Scholar]
  47. Ranjana, M.S.B.; SreeramulaReddy, N.; Kumar, R.K.P. A novel non-isolated switched inductor floating output DC-DC multilevel boost converter for fuelcell applications. In Proceedings of the 2014 IEEE Students’ Conference on Electrical, Electronics and Computer Science, Bhopal, India, 1–2 March 2014; pp. 1–5. [Google Scholar]
  48. Fardoun, A.A.; Ismail, E.H. Ultra Step-Up DC–DC Converter with Reduced Switch Stress. IEEE Trans. Ind. Appl. 2010, 46, 2025–2034. [Google Scholar] [CrossRef]
  49. Wu, B.; Li, S.; Liu, Y.; Smedley, K.M. A New Hybrid Boosting Converter for Renewable Energy Applications. IEEE Trans. Power Electron. 2016, 31, 1203–1215. [Google Scholar] [CrossRef]
  50. Tang, Y.; Fu, D.; Wang, T.; Xu, Z. Hybrid Switched-Inductor Converters for High Step-Up Conversion. IEEE Trans. Ind. Electron. 2015, 62, 1480–1490. [Google Scholar] [CrossRef]
  51. Bhaskar, M.S.; Almakhles, D.J.; Padmanaban, S.; Blaabjerg, F.; Subramaniam, U.; Ionel, D.M. Analysis and Investigation of Hybrid DC–DC Non-Isolated and Non-Inverting Nx Interleaved Multilevel Boost Converter (Nx-IMBC) for High Voltage Step-Up Applications: Hardware Implementation. IEEE Access 2020, 8, 87309–87328. [Google Scholar] [CrossRef]
  52. Rosas-Caro, J.C.; Ramirez, J.M.; Peng, F.Z.; Valderrabano, A. A DC-DC multilevel boost converter. IET Power Electron. 2010, 3, 129–137. [Google Scholar] [CrossRef]
  53. Maalandish, M.; Hosseini, S.H.; Ghasemzadeh, S.; Babaei, E.; Alishah, R.S.; Jalilzadeh, T. Six-phase interleaved boost dc/dc converter with high-voltage gain and reduced voltage stress. IET Power Electron. 2017, 10, 1904–1914. [Google Scholar] [CrossRef]
  54. Saravanan, S.; Babu, N.R. Design and Development of Single Switch High Step-Up DC–DC Converter. IEEE J. Emerg. Sel. Top. Power Electron. 2018, 6, 855–863. [Google Scholar] [CrossRef]
  55. Mahamadou, A.T.; Mamadou, B.C.; Brayima, D.; Cristian, N. Wind Power Integration in Hybrid Power System with Active Energy Management. Int. J. Comput. Math. Electr. Electron. Eng. 2011, 30, 245–263. [Google Scholar] [CrossRef]
  56. Tani, A.; Camara, M.B.; Dakyo, B. Energy Management in the Decentralized Generation Systems Based on Renewable Energy-Ultracapacitors and Battery to Compensate the Wind/Load Power Fluctuations. IEEE Trans. Ind. Appl. 2015, 51, 1817–1827. [Google Scholar] [CrossRef]
  57. Oukkacha, I.; Camara, M.B.; Dakyo, B. Energy Management in Electric Vehicle based on Frequency sharing approach, using Fuel cells, Lithium batteries and Supercapacitors. In Proceedings of the IEEE International Conference on Renewable Energy Research and Applications (ICRERA), Paris, France, 14–17 October 2018; pp. 986–992, ISBN 978-1-5386-5981-6. [Google Scholar]
  58. Fapi, C.B.N.; Toure, M.L.; Camara, M.B.; Dakyo, B. MPPT based Fractional Short-Circuit Current—Model Predictive Control for PV System in Real Weather Conditions for Heat-Pump Applications. In Proceedings of the IEEE international conference on intelligent systems and computer vision, ISCV 2024, Fez, Morocco, 18–20 May 2022; IEEE: Piscataway, NJ, USA, 2022. ISBN 978-1-6654-9558-5. [Google Scholar]
  59. Available online: https://power.larc.nasa.gov/beta/data-access-viewer/ (accessed on 22 March 2024).
  60. Camara, M.B.; Gualous, H.; Gustin, F.; Berthon, A. Design and New Control of DC/DC Converters to Share Energy Between Supercapacitors and Batteries in Hybrid Vehicles. IEEE Trans. Vehicular Technol. 2008, 57, 2721–2735. [Google Scholar] [CrossRef]
  61. Tankari, M.A.; Camara, M.B.; Dakyo, B.; Nichita, C. Attenuation of power fluctuations in wind diesel hybrid system—Using ultracapacitors and batteries. In Proceedings of the IEEE 2010 XIX International Conference on Electrical Machines (ICEM), Rome, Italy, 6–8 September 2010. [Google Scholar] [CrossRef]
Figure 1. Photovoltaic energy conversion principle.
Electronics 13 02565 g001
Figure 2. Proposed PV model-based variable series resistance.
Electronics 13 02565 g002
Figure 3. PV cell series resistance variations according to the solar irradiance and the temperature.
Electronics 13 02565 g003
Figure 4. Power-voltage characteristics of monocrystalline silicon technology at 1000 W/m2 as a function of the temperature variation.
Electronics 13 02565 g004
Figure 5. Power-voltage characteristics of monocrystalline silicon technology at 25 °C as a function of the irradiance variation.
Electronics 13 02565 g005
Figure 6. Power-voltage characteristics of mono module MSE335SO4J at 1000 W/m2 as a function of temperature variation.
Electronics 13 02565 g006
Figure 7. Power-voltage characteristics of mono module MSE335SO4J at 25 °C as a function of irradiance variation.
Electronics 13 02565 g007
Figure 8. Classification of DC-DC converters for PV applications.
Electronics 13 02565 g008
Figure 9. Symmetrical DC-DC multilevel high voltage-gain (SHVG) boost converter with differential connection.
Electronics 13 02565 g009
Figure 10. (a) Equivalent circuit-based State 1 (0 < t < DTs). (b) Equivalent circuit-based State 2 (D Ts < t < Ts). (c) Currents and voltage wave forms based on the SHVG boost converter operating sequences analysis.
Electronics 13 02565 g010aElectronics 13 02565 g010b
Figure 11. (a) Converter circuit 1; (b) converter circuit 2.
Electronics 13 02565 g011
Figure 12. SHVG boost converter voltage gain compared to classic boost converter ones.
Electronics 13 02565 g012
Figure 13. Dependency of the inductors as a function of the duty cycle.
Electronics 13 02565 g013
Figure 14. Incremental Conductance (IC) Algorithm.
Electronics 13 02565 g014
Figure 15. DC-bus voltage and current control strategies, where K is 0.5.
Electronics 13 02565 g015
Figure 16. Solar irradiance in Dialakoro pilot site from January 2017 to December 2022.
Electronics 13 02565 g016
Figure 17. Temperature in Dialakoro pilot site from January 2017 to December 2022.
Electronics 13 02565 g017
Figure 18. PV module series resistance variation.
Electronics 13 02565 g018
Figure 19. DC-bus voltage and its reference.
Electronics 13 02565 g019
Figure 20. Voltage across the capacitors C1 and C2.
Electronics 13 02565 g020
Figure 21. Load’s current.
Electronics 13 02565 g021
Figure 22. Current from converter 1 with its reference.
Electronics 13 02565 g022
Figure 23. Current from converter 2.
Electronics 13 02565 g023
Figure 24. Current from PV system.
Electronics 13 02565 g024
Figure 25. Load’s current.
Electronics 13 02565 g025
Figure 26. DC-bus voltage with its reference.
Electronics 13 02565 g026
Figure 27. Voltage across capacitors C1 and C2.
Electronics 13 02565 g027
Figure 28. Current from converter 1 compared to its reference.
Electronics 13 02565 g028
Figure 29. Current from converter 2.
Electronics 13 02565 g029
Figure 30. Current from PV system.
Electronics 13 02565 g030
Table 1. Series resistance variations according to the solar irradiance and the temperature.
Irr [W/m2]2 × 1053 × 1055 × 1057 × 10510 × 105
T [°C]Rs [mΩ]
25.779.4812.6415.2116.7019.59
30.0389.4712.6515.2116.7019.57
35.1089.5712.6815.2616.7419.60
40.019.6812.7215.3416.7719.60
45.0389.8512.8215.3716.8219.62
50.02510.0512.9215.4516.8619.66
54.92710.2613.0315.5516.9019.68
60.16510.5013.1715.6716.9919.73
65.02510.7913.3315.7917.0619.79
70.01111.1313.5215.8817.1419.85
74.99811.4813.7516.0117.2419.89
80.02611.8413.9916.2517.3419.99
85.05412.2814.2516.4017.4620.01
Table 2. Technical characteristics of MSE335SO4J module.
ParametersSymbolValues
Rated CurrentImp9 A
Number of parallel strings in a PV moduleNp,module1
Number of cells in series in a PV moduleNs,module72
Rated VoltageVmp38 V
Open-Circuit Voltage Voc46.5 V
Table 3. Comparison of DC-DC converter based on switched inductor techniques.
TopologyComponentsVoltage GainI/O Voltage Frequency and Power RatingApplications
PassiveActive
InductorsCapacitorsSwitchesDiodes
[44]3717 6 1 D 25 V/438 V
40 kHz/450 W
-
[45]3216 D 2 3 D 1 D 2 10 V
50 kHz/100 W
•Photovoltaic Multilevel Inverter System.
•High Voltage Automotive Applications
•Industrial Drives
[46]2415 4 1 D 5 V/36.1 V
20 kHz
[47]2518 N 1 + N + 1 D 1 D 24 V/480 V
50 kHz/450 W
•Fuel Cell Applications
[48]2415 3 + D 1 D 10 V/120 V
100 kHz/50 W
-
[49]1414 3 D 1 D 35 V/380 V
40 kHz/200 W
•Renewable energy
•PV systems
[50]4127 1 + 3 D 1 D 20 V-40 V/200 V
50 kHz/200 W
•PV connected to the grid
•Fuel Cell Applications
[51]1515 3 1 D 50 V/300 V
100 kHz
•PV systems
•Fuel Cell Applications
[52]27210 3 1 D 12 V/120 V
50 kHz/100 W
•PV systems
•Electric vehicles
[53]68614 3 + D 1 D 24 V/213 V
25 kHz/453 W
•PV systems
[54]2414 3 + D 2 ( 1 D ) 30 V/300 V
24 kHz/250 W
•PV systems
Proposed [18]4228 1 + 3 D 1 D 270 V/1000 V
10 kHz/204 kW
•PV systems
Table 4. Parameters of the simulations.
ParametersSymbolValues
Number of parallel strings in a PV stringNp,chain80
Number of modules in series in a PV stringNs,chain7
PV module series resistanceRsEquation (1)
PV string voltageVpv270 V
DC-bus voltage reference Voref1350 V
Inductor of coilsL1 = L2 = L3 = L42.97 mH
Weighting coefficient for duty cycleK1/2
Converter control frequencyf10 kHz
DC-bus capacitorsC1 = C2933 μF
Proportional coefficient of DC-bus voltage controllerkpv8.29
Integral coefficient of DC-bus voltage controllerkiv36,837
DC-bus voltage reference low-pass filter time constantτv0.225 ms
Proportional coefficient of the I4 current controllerkpi52.78
Integral coefficient of the I4 current controllerkii234,501.8
I4,ref current’s reference low-pass filter time constantτi0.225 ms
Disclaimer/Publisher’s Note: The statements, opinions and data contained in all publications are solely those of the individual author(s) and contributor(s) and not of MDPI and/or the editor(s). MDPI and/or the editor(s) disclaim responsibility for any injury to people or property resulting from any ideas, methods, instructions or products referred to in the content.

