Article

Rail Surface Defect Detection Based on Dual-Path Feature Fusion

Department of Intelligent Technology and Engineering, Chongqing University of Science and Technology, Chongqing 401331, China
*
Author to whom correspondence should be addressed.
Electronics 2024, 13(13), 2564; https://doi.org/10.3390/electronics13132564
Submission received: 18 April 2024 / Revised: 15 June 2024 / Accepted: 28 June 2024 / Published: 29 June 2024

Abstract

:
With the rapid development of rail transit, the workload of track maintenance has increased, making the intelligent identification of rail surface defects crucial for improving detection efficiency. To address issues such as low defect detection accuracy, the loss of feature information due to single-path architecture backbones, and insufficient information interaction in existing rail defect detection methods, we propose a rail surface defect detection method based on dual-path feature fusion (DPF). This method initially employs a dual-path structure to separately extract low-level and high-level features. It then utilizes a combination of attention mechanisms and feature fusion techniques to integrate these features. By doing so, it preserves richer information and enhances detection accuracy and robustness. The experimental results demonstrate that the comprehensive performance of the proposed model is superior to mainstream algorithms.

1. Introduction

Railways occupy a pivotal position in the economic development of a country. They are not only the main mode of transportation for people but also serve as a crucial channel for cargo transportation, representing an economic lifeline and supporting daily operations of society [1]. Rails, as key infrastructure to ensure the safe and smooth operation of trains, are of great significance [2]. With the increasing duration and frequency of railway operations, wear, cracks, and other defects will inevitably appear on rail surfaces [3]. If these defects are not detected and handled in a timely manner, they will pose a serious threat to the safe operation of trains [4]. At present, steel rail inspection for China’s railways and urban rail transit systems primarily relies on flaw detection trolleys operating at a speed of 2 km per hour. High-speed railways are equipped with comprehensive maintenance vehicles; however, due to their high cost, such vehicles are not feasible for regular railways and urban rail transit systems [5]. However, this traditional method of track fault detection has problems of low reliability and high labor costs, which does not conform to the rapid advancement of modern railways [6]. Therefore, intelligent and efficient rail surface defect detection technology is crucial for preventing and reducing railway accidents and ensuring the safety of railway transportation [7].
In recent years, with technological advancements, particularly in computer vision technology, deep learning-based techniques have found widespread application in rail inspection [8]. Reference [9] considers the aspect of signals and introduces a detection method that decomposes surface defect signals of different frequency bands using wavelet packet transform, kernel principal component analysis, and support vector machines to derive defect detection results. Reference [10] proposes a classification and detection method for rail defects, focusing on the detection of internal rail defects. Initially, defect features are extracted and categorized based on the distribution and contour morphology of rail defects. Subsequently, to bolster the adaptability of detection parameters across diverse scenarios, a threshold adjustment approach rooted in data distribution patterns is suggested to elevate detection accuracy. Reference [11] introduces an effective multi-scale residual convolutional network model aimed at classifying various types of rail defects. Skip connections, paired with residual learning blocks, are employed to bolster the network’s efficacy. Reference [12] proposes a high-precision fusion model to detect rail surface defects by fusing features from two deep learning models. Initially, contrast adjustment is applied to the original image of the track to determine the track position. Subsequently, the most weighted features are selected from each network, and defects are identified by allocating the refined features to a support vector machine. Reference [13] harnesses two distinct MobileNet architectures to appraise the performance of defect detection. The network architecture incorporates the backbone network of MobileNet alongside several detection layers inspired by YOLO and feature pyramid networks for multi-scale feature maps. Reference [14] introduces a coarse-to-fine model intended for identifying defects across different scales. This model is segmented into three scales: sub-image level, region level, and pixel level. While the aforementioned deep learning-driven rail detection methods prove adept at detecting corresponding defects, they overlook the significance of defect size. Varying defect sizes can influence the ultimate recognition rate, ultimately leading to a diminution in recognition accuracy. To tackle these issues, this paper introduces a dual-path feature fusion-based model tailored for detecting surface defects on steel rails.
The primary contributions of this study can be summarized as follows:
  • This study proposes a steel rail surface defect detection model based on dual-path feature fusion (DPF). The model is designed with two distinct paths to separately extract low-level and high-level features. By utilizing an attention mechanism and feature fusion, these features are integrated, preserving richer information and enhancing the accuracy and robustness of detection.
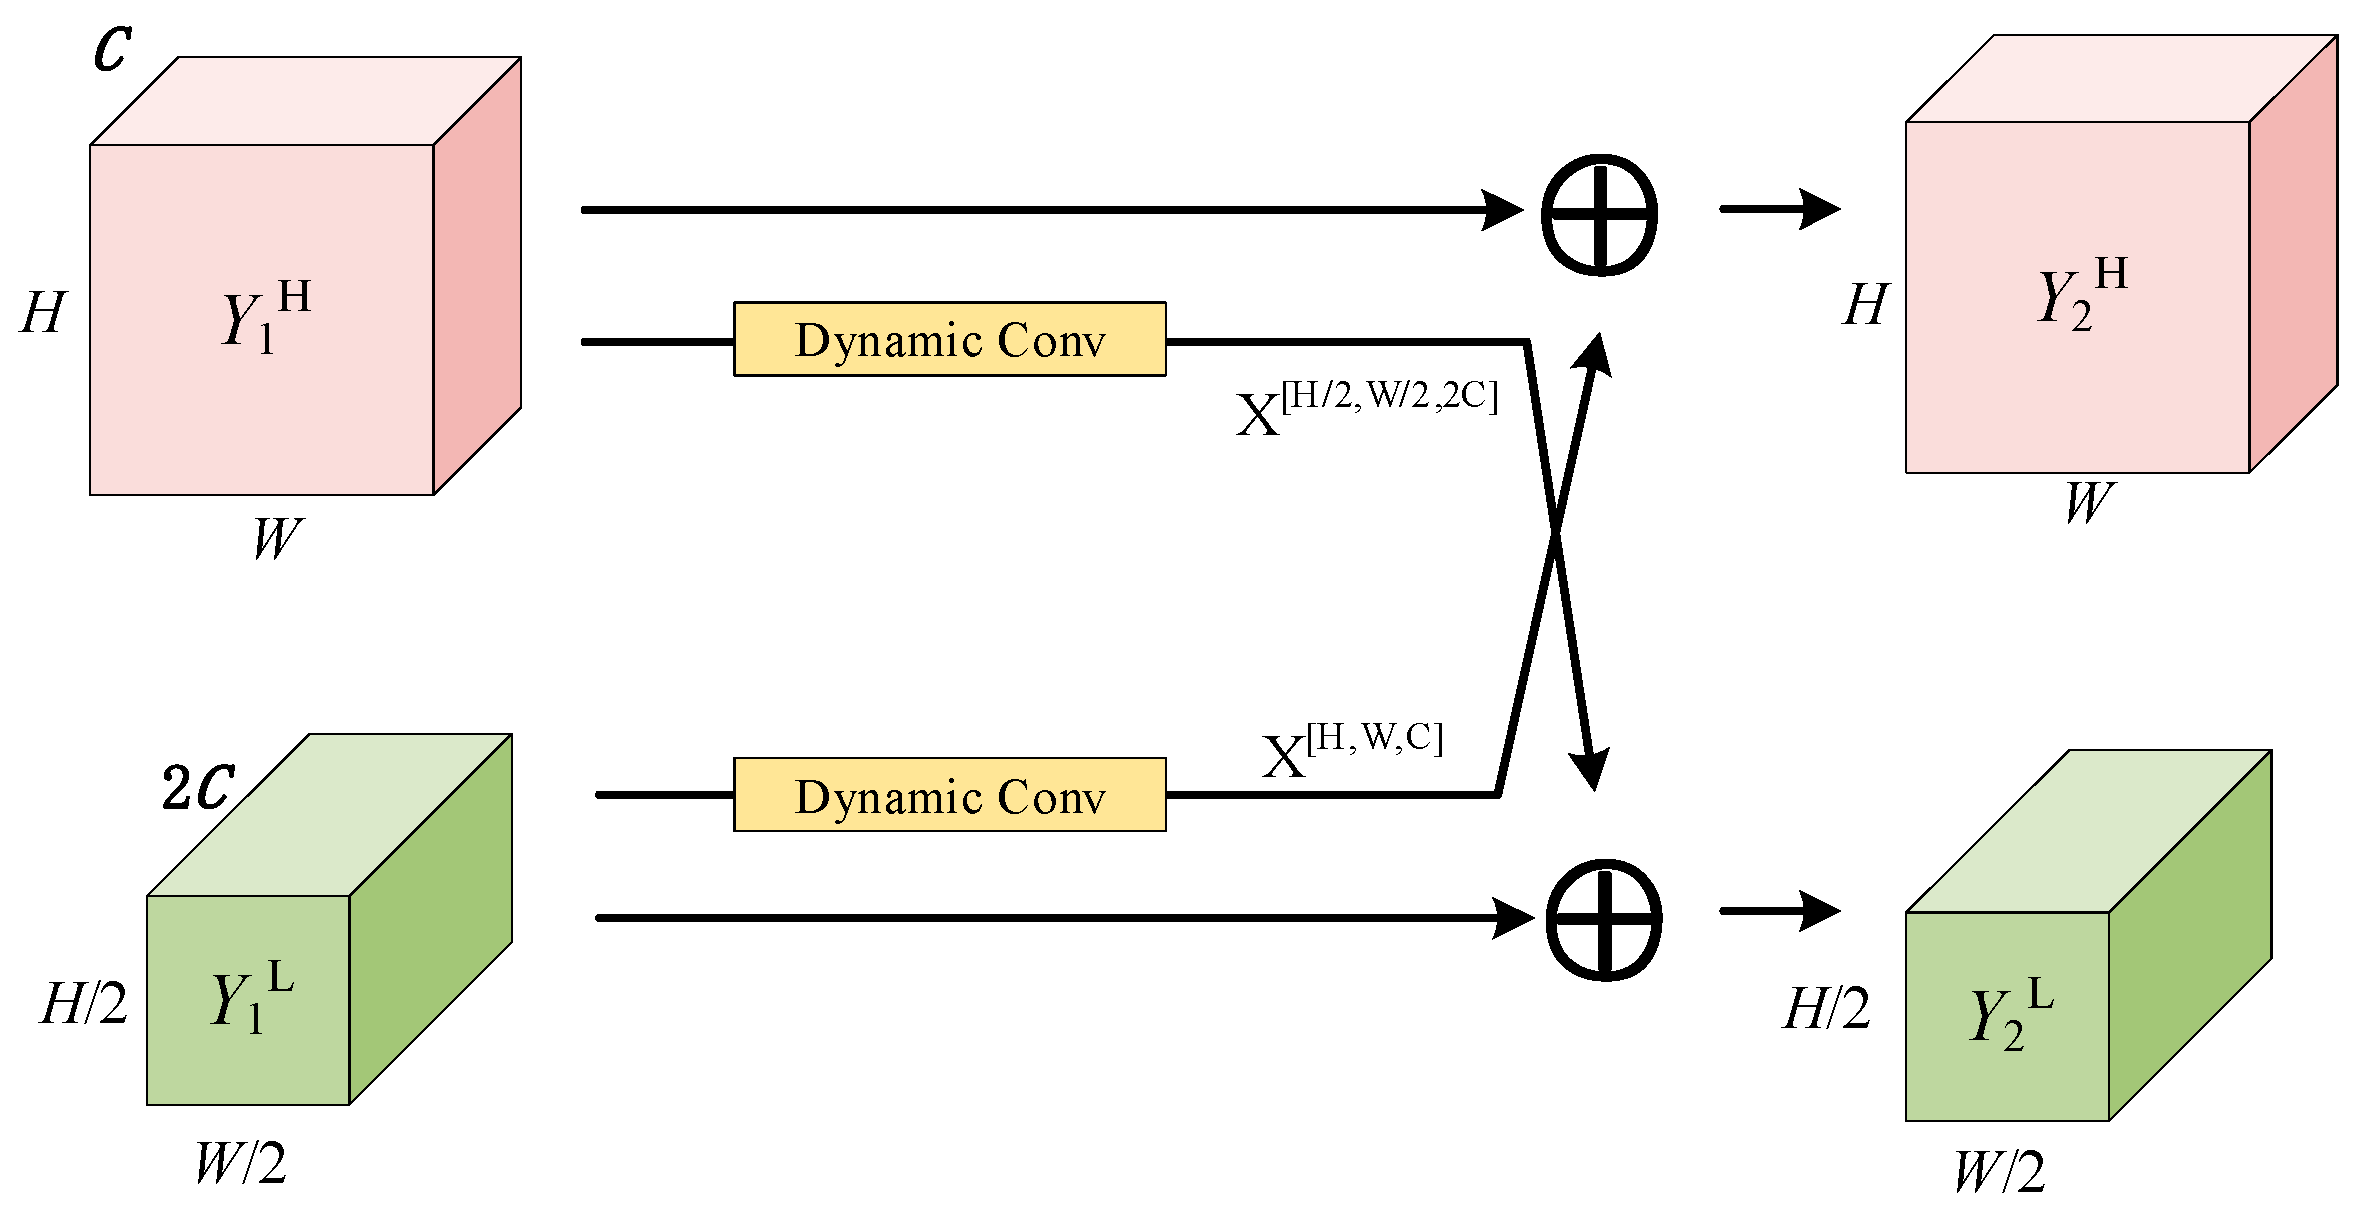
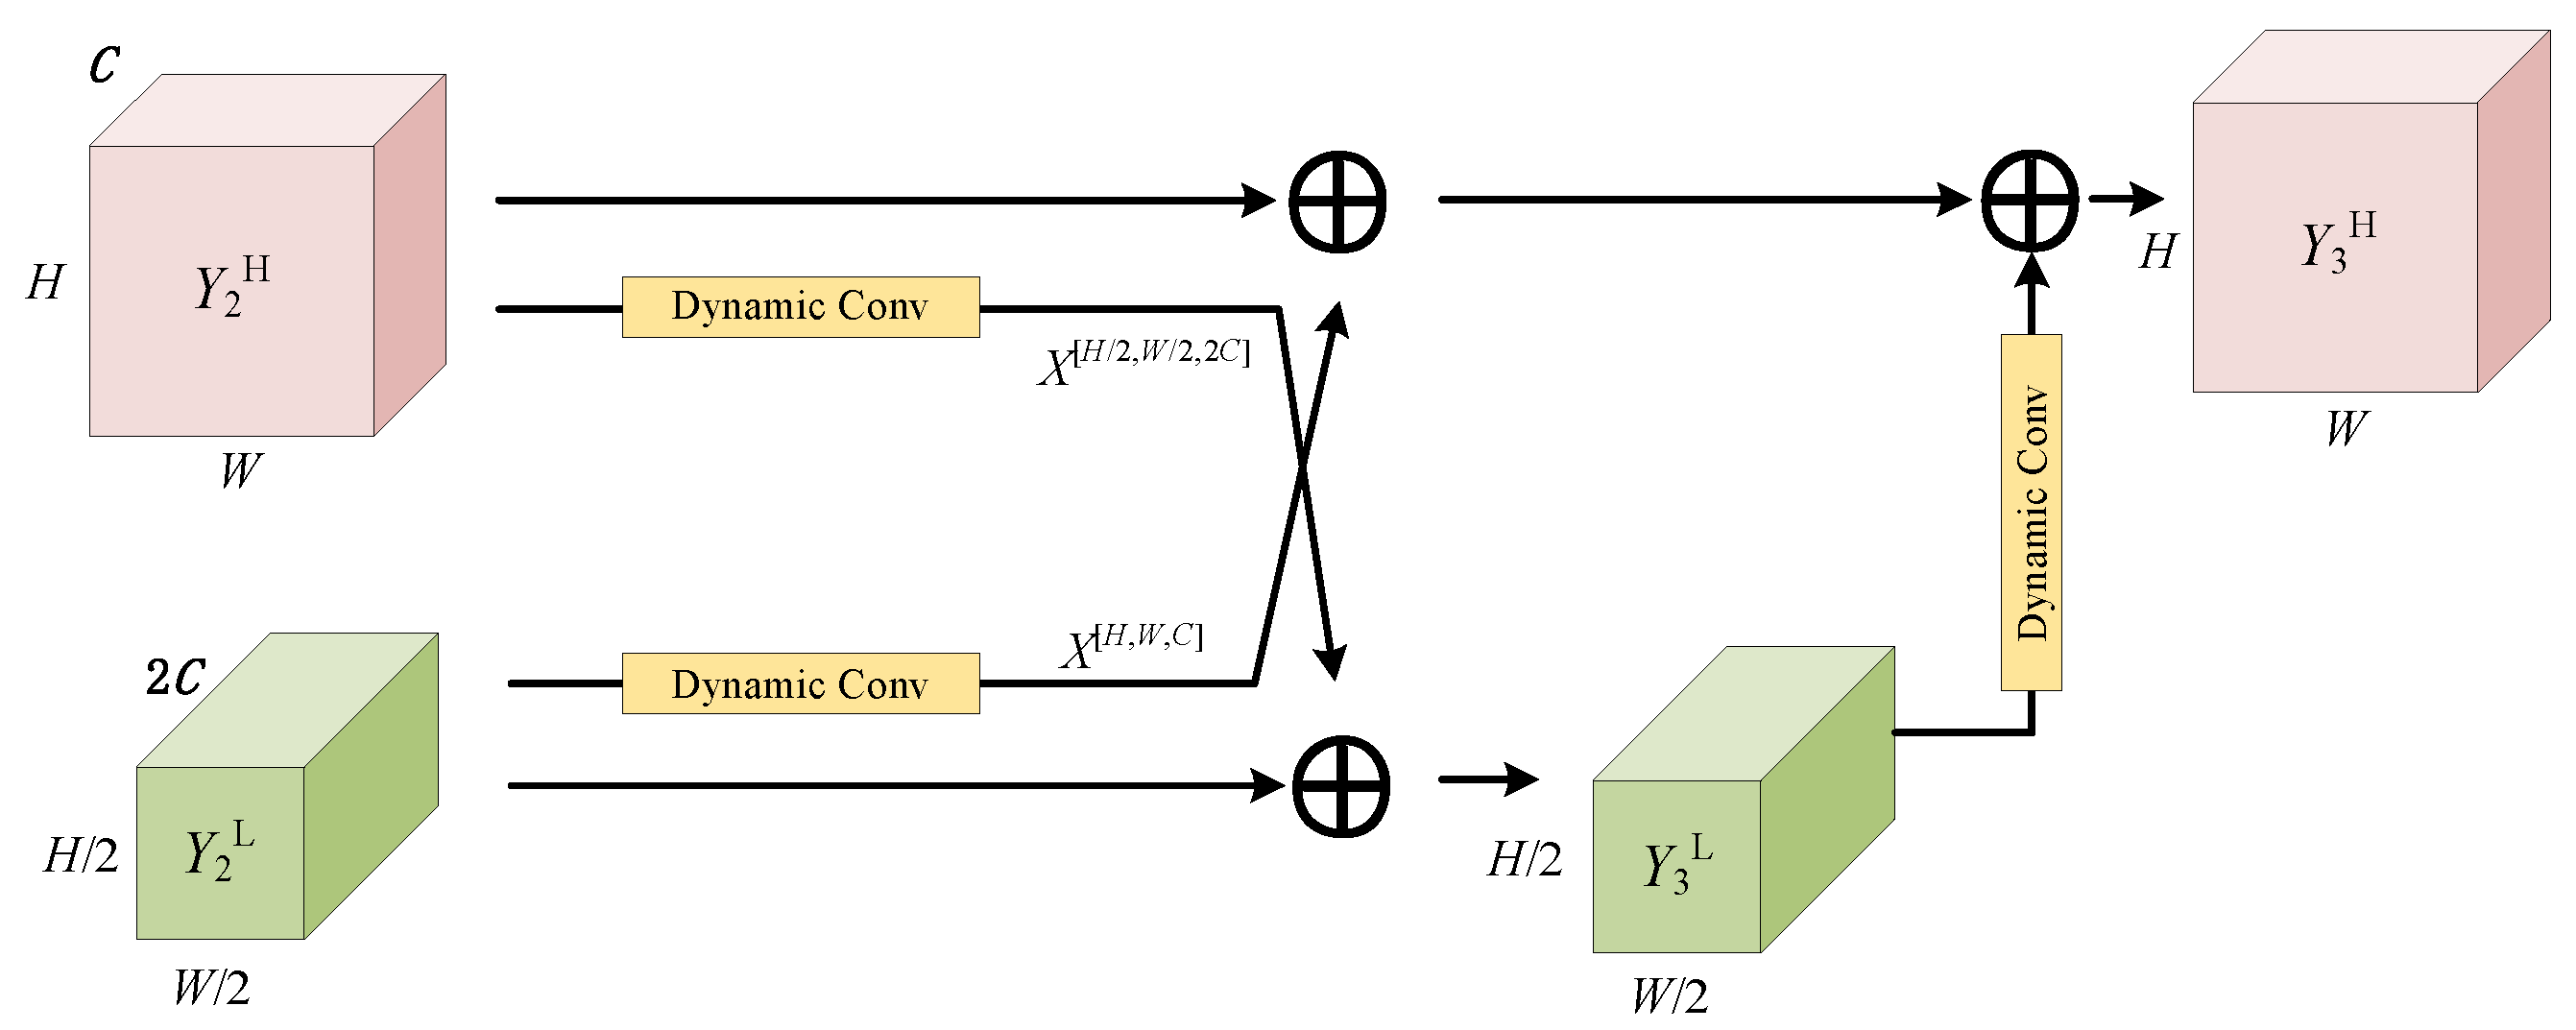
  • The Dy-Bottleneck module is proposed in this paper, which incorporates a dual-path structure combining two parallel and interactive dynamic convolutions. This module dynamically adjusts based on the characteristics of the input data, allowing it to adapt to diverse datasets and complex scenarios.
  • A symmetric feature attention fusion module is introduced in this study. This module combines the lightweight Convolutional Block Attention Module (CBAM) with the symmetric design of the feature pyramid network (FPN). Specifically, CBAM attention and FPN structures are employed in both the feature extraction and feature fusion stages. This symmetric design makes the module more compact and consistent, enhancing the model’s understanding and recognition ability of images for better performance.
The structure of this paper is organized as follows: in Section 2, we introduce in detail the basic theoretical knowledge that the research relies on. In Section 3, we comprehensively elaborate on the proposed new method. In Section 4, we present the experimental results and conduct comparative experiments with other methods to further verify the superiority of our proposed method. Finally, in Section 5, we provide a concise summary of the entire paper.

2. Related Work

2.1. Dynamic Convolution

The dynamic convolution described in [15] and employed in this paper introduces a design that augments model complexity without necessarily increasing network depth or width. Rather than utilizing a single convolution kernel per layer, dynamic convolution adaptively combines several parallel convolution kernels based on input-dependent attention. The assembly of multiple kernels, thanks to their size, proves computationally efficient and offers superior representational power, as these kernels are nonlinearly aggregated via attention mechanisms.
Figure 1 illustrates the structure of dynamic convolution, which is divided into multiple components, including pooling [16], fully connected layers [17], and activation functions [18]. The model’s capability is enhanced by aggregating multiple convolution kernels through attention [19]. For different input images, these kernels are assembled in various ways.

2.2. Convolutional Block Attention Module

The Convolutional Block Attention Module (CDAM) structure [20] consists of channel attention and spatial attention. The channel attention module focuses primarily on the relationships between different channels in the feature map, enhancing the model’s ability to express features by learning the importance of each channel [21]. The spatial attention module captures the relationships between different spatial locations in the feature map, allowing the model to better understand the spatial structure of the target [22]. By combining the channel attention module and the spatial attention module, the CBAM structure can effectively improve the network’s representation capabilities, enabling the network to better capture important feature information in the input data. The introduction of this attention mechanism helps improve the model’s performance and achieve better results in object detection.
Figure 2 illustrates the structure of the CBAM. Module a in Figure 2, the channel attention module, includes average pooling, max pooling, and fully connected layers, which are used to weight the features of each channel. Module b in Figure 2, the spatial attention module, utilizes the channel attention weights obtained from the channel attention module to weight the input feature map, enhancing the network’s focus on the spatial dimensions of the feature map.
The channel attention and spatial attention in the CBAM structure cooperate with each other. By regulating the channel and spatial dimensions of the feature map, the network’s ability to represent features is improved. This structural design helps to improve the performance of convolutional neural networks in various computer vision tasks.

2.3. Feature Pyramid

The feature pyramid network (FPN) module [23] integrates features extracted at different scales in a feature pyramid for subsequent feature matching and description. This enhances the ability to recognize and locate target objects or scenes in an image. The feature pyramid allows us to analyze images at different scales, which is extremely useful for processing target objects of varying sizes or images with different resolutions. Through the feature pyramid, we can conduct the global and local feature analysis of images at various scales [24].
Figure 3 illustrates the structure of the feature pyramid used in this paper. It comprises a bottom–up pathway, a top–down pathway, and 1 × 1 convolutional kernels to adjust the output channel count of different feature maps for feature fusion [25]. The aim is to ensure that feature maps from different levels have the same shape, allowing the addition of upsampled features from other layers without altering the feature map size [26]. By combining the bottom–up and top–down pathway, and lateral connections, multi-scale feature extraction and fusion can be achieved, thereby improving the performance of convolutional neural networks in computer vision tasks [27].

3. Methods

3.1. Overall Structure

To address the issues of low detection accuracy for small defects, the loss of feature information due to single-path architecture backbones, and inadequate information interaction in existing rail image target detection methods, this paper proposes a rail surface defect target detection model based on dual-path feature fusion. The model consists of three main components: a dual-path backbone network, a symmetrical feature attention fusion module (Neck), and a detection head (Head). The overall architecture of the proposed dual-path feature fusion (DPF) is shown in Figure 4.
The dual-path backbone network is built upon the proposed Dy-Bottleneck module, which allows for the simultaneous extraction and fusion of features at different levels. This contributes to a more comprehensive understanding of the input data by the model and enables the capture of multi-scale and multi-level feature information.
The symmetrical feature attention fusion module employs CBAM attention, enabling the model to dynamically learn the importance of different channels and spatial locations. This allows the model to focus on critical regions within the image, enhancing its ability to perceive important features. Additionally, the integration of two FPN structures aids in capturing rich semantic information from the image, improving the model’s ability to recognize objects of different scales. The symmetrical design facilitates smooth information transfer and consistency within the module, enhancing its effectiveness and stability.
The detection head (Head) is primarily responsible for converting feature maps into target predictions. It also includes a loss function that calculates the discrepancy between the model’s predictions and the ground truth labels. The model parameters are then updated through backpropagation.

3.2. Dy-Bottleneck Module

The dual-path backbone network’s feature extraction section is founded upon the Dy-Bottleneck module, embodying a dual-path structural design. The Dy-Bottleneck module accepts two input feature maps, denoted as XH and XL, and consistently generates outputs of identical dimensions. The specific architecture of the Dy-Bottleneck can be delineated into three distinct variant styles.
Figure 5 illustrates the structure of Dy-Bottleneck (F). It involves processing the output XH twice through a specific formula, detailed as follows:
Y 1 H = Dy - Conv   ( X L ) + X H
Y 1 L = Dy - Conv 1   ( X H ) + Dy - Conv 2   ( X H )
In the formula, Dy-Conv represents dynamic convolution.
Figure 6 depicts the structure of Dy-Bottleneck (M). The specific formula is as follows:
Y 2 H = Dy - Conv   ( X L ) + Y 1 H
Y 2 L = Dy - Conv   ( X H ) + Y 1 L
In the formula, Dy-Conv represents dynamic convolution.
Figure 7 depicts the structure of Dy-Bottleneck (L). The specific formula is as follows:
Y 3 H = Dy - Conv 1   ( Y 2 L ) + Y 2 H + Dy - Conv 3 ( Dy - Conv 2   ( Y 2 L ) + Y 2 H )
In the formula, Dy-Conv represents dynamic convolution.
The Dy-Bottleneck module is capable of more effectively integrating high-frequency and low-frequency features, effectively enhancing the model’s ability to represent input data, thereby improving the model’s performance and generalization capabilities.
As can be seen from Figure 4, the proposed structure consists of 1 Dy-Bottleneck (F); 12 Dy-Bottleneck (M) arranged in the configuration of 2, 4, 4, and 2; and 1 Dy-Bottleneck (L), forming the dual-path backbone. One path focuses on high-frequency features, while the other path handles low-frequency features. In this process, high-frequency features often take precedence over low-frequency features as they are more representative of the data distribution. However, in certain scenarios, low-frequency features can also be crucial. Table 1 illustrates the structure of the backbone.
After carefully evaluating both time and computational costs, we chose a dual-path methodology that produces six unique feature maps. This approach achieves a harmonious balance between efficiency and comprehensiveness, thereby guaranteeing a wider capture of information without compromising resource utilization.

3.3. Symmetric Feature Attention Fusion Module

As shown in Figure 4, the overall structure of symmetric feature attention can be observed. Initially, the feature maps outputted from the dual-path backbone network serve as inputs for the symmetric feature attention fusion module, denoted as L1, L2, L3, and H1, H2, H3. Each input first enters the CBAM, effectively enhancing the network’s representational capability and enabling the network to better capture crucial feature information from the input data. The attention-processed information is then grouped based on different paths and inputted into two sets of FPN. The fused feature information can extract multi-scale information from feature maps at different levels, aiding the model in better understanding contextual information and semantic relationships of the target. This, in turn, enhances the model’s perception of the target, which helps improve the accuracy and robustness of the model in object detection. The information processed by the FPN is grouped based on size and fused together using element-wise addition. Finally, three sets of feature maps are outputted. The mathematical expression for the above process is as follows:
D 1 = FPN ( CBAM ( L 1 ) ) FPN ( CBAM ( H 1 ) )
D 2 = FPN ( CBAM ( L 2 ) ) FPN ( CBAM ( H 2 ) )
D 3 = FPN ( CBAM ( L 3 ) ) FPN ( CBAM ( H 3 ) )
In the formula, FPN represents the feature pyramid network, CBAM denotes the Convolutional Block Attention Mechanism, and ⊕ signifies element-wise addition.
Finally, the symmetric feature attention fusion module outputs D1, D2, and D3.

3.4. Detection Head

The detection head module in this chapter draws inspiration from the YOLO series, renowned for its simplicity and efficiency [28]. By employing three 1 × 1 convolutional layers, it facilitates the adjustment of feature channels and generates detection feature layers. The primary function of 1 × 1 convolution is dimensionality reduction or expansion. Importantly, this convolution operates exclusively on the channel radimension, preserving the size of the feature map while altering the number of channels to influence feature representation. This design maintains high performance in object detection tasks, facilitating feature extraction and transformation through convolutional operations, paving the way for subsequent object localization and classification. The lightweight design of the detection head also contributes to faster model training and inference, enhancing the model’s practical applicability. The network predicts objects of varying sizes through multi-scale feature maps, with each map corresponding to a grid. These feature maps undergo 1 × 1 convolution to generate detection results, as illustrated in Figure 8, which depicts the schematic of the detection head.
In the figure, the three feature maps of different scales essentially represent three grids, with sizes of 80 × 80, 40 × 40, and 20 × 20, respectively. Through 1 × 1 convolution, the sizes of these three feature maps are transformed to 80 × 80 × 3 × (5 + 3), 40 × 40 × 3 × (5 + 3), and 20 × 20 × 3 × (5 + 3). The notation (5 + 3) signifies the information contained within each anchor, where the first ‘3’ represents three anchors embedded in each grid. Here, ‘5’ denotes four positional coordinates (x, y, w, h) and a confidence score. The confidence score indicates the probability of a possible object presence within the grid. The ‘3’ in parentheses corresponds to the three categories present in the steel rail dataset.

3.5. Loss Function

The loss functions used in this paper include three types: classification loss [29], confidence loss [30], and location loss [31]. Classification loss is used in object detection tasks to measure the accuracy of the model’s classification predictions for target categories. In the model, the classification loss function is used to train the model to correctly classify detected target objects into different categories; confidence loss plays a crucial role. By minimizing the confidence loss, the model can learn how to predict the existence of target objects and make the confidence scores closer to the real situation; location loss refers to the loss function between the predicted bounding box position and the ground truth bounding box. Location loss plays a vital role as it helps the model adjust the position of the predicted bounding box to better fit the position of the real target. The formula for the loss function used in this paper is as follows:
(1)
Classification Loss
To measure the model’s classification accuracy for target classes, the cross-entropy loss function is adopted for classification. Its formula is as follows:
L c l s = 1 N i = 1 N c = 1 C t i , c log p i , c
In the formula, C represents the category, Pi represents the predicted probability of the i-th category by the model, ti represents the true label of the i-th category, and N represents the number of categories.
(2)
Confidence Loss
To measure the model’s prediction accuracy of target existence, we use the binary cross-entropy loss function for confidence loss, as shown in the following formula:
L conf = 1 N B i = 1 N j = 1 B t i , j obj n { conf } t i , j n p i , j n 2 + λ noobj t i , j noobj n { conf } t i , j n p i , j n 2
In the formula, B represents the number of anchor boxes, N represents the number of categories, P i , j obj represents the model’s predicted value for the presence of a target in the i-th anchor box, t i , j obj indicates whether the i-th anchor box in the j-th sample contains a target, t i , j noobj signifies whether the i-th anchor box in the j-th sample does not contain a target, and λ noobj denotes the weight coefficient for the confidence loss of anchor boxes that do not contain targets.
(3)
Location Loss
The location loss used is the mean squared error loss, which measures the prediction accuracy of the model for target positions, as shown in the following formula:
L loc = 1 N B i = 1 N j = 1 B 1 , j obj λ coord n { x , y , w , h } t i , j n p i , j n 2
In the formula, B represents the number of anchor boxes, N represents the number of categories, p i , j denotes the model’s predicted value for the positional information of the j-th anchor box, N B signifies the number of anchor boxes containing targets in the sample, λ coord represents the weight coefficient for location loss, t i , j obj indicates the positional information of the j-th anchor box in the i-th sample, and t i , j obj signifies that the j-th anchor box in the i-th sample contains a target.
So, the total loss formula is as follows:
L = L cls + λ coord L loc + λ conf L conf
λ coord and λ conf represent the weight coefficients for location loss and confidence loss, respectively.

4. Experimental Results

4.1. Datasets

The public dataset for RailDefect steel rail surface defects [32] used in this paper was collected on the railway test loop of the National Academy of Railway Sciences using a linear array camera installed on a high-speed train. The dataset contains over 10,000 images, among which, 400 images exhibit distinct defect features. These defects mainly fall into five types, including peeling, scratches, crushing, indentations, and cracks, covering various major issues that may arise on the surface of steel rails. Additionally, the dataset includes images of dirt, gaps, and unknown categories. The dataset is divided into eight detailed versions and three coarse classification versions. In our entire experiment, we adopted three common and practical categories for detection: defects, gaps, and dirt. During the experiment, we selected 80% as the training set and 20% as the validation set. Figure 9 illustrates the basic schematic diagram of defects in the dataset.

4.2. Evaluation Indicators or Evaluation Metrics

In the process of object detection, the comparison between predicted labels and actual labels in the test set yields four different outcomes: True Positives (TPs), True Negatives (TNs), False Positives (FPs), and False Negatives (FNs) [33]. This paper employs Precision (P) [34], Recall (R) [35], and Average Precision (AP) [36] as evaluation metrics to assess the effectiveness of all models. The mean Average Precision (mAP) is calculated by averaging the AP values across all categories [37].
The calculation method for P is as follows:
P = T P T P + F P
The calculation method for R is as follows:
R = T P F N + T P
The calculation method for AP is as follows:
AP = 0 1 P ( R ) d R

4.3. Experimental Parameter Settings

The proposed method is implemented based on the PyTorch framework. During the training process, an NVIDIA RTX 3060 GPU (NVIDIA, Santa Clara, CA, USA) was used as the training device. The SGD optimizer was selected to minimize cross-entropy loss. To ensure a stable training process and optimal performance, the learning rate and batch size were set to 0.001 and 8, respectively. The SGD optimizer was chosen because it is a commonly used gradient descent algorithm that demonstrates fast convergence and good generalization capabilities. The selection of learning rate, number of epochs, and batch size took into account multiple factors. An excessively high learning rate might lead to unstable training dynamics, while a too-small learning rate could result in slow convergence during training. The constructed deep learning model was run for 300 iterations. The model’s performance was monitored in real time during training, and model parameters were saved at the moment of optimal performance. Finally, the model demonstrating the highest accuracy level was selected as the optimal model.

4.4. Experimental Results

(1)
Ablation Experiment
To verify whether the hypotheses in model design are valid, ablation experiments can be conducted. By gradually changing the structure or parameters of the model, we can examine the model’s performance under different conditions, thereby confirming whether the model design meets expectations. Therefore, ablation experiments were conducted on the proposed steel rail surface defect detection model based on dual-path feature fusion and attention mechanism. The results of the ablation experiments are shown in the Table 2. Herein, “dual-path backbone” represents the main structure of the dual-path, or a single path without dynamic convolution using regular convolutional blocks; “dynamic convolution” indicates whether dynamic convolution is used in the Dy-Bottleneck module; “symmetric attention” signifies whether two FPNs or one FPN is used; and “CBAM” represents whether the attention mechanism is incorporated into the model.
√ represents used, × represents non-used. The table reveals that the model performs poorly without the dual-path backbone, dynamic convolution, symmetric attention, and CBAM, achieving approximately 20% lower performance compared to Experiment 7, where all these components are present. This underscores the crucial importance of these modules. However, the introduction of symmetric attention enhances precision by roughly 5%, indicating its role in stabilizing the model’s performance. Furthermore, the addition of CBAM leads to a steady improvement in all model metrics, suggesting that attention mechanisms focus the model on defective areas, significantly improving prediction outcomes. In subsequent Experiments 4, 5, and 6, removing dynamic convolution, symmetric attention, or CBAM individually results in varying degrees of performance degradation compared to the complete model. Notably, dynamic convolution has the most significant impact on the model. In conclusion, the ablation study demonstrates that every component of our model plays a vital role and is indispensable.
(2)
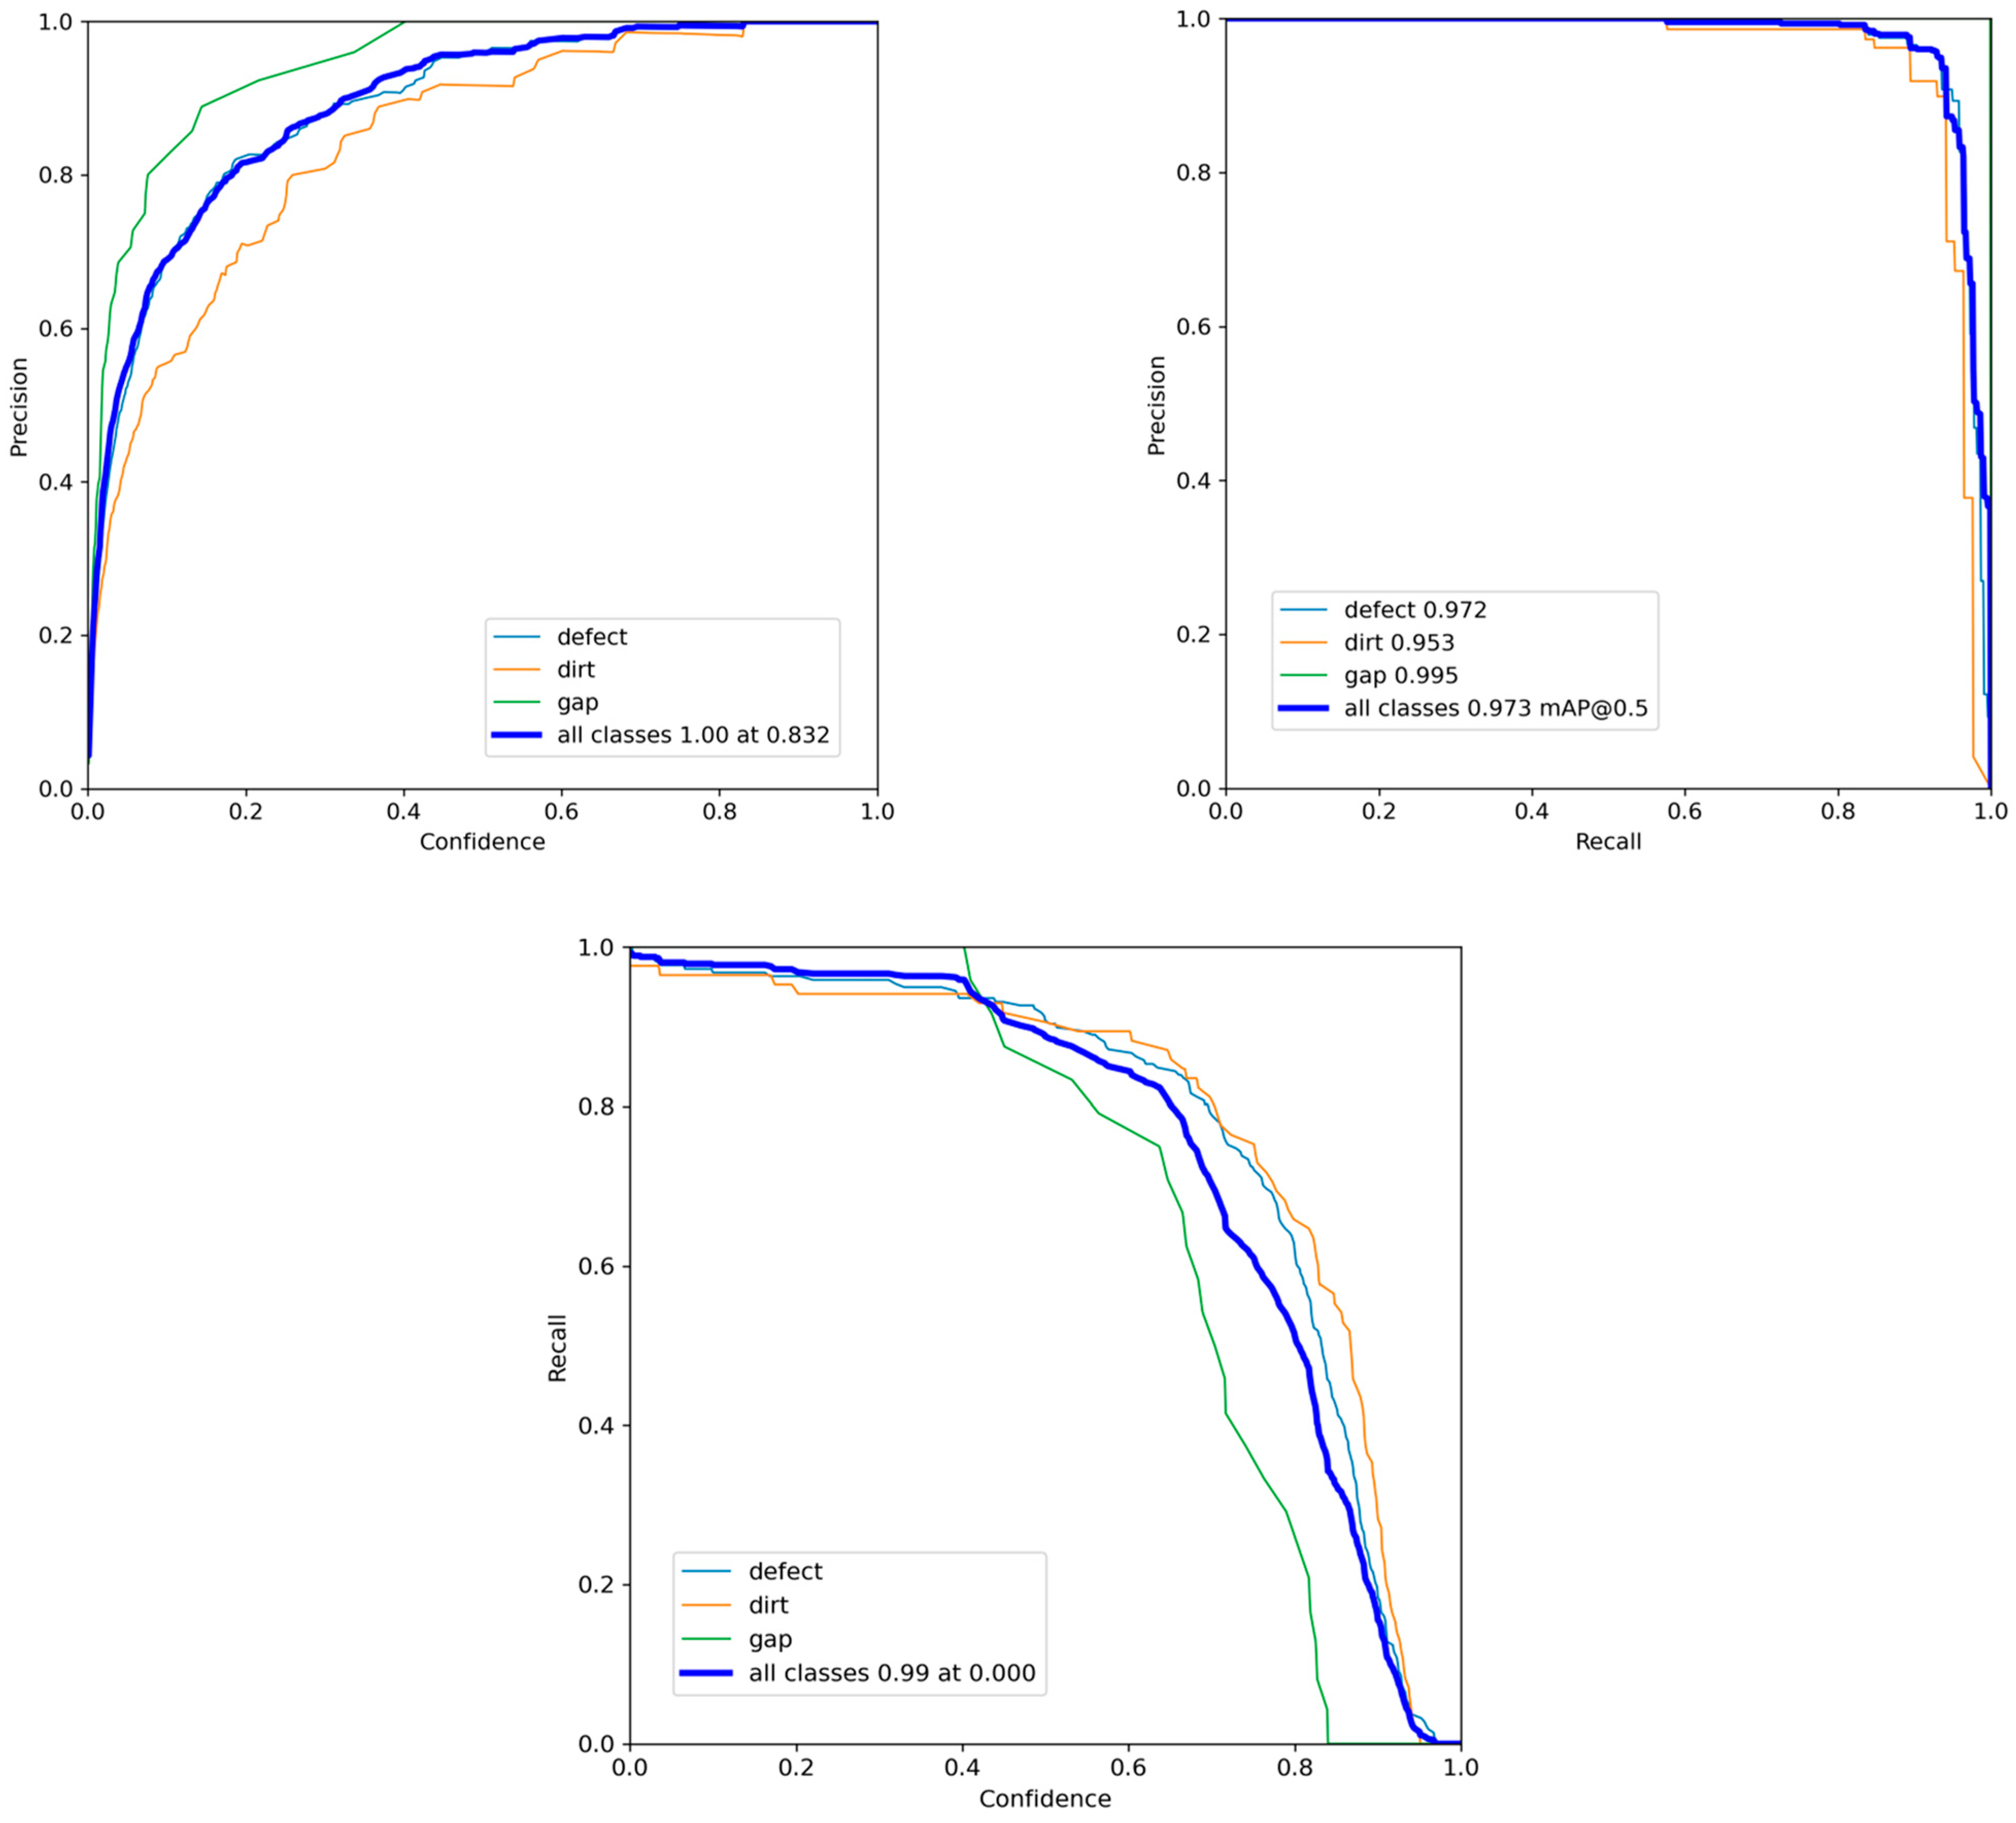
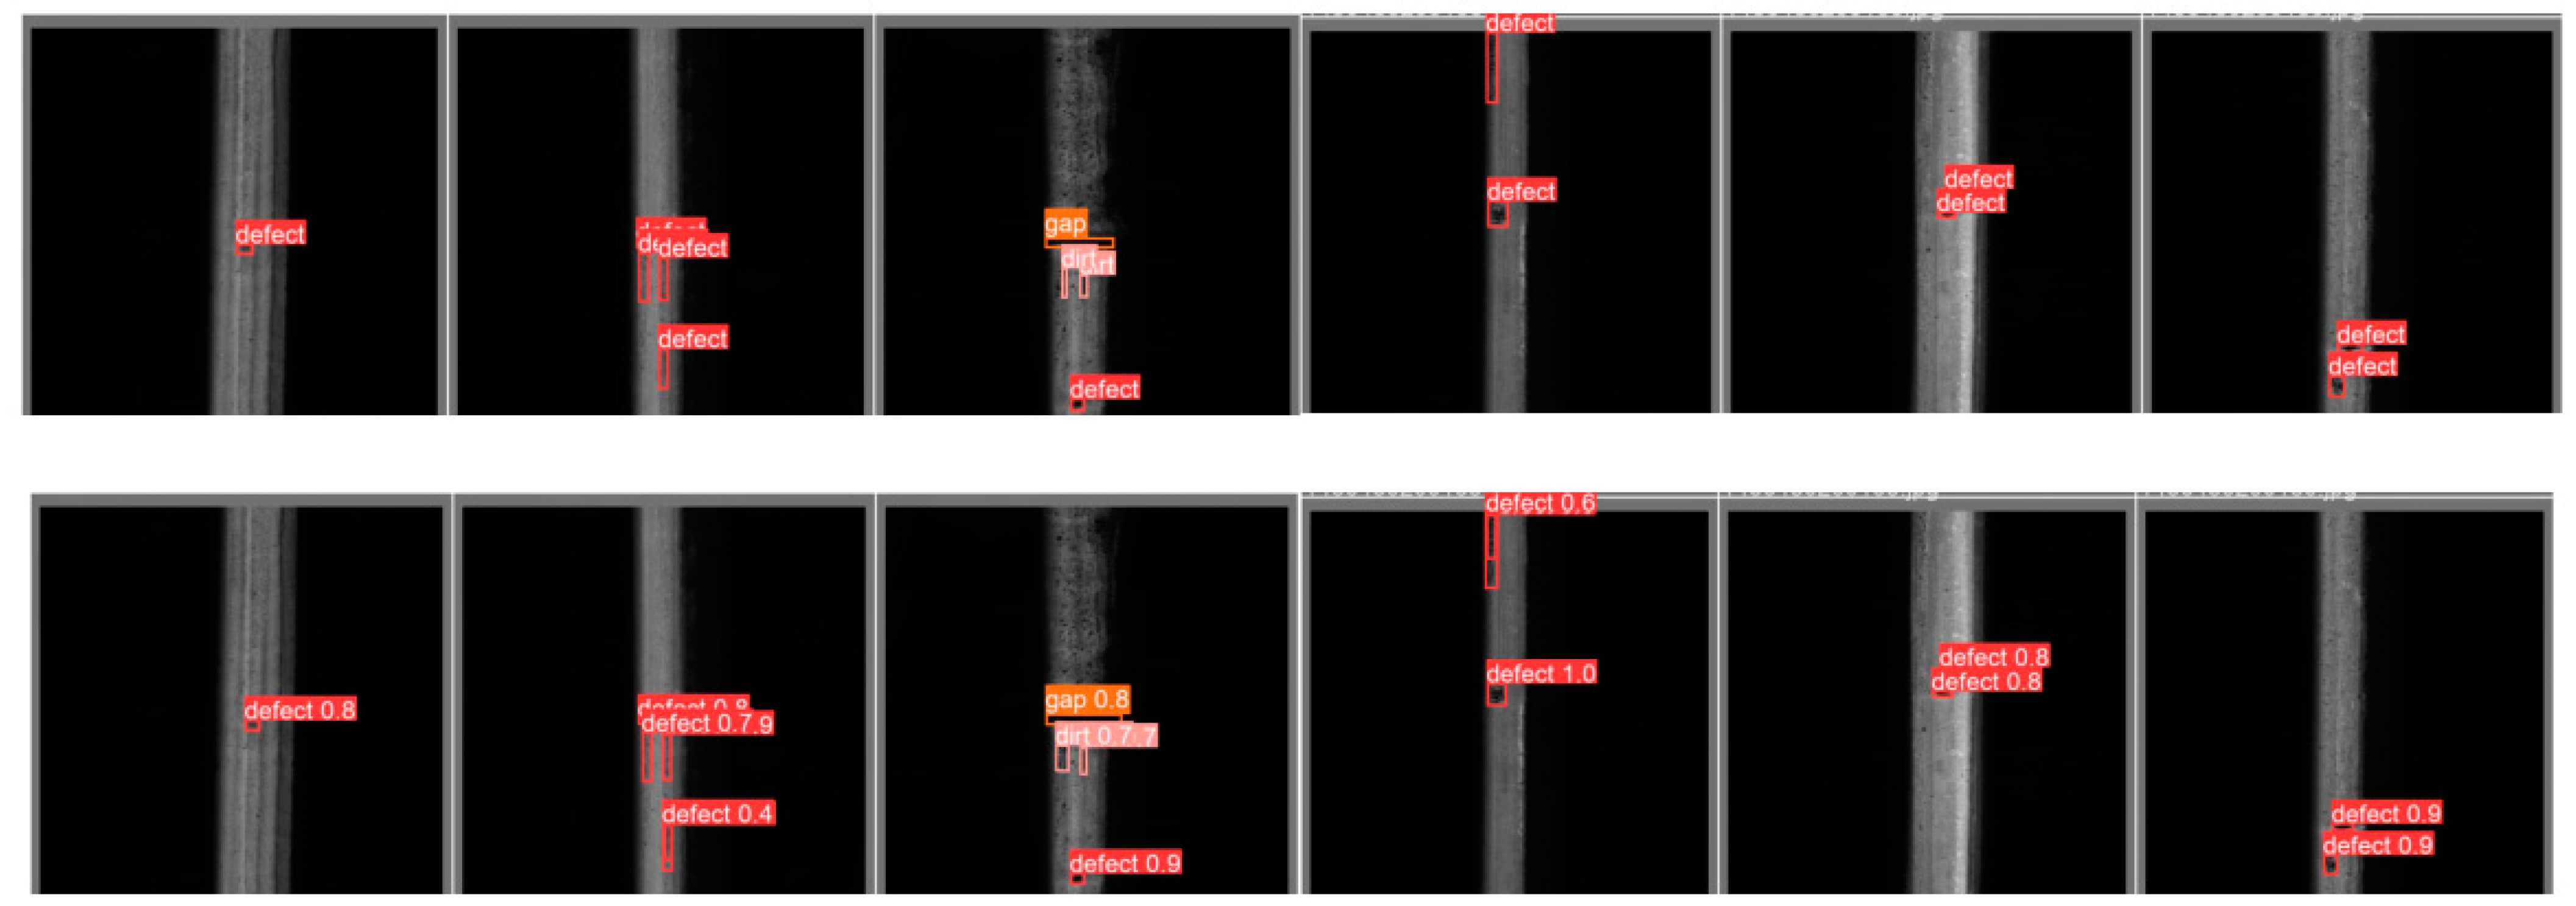
Visualization Result Analysis
To gain insights into the model’s evolution during training, we present several visualizations of the training process. Figure 10 depicts the loss variation graph, illustrating how the loss function value changes over the course of training. By examining the loss curve, we can assess whether the model’s training is converging, detect issues such as overfitting or underfitting, and select appropriate learning rates and optimization algorithms. The loss curve reveals that the model stabilizes within 300 iterations, indicating rapid convergence.
Figure 11 depicts the Precision Curve (P Curve), Precision–Recall Curve (PR Curve), and Recall Curve (R Curve). The P Curve illustrates how precision varies with different recall rates along the PR Curve. By examining this curve, one can select an appropriate threshold to maximize precision and evaluate the model’s performance across various recall levels. The PR Curve assesses the performance of a classification model under different thresholds. It showcases the relationship between a classifier’s precision and recall. Observing the PR Curve allows us to determine a suitable threshold that balances precision and recall, enabling an evaluation of the model’s performance across different categories. The R Curve demonstrates how recall changes with varying precision levels along the PR Curve. This curve aids in selecting a threshold to maximize recall and appraise the model’s performance at different precision levels. The distinct upward convexity of the P Curve indicates high precision across various thresholds. The substantial area under the PR Curve signifies that the model maintains high precision and recall in diverse scenarios. The prominent upward convexity of the R Curve suggests high recall at different precision levels, and its extensive area underscores the model’s excellent recall performance across various precision points.
Figure 12 presents the object detection results obtained using the proposed model in this paper. The upper section displays the labels, while the lower section showcases the detection outcomes. As is evident from the figure, the model effectively detects most defects accurately, demonstrating its remarkably high performance level.
(3)
Comparative Experiments with Mainstream Models
To objectively evaluate the performance of our model and demonstrate its value and advantages, we conducted a comparative analysis with mainstream models. This comparison helped to determine whether our model performs better than existing mainstream models on specific tasks, providing a basis for practical applications. Table 3 presents the comparison results with mainstream models.
From Table 3, we can observe that the algorithm proposed in this paper demonstrates superior performance in most categories and metrics. There is an improvement in accuracy by 0.5%, 3.1%, and 4.2%, respectively, and the defect recall rate increases by 0.1%. The remaining metrics either remain consistent or show minimal deviations.
Figure 13 illustrates the visualization results, where (a) represents the labeled image, (b) YOLOv4, (c) YOLOv5s, (d) YOLOv8n, and (e) the algorithm proposed in this paper. As seen in the figure, our proposed algorithm accurately detects all defects, indicating that the model introduced in this paper is more precise and stable in recognizing surface defects on steel rails, thus meeting the requirements for rail defect identification.

5. Conclusions

In this paper, we introduced a novel DPF architecture for detecting defects on the surface of steel rails. Specifically, (1) we obtained depth feature maps of different levels through a dual-path structure. (2) We used a symmetric feature attention fusion module to fuse feature maps of the same depth and put feature maps of different levels into the detection head for detection, thereby improving detection accuracy. Experiments were conducted on a public dataset with three defect categories. The accuracy of the proposed model reached 98.6% for defects, 94.1% for dirt, and 100% for gaps. Experimental data demonstrate that the proposed model exhibits strong competitiveness in performance compared to currently prevalent algorithms, satisfying the demand for the high-precision identification of rail defects.

Author Contributions

Conceptualization, G.C. and Y.Z.; methodology, G.C. and Y.Z.; software, G.C. and Y.Z.; validation, G.C. and Y.Z.; formal analysis, G.C. and Y.Z.; investigation, G.C. and Y.Z.; resources, G.C. and Y.Z.; data curation, G.C. and Y.Z.; writing—original draft preparation, G.C. and Y.Z.; writing—review and editing, G.C. and Y.Z.; visualization, G.C. and Y.Z.; supervision, G.C.; project administration, G.C.; funding acquisition, G.C. All authors have read and agreed to the published version of the manuscript.

Funding

This research is funded by Technology Innovation and Application Development Project of Chongqing Science and Technology Bureau, grant number Grant CSTB2023TIAD-GPX0049; cooperative projects between universities in Chongqing and the Chinese Academy of Sciences, grant number Grant HZ2021015; General Program of Chongqing Science Technology Commission: cstc2021jcyj-msxm3332; General project of Chongqing Municipal Science and Technology Commission, grant number cstc2021jcyjmsxm3332; Sichuan Science and Technology Program 2023JDRC0033; Young Project of Science and Technology Research Program of Chongqing Education Commission of China number KJQN202001513 and number KJQN202101501; Luzhou Science and Technology Program 2021-JYJ-92; Chongqing Postgraduate Scientific Research Innovation Project, grant number CYS23752; The Science and Technology Research Program of Chongqing Municipal Education Commission in China number KJZD-K202100104 and number KJQN202301543; The Natural Science Foundation of Chongqing, grant number cstc2021jcyjmsxmX1212; Oil and Gas Production Safety and Risk control Key Laboratory of Chongqing open fund, grant number cqsrc202110; Chongqing University of Science and Technology master and doctoral student innovation project, grant number ZNYKC2314; General Program of Chongqing Science Technology Commission, grant number cstc2021jcyj-msxm3332.

Data Availability Statement

Data are contained within the article.

Acknowledgments

We would like to thank Xiao Huang of the Hong Kong Polytechnic University for his guidance and support in the methods and experiments of this paper.

Conflicts of Interest

The authors declare no conflicts of interest.

References

  1. Anderson, R.T.; Barkan, C.P.L. Railroad accident rates for use in transportation risk analysis. Transp. Res. Rec. 2004, 1863, 88–98. [Google Scholar] [CrossRef]
  2. Shang, L.; Yang, Q.; Wang, J.; Li, S.; Lei, W. Detection of rail surface defects based on CNN image recognition and classification. In Proceedings of the 2018 20th International Conference on Advanced Communication Technology (ICACT), Chuncheon, Republic of Korea, 11–14 February 2018; IEEE: Piscataway, NJ, USA, 2018; pp. 45–51. [Google Scholar]
  3. Gasparini, R.; D’Eusanio, A.; Borghi, G.; Pini, S.; Scaglione, G.; Calderara, S.; Fedeli, E.; Cucchiara, R. Anomaly detection, localization and classification for railway inspection. In Proceedings of the 2020 25th International Conference on Pattern Recognition (ICPR), Milan, Italy, 10–15 January 2021; IEEE: Piscataway, NJ, USA, 2021; pp. 3419–3426. [Google Scholar]
  4. Soleimanmeigouni, I.; Ahmadi, A.; Nissen, A.; Xiao, X. Prediction of railway track geometry defects: A case study. Struct. Infrastruct. Eng. 2020, 16, 987–1001. [Google Scholar] [CrossRef]
  5. Feng, J.H.; Yuan, H.; Hu, Y.Q.; Lin, J.; Liu, S.W.; Luo, X. Research on deep learning method for rail surface defect detection. IET Electr. Syst. Transp. 2020, 10, 436–442. [Google Scholar] [CrossRef]
  6. Yu, H.; Li, Q.; Tan, Y.; Gan, J.; Wang, J.; Geng, Y.A.; Jia, L. A coarse-to-fine model for rail surface defect detection. IEEE Trans. Instrum. Meas. 2018, 68, 656–666. [Google Scholar] [CrossRef]
  7. Chen, Z.; Wang, Q.; He, Q.; Yu, T.; Zhang, M.; Wang, P. CUFuse: Camera and ultrasound data fusion for rail defect detection. IEEE Trans. Intell. Transp. Syst. 2022, 23, 21971–21983. [Google Scholar] [CrossRef]
  8. Zhou, W.; Hong, J. FHENet: Lightweight feature hierarchical exploration network for real-time rail surface defect inspection in RGB-D images. IEEE Trans. Instrum. Meas. 2023, 72, 5005008. [Google Scholar] [CrossRef]
  9. Papaelias, M.P.; Roberts, C.; Davis, C.L. A review on non-destructive evaluation of rails: State-of-the-art and future development. Proc. Inst. Mech. Eng. Part F J. Rail Rapid Transit 2008, 222, 367–384. [Google Scholar] [CrossRef]
  10. Zhang, J.; Zhang, J.; Chen, J.; Wang, S.; Wang, L. Rail Surface Defect Detection Through Bimodal RSDINet and Three-Branched Evidential Fusion. IEEE Trans. Instrum. Meas. 2023, 72, 2508714. [Google Scholar] [CrossRef]
  11. Feng, H.; Jiang, Z.; Xie, F.; Yang, P.; Shi, J.; Chen, L. Automatic fastener classification and defect detection in vision-based railway inspection systems. IEEE Trans. Instrum. Meas. 2013, 63, 877–888. [Google Scholar] [CrossRef]
  12. Alemi, A.; Corman, F.; Lodewijks, G. Condition monitoring approaches for the detection of railway wheel defects. Proc. Inst. Mech. Eng. Part F J. Rail Rapid Transit 2017, 231, 961–981. [Google Scholar] [CrossRef]
  13. Wei, X.; Yang, Z.; Liu, Y.; Wei, D.; Jia, L.; Li, Y. Railway track fastener defect detection based on image processing and deep learning techniques: A comparative study. Eng. Appl. Artif. Intell. 2019, 80, 66–81. [Google Scholar] [CrossRef]
  14. Ge, H.; Huat, D.C.K.; Koh, C.G.; Dai, G.; Yu, Y. Guided wave–based rail flaw detection technologies: State-of-the-art review. Struct. Health Monit. 2022, 21, 1287–1308. [Google Scholar] [CrossRef]
  15. Soukup, D.; Huber-Mörk, R. Convolutional neural networks for steel surface defect detection from photometric stereo images. In Proceedings of the International Symposium on Visual Computing, Las Vegas, NV, USA, 8–10 December 2014; Springer International Publishing: Cham, Switzerland, 2014; pp. 668–677. [Google Scholar]
  16. Li, Y.; Trinh, H.; Haas, N.; Otto, C.; Pankanti, S. Rail component detection, optimization, and assessment for automatic rail track inspection. IEEE Trans. Intell. Transp. Syst. 2013, 15, 760–770. [Google Scholar]
  17. Li, X.; Wang, W.; Hu, X.; Yang, J. Selective kernel networks. In Proceedings of the IEEE/CVF Conference on Computer Vision and Pattern Recognition, Long Beach, CA, USA, 15–20 June 2019; pp. 510–519. [Google Scholar]
  18. Zhang, Q.; Yang, Y.B. Rest: An efficient transformer for visual recognition. Adv. Neural Inf. Process. Syst. 2021, 34, 15475–15485. [Google Scholar]
  19. Gullers, P.; Dreik, P.; O Nielsen, J.C.; Ekberg, A.; Andersson, L. Track condition analyser: Identification of rail rolling surface defects, likely to generate fatigue damage in wheels, using instrumented wheelset measurements. Proc. Inst. Mech. Eng. Part F J. Rail Rapid Transit 2011, 225, 1–13. [Google Scholar] [CrossRef]
  20. Dong, H.; Song, K.; He, Y.; Xu, J.; Yan, Y.; Meng, Q. PGA-Net: Pyramid feature fusion and global context attention network for automated surface defect detection. IEEE Trans. Ind. Inform. 2019, 16, 7448–7458. [Google Scholar] [CrossRef]
  21. Yunjie, Z.; Xiaorong, G.; Lin, L.; Yongdong, P.; Chunrong, Q. Simulation of laser ultrasonics for detection of surface-connected rail defects. J. Nondestruct. Eval. 2017, 36, 70. [Google Scholar] [CrossRef]
  22. Vincent, O.R.; Babalola, Y.E.; Sodiya, A.S.; Adeniran, O.J. A Cognitive Rail Track Breakage Detection System Using Artificial Neural Network. Appl. Comput. Syst. 2021, 26, 80–86. [Google Scholar] [CrossRef]
  23. Cheng, X.; Yu, J. RetinaNet with difference channel attention and adaptively spatial feature fusion for steel surface defect detection. IEEE Trans. Instrum. Meas. 2020, 70, 2503911. [Google Scholar] [CrossRef]
  24. He, K.; Zhang, X.; Ren, S.; Sun, J. Deep residual learning for image recognition. In Proceedings of the IEEE Conference on Computer Vision and Pattern Recognition, Las Vegas, NV, USA, 27–30 June 2016; pp. 770–778. [Google Scholar]
  25. Liu, Z.; Mao, H.; Wu, C.Y.; Feichtenhofer, C.; Darrell, T.; Xie, S. A convnet for the 2020s. In Proceedings of the IEEE/CVF Conference on Computer Vision and Pattern Recognition, New Orleans, LA, USA, 18–24 June 2022; pp. 11976–11986. [Google Scholar]
  26. Liu, Z.; Lin, Y.; Cao, Y.; Hu, H.; Wei, Y.; Zhang, Z.; Lin, S.; Guo, B. Swin transformer: Hierarchical vision transformer using shifted windows. In Proceedings of the IEEE/CVF International Conference on Computer Vision, Montreal, BC, Canada, 11–17 October 2021; pp. 10012–10022. [Google Scholar]
  27. Wu, W.C.; Yin, C.C. Generation and directional decomposition of guided waves for finite-range defect detection in rail tracks. J. Mech. 2023, 39, 540–553. [Google Scholar] [CrossRef]
  28. Redmon, J.; Farhadi, A. YOLO9000: Better, faster, stronger. In Proceedings of the IEEE Conference on Computer Vision and Pattern Recognition, Honolulu, HI, USA, 21–26 July 2017; pp. 7263–7271. [Google Scholar]
  29. Hu, J.; Shen, L.; Sun, G. Squeeze-and-excitation networks. In Proceedings of the IEEE Conference on Computer Vision and Pattern Recognition, Salt Lake City, UT, USA, 18–22 June 2018; pp. 7132–7141. [Google Scholar]
  30. Liu, W.; Anguelov, D.; Erhan, D.; Szegedy, C.; Reed, S.; Fu, C.Y.; Berg, A.C. Ssd: Single shot multibox detector. In Proceedings of the Computer Vision—ECCV 2016: 14th European Conference, Amsterdam, The Netherlands, 11–14 October 2016; Proceedings, Part I 14; Springer International Publishing: Berlin/Heidelberg, Germany, 2016; pp. 21–37. [Google Scholar]
  31. Girshick, R. Fast r-cnn. In Proceedings of the IEEE International Conference on Computer Vision, Santiago, Chile, 7–13 December 2015; pp. 1440–1448. [Google Scholar]
  32. Hopfield, J.J. Neurons with graded response have collective computational properties like those of two-state neurons. Proc. Natl. Acad. Sci. USA 1984, 81, 3088–3092. [Google Scholar] [CrossRef] [PubMed]
  33. Hou, Q.; Zhou, D.; Feng, J. Coordinate attention for efficient mobile network design. In Proceedings of the IEEE/CVF Conference on Computer Vision and Pattern Recognition, Nashville, TN, USA, 19–25 June 2021; pp. 13713–13722. [Google Scholar]
  34. Gibert, X.; Patel, V.M.; Chellappa, R. Deep multitask learning for railway track inspection. IEEE Trans. Intell. Transp. Syst. 2016, 18, 153–164. [Google Scholar] [CrossRef]
  35. Yang, L.; Zhang, R.Y.; Li, L.; Xie, X. Simam: A simple, parameter-free attention module for convolutional neural networks. In Proceedings of the International Conference on Machine Learning, PMLR 2021, Virtual, 18–24 July 2021; pp. 11863–11874. [Google Scholar]
  36. Wang, Q.; Wu, B.; Zhu, P.; Li, P.; Zuo, W.; Hu, Q. ECA-Net: Efficient channel attention for deep convolutional neural networks. In Proceedings of the IEEE/CVF Conference on Computer Vision and Pattern Recognition, Seattle, WA, USA, 14–19 June 2020; pp. 11534–11542. [Google Scholar]
  37. Song, X.; Wang, Y.; Li, C.; Song, L. WDC-YOLO: An improved YOLO model for small objects oriented printed circuit board defect detection. J. Electron. Imaging 2024, 33, 013051. [Google Scholar] [CrossRef]
  38. Dong, J.Y.; Lv, W.T.; Bao, X.M. Research progress of the PCB surface defect detection method based on machine vision. J. Zhejiang Sci-Tech Univ. 2021, 45, 379–389. [Google Scholar]
  39. Akram, M.W.; Li, G.; Jin, Y.; Chen, X.; Zhu, C.; Ahmad, A. Automatic detection of photovoltaic module defects in infrared images with isolated and develop-model transfer deep learning. Sol. Energy 2020, 198, 175–186. [Google Scholar] [CrossRef]
  40. Silva, L.H.D.S.; Azevedo, G.O.D.A.; Fernandes, B.J.; Bezerra, B.L.; Lima, E.B.; Oliveira, S.C. Automatic optical inspection for defective PCB detection using transfer learning. In Proceedings of the 2019 IEEE Latin American Conference on Computational Intelligence (LA-CCI), Guayaquil, Ecuador, 11–15 November 2019; IEEE: Piscataway, NJ, USA, 2019; pp. 1–6. [Google Scholar]
  41. Tan, M.; Le, Q. Efficientnet: Rethinking model scaling for convolutional neural networks. In Proceedings of the International Conference on Machine Learning, PMLR 2019, Long Beach, CA, USA, 9–15 June 2019; pp. 6105–6114. [Google Scholar]
  42. Wang, C.Y.; Bochkovskiy, A.; Liao, H.Y.M. YOLOv7: Trainable bag-of-freebies sets new state-of-the-art for real-time object detectors. In Proceedings of the IEEE/CVF Conference on Computer Vision and Pattern Recognition, Vancouver, BC, Canada, 18–22 June 2023; pp. 7464–7475. [Google Scholar]
  43. Tan, M.; Pang, R.; Le, Q.V. Efficientdet: Scalable and efficient object detection. In Proceedings of the IEEE/CVF Conference on Computer Vision and Pattern Recognition, Seattle, WA, USA, 14–19 June 2020; pp. 10781–10790. [Google Scholar]
Figure 1. Structure of dynamic convolution.
Electronics 13 02564 g001
Figure 2. Structure of CBAM.
Electronics 13 02564 g002
Figure 3. Structure of feature pyramid.
Electronics 13 02564 g003
Figure 4. Overall architecture of the proposed dual-path feature fusion (DPF).
Electronics 13 02564 g004
Figure 5. Structure of Dy-Bottleneck (F).
Electronics 13 02564 g005
Figure 6. Structure of Dy-Bottleneck(M).
Electronics 13 02564 g006
Figure 7. Structure of Dy-Bottleneck (L).
Electronics 13 02564 g007
Figure 8. Schematic diagram of the detection head.
Electronics 13 02564 g008
Figure 9. Example images from the RailDefect steel defect dataset.
Electronics 13 02564 g009
Figure 10. Diagrams of changes during training process.
Electronics 13 02564 g010
Figure 11. The graphs of P Curve, PR Curve, and R Curve.
Electronics 13 02564 g011
Figure 12. Test results; the first row represents the labels, while the second row displays the model detection results.
Electronics 13 02564 g012
Figure 13. Data sample display diagram. (a): The labeled image; (b): YOLOv4; (c): YOLOv5s; (d): YOLOv8n; (e): the algorithm proposed in this paper.
Electronics 13 02564 g013
Table 1. Diagram of the main network backbone structure.
Main ModulesInput (Dual-Path) Size DimensionsOutput (Dual-Path) Size DimensionsQuantity
Max pooling640 × 640 × 3320 × 320 × 641
Conv 2D320 × 320 × 64160 × 160 × 1281
Dy-Bottleneck (F)160 × 160 × 128160 × 160 × 128 and 80 × 80 × 1281
Dy-Bottleneck (M) 1st160 × 160 × 128 and 80 × 80 × 128160 × 160 × 128 and 80 × 80 × 1282
Dy-Bottleneck (M) 2nd160 × 160 × 128 and 80 × 80 × 12880 × 80 × 256 and 40 × 40 × 2564
Dy-Bottleneck (M) 3rd80 × 80 × 256 and 40 × 40 × 25640 × 40 × 512 and 20 × 20 × 5124
Dy-Bottleneck (M) 4th40 × 40 × 512 and 20 × 20 × 51240 × 40 × 512 and 20 × 20 × 5122
Dy-Bottleneck (L)40 × 40 × 512 and 20 × 20 × 51220 × 20 × 10241
Table 2. Diagram of the ablation experiment.
NoDual-Path BackboneDynamic ConvolutionSymmetric AttentionCBAMP (%)R (%)mAP@0.5 (%)
1××××68.470.271.5
2×××73.265.171.4
3××87.468.072.5
4×91.593.697.2
5×93.895.897.3
6×94.194.197.3
797.593.898.3
Table 3. Comparison test results.
ModelP (%)R (%)mAP0.5 (%)
DefectDirtGapDefectDirtGapDefectDirtGap
SSD [37]68.463.387.470.267.158.071.569.972.8
Faster R-CNN [38]85.787.189.780.878.779.186.286.587.2
YOLOv3-tiny [39]90.190.691.382.983.283.088.890.189.7
YOLOv4 [40]92.391.693.287.8989.8690.8990.5590.3490.89
YOLOv5s [41]91.483.387.391.690.792.7591.391.694.4
YOLOv8n [42]91.589.810093.694.199.897.295.399.5
DETR [43]98.191.095.894.494.195.898.397.399.0
DPF98.694.110094.594.192.798.397.399.2
Disclaimer/Publisher’s Note: The statements, opinions and data contained in all publications are solely those of the individual author(s) and contributor(s) and not of MDPI and/or the editor(s). MDPI and/or the editor(s) disclaim responsibility for any injury to people or property resulting from any ideas, methods, instructions or products referred to in the content.

