Article

Research on Forging Dimension Online Measuring System Based on Vibration Point Cloud Compensation

1
Lianyungang JARI Automation Co., Ltd., Lianyungang 222006, China
2
National Key Laboratory for Precision Hot Processing of Metals, Harbin Institute of Technology, Harbin 150001, China
3
School of Mechanical Engineering, Jiangsu University of Science & Technology, Zhenjiang 212003, China
*
Author to whom correspondence should be addressed.
Electronics 2024, 13(13), 2494; https://doi.org/10.3390/electronics13132494
Submission received: 4 June 2024 / Revised: 15 June 2024 / Accepted: 19 June 2024 / Published: 26 June 2024
(This article belongs to the Special Issue Advanced Technologies in Robotics and Smart Manufacturing)

Abstract

Mechanical vibration in the high-temperature forging production line often causes large forging thermal dimensional measurement error in the detection task, so a vibration point cloud compensation method based on an acceleration sensor is proposed in this study. First, the vibration signal is obtained through the built-in acceleration sensor in the laser camera. After the acceleration of the camera vibration is detected, the displacement of the camera in three directions is solved by secondary integration. Subsequently, the coordinate value of the corresponding point is obtained by the rotation matrix transformation so as to compensate and correct the point cloud deviation caused by the camera vibration. Finally, the forging point cloud is matched using the surface matching algorithm in Halcon. An automatic forging production line for wheel hubs has been built, and the key dimensions of high-temperature forging products have been measured online using the developed method. After the forging point cloud is compensated, the average measurement error of dimensions is reduced from ±0.9 mm to ±0.1 mm, and the standard deviation is reduced from 0.52 mm to 0.056 mm. Using the vibration point cloud compensation method based on the acceleration sensor, as well as using silica aerogel insulation, vibration structural parts, heat insulation and constant temperature, a blue-violet 3D laser camera, and other measures, the dimensional detection accuracy of high-temperature forgings in the forging production line can be improved, and the instability of dimensional detection can be reduced.

1. Introduction

The hot dimensional inspection of forgings in automated forging production lines has always been a challenge in the industry due to the presence of strong vibrations in the forging environment [1,2,3]. It is difficult to meet the requirements of process inspection with the detection accuracy of forgings in the red-hot state obtained with conventional vision. Currently, most measurements are still carried out manually using physical contact methods such as standard inspection fixtures or vernier calipers [4,5,6]. Although the measurement accuracy is guaranteed to some extent, this type of detection has low efficiency and safety issues. With the development of measurement technology, non-contact 3D measurement methods based on machine vision have become the preferred means to obtain surface 3D data of forgings, and this method combined with industrial robots can achieve online thermal detection in automatic forging production lines [7,8,9].
At present, the main 3D measurement equipment for forgings includes LiDAR, binocular structured light cameras, and line laser 3D cameras [10,11,12]. LiDAR can avoid the influence of the harsh environments such as high temperatures and vibrations near forgings with the advantage of being able to measure over long distances. However, the data obtained have drawbacks such as sparsity, poor accuracy, and limited measurement views [13]. In order to achieve efficient digital measurement, Liu [14] has integrated Metascan and LiDAR and improved the accuracy of Metascan scanners by transforming the LiDAR coordinate system into a reference transformation coordinate system. Pan [15] has analyzed the influence of factors such as the distance to be measured, incident angle, and material properties on the measurement accuracy of LiDAR and improved the measurement accuracy of composite profiles through the variation law of signal-to-noise ratio. The binocular structured light camera has the advantages of calibration independent of the laser and can be replaced separately. Lei [16] used a binocular structured light camera to measure the rough- and fine-polished surface of optical components, greatly shortening the machining process. The application of binocular structured light cameras is greatly limited due to their high cost and performance degradation when the scene lacks features. An [17] compared performance and concluded that, in the field of workpiece surface flatness measurement, 3D line laser sensors have higher accuracy than 2D vision. The line laser 3D camera measurement device usually consists of a line laser and a camera. A single measurement can obtain the three-dimensional data of a line by projecting laser lines onto the object being measured. The mechanism needs to drive the camera or workpiece to move. This measurement device has the advantages of simple structure, high accuracy, and good stability [18,19].
Forging point clouds are a common three-dimensional (3D) data representation format. They consist of a large number of discrete 3D coordinate points, which are used to describe the three-dimensional geometric shape and features of the forged part. According to the analysis above, we can use a line laser 3D camera based on laser triangulation as the acquisition device for forging point clouds. Based on the point cloud of the forged part, we can rapidly obtain on-site detection of forging dimensions. However, in the environment of a forging plant, there are ambient vibrations generated by the operation of the forging press. When the impact of the forging press occurs, the measuring equipment at a certain distance from the forging press will be affected by low-frequency, large-amplitude vibration, and the vibration decays quickly [20,21]. It is difficult to accurately detect the dimensions of forgings online. Due to the complex sources of vibration caused by numerous forging presses in forging factories, it is difficult to predict and prevent them [22,23,24]. Based on this, our paper proposes firstly to compensate for three-dimensional point cloud data of forgings based on acceleration sensors. Then, we use a template matching algorithm to match the point clouds of forgings. Finally, we achieve online measurement of the hot dimensions of forgings during the forging process.

2. The Principle of Laser Triangulation Distance Measurement Technology

Laser triangulation distance measurement is based on geometric triangles, and calculates and determines parameters such as displacement between the measured target and displacement between the measured object and the laser source based on the laser spot position of the reflected laser beam hitting the surface of the measured object. Laser triangulation ranging technology is more suitable for precise measurements over short distances and is suitable for applications in fields such as robot vision systems.
Single-point laser triangulation measurement is achieved by projecting a beam of light onto the surface of the object being measured using a laser light source and then observing the position of the reflected light point through imaging in another direction to calculate the displacement of the object point [10].
According to the relationship between the incident light and the normal of the measured surface, measurement systems can be divided into two categories: direct and oblique. The principle of direct laser triangulation is shown in the following Figure 1.
The direct-beam laser triangulation sensor has a small spot and concentrated light intensity. When the measured surface moves along the measurement direction, the position of the light spot projected on the measured surface does not change, especially for the red-body surface of high-temperature forgings. The direct injection method can avoid measurement errors caused by laser speckle within a certain measurement range. Therefore, direct injection laser triangulation sensors are often used in engineering.
Because the position of the projected light spot will change, in order to achieve clear imaging on the detector’s photosensitive surface regardless of distance, a constant-focus optical path needs to be built, and the system’s optical parameters must meet the Scheimpflug condition as follows:
a 0 tan α = b 0 tan β
where a0 is the distance from the laser spot at the reference point to the main plane of the imaging lens; b0 is the distance from the spot image to the main plane of the imaging lens image; α is the angle between the optical axis of the imaging lens and the normal of the measured surface; and β is the angle between the optical axis of the imaging lens and the photosensitive surface of the CCD.
If the distance of the measured surface position moving in the direction of the laser axis is y, and the corresponding distance of the spot image moving on the photosensitive surface of the detector is x, then using the proportional relationship between the sides of similar triangles, it can be concluded that there is a relationship between y and x as follows:
y = a 0 x sin β b 0 sin α x sin ( α + β )

3. Construction of a Hot Dimensional Measurement Device for Forgings

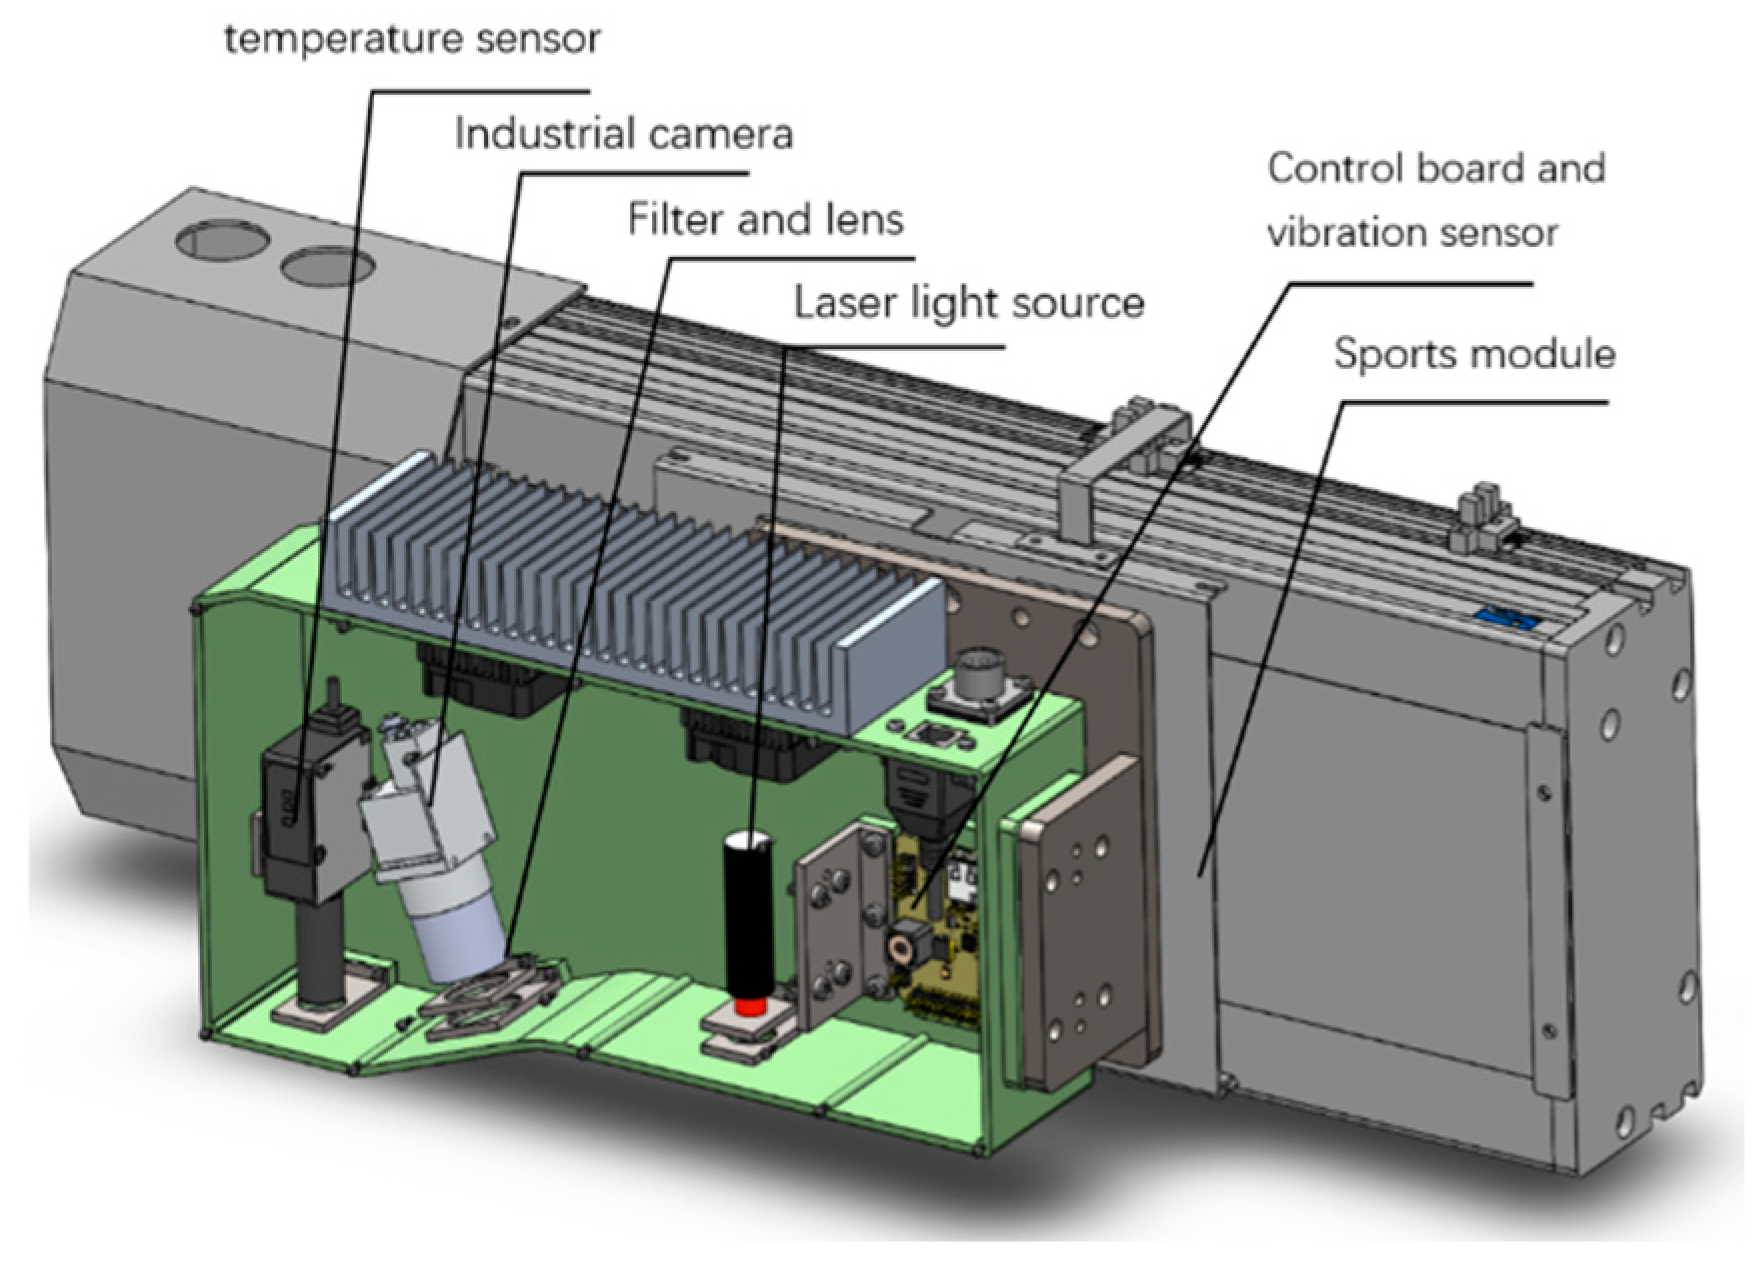
We first built a size measurement device as shown in Figure 2 to achieve online measurement of the hot dimensions of forgings based on vibration point cloud compensation. The device includes an industrial camera, laser source, vibration sensor, temperature sensor, etc.

3.1. Camera

Industrial cameras are the main sensing equipment for high-temperature forging inspection. The stability and reliability of the camera are directly related to the quality of image acquisition and the final detection results. For this reason, we selected a high-performance Photonfocus camera in the design. This camera can effectively adapt to the high-temperature radiation environment of forgings and can operate continuously and stably in the corresponding scenarios. In addition, the camera comes with an independent overall electronic shutter technology, which can easily adjust the camera’s exposure time and achieve extremely short exposure times to obtain clear images of high-speed moving targets. Due to the different temperatures of forgings, their infrared radiation intensity also varies. Therefore, the exposure time of the camera can be dynamically adjusted based on the temperature value of the temperature measurement unit.
This platform aims to detect high-temperature forgings with dimensions of 400 mm × 400 mm, and the detection accuracy required is 0.2 mm. To generate a three-dimensional point cloud model of high-temperature forgings through laser contour scanning, the resolution in the X direction of the camera needs to meet the following requirements:
r e s o l u t i o n   r a t i o = F O V Accuracy   of   detection
where FOV represents the field of view and takes a value of 400 mm.
Therefore, the resolution in the X direction of the camera needs to be no less than 2000. Based on this resolution metric, we selected the camera model PhotoFocus MV1-D2048-3D03, which has a resolution of 2048 × 1088, a pixel value of 2 million, and an effective photosensitive area size of 11.26 mm × 5.98 mm.

3.2. Laser Light Source

The laser is a single frequency and highly concentrated energy beam with the advantages of good convergence and is widely used in fields such as 3D object measurement and spatial surveying. According to the wavelength, lasers can be sequentially divided into X-ray lasers, ultraviolet lasers, visible light lasers, infrared lasers, etc. Among them, visible light lasers can be further divided into blue-violet lasers, green lasers, and red lasers.
The temperature of high-temperature forgings is severely interfered with by the laser used for detection, resulting in an increase in detection errors. The temperature is generally between 700 and approximately 1300 °C, showing a reddish heating state and emitting a large amount of red or infrared radiation light outward, with a wavelength generally greater than 650 nm. Although the wavelengths of the X-ray laser and the ultraviolet laser are much smaller than those of red light, they are not suitable for testing high-temperature forgings due to their expense, strong penetration, and high radiation risks. The blue-violet laser is suitable for high-temperature forging detection, with a wavelength range of generally 400–473 nm, which is significantly different from the wavelength of red light, and has a moderate cost and low radiation risk. Therefore, in this paper, we use a blue-violet laser as the detection light source. The laser model chosen is the Zlaser ZM18 405 nm, which is made in Freiburg, Germany.

3.3. Filters and Lenses

Considering that high-temperature forgings emit infrared thermal radiation and the detection light source is a blue-violet laser, we chose a 405 nm bandpass blue-violet light filter, which can effectively shield light other than the blue-violet laser and improve detection quality.
If the working distance range between the camera and the high-temperature forging is 500 mm~1000 mm, the required lens focal length f is
f = d w s p s f
where dw represents the working distance range of the camera, sp represents the photosensitive size in the X direction of the camera, which is 11.26 mm, and sf represents the field of view size, which is 400 mm. Therefore, the focal length range of the camera lens is calculated to be 14 mm~28 mm. Therefore, a model AZURE 2518M3M lens is selected, with a focal length of 25 mm and a working distance of 890 mm.

3.4. Vibration and Temperature Sensors

In response to the characteristics of low-frequency vibration and high temperature in forging environments, we have chosen capacitive three-axis acceleration sensors in the platform design. Compared with piezoelectric acceleration sensors, they have the characteristics of having high sensitivity, are less influenced by temperature, and have good environmental adaptability. They are more commonly used for low-frequency measurement, with high accuracy, and are suitable for applications in forging environments.
We have chosen a Keens FT series digital infrared temperature sensor, FT-H40K, with a range of 0–1350 °C and an effective temperature measurement distance of 100–800 mm. It meets the temperature detection requirements of forgings and can compensate for size detection of thermal expansion.
The hardware composition of the detection equipment is shown in Figure 1. The sensors of the detection equipment are fixed on the workbench, and the sensor is driven by a servo motor to complete the scanning of the forging. The detection equipment mainly collects external point cloud information and temperature information through sensors inside the equipment for measuring high-temperature forgings. The recognition accuracy of the forging edges is improved through point cloud compensation based on vibration signals and image processing algorithms.

4. Algorithm Design

In order to achieve high-precision online measurement of forgings in a forging environment, taking hub forgings as an example, we design a dimension measurement process as shown in Figure 3, which includes three stages: (1) three-dimensional point cloud data compensation of forgings based on acceleration sensors; (2) forging detection based on surface template matching; and (3) measurement of the forging dimensions.

4.1. 3D Point Cloud Data Compensation for Forgings

The vibration at the forging site mainly comes from the operation of the press, and this vibration signal tends to be stable because the working rhythm of the press is relatively stable. When designing the detection platform, we embedded an acceleration sensor in the laser camera to obtain vibration signals in the forging environment. Then, we performed frequency-domain quadratic integration on the vibration acceleration signal to obtain the displacement values of the camera in three directions and obtained the coordinate values of the corresponding points through rotation matrix transformation, thereby compensating for the point cloud deviation caused by camera vibration. The steps in the point cloud data compensation algorithm are as follows:
Step 1: Calculate the vibration offset of the camera in three directions.
If the discretized vibration acceleration captured by the built-in accelerometer in the laser camera is a(n) and its corresponding spectrum is X ( k ) , then
X ( k ) = n = 0 N 1 a ( n ) e j ( 2 π n k / N )
a ( n ) = 1 N k = 0 N 1 X ( k ) e j ( 2 π n k / N )
where N represents the amount of data collected; n, k is a non-negative integer, and j is an imaginary unit.
The spectral line of the discretized vibration acceleration a(n) corresponds to a sine wave in the time domain:
a k ( t ) = X ( k ) e j ω k t
L k ( t ) = 0 t [ 0 t a k ( t ) d t ] d t = 0 t [ 0 t X ( k ) e j ω k t d t ] d t = X ( k ) ( j ω k ) 2 e j ω k t
We obtain
L ( n ) = 1 N N 1 k = 0 X ( k ) ( j ω k ) 2 e j ( 2 π n k / N )
where ω k = 2 π k Δ f ; Δ f = F S / N is frequency resolution.
Thus, the displacement offsets Lx, Ly, and Lz generated by vibration in the X, Y, and Z directions can be calculated separately.
Step 2: Convert the camera’s three directional offsets to the coordinate system.
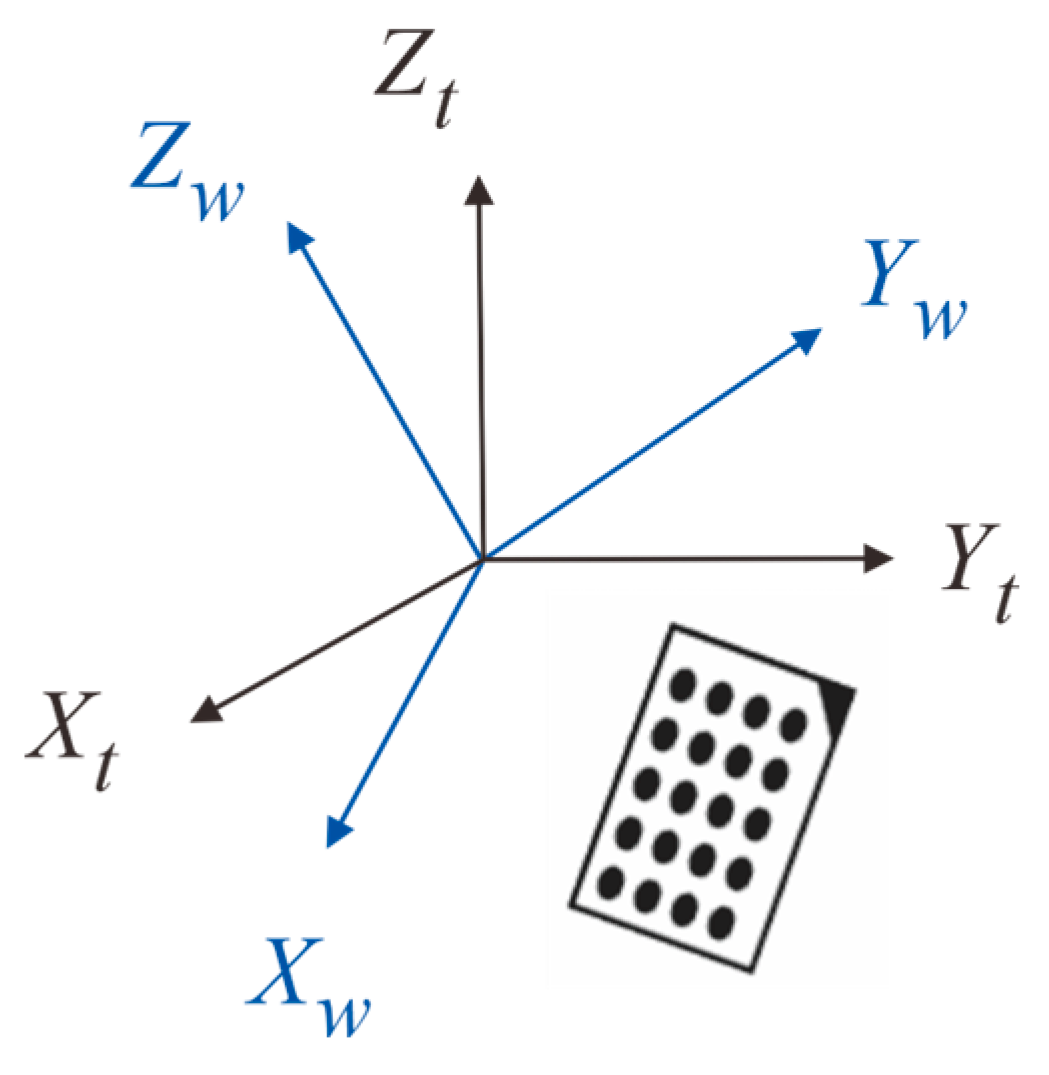
We convert the offset obtained from the vibration sensor coordinate system to the world coordinate system provided by the laser camera measurement system to achieve point cloud data compensation as shown in Figure 4.
We first use a calibration board to calibrate the industrial camera in the measurement platform to obtain the internal and external parameters of the camera, and determine the world coordinate system (WCS) on the same plane; then, within the effective field of view of the camera, we use a spirit level to determine the horizontal plane and construct a temporary coordinate system TCS on that horizontal plane; next, based on the corresponding feature points of the calibration board in WCS and TCS, we determine the rotation matrix M of TCS relative to WCS, as shown in Figure 5 and Equations (10)–(13):
State i case:
T g ( i ) b × T c g × T t ( i ) c = T t b
where T g ( i ) b is in state i and is the homogeneous matrix that transforms a point expressed in the gripper frame to the robot base frame, which can be obtained using the positive kinematics of the robotic arm; T c g is the homogeneous matrix that transforms a point expressed in the camera frame to the gripper frame; T t ( i ) c is in state i and is the homogeneous matrix that transforms a point expressed in the target frame to the camera frame, which can be obtained using the camera; T t b is the homogeneous matrix that transforms a point expressed in the target frame to the robot base frame.
State j case:
T g ( j ) b × T c g × T t ( j ) c = T t b
where T g ( j ) b is in state j and is the homogeneous matrix that transforms a point expressed in the gripper frame to the robot base frame, which can be obtained using the positive kinematics of the robotic arm; T t ( j ) c is in state j and is the homogeneous matrix that transforms a point expressed in the target frame to the camera frame.
Using Equations (10) and (11), we obtain:
( T g ( j ) b ) 1 × T g ( i ) b × T c g = T c g × T t ( j ) c × ( T t ( i ) c ) 1
The calibration plate is photo-identified by transforming the robot pose several times, and T c g can be obtained by combination with the least-squares method. So, we obtain M:
M = T c g = R x ( α ) R y ( β ) R z ( γ )
where Rx(α), Ry(β), and Rz(γ) are the rotation matrices in the X, Y, and Z directions defined as (14)–(16), and α, β, and γ are the radians of rotation around the X, Y, and Z axes, respectively.
R x ( α ) = [ 1 0 0 0 cos α sin α 0 sin α cos α ]
R y ( β ) = [ cos β 0 sin β 0 1 0 sin β 0 cos β ]
R z ( γ ) = [ cos γ sin γ 0 sin γ cos γ 0 0 0 1 ]
From rotating matrix M, the displacement offsets Lx, Ly, and Lz under TCS can be transformed into WCS and denoted as Lwx, Lwy, and Lwz.
Step 3: Use the offset in the world coordinate system to compensate for the scanned point cloud data of the workpiece to be tested.

4.2. Forging Detection Based on Surface Template Matching

In this paper, we mainly use a template matching method for forging inspection, which includes steps such as creating a global model of the forging point cloud, selecting reference points for forging inspection, and correcting the forging pose. We first create a global model description of the forging, then obtain the forging detection reference points through Hough voting. Finally, we use the ICP algorithm to match the selected forging detection reference points and complete the forging pose correction with the least-squares method.

4.2.1. Creating a Global Model of Forging Point Cloud

The creation of a global model for the forging point cloud includes point cloud acquisition and description. The former can be based on the CAD model of the forging or the use a line laser 3D camera to capture standard forgings and obtain 3D point cloud data through 3D reconstruction. There is a deviation between the actual forgings produced by different molds and the forging drawings in CAD drawings, as the forging site not only has complex actual working conditions, but there is also wear and tear on the molds produced. Considering the memory size occupied by the template, algorithm execution time, and recognition stability during forging inspection, we ultimately conducted uniform sampling of 300–5000 fixed number points on the surface of standard forgings on a stable site to obtain point cloud data.
We use a point-to-point pattern to describe the global model, where each point pair contains two surface points and their corresponding normal vectors. Normal vector extraction mainly involves fitting the data points around the point into a plane, and then using the normal vector of that plane as the normal vector of that point.
Figure 6a is a schematic diagram of feature description in a point-to-point model, including two points m1 and m2, as well as their normal vectors n1 and n2. The features of a point-to-point model can be represented by F(m1, m2) = (F1, F2, F3, F4). In the figure, d is the vector m1m2, F1 is the distance from point m1 to m2 naming ||d||2, and angles F2 and F3 are the angles formed by vectors n1 and n2 with vector d, respectively. F4 is the angle between the normal vectors n1 and n2. We first store the above point pairs in a hash table in advance, as shown in Figure 6b, and use the discrete point pair features as the key code values of the hash table. Then, point pairs with similar feature values are saved in the same position in the hash table to improve the search efficiency in the recognition stage and ensure the stability of the algorithm.

4.2.2. Selection of Reference Points for Forging Inspection

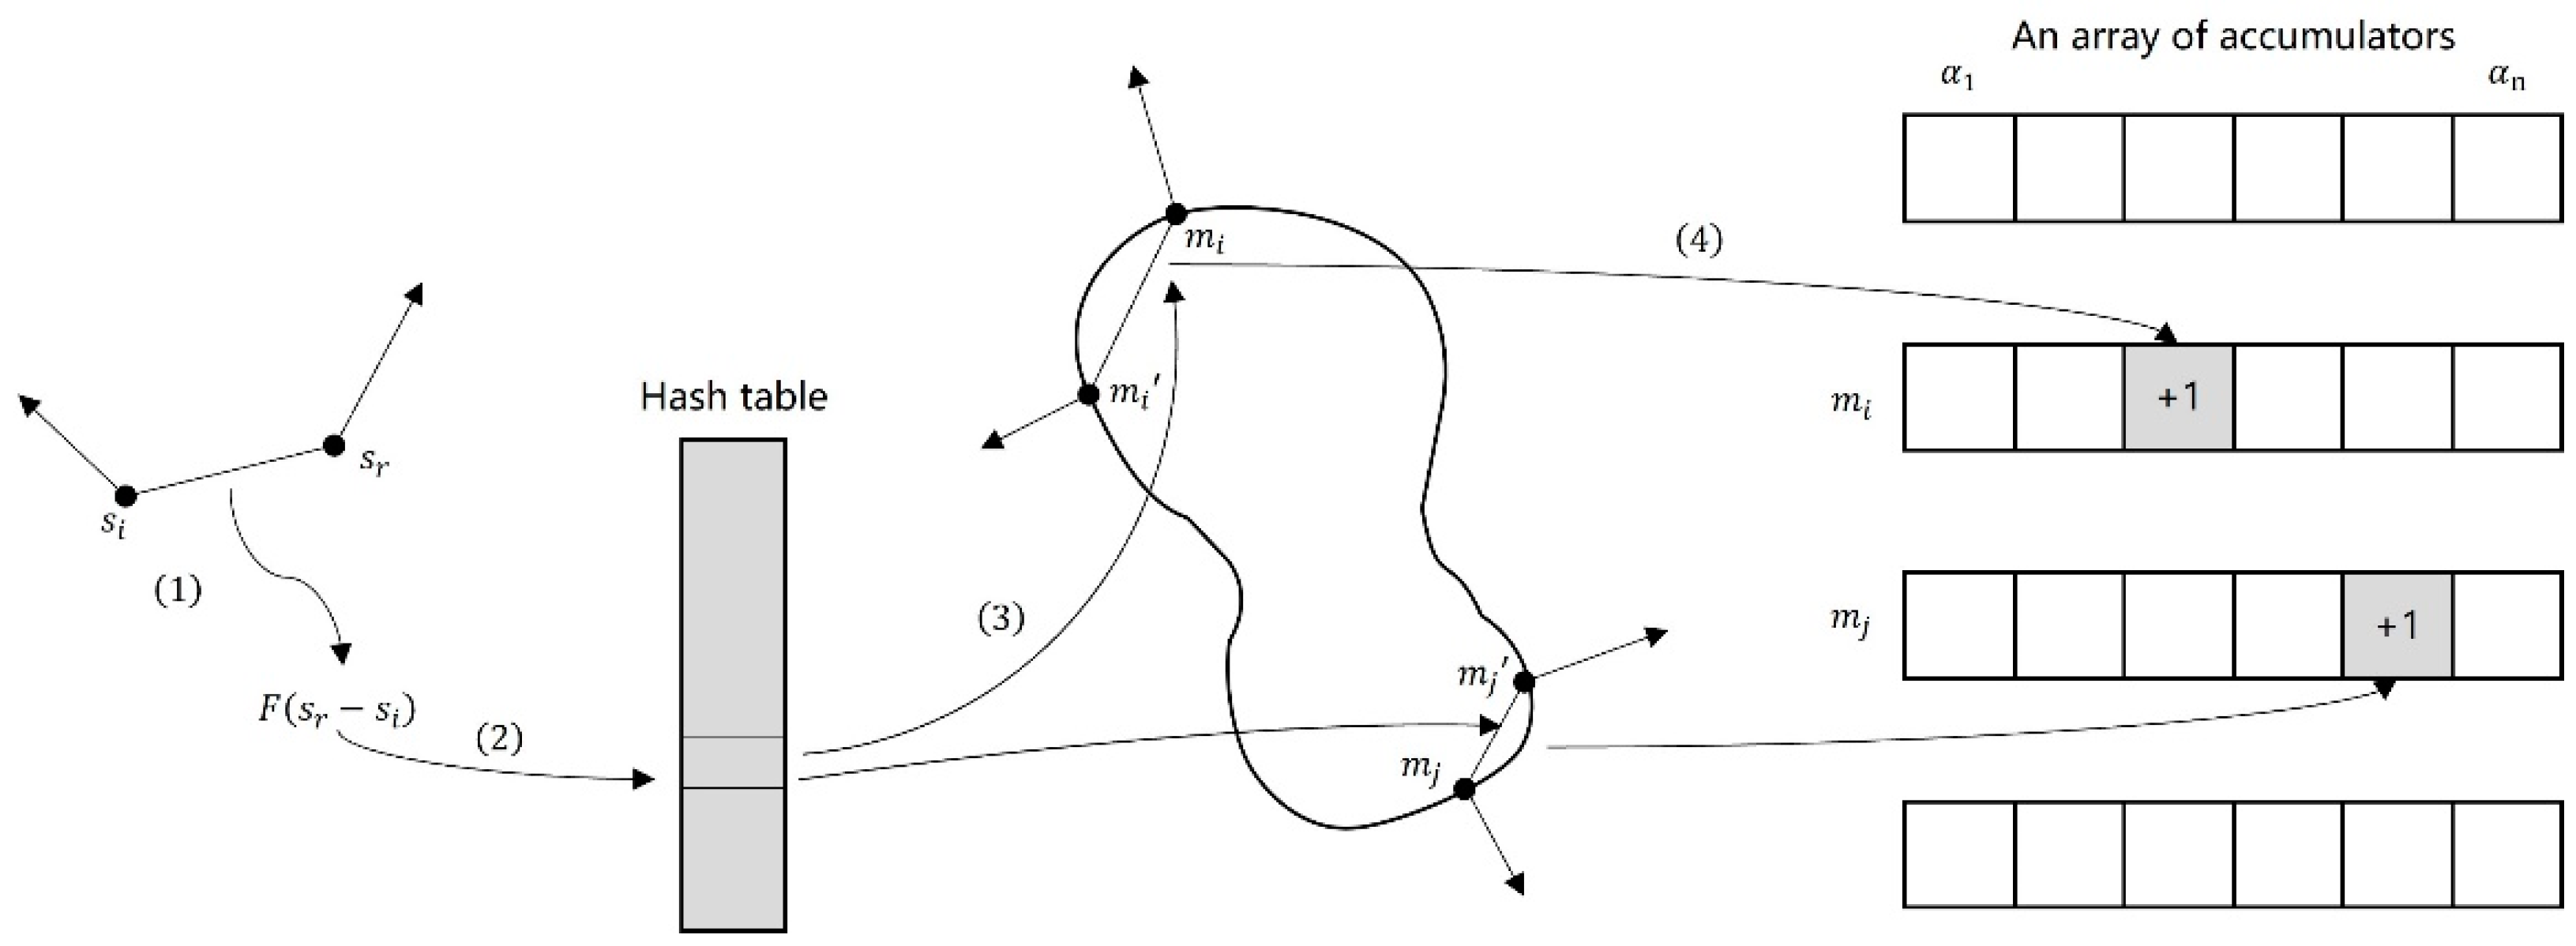
For the obtained global model of the forging point cloud, we use the generalized Hough transform method for reference point selection, and use local parameters as Hough transform parameters [25]. Firstly, we generate an all-zero n × m accumulator array, where m is the number of forging template points and n is the number of rotation angle samples. For the above forging point cloud model, we take a point pair composed of a reference point sr and surrounding field scenic spots si as the algorithm input, and first calculate the characteristic values F(sr,si) of all point pairs; then, we search for point pairs in the hash table that are similar to the feature values in the template; finally, we self-add the vote count at the corresponding position in the accumulator array.
We can calculate the pose of an object by rotating the angle. When all points are paired with their reference points, the data corresponding to the maximum value in the accumulator array is the best reference point for the current reference point. We follow Figure 7 for voting selection to make reference point selection faster and more stable. In the figure, sr is the selected reference point, si is the other paired scenic spots, and F(sr,si) is the feature value of each pair of points. We first use F(sr,si) as the key code value for table lookup to obtain all similar template point pairs; then, we sample and calculate the local parameters of each template point pair, and perform a self-adding vote count on the corresponding accumulator array units to ensure that all reference points have at least one candidate score; finally, we use the counts in the accumulator array as the corresponding reference point scores, remove candidates with similar poses from all selected candidates, and determine whether the two poses are similar in rotation and translation based on a preset threshold.

4.2.3. Forging Pose Correction

We use the least-squares method to correct the forging pose within the framework of the iterative nearest point (ICP) algorithm to ensure accuracy, as the selection of reference points is affected by sampling accuracy, and the accuracy of the forging pose obtained through vote counting is also limited. When the initial pose is known accurately enough, the ICP algorithm can align the template point cloud with the collected point cloud. The algorithm consists of two steps, that is, first for each point in the first point cloud, we determine the nearest point in the second point cloud and then we calculate the position that minimizes the sum of squared distances between all corresponding points.
In the k-th iteration of the algorithm, the following equation can be applied to search for the corresponding point of the nearest template point mc(i) for each sampling point:
c ( i ) = arg j min T k s i m j
where, si is the sampling point set, mj is the template point set, and Tk is the transformation matrix of the pose at the k-th iteration, that is, the transformation sampled to the template. In the subsequent pose estimation, we take the transformation matrix with the smallest squared distance between the corresponding points:
T k + 1 = a r g T min i T s i m c ( i ) 2
The iteration process stops when the pose reaches the preset accuracy or the maximum number of iterations. Figure 8 shows the comparison of the pose before and after point cloud correction for forgings. It can be seen from the figure that the point cloud image of the forgings after correction is more complete.

4.3. Measurement of Forging Dimensions

After completing the correction of the forging, dimension measurement can be carried out, including the inner and outer diameters of the upper and lower surfaces of the forging, as well as the dimensions at each height. The size measurement process is as follows: firstly, we use the least-squares method to fit the outer plane, step plane, and inner plane of the step, and obtain a three-layer planar point cloud; then, we calculate the distance from each point to its plane to eliminate noise that deviates significantly from the plane, thereby improving the quality and accuracy of point cloud data; next, we use edge detection operators for edge extraction to obtain the inner and outer diameter contours of the forgings; subsequently, we use the least-squares method to fit the point set of each planar contour to obtain the diameter information of the forging, and calculate the distance between different planes to obtain the height information of the forging; and, finally, the final dimension value of the forging is obtained by taking multiple samples from multiple directions and taking the average value.

4.3.1. Point Cloud Fitting of Three-Layer Planes for Forgings

To perform point fitting on 3D point cloud data in the same plane and minimize the sum of distances from the relevant point cloud data (x, y, z) to the fitting plane, we construct the equation:
A x = b
where A is an m × 4 matrix, where m is the number of points, and each row corresponds to the coordinates of a point [x, y, z, 1], x is a 4 × 1 vector containing plane parameters [a, b, c, d] and b is a vector with all zeros and its dimension is m × 1.
We define the objective function for minimizing the sum of squared errors:
min f ( x ) = A x b 2
Taking the first-order partial derivative of the objective function with respect to x as zero yields:
A T A x = A T b
Thus, the least-squares solution is obtained as follows:
x = ( A T A ) 1 A T b
Filter and denoise the planar point cloud data according to the set threshold after completing the planar fitting.

4.3.2. Edge Extraction of Forging Contour

We mark the point coordinates of the filtered point cloud data as (xRi, yRi, zRi), i = 1, 2, …, n. We construct the covariance matrix of the point cloud data:
C = i = 1 n [ ( x R i x ¯ ) ( x R i x ¯ ) T ( y R i y ¯ ) ( y R i y ¯ ) T ] n 1
where x ¯ = i = 1 n x R i n , y ¯ = i = 1 n y R i n .
By performing eigenvalue decomposition on the above equation, we can obtain the eigenvector v = (vx, vy, vz). The feature vector v is the normal vector of the plane. We set the reference direction to the z-axis, i.e., (0,0,1), and calculate the angle between the normal vector and the reference direction:
θ = arccos [ ( v x 2 + v y 2 ) 0.5 | v | ]
We set angle threshold θth: if θi > θth, then the corresponding points ( x R i , y R i , z R i ) are edge points. We can extract contour edges using these points.

4.3.3. Edge Fitting of Forging Contour

We mark the coordinates of the extracted contour edge points as (xCi, yCi, zCi), i = 1, 2, …, n, and set the center coordinates of the edge circle as (ac, bc) and the radius as rc. Then, we can obtain the equation for the contour edge fitting circle:
( x a c ) 2 + ( y b c ) 2 = r c 2
Based on the obtained point cloud contour point set, we establish the optimized objective function:
min i = 1 n [ ( x c i a c ) 2 + ( y c i b c ) 2 ] 2
We can obtain the center coordinates and radius by using the least-squares method to solve the above equation.

4.3.4. Obtaining Forging Dimensions

We can obtain the diameter of the wheel hub based on the circle radius obtained by contour edge fitting and obtain the height values of each step of the wheel hub by calculating the distance between the point cloud data of the fitted edges of each step of the wheel hub.

5. Experimental Setup

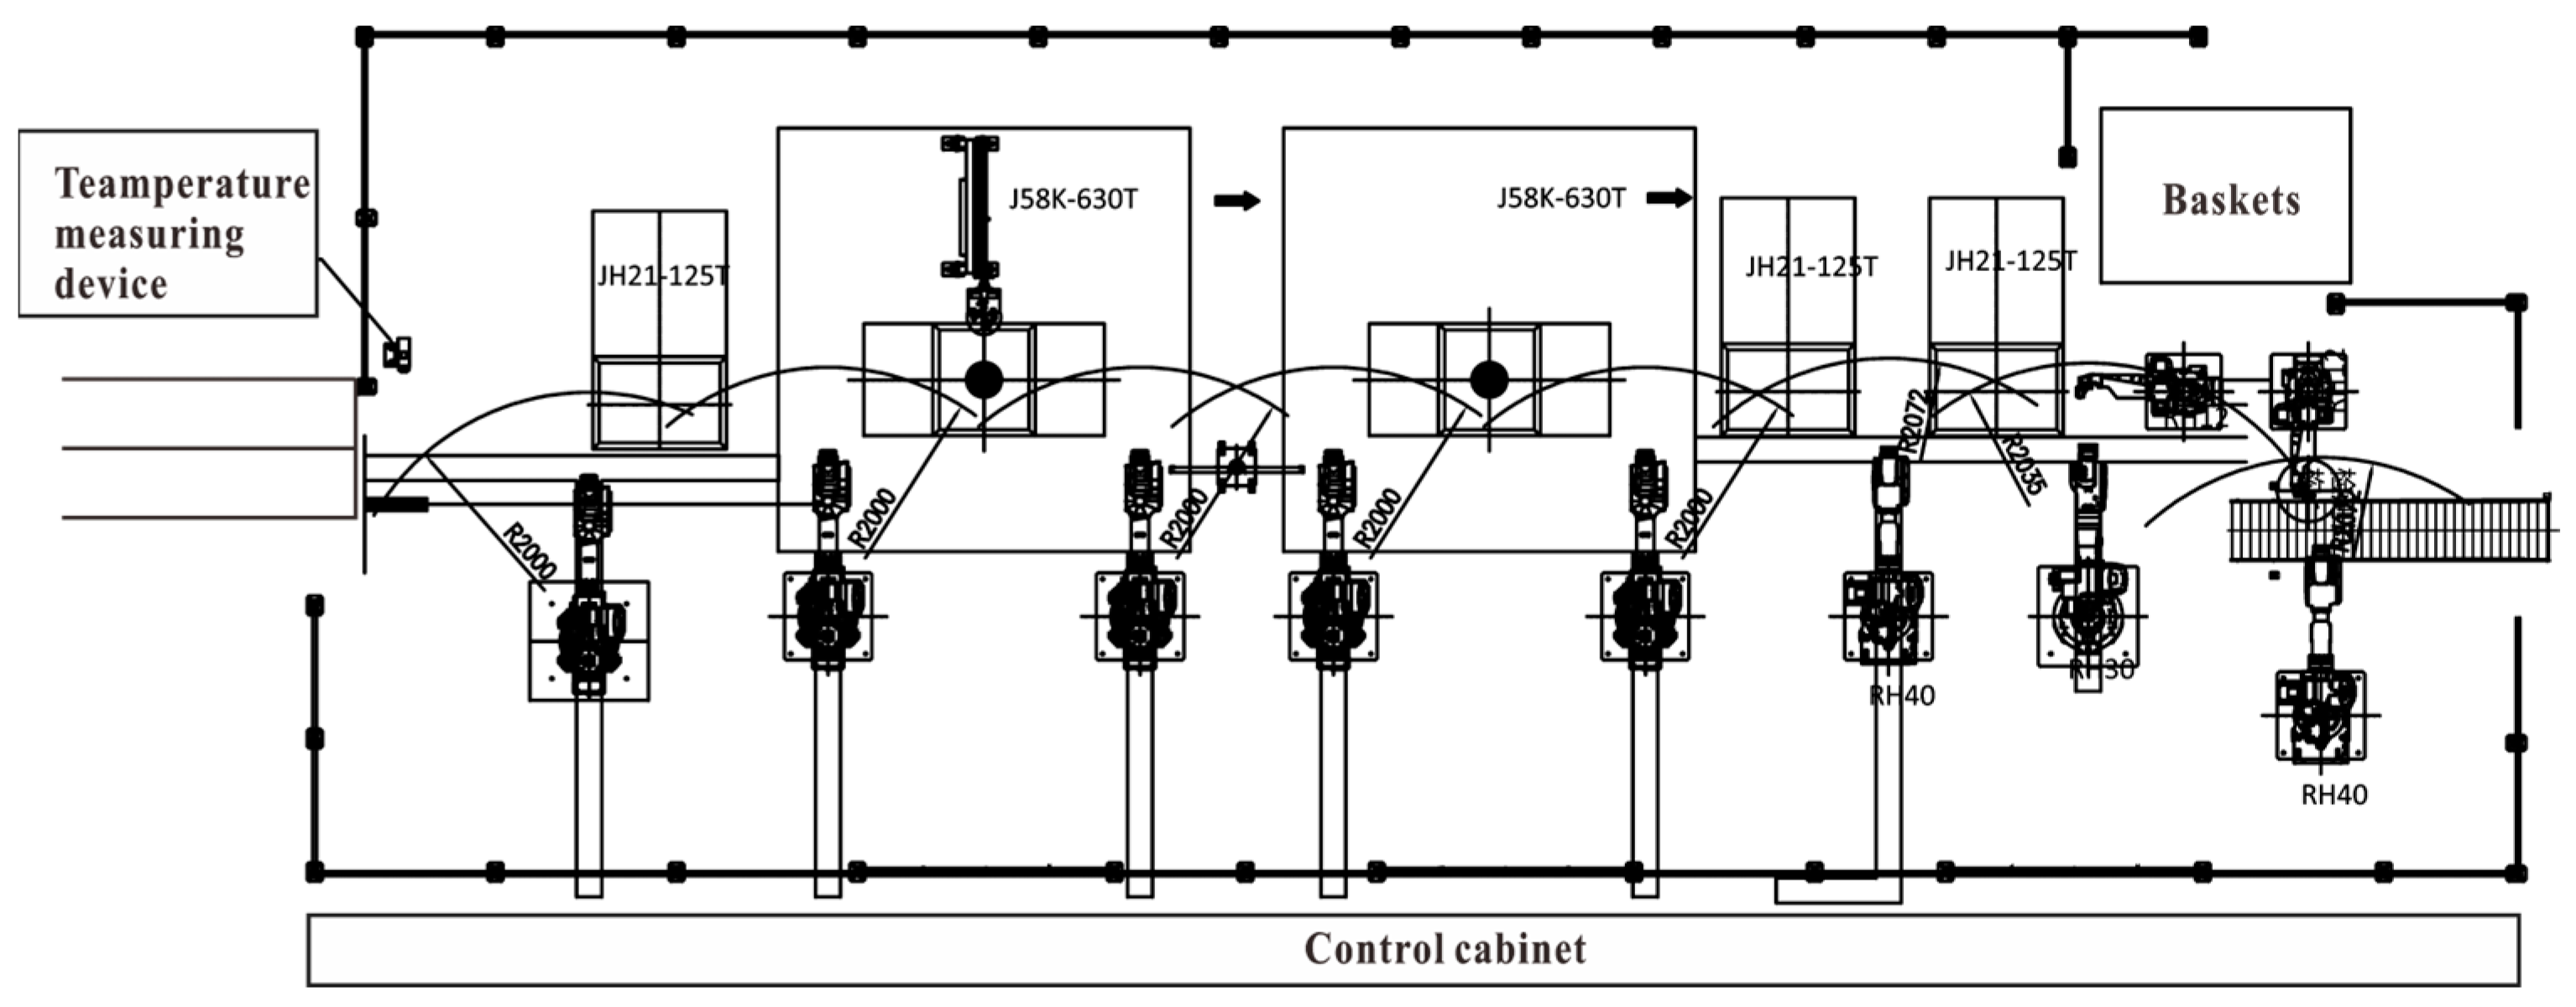
We will apply the experimental setup and design method we have built to the wheel hub automated forging production line shown in Figure 9 to verify the effectiveness of the online detection method for forging size based on vibration point cloud compensation. This production line includes a medium-frequency furnace, an upsetting press, an initial forging press, a final forging press, a punching machine, an edge cutting machine, an inspection table, a cutting conveyor, and 10 robots. The robot driven detection device scanned the upper surface, left and right sides, and bottom surface of the forgings a total of four times to meet the requirements of flexible customized detection of hub forgings in all directions and dimensions. Figure 10 shows the scanning status of the upper surface and left side.
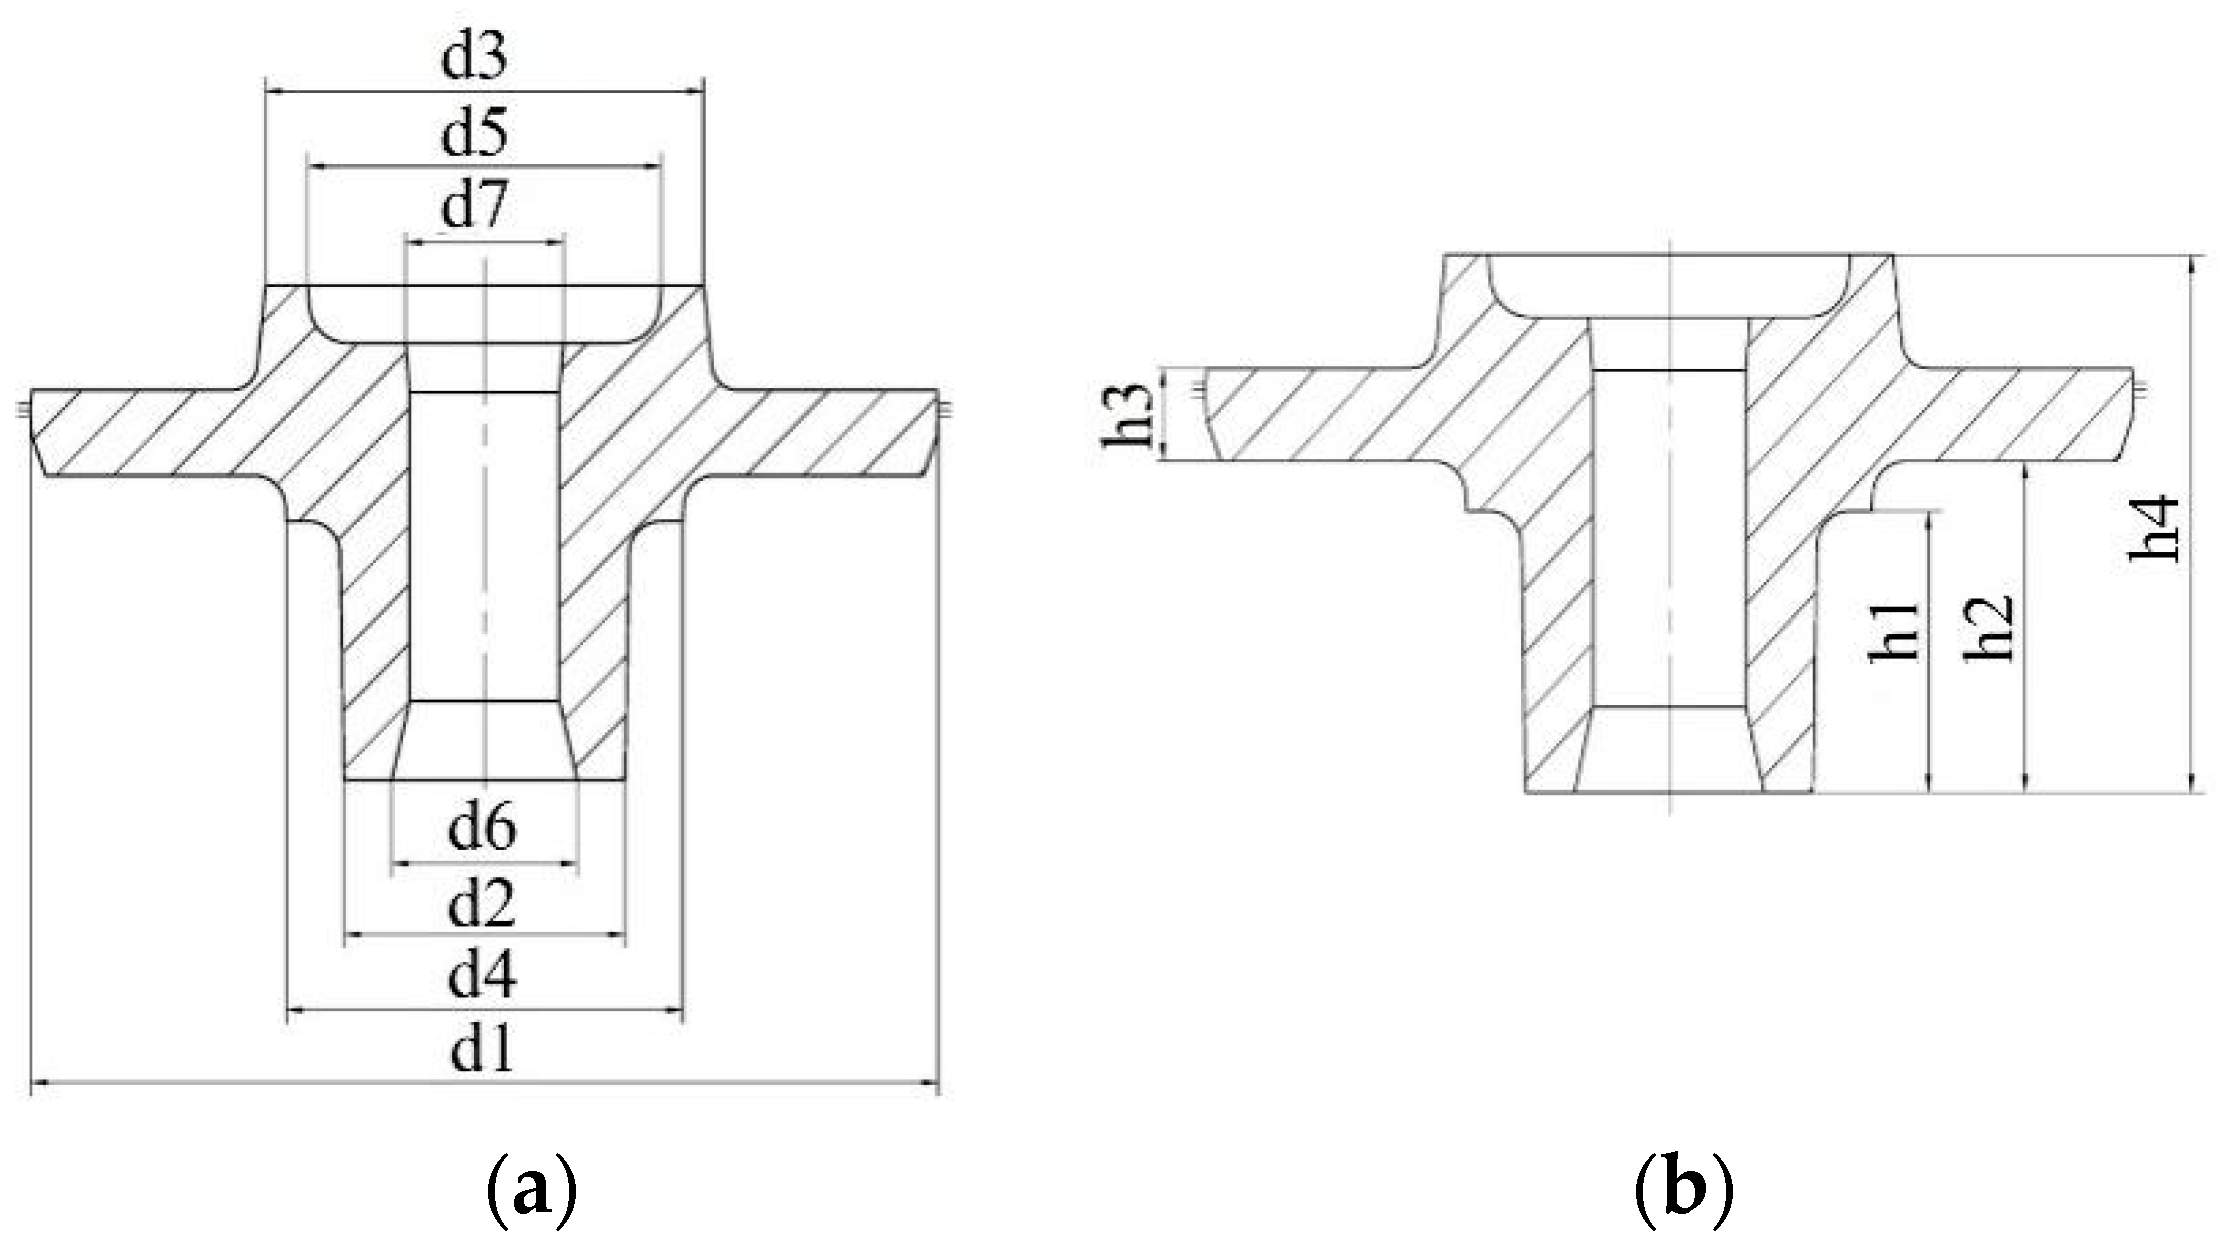
Hub forgings are key components connecting the hub and body of automobiles, but the diameter of the forgings, outer diameter of the three sleeves, and outer diameter of the core shaft often deviate from the tolerance range due to abnormal changes in process parameters such as billet temperature and press speed. The quality of forgings requires the measurement of diameter and height dimensions as shown in Figure 11.

6. Experimental Testing and Analysis

We use the designed forging hot dimensional measurement device to scan the front, side, and back of the forging, and obtain the data height changes to obtain the original data of the three-layer forging point cloud as shown in Figure 12, and fit the three-layer planes separately. However, it can be seen that there are many noise and ghosting phenomena in the point cloud image, indicating that vibration has a significant impact on the scanning results of the point cloud in Figure 12. Then, based on the distance between points and surfaces, we eliminate noise and use a three-dimensional point cloud compensation method for forgings based on acceleration sensors to compensate for the errors caused by vibration, thus obtaining the point cloud shown in Figure 13. In Figure 13, it can be seen that the noise and ghosting are significantly reduced, indicating that the influence of vibration in the forging site on the detection of the scanned point cloud has been effectively suppressed. We obtain the contour data of the forging corresponding to three layers of planes and fit the circles based on the compensation of the forging point cloud, as shown in Figure 14. Finally, we conduct multiple multidirectional sampling on the forgings and take the average to obtain the final dimensions of the forgings, as shown in Figure 15.
Table 1 presents the results of multiple measurements with a surface diameter of 3 on the forging. From the table, it can be seen that the measurement data before compensation fluctuates greatly and sometimes deviates significantly from the theoretical value. The standard deviation of the 12 uncompensated experimental measurement results is 0.52, but after compensation, the fluctuation of the measurement data is significantly reduced, and the standard deviation is only 0.056, with an error of only ±0.1 mm compared to the theoretical value. From this, it can be seen that point cloud compensation greatly improves the measurement accuracy of the forging dimensions. Table 2 shows the measurement results of the dimensions of each scanning surface of the forgings after point cloud compensation. It can be seen from the table that the measurement error of each dimension of the forgings can be controlled within ±0.1 mm, which can meet the process requirements of online thermal inspection of wheel hub forgings.

7. Conclusions

We propose an online measurement method based on vibration point cloud compensation to improve the accuracy of hot dimensional measurement of forgings in harsh forging environments, based on the construction of a forging hot dimensional measurement device. We can draw the following conclusions through experimental testing and analysis:
  • We achieved compensation for the deviation of the point cloud of the workpiece to be measured by integrating the vibration signal obtained from the built-in accelerometer and transforming the displacement offset under TCS to WCS through the rotation matrix, reducing the impact of forging machine vibration on the point cloud data of the forging;
  • We use the Hough voting method to obtain the forging detection reference point based on the standard forging uniform sampling of the forging global model. We improve the integrity of the forging point cloud map by using the ICP algorithm to match the reference points and complete the forging pose correction;
  • On the basis of compensating for point cloud data of forgings and correcting the pose of forgings, we achieve a series of diameter and height measurements of hub forgings through fitting the forging plane point cloud, extracting the contour edge of forgings, and fitting the forging edge. The measurement accuracy was significantly improved.
Robot-based forging automation production lines have become the development direction of intelligent manufacturing due to the harsh working environment of forgings. The dimensional accuracy of forgings is crucial to their quality. The vibration compensation of forging machines is achieved through a built-in acceleration sensor and its signal processing, which not only reduces the labor intensity of manual detection, but also provides technical support for the stable and reliable operation of forging production lines, and has broad promotion and application value. However, there is still room for improvement in the accuracy of forging component inspection. In future studies, we will explore using higher precision acceleration sensors and optimizing vibration compensation algorithms to further enhance the accuracy.

Author Contributions

Methodology, B.Z.; Software, J.X.; Validation, M.Y.; Resources, D.S.; Writing—original draft, S.B.; Writing—review & editing, X.H. All authors have read and agreed to the published version of the manuscript.

Funding

This research received no external funding.

Data Availability Statement

Data are contained within the article.

Conflicts of Interest

Authors Shaoshun Bian, Bin Zhang and Xiuhong Han were employed by the company Lianyungang JARI Automation Co., Ltd. The remaining authors declare that the research was conducted in the absence of any commercial or financial relationships that could be construed as a potential conflict of interest.

References

  1. Hawryluk, M.; Ziemba, J.; Sadowski, P. A review of current and new measurement techniques used in hot die forging processes. Meas. Control. 2017, 50, 74–86. [Google Scholar] [CrossRef]
  2. Hawryluk, M.; Ziemba, J. Possibilities of application measurement techniques in hot die forging processes. Measurement 2017, 110, 284–295. [Google Scholar] [CrossRef]
  3. Zhang, Y.; Han, J.; Fu, X.; Zhang, F. Measurement and control technology of the size for large hot forgings. Measurement 2014, 49, 52–59. [Google Scholar] [CrossRef]
  4. Gao, H.; Wang, B.; Zuo, J. A Review of Online Detection Method for Thermal Geometric Parameters of Large Rings. Mach. Des. Manuf. Eng. 2019, 1, 93–96. [Google Scholar]
  5. Shen, J.; Xing, T.; Zhang, C. Cavity Detection Method of Hot State Axle Forging Based on Laser Technology. Optik 2022, 257, 168782. [Google Scholar] [CrossRef]
  6. Dworkin, S.B.; Nye, T.J. Image Processing for Machine Vision Measurement of Hot Formed Parts. J. Mater. Process. Technol. 2006, 174, 1–6. [Google Scholar] [CrossRef]
  7. Shen, J.; Xing, T. Detection Technology of Void Temperature Field inside Hot Hull Forgings. J. Coast. Res. 2020, 103, 397–401. [Google Scholar] [CrossRef]
  8. Zhang, Y.; Zhang, L.; Fu, X. Detection analysis of interior void for hot axial forging based on the interior temperature field. Appl. Therm. Eng. 2016, 93, 43–49. [Google Scholar] [CrossRef]
  9. Zhang, Y.; Miao, S.; Fu, X.; Li, Q.; Gao, J. Online measuring method of radial section line for ring forgings. Int. J. Adv. Manuf. Technol. 2019, 101, 3035–3046. [Google Scholar] [CrossRef]
  10. Nellums, R.O.; Habbit, R.D.; Heying, M.R.; Pitts, T.A.; Sandusky, J.V. 3D scannerless LADAR for orbiter inspection. In Proceedings of the Spaceborne Sensors III, Kissimmee, FL, USA, 18 April 2006; pp. 147–163. [Google Scholar]
  11. Wu, Z.; Wei, X.; Song, L.; Zhu, X. Solution for vision occlusion based on binocular line-structured light. Optoelectron. Lett. 2021, 17, 432–437. [Google Scholar] [CrossRef]
  12. Lee, J.; Shin, H.; Lee, S. Development of a wide area 3D scanning system with a rotating line laser. Sensors 2021, 21, 3885. [Google Scholar] [CrossRef]
  13. Han, L. Research on Automated 3D Measurement for Online Inspection of Hot Forming Parts. Ph.D. Thesis, Huazhong University of Science & Technology, Wuhan, China, 2019. [Google Scholar]
  14. Liu, Y.; Wang, Z.; Liu, Q. Research on Aircraft Profile Digital Measurement Based on Fusion of Metrascan and Laser Radar. Mod. Manuf. Eng. 2019, 2, 36–40. [Google Scholar]
  15. Pan, X.; Zhang, L.; He, K. Method of Accuracy Analysis for Composite Material Surface Measurement by Lidar. J. Beijing Univ. Aeronaut. Astronaut. 2020, 46, 1398–1404. [Google Scholar]
  16. Lei, C.; Liu, Y. A Method for Measuring the Surface Shape of Dynomizing Optical Element Based on Binocular Structured Light 3D Measurement. Opt. Optoelectron. Technol. 2022, 1, 14–20. [Google Scholar]
  17. An, Z.; Wang, J. Surface Flatness Measurement of Workpiece Based on Line Laser and Template Matching. Control Eng. China 2018, 25, 341–345. [Google Scholar]
  18. Han, L.; Cheng, X.; Li, Z.; Zhong, K.; Shi, Y.; Jiang, H. A robot-driven 3D shape measurement system for automatic quality inspection of thermal objects on a forging production line. Sensors 2018, 18, 4368. [Google Scholar] [CrossRef]
  19. He, J.; Gao, F.; Wu, S.; Liu, R.; Zhao, X. Measure dimension of rotating large hot steel shell using pulse laser on PRRR robot. Measurement 2012, 45, 1814–1823. [Google Scholar] [CrossRef]
  20. Liao, Y.; Huang, W.; Zhang, R. Application of Intelligent Operation and Maintenance Technology in 2050 mm Hot Rolling Equipment. Bao-Steel Technol. 2019, 6, 31–37. [Google Scholar]
  21. Liu, W.; Feng, T.; Shi, Q. Hydraulic Shock Vibration and Positioning Control for Forging Manipulator Walking System. Forg. Stamp. Technol. 2019, 12, 99–103. [Google Scholar]
  22. Teng, H.; Han, J.; Wang, M. State Diagnosis of Automatic Tool Changer Positioning Accuracy Based on Vibration Characteristics. Modul. Mach. Tool Autom. Manuf. Tech. 2021, 86–91, 95. [Google Scholar]
  23. Wang, Q.; He, F. A review of developments in the forging of connecting rods in China. J. Mater. Process. Technol. 2004, 151, 192–195. [Google Scholar] [CrossRef]
  24. Ji, Y.; Sun, S.; Liu, Z.; Liu, C. Design and development of management and control system for intelligent die forging production line. In Proceedings of the 2020 3rd World Conference on Mechanical Engineering and Intelligent Manufacturing (WCMEIM), Shanghai, China, 4–6 December 2020; pp. 230–233. [Google Scholar]
  25. Tombari, F.; Di Stefano, L. Object recognition in 3d scenes with occlusions and clutter by hough voting. In Proceedings of the 2010 Fourth Pacific-Rim Symposium on Image and Video Technology, Singapore, 14–17 November 2010; pp. 349–355. [Google Scholar]
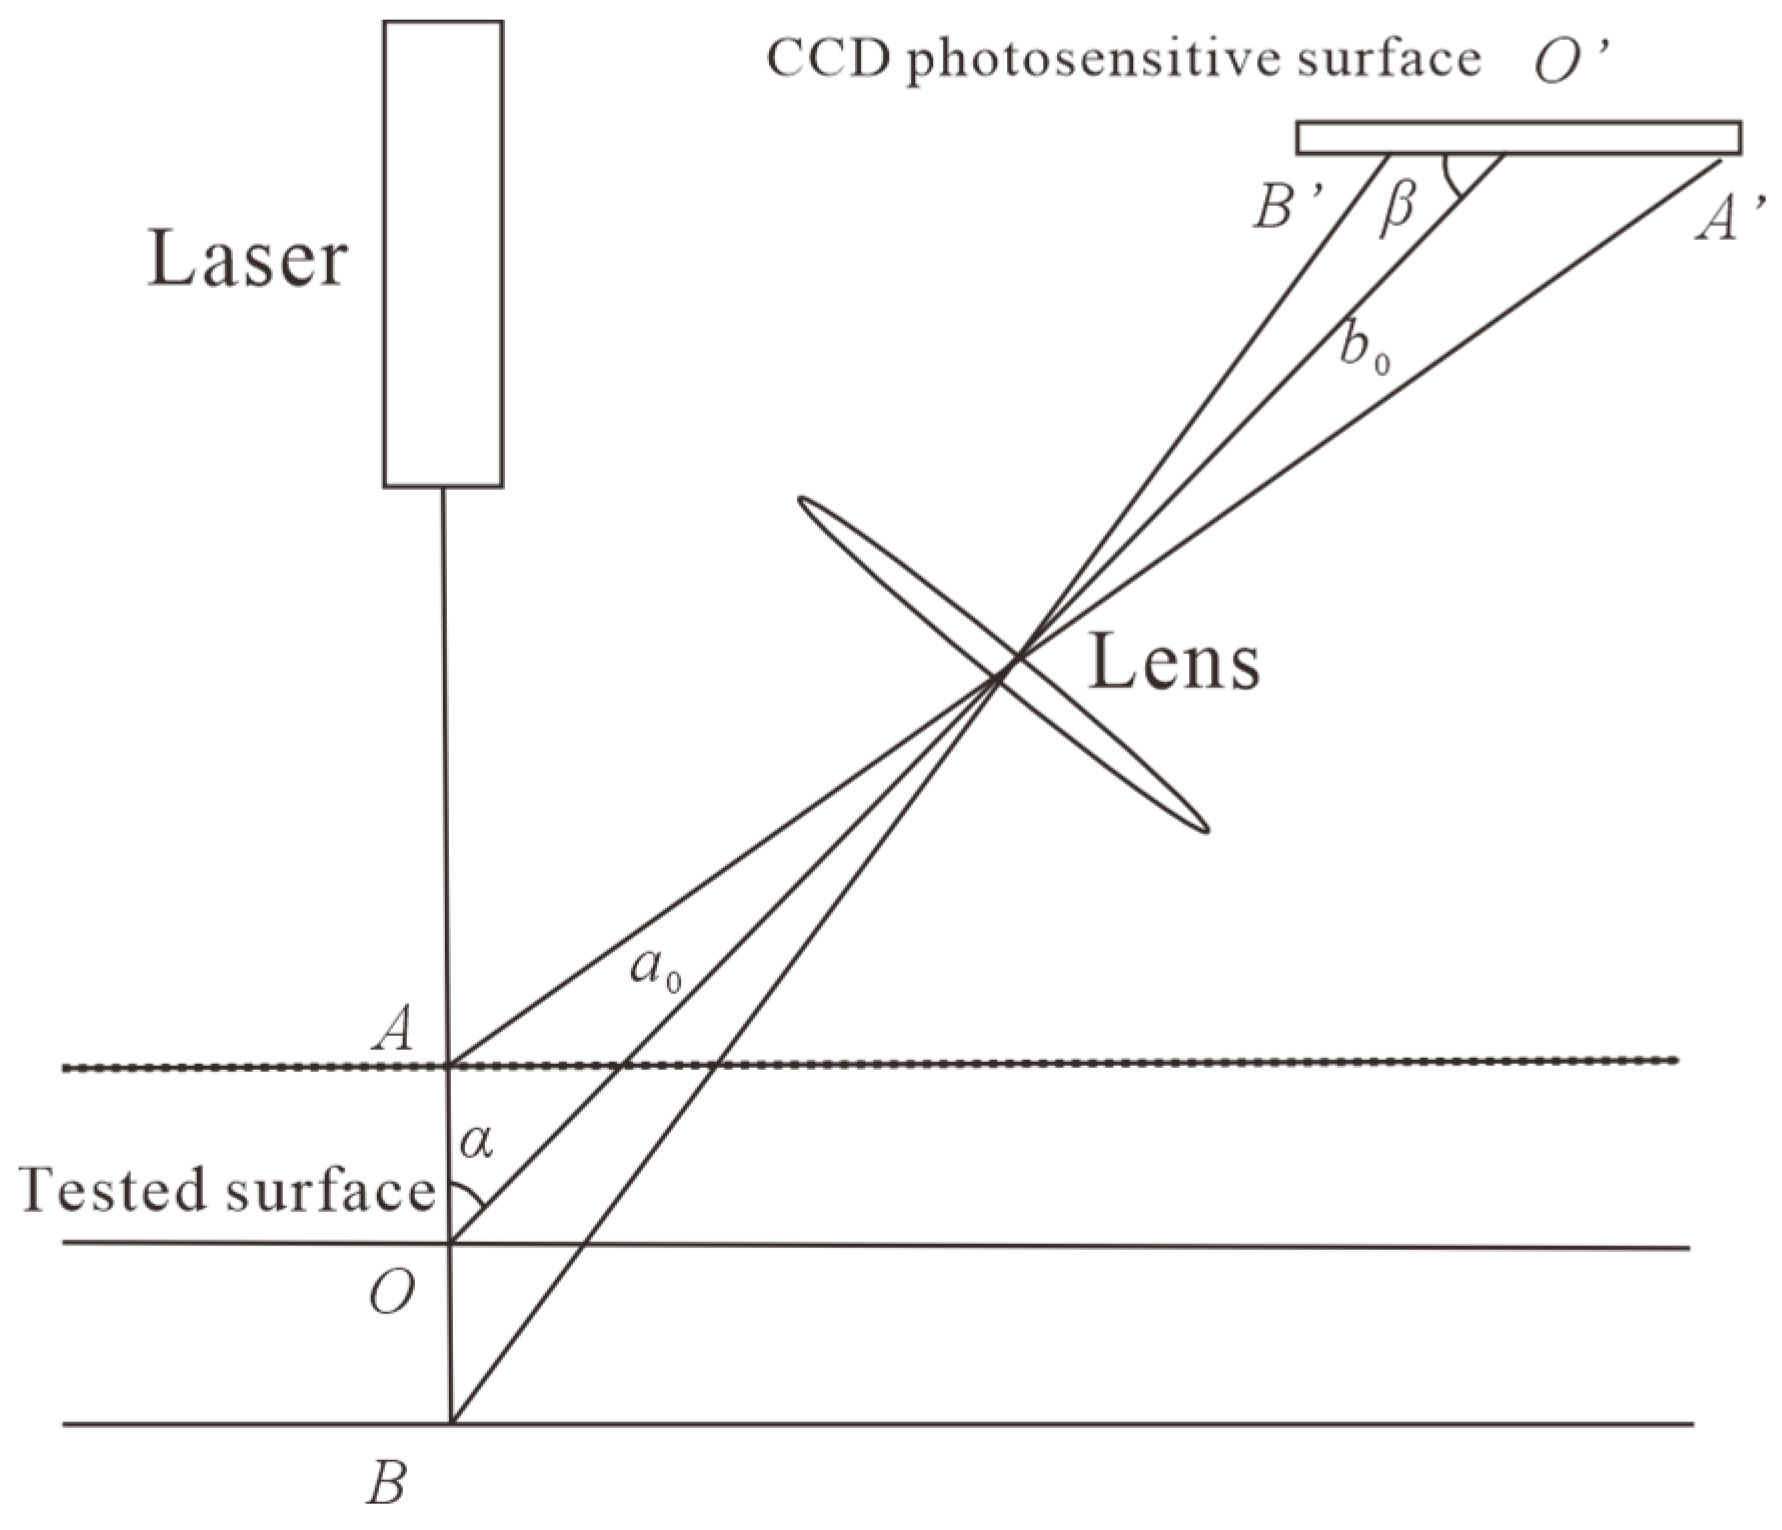
Figure 1. Principle diagram of direct laser triangulation method.
Electronics 13 02494 g001
Figure 2. Hot dimensional measurement device for forgings.
Electronics 13 02494 g002
Figure 3. Online detection process for wheel hub forgings.
Electronics 13 02494 g003
Figure 4. Schematic of coordinate transformations.
Electronics 13 02494 g004
Figure 5. The camera is at the end of the robot.
Electronics 13 02494 g005
Figure 6. Description of point cloud model for forgings.
Electronics 13 02494 g006
Figure 7. Forging reference point voting process. (1) The selected reference point sr in the scene and other scenic spots paired with it si, in which F(sr,si) is the eigenvalue of each pair of points; (2) F(sr,si) is used as the key code value to look up the table; (3) By looking up the table, we can obtain all similar template point pairs; (4) The local parameters of each template point pair are sampled and calculated and the corresponding accumulator array units are self-added.
Electronics 13 02494 g007
Figure 8. Posture comparison chart before and after forging point cloud compensation. (a) Before compensation. (b) After compensation.
Electronics 13 02494 g008
Figure 9. Layout of automatic production line for wheel hub forging.
Electronics 13 02494 g009
Figure 10. Test environment. (a) Measurement of top surface of forgings. (b) Measurement of left side of forgings.
Electronics 13 02494 g010
Figure 11. Inspection of radial and axial dimensions of wheel hub forging. (a) Forging diameter dimensions. (b) Forging height dimensions.
Electronics 13 02494 g011
Figure 12. Forging scanning. (a) Front of forging. (b) Reverse side of the forging. (c) Side of the forging.
Electronics 13 02494 g012
Figure 13. Point cloud compensation. (a) Front of forging. (b) Reverse side of the forging. (c) Side of the forging.
Electronics 13 02494 g013
Figure 14. Contour fitting. (a) Front of forging. (b) Reverse side of the forging. (c) Side of the forging.
Electronics 13 02494 g014
Figure 15. Measurement of forging dimensions. (a) Front of forging. (b) Reverse side of the forging. (c) Side of the forging.
Electronics 13 02494 g015
Table 1. Measurement results of diameter 3.
IndexBefore Compensation/mmAfter Compensation/mmTheoretical Value/mmError after Compensation/mm
169.5969.5569.50.05
268.5269.530.03
369.4069.43−0.07
469.5069.600.1
570.169.41−0.09
668.969.48−0.02
770.069.500.00
869.5369.520.02
969.4169.520.02
1070.169.43−0.07
1168.669.42−0.08
1269.069.510.01
standard deviation0.520.056//
Table 2. Measurement results of each scanning surface of the forging after point cloud compensation.
Scanning SurfaceParameter Measurement/mmTheoretical Value/mmError/mm
FrontDiameter 724.2724.3−0.03
Diameter 369.5569.50.05
Diameter 554.6254.60.02
OppositeDiameter 1138.43138.40.03
Diameter 462.4762.5−0.03
Diameter 243.9643.90.06
Diameter 627.7427.70.04
Height 139.3639.30.06
Height 248.2548.3−0.05
Side 1Height 313.7213.70.02
Height 476.2676.20.06
Side 2Height 313.6613.7−0.04
Height 476.2576.20.05
Disclaimer/Publisher’s Note: The statements, opinions and data contained in all publications are solely those of the individual author(s) and contributor(s) and not of MDPI and/or the editor(s). MDPI and/or the editor(s) disclaim responsibility for any injury to people or property resulting from any ideas, methods, instructions or products referred to in the content.