Article

A Virtual Reality Environment Based on Infrared Thermography for the Detection of Multiple Faults in Kinematic Chains

by
Alvaro Ivan Alvarado-Hernandez
1,
David Checa
2,
Roque A. Osornio-Rios
1,
Andres Bustillo
2,* and
Jose A. Antonino Daviu
3
1
Engineering Faculty, Autonomous University of Queretaro, San Juan del Rio P.O. Box 76010, Mexico
2
Informatic Engineering Department, University of Burgos, 09001 Burgos, Spain
3
Energy Technological Institute, Universitat Politecnica de Valencia, 46022 Valencia, Spain
*
Author to whom correspondence should be addressed.
Electronics 2024, 13(13), 2447; https://doi.org/10.3390/electronics13132447
Submission received: 9 May 2024 / Revised: 18 June 2024 / Accepted: 19 June 2024 / Published: 22 June 2024

Abstract

:
Kinematic chains are crucial in numerous industrial settings, playing a key role in various processes. Over recent years, several methods have been developed to monitor and maintain these systems effectively. One notable method is the analysis of infrared thermal images, which serves as a non-invasive and effective approach for identifying various electromechanical issues. Additionally, Virtual Reality (VR) is a burgeoning technology that, despite its limited use in industrial contexts, offers a cost-effective and accessible solution for the training and education of industrial workers on specialized engineering subjects. Nevertheless, most virtual environments are based on numerical simulations. This paper presents the design and development of a Virtual Reality training module for the detection of fourteen electromechanical fault cases in a kinematic chain. The VR training tool developed is based on actual thermographic data derived from experiments conducted on an authentic kinematic chain. During these experiments, thermal images were captured using an low-cost infrared sensor. The thermographic images were processed by calculating the histogram and fifteen statistical indicators, which served to differentiate fault cases in the VR application. A comprehensive evaluation was carried out with a group of vocational students specialized in electrical and automation installations to determine the effectiveness and practicality of the VR training module.

Graphical Abstract

1. Introduction

Kinematic chains are designed and implemented in different configurations and, as such, they are relevant in multiple industrial settings. A kinematic chain consists of interconnected electrical and mechanical components designed to perform a specific task or function. Common elements in kinematic chains include induction motors, pulleys, gearboxes, and mechanical loads. In addition to these main elements, kinematic chains contain other secondary but no less important elements, such as bearings [1], gears [2] and elements inside the motors themselves [3], which are also susceptible to failure. To maintain reliable operation, kinematic chains often employ strategies such as preventive maintenance and early fault detection [4].
In recent years, the training of technical and engineering personnel in the detection of electromechanical faults has gained importance as it allows the proper application of maintenance on kinematic chains [5]. This training becomes specially critical because an extensive range of techniques exist for assessing the condition of kinematic chains, along with various methods for early fault detection. Scientific studies indicate that monitoring physical quantities like electric current, mechanical vibration, and acoustic signals can identify failures in a kinematic chain before they lead to catastrophic outcomes [6,7]. Recently, non-invasive approaches have gained prominence in the fault detection field, including infrared imaging or thermography. This technique measures surface temperatures by quantifying infrared radiation. Initially, the adoption of infrared image analysis as a fault detection method for kinematic chains was hindered by the closed architectures and high costs associated with infrared sensors [8]. Nowadays, infrared cameras, which are used to measure infrared radiation, have become more affordable and accessible to the wider public. Additionally, some models of these cameras provide users with access to the raw data from the measurements.
All these techniques are commonly used in industrial environments, but are not so often available in training facilities. Advances in Virtual Reality (VR) technology could solve this limitation, because recently VR have significantly improved interactivity and reduced overall operating costs, accelerating the development of new and effective training solutions [9]. In the field of maintenance engineering, VR is particularly relevant, as it allows specialized laboratories and test benches to be reproduced with a high degree of similarity [10]. Traditional training methods often involve significant costs and risks associated with the physical equipment and environments required. VR mitigates these challenges by providing a safe, cost-effective, and highly interactive learning platform. It allows unlimited repetition of training exercises, critical for mastering complex tasks and procedures, and ensures that technicians can practice extensively without time constraints or logistical demands. VR enables accurate and efficient learning, reducing training times while improving the visualization and understanding of complex content. Unlike traditional on-screen 3D applications, which are often limited in interaction [11,12], VR provides immersive and interactive experiences that often result in better learning outcomes compared to 2D interfaces, as they offer practical, hands-on experiences within tailored training programs [13]. So far, VR is used for applications related to machine assembly and disassembly, as well as for testing under extreme conditions [14], with some examples of use in training specifically on topics related to induction motors [10]. The primary goal of these VR applications is to provide hands-on experiences within a tailored training program that certifies user competency in environments that are hazardous, complex, or prohibitively expensive to replicate in traditional settings [15].
This paper introduces the design and development of a new Virtual Reality tool intended to train engineers in electromechanical fault detection. Preliminary findings from this research were previously discussed in [10]. The contribution of this tool is the integration of a new set of experimental thermal data acquired with an infrared camera and the development of a new analysis technique for electromechanical fault detection in a virtual environment. The experiments were performed using a kinematic chain composed of an induction motor, an output pulley, a transmission belt, and a mechanical load. The faults incorporated into the design primarily pertain to the induction motor within the kinematic chain, including bearing defects of various sizes (1 mm to 5 mm), 1 and 2 broken bars, unbalance, and misalignment. Additionally, the experiments considered four conditions of progressive gear wear: healthy, 25%, 50%, and 75%. This way, a total of fourteen different fault cases were studied. The thermographic images underwent processing to incorporate a pseudo-color map and to compute their temperature histogram. Afterward, fifteen statistical features were calculated for each histogram. The data collected were integrated into a Virtual Reality environment designed to function as a tool for maintenance engineers and technicians to acquaint themselves with common faults in kinematic chains. Finally, a comprehensive evaluation was conducted with a group of vocational training students specializing in electrical and automation installations to assess the effectiveness and applicability of the VR training module. This approach not only enhances the realism of the training but also bridges the gap by offering hands-on experience in a controlled, risk-free virtual setting, significantly advancing current training practices.

2. Background Materials and Methods

2.1. Faults in the Kinematic Chain

Kinematic chains consist of electrical and mechanical elements. These components are frequently subjected to harsh conditions that can degrade their performance, leading to failures within the kinematic chain. Faults in a kinematic chain are typically categorized into electrical faults and mechanical faults [4]. The most prevalent causes of faults in kinematic chains include manufacturing defects, thermal stress, inadequate lubrication, electrical and mechanical overload, and electromagnetic disturbances affecting the induction motor [6].

2.2. Thermographic Image Processing

Digital thermographic image processing typically unfolds in three phases: pre-processing, segmentation, and feature extraction [16]. In the preprocessing stage, raw data captured by the infrared sensor are transformed into a digital image. This stage also involves morphological operations on the image, such as resizing, enhancing contrast, and applying pseudo-color [17]. Resizing involves interpolating existing data to generate new information. Two of the most commonly used methods for resizing infrared images are bilinear interpolation and bicubic interpolation [18].
(1) Pseudo-color: Pseudo-color application is a digital image processing technique that assigns a specific color to each intensity value in a grayscale image using a function or table [19]. Intensity scaling is a straightforward technique used to map a pseudo-color table to an infrared image [18]. Let [0, L − 1] represent the gray levels in an infrared image, where l0 denotes black ([f (x, y) = 0]), and lL − 1 correspond to white ([f (x, y) = L − 1]). Suppose that P different intensity planes exist at levels l1, l2, …, l P+1. Assuming that 0 < P < L − 1, the P planes divide the grey range in P + 1 intervals, I1, I2, I3, …, I P+1. The intensity of pixel (x, y) maps with color ck as expressed on (1):
f x , y = c k f x , y I k
Color ck is associated with the intensity interval I k , defined by the planes on l = k − 1 y l = k.
(2) Image histogram: The histogram of a greyscale image is a discrete function that represents the intensity distribution through all pixels on the image. Let rk for k = 0, 1, 2, , L − 1 be defined as the intensity value on a digital image (f(x, y)) with L different grey levels. The histogram h(rk) of image f is defined by (2):
h r k = n k
where nk is the total number of pixels on f with an intensity value equal to rk [19].

2.3. Statistical Features

The histogram of an infrared thermal image can be treated as a discrete signal, as it represents the temperature distribution across a specified number of intensity values or bins. Let h[n] be the nth value of a discrete histogram signal h where n = 1, 2, 3, …, N and N is the total number of windows in h. Equations (3)–(17) are defined to describe the fifteen statistical features.
F 1 = h n N
F 2 = m a x h n
F 3 = h n 2 N
F 4 = h n N 2
F 5 = h n F 1 2 N 1
F 6 = h n F 1 2 N 1
F 7   =   F 3 1 N h n
F 8 = F 4 1 N h n
F 9 = F 2 F 3
F 10 = F 2 F 4
F 11 = F 2 1 N h n
F 12 = 1 N h n F 1 3 F 5 3
F 13 = 1 N h n F 1 3 F 5 4
F 14 = 1 N h n F 1 3 F 5 4
F 15 = 1 N h n F 1 6 F 5 6

2.4. Virtual Reality

Due to significant technological advancements, the widespread adoption of Virtual Reality technologies in training processes has increased substantially. Affordable VR headsets are now accessible in the market, bolstered by swift advancements in robust graphics processors and lifelike video game engines [20]. These advancements have positioned VR as a viable and efficient tool for education and training. However, the use of VR in training programs is intended to complement, not completely replace, hands-on sessions with actual equipment. Rather, it enhances traditional methods by offering several advantages. VR allows for the unlimited repetition of training exercises, which is vital for mastering complex tasks and procedures. This capability enables technicians to practice extensively without the constraints of time and the logistical demands associated with physical setups. Moreover, VR can significantly reduce the costs associated with the acquisition and maintenance of physical tools and materials. This cost-effectiveness is further amplified by the ability to quickly update training programs to reflect the latest technological innovations and industry practices without the need for additional physical resources. VR environments provide a safe space for technicians to experience and interact with potential equipment failures and emergency scenarios without the risk of damaging expensive equipment or causing real-world accidents [21]. This aspect is particularly valuable in industries where the equipment is costly, and the risks associated with errors are high. Unlike traditional training settings where the trainer often controls the learning process, VR offers a learner-centered approach. This method allows trainees to manage their own learning experiences, engaging actively and critically with the material. Such interactive and immersive experiences are more effective than other methods like web-based or video tutorials, as they better simulate real-world environments and scenarios. The user is in control of an interactive learning process, thus enabling active and critical learning [13]. On the other hand, the use of VR headsets in training also involves safety and ethical considerations. VR headsets should be ergonomically designed to prevent discomfort and potential health issues such as eye strain or motion sickness [22]. Additionally, ethical considerations include ensuring the privacy and data security of the trainees, as VR systems often collect and store user data for performance analysis. Proper measures should be implemented to protect this data and maintain confidentiality, ensuring that trainees’ personal information is secure [23]. Also, designing effective VR applications for training involves four key objectives include interaction, immersion, user involvement, and, to a lesser extent, photorealism [24]. The design should feature clear inputs and outputs, short- and long-term goals to shape the user experience, and a well-structured learning ramp for beginners. Finally, the performance of the VR application must be evaluated, considering key factors such as the evaluation method, the number of testers, and the existence of a reference group. Proper evaluation ensures that the VR training tool meets its educational and training goals effectively.

3. Materials and Methods

This study introduces a Virtual Reality application designed for training in fault diagnosis on kinematic chains using thermography analysis. The architecture of this VR application is outlined in Figure 1 and is discussed in detail in the subsequent subsections.

3.1. Acquisition and Processing of Thermal Images

3.1.1. Thermal Image Acquisition

The experiments were performed on a kinematic chain (Figure 1) composed of the following elements:
  • Three-phase induction motor, an output power of 0.74 kW (1 HP).
  • Output pulley.
  • Transmission belt.
  • Alternator as a mechanical load.
Additionally, for the gear wear experiments a gearbox with a reduction ratio of 4:1 was connected to the motor shaft. By connecting mechanical elements to the induction motor, a kinematic chain was created. With this kinematic chain it was possible to study not only the failures that directly affect the induction motor, such as bearing damage or rotor bar damage, but also to study failures in the other mechanical components (failure in the gearbox) and failures in the connection of the different elements (misalignment between the motor and the alternator). The point of studying these faults was to observe whether the existence of faults external to the engine affects its operation. The induction motor ran under an estimated 10% load through all experiments. During the experiments, the electromechanical faults considered included 1 and 2 broken rotor bars, misalignment between the induction motor and the alternator, mass unbalance at the output pulley, and bearing defects. These bearing defects were artificially induced using a drilling machine, with progressively increasing diameters for five fault cases on the external race: 1 mm, 2 mm, 3 mm, 4 mm, and 5 mm. Four gears were manufactured to induce uniform wear on all teeth in order to replicate four different fault cases in the gearbox: healthy, 25% wear, 50% wear, and 75%. The data acquired served for the development of the diagnostic-training tool in the VR system.
During the experiments, thermal images of the kinematic chains were captured using a FLIR Lepton 3.5 infrared camera. There are other thermal imaging cameras on the market, but when comparing the FLIR Lepton 3.5 thermal imaging module with other commercial thermal imaging camera models it becomes evident that the resolution of the thermal sensor is equal or superior to the models shown in Table 1.
The sampling rate is the same for all thermal imaging cameras with a value of 9 Hz. However, the price of the FLIR Lapton 3.5 compared to the other models makes it a more affordable option for the thermographic study of induction motors. In addition, the size of the module allowed it to be integrated into an embedded system together with other components such as the PureThermal 2 module and Raspberry Pi 4. The camera was positioned 0.8 m away from the test bench, the infrared sensor was directed at the side of the induction motor. Each experiment ran for 90 min, with the thermal camera capturing images at a frame rate of 1 picture per minute. In the VR design, only thermal images from the last 30 min of each test runtime were included, considering that an induction motor typically reaches thermal equilibrium after one hour of continuous operation. The raw data from these thermal images were stored in a database to provide authentic information to the virtual environment.

3.1.2. Thermal Image Processing

Since the original resolution of the thermographic images obtained by the FLIR Lepton 3.5 sensor is 160 × 120 pixels, it becomes difficult to appreciate the differences on a conventional screen or in this particular case, on the screen of the VR device, so the interpolation allows generating new data that enlarge the thermographic image, allowing users to appreciate the temperature differences in the thermographic image with pseudo-color applied. The low-cost infrared camera employed in this setup featured an integrated radiometry mode, which provided a temperature value, denoted as CV, directly proportional to the actual temperature of the observed scene, measured in Kelvin (TK). Equation (18) presents this temperature function, where (x, y) denotes a pixel on the thermal image:
CV (x, y) = 100 · TK (x, y)
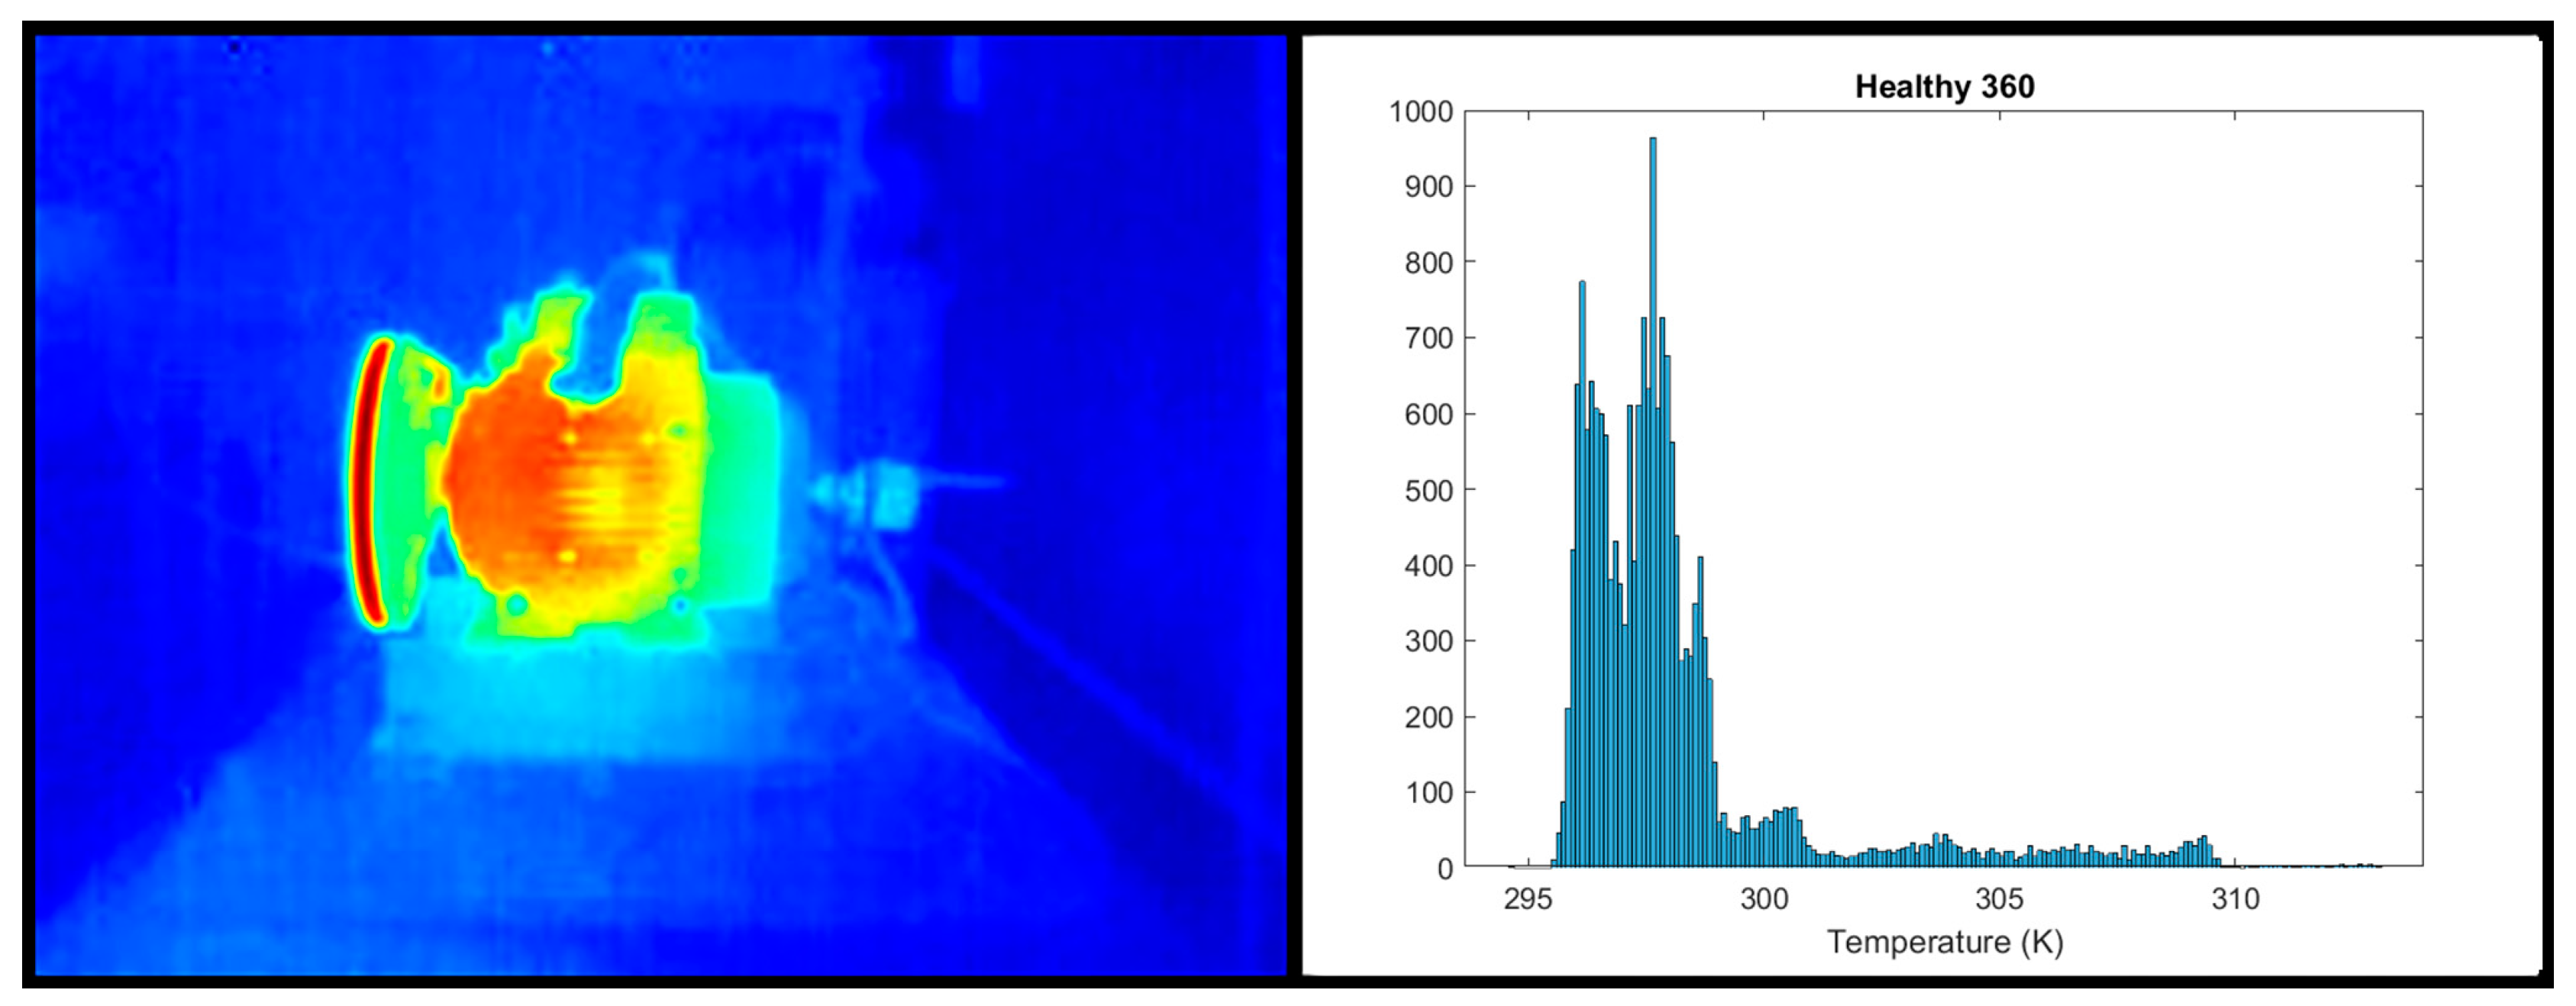
The image processing system computed a histogram for each image in the database using Equation (2). The horizontal axis of each histogram represents the temperature, measured in Kelvin (K), by the infrared sensor, while the vertical axis indicates the number of pixels associated with each temperature level. These histograms were instrumental in depicting the thermal characteristics of the induction motor for each fault state considered during the experimentation as a discrete one-dimensional signal. Furthermore, the processing system resized all thermal images to a target size of 1600 × 1200 pixels using bicubic interpolation. This resizing was necessary to enhance the contrast and quality of the pseudo-colored images generated through the intensity scaling method defined by Equation (1). Since the captured thermographic images were pre-processed on a personal computer (PC) before being used in the VR system, the computational time required to achieve the interpolation was not an impediment and therefore the bicubic interpolation algorithm was chosen as it provides better results in the resolution of the images. Also, the jet color map served as a reference for coloring the thermal images based on the association of this color palette with temperature and heat maps. Pseudo-color images offer a more intuitive representation of the infrared data to a human observer Fifteen statistical features were calculated from each histogram: mean (3), maximum (4), RMS (5), SMR (6), standard deviation (7), variance (8), form factor (RMS) (9), form factor (SMR) (10), crest factor (11), latitude factor (12), impulse factor (13), skewness (14), kurtosis (15), 5th moment (16), and 6th moment (17). These statistical indicators were saved in a 180 × 15 table for each of the fourteen fault cases.
The main software tool used for the acquisition and processing of the thermographic images was the OpenCV library in the Python (Python 3) and C++ (C++11)development environment. One of the challenges encountered during the development of the work was to automate the capture of the thermographic images following a sampling frequency determined by the user and to save the captures in an uncompressed image format that would allow to analyze the radiometric data of the scene in order to be able to measure the temperature of the engine and the mechanical components connected to it in the thermographic image. This challenge was solved by designing a Python script for the Raspberry Pi 4 that captured the images automatically at each given time cycle and saved the images in “.tiff” format that allows a resolution of 16 bits as opposed to the “.jpeg” format that only allows working with 8 bits. A total of 420 thermal images were acquired and processed. These images were associated with 14 different fault conditions in a kinematic chain. Each thermal image was originally acquired as a grayscale pixel array that store the apparent temperature of the induction motor and the kinematic chain. After the grayscale thermal image was captured, a pseudo-color palette was added according to the intensity scaling method (1) in order to improve the perception of temperature changes in the image for the user The image histogram was calculated from the original grayscale thermal image to obtain a discrete function (2) representing the temperature through all pixels in the infrared thermal image as can be seen in Figure 2, where colors refers to a temperature scale.
Fifteen statistical features were calculated from these histograms using Equations (3)–(17). Figure 3 shows graphic representations of the clustering observed on the statistical features according to each of the fourteen fault conditions. In Figure 3A, the six fault conditions on the bearing (healthy, 1 mm, 2 mm, 3 mm, 4 mm, 5 mm) were clustered using the mean (3), SMR (6), and 6th moment (17) features. In Figure 3B, four fault conditions commonly found on kinematic chains (one broken bar, two broken bars, unbalance, and misalignment) along with a reference case (healthy) were clustered using the 6th moment (17), mean (3), and standard deviation (7) features. Finally, Figure 3C shows the data clusters for the four gear wearing cases (0%, 25%, 50%, and 75%) using the mean (3), RMS (5), and standard deviation (7) features.

3.2. Development of Virtual Reality Application

This section discusses the development and application of a training tool for induction motor maintenance based on real thermographic data, utilizing Virtual Reality (VR) technology. The application allows users to engage in a self-guided exploration, directly interacting with and solving problems related to induction motors. Developed to take advantage of the unique educational benefits of VR, this training tool offers a triple educational experience: it provides a vivid and realistic environment for learning and diagnosing VR; it creates a risk-free zone, where learners can experiment and rectify errors without real-world consequences; and it delivers instant feedback on the users’ actions and decisions. This approach departs from traditional, theory-heavy educational methods, embracing a practical “learning by doing” strategy. Such a hands-on, immersive environment is intended to enhance engagement and focus on practice over rote memorization, aligning with learners’ growing preference for interactive and applied learning experiences. The development of this application involves two main phases, 3D modeling and environments, and interaction design.

3.2.1. D Modeling

In the creation of the 3D models, the first step is to shape the object using polygons, as can be seen in Figure 4A. Polygons are the fundamental building blocks of 3D models, with their vertices, edges, and faces forming the complex geometries required for detailed and realistic objects. The polygonal modeling process involves manipulating these elements to accurately represent the real object. Once the basic shape is established, UV mapping is performed on the model. UV mapping is a critical technique that involves unwrapping the 3D model onto a 2D plane, allowing for the accurate application of textures. This technique allows projecting a 2D image onto a 3D model’s surface. It can be either a texture that simulates a realistic appearance, as shown in Figure 4B, or the heat map texture that will be seen through the thermal camera, as depicted in Figure 4C. UV mapping requires meticulous adjustment to ensure that textures align perfectly with the model’s geometry, avoiding any distortions or seams that could detract from the visual quality. Achieving photorealism involves detailed texturing and high-resolution images. In this case, we use 2K textures, which achieve a good balance between quality and optimization. Since these models are intended for a standalone application, optimization must be present in all processes. Performance optimization is another critical aspect addressed in the development of 3D models for standalone HMDs (head-mounted displays). These devices have limited processing power and memory compared to PC-based systems, necessitating careful optimization of models to ensure smooth performance. Techniques such as reducing polygon count, optimizing texture sizes, and baking lighting information into textures (lightmaps) were employed to maintain high visual quality without compromising performance. This balance is important since research shows that learning motivation in virtual environments is directly proportional to the quality of the 3D models represented [25]. The tools utilized in the development of these models include Blender™ for modeling and Substance Painter™ for texturing. Blender™ provides a comprehensive suite of tools for polygonal modeling, allowing for detailed and complex designs. Substance Painter™ is used for texturing, providing advanced features for creating realistic materials and textures, including support for PBR (Physically Based Rendering) materials that enhance realism through accurate simulation of how light interacts with different surfaces.

3.2.2. Environments and Interaction Design

Developing a virtual environment that closely mimics the real world is essential to create these Virtual Reality training tools. Unreal Engine 5 has been selected for this purpose. Renowned for its photorealistic capabilities and visual coding system, this game engine stands out. Moreover, it enables the integration of data from other simulation programs, facilitating real-time data acquisition or integration from pre-recorded files. To generate the VR environments, the 3D models previously created are imported into the game engine. This process involves arranging the models within the scene, applying textures, and setting up lighting to mirror real-world conditions. Lighting is one of the most difficult parts of a project. Bad lighting can ruin photorealism. In addition, and since Unreal Engine 5 is a real-time engine, it is very important to keep the lighting as optimized as possible. The most effective strategy is to pre-calculate the lighting and minimize the use of real-time lighting, which can heavily impact performance. Since the application is designed to function on standalone head-mounted displays (HMDs), it is imperative to manage resource use judiciously. Standalone HMDs have less processing power and memory compared to PC-based systems. Therefore, optimizing the graphical elements, particularly the lighting and texture resolutions, becomes even more critical. This involves simplifying scenes where possible, using lower-resolution textures, and baked lighting to reduce the demand on the device’s GPU.
Additionally, one of the primary advantages of Virtual Reality is interactivity. It is crucial for this application to enable users to interact with all objects in the environment. The development of these interactions with objects and data integration was expedited by leveraging a predeveloped framework [26]. This streamlined the development process by utilizing pre-programmed utilities such as object manipulation, evaluation manager, and metric tools. The interaction design for this experience prioritizes accessibility for novice VR users. Accordingly, special emphasis was placed on simplicity by employing only one button on the touch controls for picking up and dropping objects. As a result, out of the three fundamental forms of interaction in VR (selection, manipulation, and locomotion), the user only needs to concentrate on object manipulation.
To master these interactions, an initial tutorial was designed to familiarize users with the fundamental controls required for grasping and positioning objects. Beyond providing step-by-step instructions on the assembly process, the central aim of this phase is to help users overcome the novelty effect. This term refers to the initial learning curve and potential disorientation encountered when interacting with a new interface or technology for the first time. By adopting this hands-on and guided approach, the users become comfortable and proficient with the system from the outset, thereby facilitating a smoother and more rewarding experience in subsequent stages.
The subsequent stages of the VR application were devised to aid in the training of maintenance engineers on the subject of detecting multiple faults in a kinematic chain through thermal image analysis. The VR tool incorporates thermal data obtained from experiments conducted on an actual kinematic chain. The faults considered include 1 and 2 broken rotor bars, misalignment between the induction motor and the alternator, mass unbalance at the output pulley, bearing faults (ranging from 1 mm to 5 mm defects), and gear wear (25%, 50%, 75%). Additionally, a control test was conducted with all components of the kinematic chain in a healthy state.
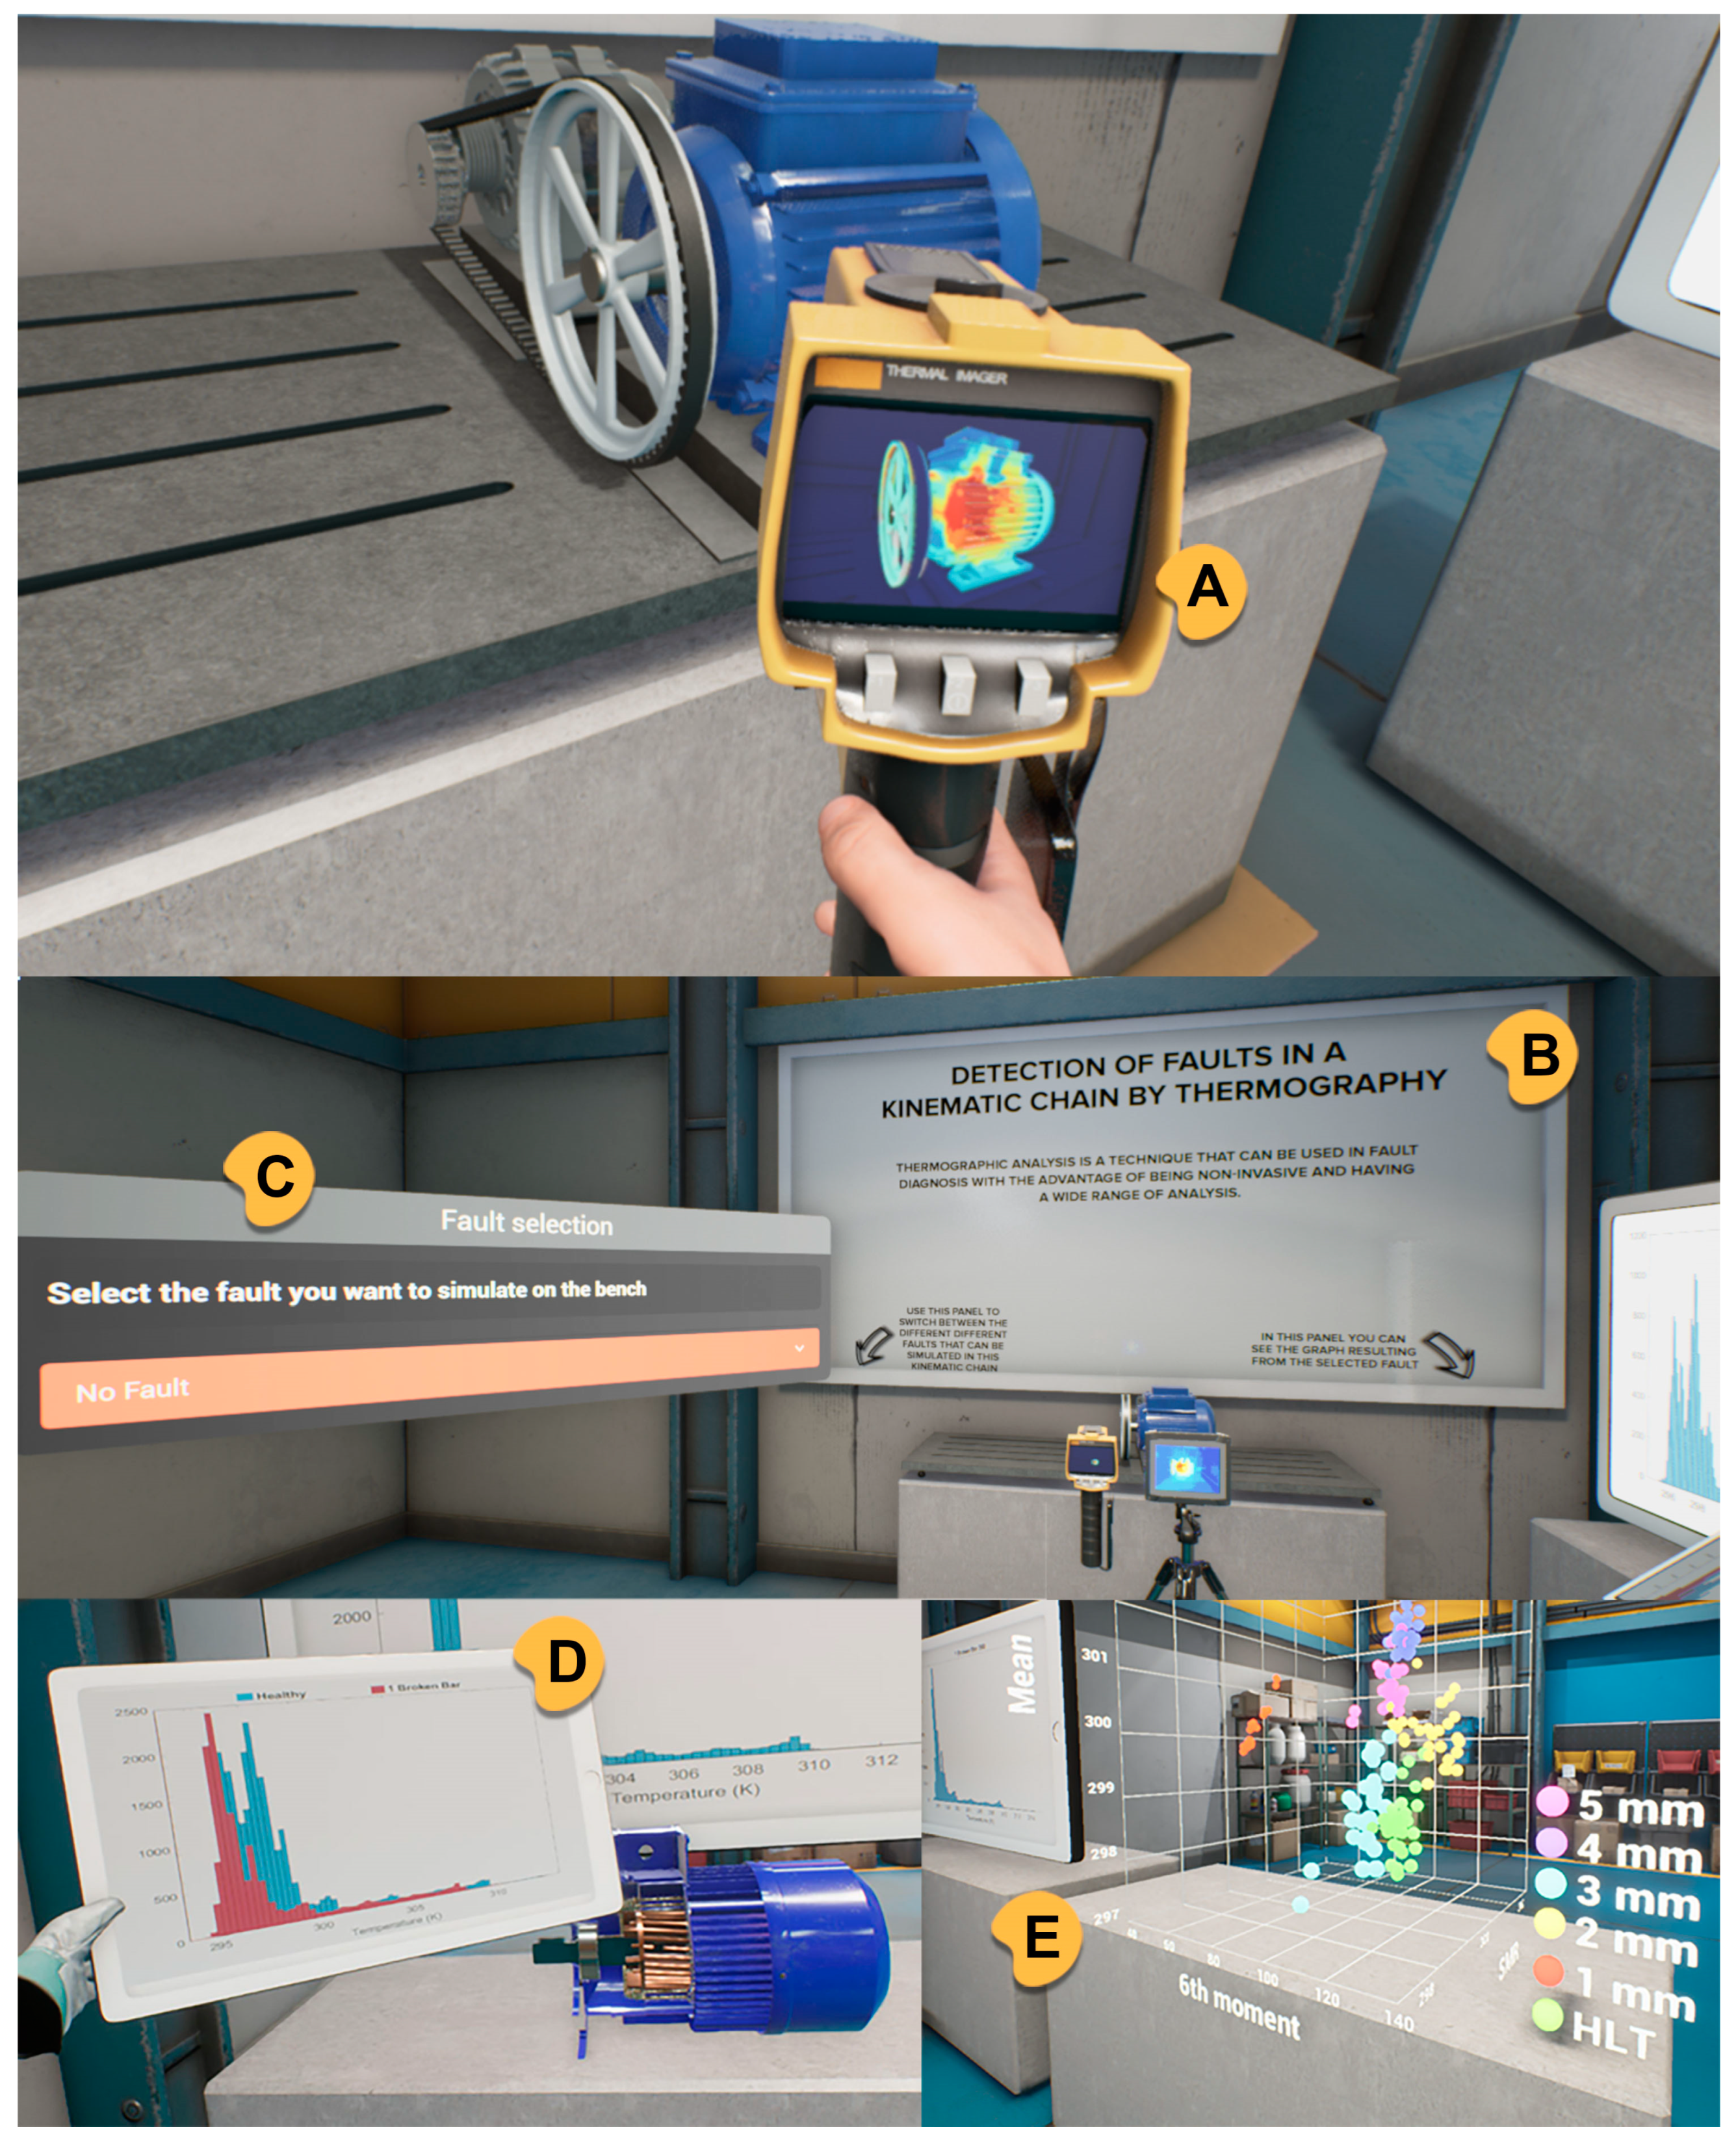
Figure 5 shows the designed workspace in the virtual environment. In it, the user has to select, organize and integrate information within a limited working memory. This application is designed to support these constraints. Instructions are presented to the user on a whiteboard right in front of them (Figure 5B). On the left side, there is a drop-down menu where the user can choose between different faults (Figure 5C). To its right, the temperature histogram of the selected fault is displayed as shown in Figure 5D. The user interface (UI) design principles were crucial in creating an intuitive and effective training tool. These principles include simplicity, consistency, and providing immediate feedback. The simplicity principle was adhered to by limiting the control inputs to a single button, making the interface easy to use for beginners. Consistency was maintained across the interface to ensure that similar actions led to predictable outcomes, reducing cognitive load. Immediate feedback was given to users to confirm their actions and guide them through the process, enhancing the overall user experience. This UI design helps minimize cognitive load during the learning process by organizing information clearly and accessibly.
The proposed procedure to be followed by the user is based on (1) choose one of the faults from the drop-down menu as show in Figure 5C. (2) Facing him a thermographic camera will be able to observe the selected fault in the kinematic chain. (3) On the right side, there is a dissected model where the selected fault can be viewed in detail as shown in Figure 5D. (4) Above this model a panel shows the fault histogram. Furthermore, the VR tool generates a graphical comparison between the healthy histogram (depicted in blue) and the faulty histogram (illustrated in red), as can be also seen in Figure 5D. Additionally, users have the freedom to interact with the data presented in the virtual environment, enabling them to gain a deeper understanding of the fault information. (5) To achieve an even deeper understanding of the comparison between faults, 3D plots have been added to allow the comparison of different faults. This type of graphics is especially useful in Virtual Reality since the user does not rotate them manually as they would on a flat screen. Thanks to being immersed in the graph it is possible to perceive the volume and detect clusters or outliners more easily as can be seen in Figure 5E. This tool also allows to manually select the variables to visualize and create its own graph to perform the desired comparisons. When the user decides that it is ready to test the acquired knowledge, it can advance to the next level. At this level, the user will find a kinematic chain with failure. With the help of the thermal imaging camera and the graphs will have to decide what type of failure has occurred. The feedback in this test is immediate and can be performed unlimited times as the fault that is presented is randomly performed.
Upon completing the experiment, the system displays performance data, allowing the user to review and analyze how well they identified and understood the faults. This feature is designed to provide valuable feedback by highlighting areas of strength and those needing improvement. The performance data include various metrics such as the number of correctly identified faults, the time taken to diagnose each fault, and the accuracy rate across multiple attempts. This detailed feedback helps users understand their performance in depth and identify specific areas where they can improve. Additionally, the system offers the option to repeat the experiment multiple times. This repeatability is crucial for learning, as it enables users to refine their skills through continuous practice. Each repetition allows users to encounter different fault scenarios, providing a comprehensive understanding of the kinematic chain and its potential failures. This exposure to a variety of faults ensures that users are not just memorizing specific cases but are developing a robust diagnostic skill set that can be applied in real-world situations. The iterative learning process facilitated by the VR system is essential for mastering the diagnostic techniques in a virtual environment. By repeatedly practicing in a simulated setting, users can build confidence and proficiency without the risk associated with real-world equipment. This method of learning also allows for immediate application of feedback, enabling users to make adjustments and see improvements in subsequent attempts. Moreover, the ability to visualize performance data through graphical tools such as 3D plots and histograms enhances the learning experience. These visual aids help users to better understand their progress and performance trends over time. The combination of detailed feedback, repeatable practice, and visual performance tracking creates a powerful learning environment that significantly enhances the user’s ability to diagnose and understand faults in kinematic chains. This Virtual Reality module is available as Supplementary Material and can be downloaded at: https://xrailab.es/cases/induction-motors/ (accessed on 21 June 2024).

4. Evaluation

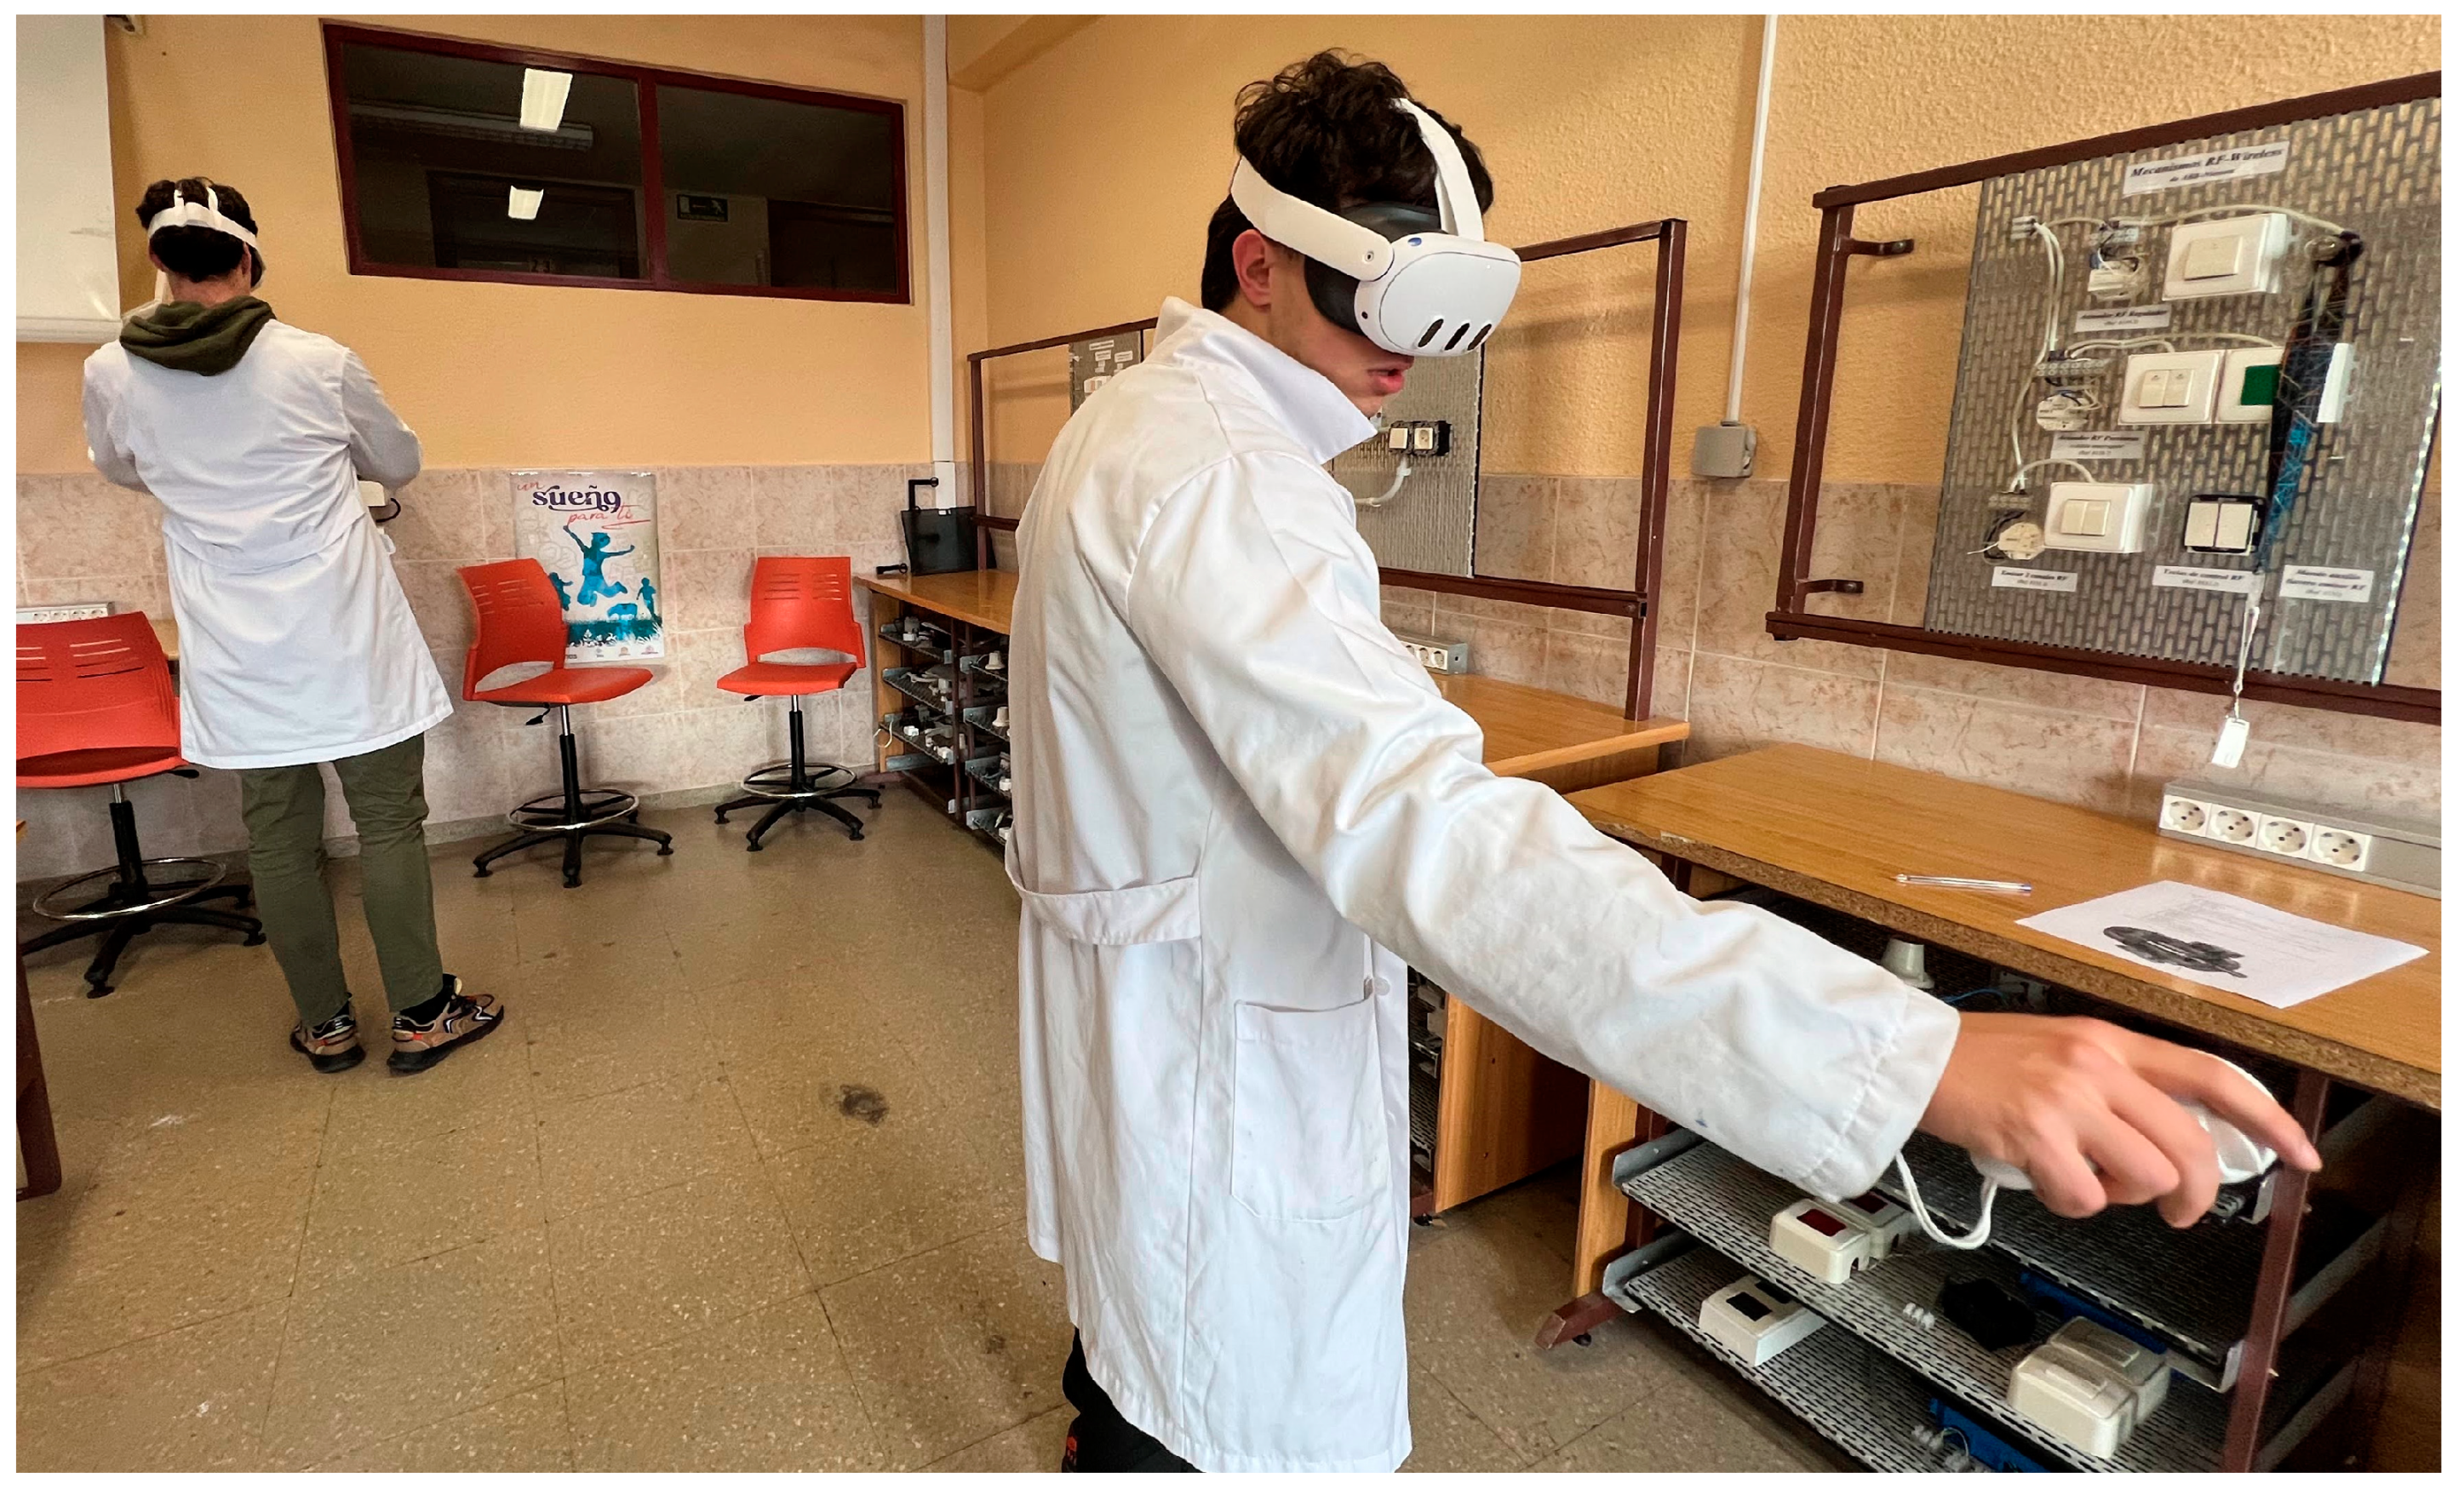
This application was tested with a sample of students from the Vocational Training program in Electrical and Automatic Installations. The general competency of this qualification involves assembling and maintaining telecommunications infrastructures in buildings, low voltage electrical installations, electrical machines, and automated systems. Therefore, this application can become an effective solution for learning the assembly and maintenance of electric motors in such studies. The study sample consisted of 20 s-year students (mean age = 20.1 years old, all male). The learning experience has four stages: pre-test, learning experience with VR training module, experience assessment questionnaire, and finally, a knowledge test. The learning experience began with a pre-test to assess the previous knowledge of the students. This test was created with the help of the teachers of the Vocational Training program in order to be as aligned as possible with the learning objectives of the VR module. It consisted of four multiple-choice questions (MCQ) and one image-based question to identify the different components of an electric motor. The pre-test can be consulted in the Supplementary File. The VR training module was conducted in the school’s laboratories with Meta Quest 3 devices, used in standalone mode as can be seen in Figure 6.
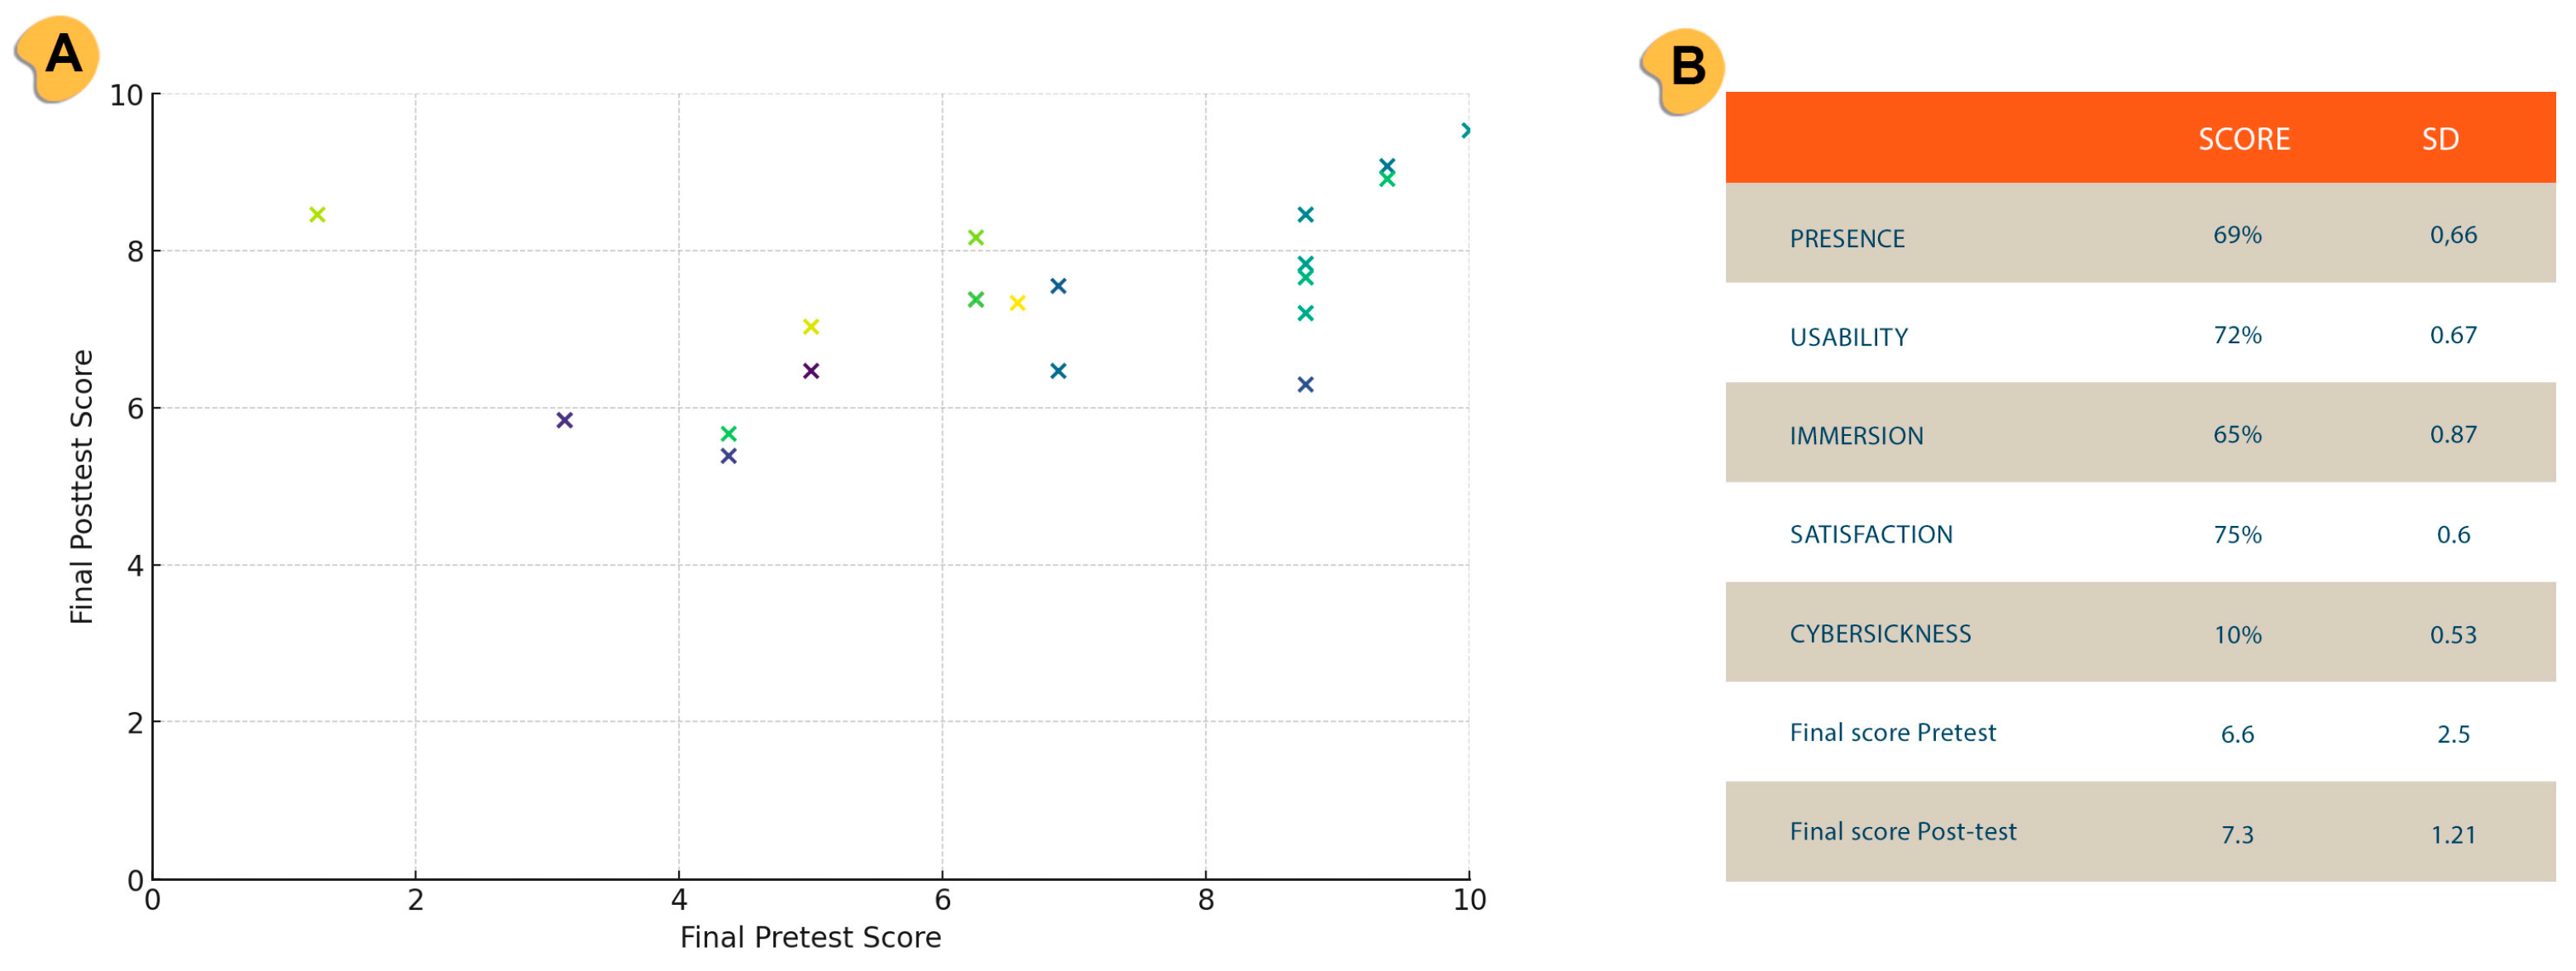
This VR training module was designed so that users could progress through different levels and advance towards the following goals: Identification of the fundamental components of induction motors and basic arrangements and identification of the operating state under the influence of induction motor faults with thermography. The time of use of the application varied between 15 and 20 min. An experience assessment questionnaire was administered immediately after the educational experience aimed to measure student satisfaction, covering several key aspects: presence, immersion, usability, cybersickness and satisfaction. These aspects were assessed with twenty-five questions using a five-point Likert-type scale, where (1) indicates “strongly disagree” and (5) represents “strongly agree”. This approach allows for a nuanced understanding of students’ perceptions across different dimensions of the educational experience, facilitating targeted improvements based on specific feedback. This questionnaire can be consulted in the Supplementary File. The results show a fairly high presence (69%) but a relatively low immersion (65%). This suggests that a majority of students felt engaged and “present” during the experience. However, there’s room for improvement in enhancing the sense of being “there” within the educational setting. This may be attributed to the fact that, as seen in the image, users shared a space which was relatively small, and the head-mounted display (HMD) used did not have immersive audio. On the other hand, a positive usability score (72%) indicates that most students found the educational tools easy to use. This is crucial for smooth learning experiences and minimizing frustration. This was achieved thanks to the good design of the experience, using a single button on the touch controls to pick up and drop objects. In this way and thanks to using standalone HMDs that allow room scale movement, of the three basic forms of interaction in VR (selection, manipulation and locomotion) the user only has to focus on object manipulation. Regarding satisfaction, it reached 75%—the highest score among the categories, indicating that most students had a favorable overall impression of the educational experience. This is a common outcome in Virtual Reality experiences, but does not necessarily have to be related to higher learning rates. Finally, cybersickness was reported at 10%, indicating low discomfort such as dizziness or nausea, which can detract from learning and overall satisfaction. In terms of strategies to minimize cybersickness, several measures can be implemented in the design of our VR module. These include optimizing the pacing of VR content and providing regular breaks during training to avoid eyestrain and discomfort. In addition, movements within the virtual environment should be adjusted to be smooth and realistic, reducing abrupt changes that can cause motion sickness. Consideration should also be given to including customizable configuration options so that users can adjust the speed of movement and other parameters to their individual preferences and tolerance.
The knowledge test was conducted a week following the experience to assess the persistence of learning outcomes. Immediate post-experience testing may not provide accurate insights into comprehensive learning, as much of the information might still be temporarily held in short-term memory [27]. Hence, administering the test after a delay is strategic for evaluating the enduring impact of the learning experience. The post-test contains 12 questions: 11 multiple-choice questions and one image-based question to identify the different components of an electric motor. The test was designed to respond to a multi-level assessment by focusing on retention (recalling essential information), transfer (capability of using the learning information to solve new problems and to adapt to new situations) and understanding. The post-test can be consulted in the Supplementary File. In the evaluation of Virtual Reality’s (VR) effectiveness in education, particularly in teaching complex visual and spatial skills such as recognizing and locating components of an induction motor, the data present nuanced outcomes. Figure 7 shows the relationship between the final pre-test score and the final post-test score of the participants. While the overall increase from an average pre-test score of 6.6 to a post-test score of 7.3 suggests a positive trend, this improvement was not statistically significant. However, a detailed examination using the Wilcoxon test revealed statistically significant enhancements in students’ performance on image-based questions, with a p-value of 0.0385, underscoring VR’s potential in facilitating spatial and visual learning. Moreover, further analysis showed that when excluding participants who scored above 6 in the pre-test, there was a significant difference in the scores of the pre-test versus post-test among the remaining students (p = 0.0156). This highlights VR’s particular efficacy in boosting learning outcomes for lower-performing students, an insight consistent with broader educational literature that suggests VR can significantly elevate the learning trajectories of students who may struggle with conventional educational methods.

5. Discussion

This paper described the design and development of a Virtual Reality application based on accurate thermographic data for detecting multiple faults in kinematic chains. The Virtual Reality (VR) tool presented in this study for diagnosing faults in kinematic chains represents a significant leap forward in the domain of maintenance engineering training. Utilizing real thermographic data integrated within a VR environment, this tool offers an immersive learning platform that mimics real-world scenarios [12], thereby providing maintenance engineers and technicians with a practical and effective training experience [9,11]. The VR application enhances the realism of fault detection exercises by allowing users to interact with detailed simulations of various fault conditions, grounded in actual industrial data. The thermal images featured in this tool were obtained from experiments conducted on an actual kinematic chain. The development of the VR application encompassed fourteen distinct electromechanical fault conditions, which include one and two broken rotor bars, misalignment between the induction motor and the alternator, mass unbalance on the output pulley, and five different scenarios of bearing defects in the outer race (1 mm, 2 mm, 3 mm, 4 mm, and 5 mm), and four gearbox wearing conditions (0%, 25%, 50%, and 75%) along with a healthy condition used for reference.
This innovative approach leverages sophisticated statistical analyses of thermographic images, enabling users to identify specific fault characteristics and differentiate between types of faults with a high degree of accuracy. These capabilities are critical in industries where early fault detection can prevent costly downtime and equipment failures. Moreover, the VR tool incorporates an interactive learning model that has proven particularly beneficial for lower-performing trainees, helping them achieve significant improvements in their diagnostic abilities. The immersive nature of the VR environment fosters deeper engagement and a better understanding of complex concepts, which are often challenging to grasp through conventional training methods [28].
As shown in the evaluation section, the Virtual Reality (VR) training tool was assessed with a group of vocational training students specializing in electrical and automatic installations. The results indicated significant enhancement in the students’ performance on image-based questions assessing their ability to recognize and locate components of an induction motor. This improvement underscores the VR tool’s effectiveness in facilitating spatial and visual learning. Furthermore, when excluding participants who scored above a threshold in the pre-test, a significant difference in the pre-test versus post-test scores was observed among the remaining students. This highlights the particular effectiveness of VR training in boosting the learning outcomes of lower-achieving students, in line with studies showing that VR helps to homogenize group behavior, particularly benefiting students with less prior learning experience [29]. This is demonstrating its potential as a valuable educational resource in technical training programs [30]. While the results are promising, they are limited by the scope of the test group and the specific conditions under which the training was administered. To fully understand and validate the tool’s efficacy and generalize the findings, further comparative studies are necessary. Such studies should involve larger and more diverse participant groups, along with varied educational settings and fault scenarios. Additionally, comparisons with traditional training methods would be crucial to quantitatively establish the added value of VR training in terms of learning outcomes, engagement, and cost-effectiveness. Expanding the evaluation in these ways would provide a more comprehensive understanding of the VR tool’s potential and its applicability across different industrial and educational contexts. Future work will seek to include a more diverse group of participants, as well as to compare the VR training tool with traditional methods using specific metrics to assess learning outcomes, engagement and cost-effectiveness, and to study its long-term impact on students’ career paths and job performance. Research can also be conducted on the integration of augmented reality and mixed reality technologies, leveraging the capabilities of advanced HMDs such as Quest 3, to further enhance the immersive experience and improve the effectiveness of fault detection training.

Supplementary Materials

The following supporting information can be downloaded at: https://www.mdpi.com/article/10.3390/electronics13132447/s1. The evaluation of this VR training tool has been experimentally validated with different students and this application is available for download at the following URL: https://xrailab.es/cases/induction-motors/ (accessed on 13 June 2024).

Author Contributions

Conceptualization, A.I.A.-H., D.C. and R.A.O.-R.; methodology, D.C., A.I.A.-H. and A.B.; validation, A.B. and D.C.; formal analysis, A.I.A.-H. and R.A.O.-R.; investigation, J.A.A.D. and A.I.A.-H.; resources, J.A.A.D.; data curation, A.B. and A.I.A.-H.; writing—original draft preparation, D.C.; writing—review and editing, D.C., R.A.O.-R. and J.A.A.D.; visualization, D.C. and A.I.A.-H.; supervision, A.B., R.A.O.-R. and J.A.A.D.; project administration, R.A.O.-R. and J.A.A.D.; funding acquisition, J.A.A.D. All authors have read and agreed to the published version of the manuscript.

Funding

This research has been partially supported by Banco Santander under the scholarship program Santander Iberoamérica Research 2019/20. This investigation was partially supported by the REMAR Project (Ref. number CPP2022-009724) funded by the Ministry of Science and Innovation of Spain (MCIN/AEI/10.13039/501100011033) and by the European Union NextGenerationEU/PRTR.

Institutional Review Board Statement

All procedures involving human participants were carried out in accordance with the ethical standards of the Institutional Review Board of the U.S. Army Research Laboratory and with the 1964 Helsinki declaration and its later amendments. This study was conducted in accordance with the Declaration of Helsinki and approved by the Ethics Committee of Burgos University (protocol code IR-14/2022, date of approval 1 December 2022).

Informed Consent Statement

All participants signed informed consent forms prior to their participation, in accordance with the standards of the relevant ethics committees.

Data Availability Statement

Data sharing not applicable.

Conflicts of Interest

The authors declare no conflict of interest.

References

  1. Roy, S.S.; Chatterjee, S.; Roy, S.; Bamane, P.; Paramane, A.; Rao, U.M.; Tariq Nazir, M. Accurate Detection of Bearing Faults Using Difference Visibility Graph and Bi-Directional Long Short-Term Memory Network Classifier. IEEE Trans. Ind. Appl. 2022, 58, 4542–4551. [Google Scholar] [CrossRef]
  2. Kumar, V.; Mukherjee, S.; Verma, A.K.; Sarangi, S. An AI-Based Nonparametric Filter Approach for Gearbox Fault Diagnosis. IEEE Trans. Instrum. Meas. 2022, 71, 1–11. [Google Scholar] [CrossRef]
  3. Zhang, T.; Chen, J.; Li, F.; Zhang, K.; Lv, H.; He, S.; Xu, E. Intelligent Fault Diagnosis of Machines with Small & Imbalanced Data: A State-of-the-Art Review and Possible Extensions. ISA Trans. 2022, 119, 152–171. [Google Scholar] [CrossRef] [PubMed]
  4. Hassan, O.E.; Amer, M.; Abdelsalam, A.K.; Williams, B.W. Induction Motor Broken Rotor Bar Fault Detection Techniques Based on Fault Signature Analysis–A Review. IET Electr. Power Appl. 2018, 12, 895–907. [Google Scholar] [CrossRef]
  5. Zhang, X.; Long, Z.; Peng, J.; Wu, G.; Hu, H.; Lyu, M.C.; Qin, G.; Song, D. Fault Prediction for Electromechanical Equipment Based on Spatial-Temporal Graph Information. IEEE Trans. Ind. Inform. 2023, 19, 1413–1424. [Google Scholar] [CrossRef]
  6. Choudhary, A.; Goyal, D.; Shimi, S.L.; Akula, A. Condition Monitoring and Fault Diagnosis of Induction Motors: A Review. Arch. Comput. Methods Eng. 2019, 26, 1221–1238. [Google Scholar] [CrossRef]
  7. Agah, G.R.; Rahideh, A.; Khodadadzadeh, H.; Khoshnazar, S.M.; Hedayatikia, S. Broken Rotor Bar and Rotor Eccentricity Fault Detection in Induction Motors Using a Combination of Discrete Wavelet Transform and Teager-Kaiser Energy Operator. IEEE Trans. Energy Convers. 2022, 37, 2199–2206. [Google Scholar] [CrossRef]
  8. Alfredo Osornio-Rios, R.; Yosimar Jaen-Cuellar, A.; Ivan Alvarado-Hernandez, A.; Zamudio-Ramirez, I.; Armando Cruz-Albarran, I.; Alfonso Antonino-Daviu, J. Fault Detection and Classification in Kinematic Chains by Means of PCA Extraction-Reduction of Features from Thermographic Images. Measurement 2022, 197, 111340. [Google Scholar] [CrossRef]
  9. Mikropoulos, T.A.; Natsis, A. Educational Virtual Environments: A Ten-Year Review of Empirical Research (1999–2009). Comput. Educ. 2011, 56, 769–780. [Google Scholar] [CrossRef]
  10. Alvarado-Hernandez, A.I.; Checa, D.; Osornio-Rios, R.A.; Bustillo, A.; Antonino-Daviu, J.A. Design and Development of Virtual Reality Application Based on Infrared Thermography for the Detection of Multiple Faults in Kinematic Chains. In Proceedings of the 2022 International Conference on Electrical Machines, Valencia, Spain, 5–8 September 2022; ICEM: Valencia, Spain, 2022. [Google Scholar]
  11. Singh, G.; Mantri, A.; Sharma, O.; Kaur, R. Virtual Reality Learning Environment for Enhancing Electronics Engineering Laboratory Experience. Comput. Appl. Eng. Educ. 2021, 29, 229–243. [Google Scholar] [CrossRef]
  12. Valdez, M.T.; Ferreira, C.M.; Martins, M.J.M.; Barbosa, F.P.M. 3D Virtual Reality Experiments to Promote Electrical Engineering Education. In Proceedings of the 2015 International Conference on Information Technology Based Higher Education and Training (ITHET), Lisbon, Portugal, 11–13 June 2015; pp. 1–4. [Google Scholar]
  13. González Campos, J.S.; Sánchez-Navarro, J.; Arnedo-Moreno, J. An Empirical Study of the Effect That a Computer Graphics Course Has on Visual-Spatial Abilities. Int. J. Educ. Technol. High. Educ. 2019, 16, 41. [Google Scholar] [CrossRef]
  14. Kamińska, D.; Zwoliński, G.; Wiak, S.; Petkovska, L.; Cvetkovski, G.; Di Barba, P.; Mognaschi, M.E.; Haamer, R.E.; Anbarjafari, G. Virtual Reality-Based Training: Case Study in Mechatronics. Technol. Knowl. Learn. 2020, 26, 1043–1059. [Google Scholar] [CrossRef]
  15. Travassos Valdez, M.; Machado Ferreira, C.; Martins, M.J.M.; Maciel Barbosa, F.P. Virtual Labs in Electrical Engineering Education-The VEMA Environment. In Proceedings of the ITHET 2014–13th International Conference on Information Technology Based Higher Education and Training, York, UK, 11–13 September 2014. [Google Scholar]
  16. Vollmer, M.; Möllmann, K.P. Infrared Thermal Imaging: Fundamentals, Research and Applications; Springer: Berlin/Heidelberg, Germany, 2017. [Google Scholar]
  17. Kaur, M.; Singh, M. Contrast Enhancement and Pseudo Coloring Techniques for Infrared Thermal Images. In Proceedings of the 2018 2nd IEEE International Conference on Power Electronics, Intelligent Control and Energy Systems, Delhi, India, 22–24 October 2018; ICPEICES: Delhi, India, 2018. [Google Scholar]
  18. Gonzalez, R.C.; Woods, R.E. Digital Image Processing, 4th ed.; Pearson Education: New York, NY, USA, 2018. [Google Scholar]
  19. Tan, L.; Jiang, J. Image Processing Basics. In Digital Signal Processing; Pearson Education: New York, NY, USA, 2019. [Google Scholar]
  20. Vergara, D.; Rubio, M.P.; Lorenzo, M.; Rodríguez, S. On the Importance of the Design of Virtual Reality Learning Environments. In Proceedings of the Advances in Intelligent Systems and Computing; Springer: Berlin/Heidelberg, Germany, 2020; Volume 1007. [Google Scholar]
  21. Vergara Rodriguez, D.; Rodriguez Martin, M.; Rubio Cavero, M.P.; Ferrer Marin, J.; Nuñez garcia, F.J.; Moralejo Cobo, L. Technical Staff Training in Ultrasonic Non-Destructive Testing Using Virtual Reality. Dyna 2018, 93, 150–154. [Google Scholar] [CrossRef] [PubMed]
  22. Kim, E.; Shin, G. User Discomfort While Using a Virtual Reality Headset as a Personal Viewing System for Text-Intensive Office Tasks. Ergonomics 2021, 64, 891–899. [Google Scholar] [CrossRef] [PubMed]
  23. Trimananda, R.; Le, H.; Cui, H.; Ho, J.T.; Shuba, A.; Markopoulou, A. OVRSEEN: Auditing Network Traffic and Privacy Policies in Oculus VR. In Proceedings of the 31st USENIX Security Symposium, Security, Boston, MA, USA, 10–12 August 2022. [Google Scholar]
  24. Roussos, M.; Johnson, A.; Moher, T.; Leigh, J.; Vasilakis, C.; Barnes, C. Learning and Building Together in an Immersive Virtual World. Presence: Teleoperators Virtual Environ. 1999, 8, 247–263. [Google Scholar] [CrossRef]
  25. Alsawaier, R.S. The Effect of Gamification on Motivation and Engagement. Int. J. Inf. Learn. Technol. 2018, 35, 56–79. [Google Scholar] [CrossRef]
  26. Checa, D.; Gatto, C.; Cisternino, D.; De Paolis, L.T.; Bustillo, A. A Framework for Educational and Training Immersive Virtual Reality Experiences. In Proceedings of the Augmented Reality, Virtual Reality, and Computer Graphics; De Paolis, L.T., Bourdot, P., Eds.; Springer International Publishing: Cham, Switzerland, 2020; pp. 220–228. [Google Scholar]
  27. Mayer, R. Computer Games for Learning: An Evidence-Based Approach; MIT Press: Cambridge, MA, USA, 2014; ISBN 9780262027571. [Google Scholar]
  28. Osti, F.; de Amicis, R.; Sanchez, C.A.; Tilt, A.B.; Prather, E.; Liverani, A. A VR Training System for Learning and Skills Development for Construction Workers. Virtual Real. 2021, 25, 523–538. [Google Scholar] [CrossRef]
  29. Miguel-Alonso, I.; Checa, D.; Guillen-Sanz, H.; Bustillo, A. Evaluation of the Novelty Effect in Immersive Virtual Reality Learning Experiences. Virtual Real. 2024, 28, 27. [Google Scholar] [CrossRef]
  30. Lee, I.J. Applying Virtual Reality for Learning Woodworking in the Vocational Training of Batch Wood Furniture Production. Interact. Learn. Environ. 2023, 31, 1448–1466. [Google Scholar] [CrossRef]
Figure 1. Methodology Diagram.
Electronics 13 02447 g001
Figure 2. Thermal image in pseudo-color palette with its associated discrete histogram.
Electronics 13 02447 g002
Figure 3. Statistical features clusters according to the detected fault condition on: (A) bearings, (B) kinematic chain, and (C) gearbox.
Electronics 13 02447 g003
Figure 4. Induction motor 3D model. (A) polygonal design, (B) realistic textures, and (C) heat map.
Electronics 13 02447 g004
Figure 5. Workspace on RV tool for electromechanical fault detection through thermography. (A) VR infrared camera, (B) user instructions, (C) drop-down menu where the user can choose between different fault, (D) temperature histogram representation of the selected fault, and (E) 3D plots to comparison of different faults.
Electronics 13 02447 g005
Figure 6. Students using the VR training module.
Electronics 13 02447 g006
Figure 7. (A) Relationship between final pre-test score and final post-test score. (B) Results of experience assessment questionnaire and average final pre-test score and final post-test score.
Electronics 13 02447 g007
Table 1. Comparison of Commercial Thermal Imaging Camera Features.
FLIR LEPTON 3.5FLIR E5-XTFLUKE PTi120
Resolution (px.)160 × 120160 × 120120 × 90
Temp. range−10 °C a 400 °C−20 °C a 400 °C−20 °C a 400 °C
Sampling frequency9 Hz9 Hz9 Hz
Dimensions11.8 × 12.7 × 7.2 mm244 × 95 × 140 mm89 × 127 × 25 mm
Price (USD)16416291075
Disclaimer/Publisher’s Note: The statements, opinions and data contained in all publications are solely those of the individual author(s) and contributor(s) and not of MDPI and/or the editor(s). MDPI and/or the editor(s) disclaim responsibility for any injury to people or property resulting from any ideas, methods, instructions or products referred to in the content.