Article

A Robust Pointer Meter Reading Recognition Method Based on TransUNet and Perspective Transformation Correction

by
Liufan Tan
1,
Wanneng Wu
1,*,
Jinxin Ding
1,
Weihao Ye
1,
Cheng Li
1 and
Qiaokang Liang
2
1
School of Electrical and Information Engineering, Changsha University of Science and Technology, Changsha 410114, China
2
National Engineering Research Center for Robot Vision Perception and Control, College of Electrical and Information Engineering, Hunan University, Changsha 410082, China
*
Author to whom correspondence should be addressed.
Electronics 2024, 13(13), 2436; https://doi.org/10.3390/electronics13132436
Submission received: 22 April 2024 / Revised: 10 June 2024 / Accepted: 17 June 2024 / Published: 21 June 2024
(This article belongs to the Section Artificial Intelligence)

Abstract

:
The automatic reading recognition of pointer meters plays a crucial role in data monitoring and analysis in intelligent substations. Existing meter reading methods struggle to address challenging difficulties such as image distortion and varying illumination. To enhance their robustness and accuracy, this study proposes a novel approach that leverages the TransUNet semantic segmentation model and a perspective transformation correction method. Initially, the dial of the pointer meter is localized from the natural background using YOLOv8. Subsequently, after enhancing the image with Gamma correction technology, the scale lines and the pointer within the dial are extracted using the TransUNet model. The distorted or rotated dial can then be corrected through perspective transformation. Finally, the meter readings are accurately obtained by the Weighted Angle Method (WAM). Ablative and comparative experiments on two self-collected datasets clearly verify the effectiveness of the proposed method, with a reading accuracy of 97.81% on Simple-MeterData and 93.39% on Complex-MeterData, respectively.

1. Introduction

Currently, many traditional factories are transitioning towards intelligent or unmanned operations, due to the rising human labor costs and technology advancements. The inspection robot has emerged as a new product in this context, and has received increasing attention from factory administrators. Taking the substation inspection robot as an example, one of its most significant tasks is to recognize meter readings using visual methods. However, this task faces numerous challenges, including image distortion caused by limited shooting angles and various illumination influences due to unpredictable outdoor weather conditions, as shown in Figure 1. Existing meter reading methods have not fully addressed these challenges. Therefore, this paper aims to investigate meter reading methods for substation robots, with the expectation of further promoting their widespread application.
Compared to digital meters, reading pointer meters with vision-based methods is more challenging. Researchers typically divide this task into three stages: dial detection, dial information extraction, and reading recognition. For dial detection, many CNN-based object detection models such as the YOLO serials [1,2,3] and Mask-RCNN [4] are commonly used. Subsequently, dial information is further extracted using object segmentation methods and then processed for reading. This three-stage pipeline has been widely adopted by many researchers. However, existing methods still have several limitations. For example, accurately extracting dial information in various illumination environments remains difficult. In order to address the issue of pointer shadows, a method for determining the binarization threshold is proposed in [5] to segment the pointer region. Although this method can cope with the interference from complex lighting environments to some extent, its effect is not very outstanding. Additionally, capturing the dial image at an inclined angle can lead to image distortion and rotation. The method adopted in [6,7] is used to correct the dial by comparing the characteristics of the template dial image with the captured dial image. Nevertheless, this method is only suitable for certain types of meters and is susceptible to the effects of the natural environment [8]. In this work, we further study the underlying mechanisms of these challenges to enhance the reading accuracy.
Based on the previously discussed observations, this paper proposes a novel point meter reading approach that is robust to image distortion and various illumination conditions. In addition to the aforementioned three-stage pipeline, we introduce an additional dial correction stage between the dial information extraction stage and the reading recognition stage to enhance meter readability. Specifically, we first employ YOLOv8 [9] to detect the meter in a naturally captured image and then apply the Gamma correction technique [10] to improve the visibility of the dial image. Subsequently, the scale lines and the pointer are extracted using the TransUNet [11]. To alleviate the effects of image distortion, we adjust the orientation of the dial based on the established perspective relationship between the distorted dial image and the frontal-view dial image, using the perspective transformation method. Finally, PP-OCRv3 [12] is employed to recognize the scale values, and a Weighted Angle Method (WAM) [13] is applied to determine the pointer meter reading. The primary contributions of this work can be concluded as follows:
(i)
This paper presents a novel pointer meter reading framework for substation inspection robots that is robust to image distortion and various illumination conditions.
(ii)
To eliminate the negative effects of image distortion or rotation, we propose a novel and effective dial correction method based on perspective transformation.
(iii)
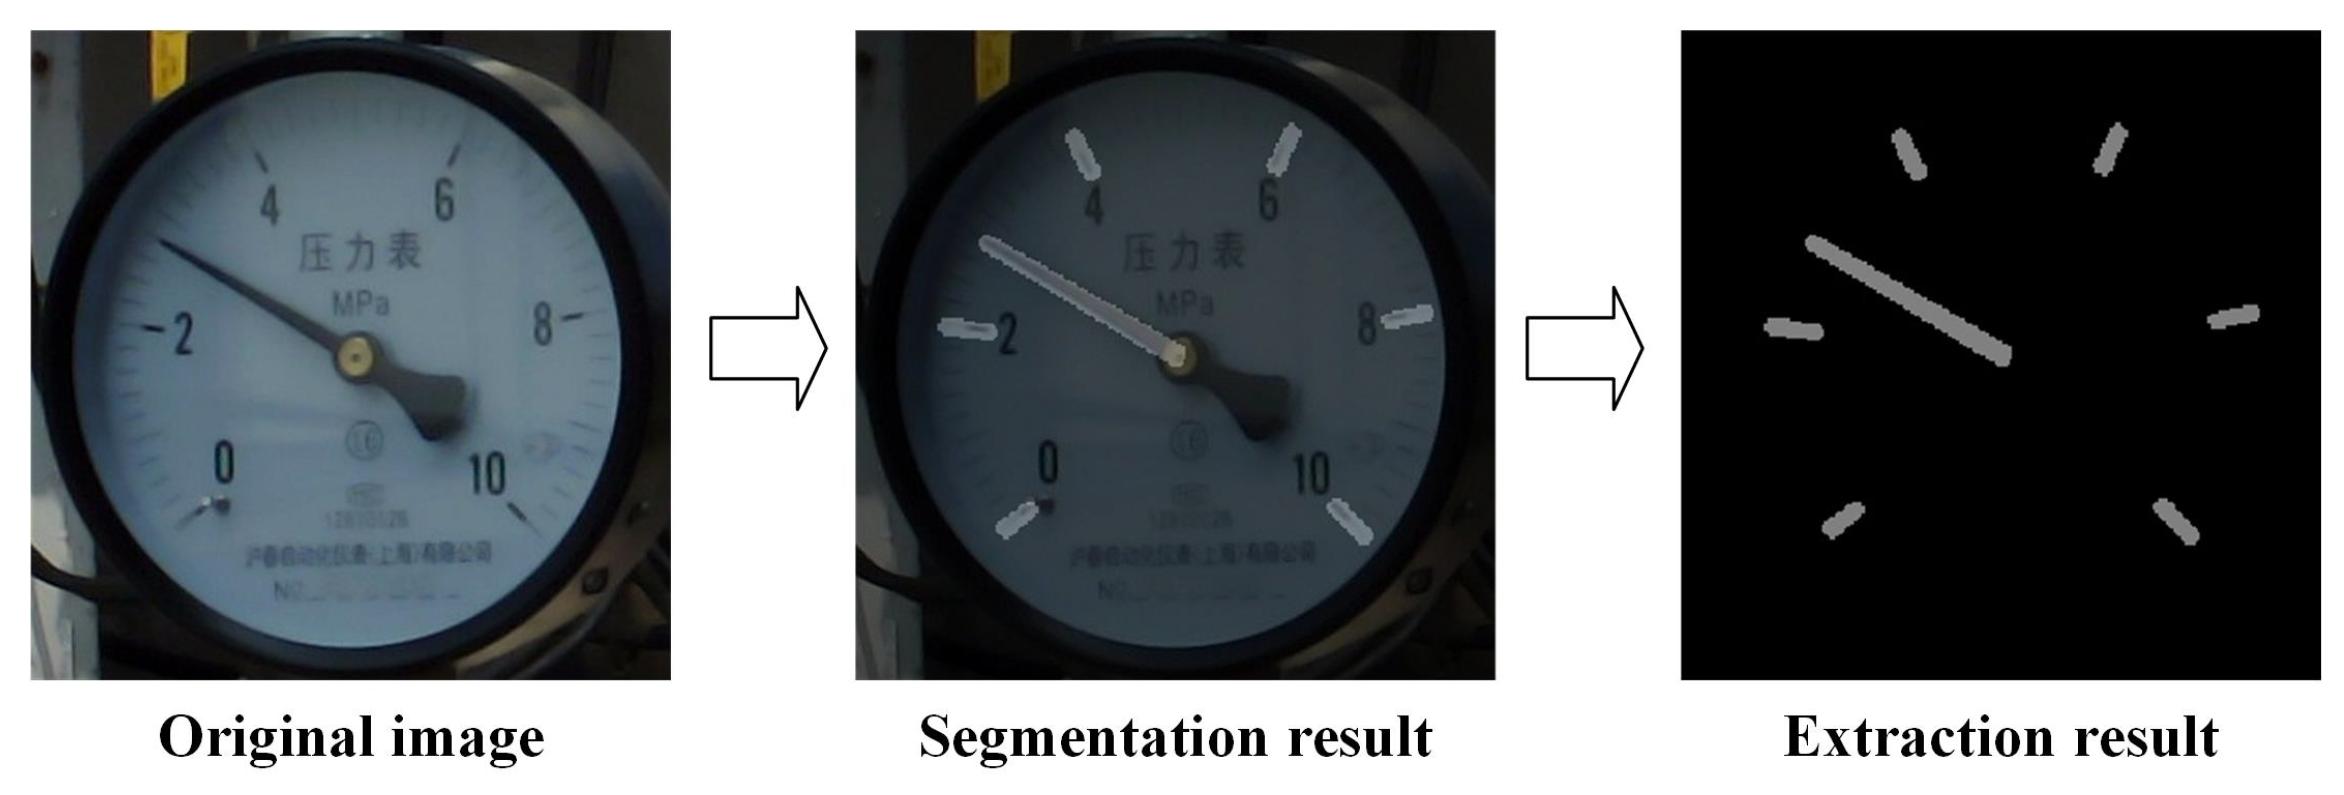
To enhance dial information extraction under various illumination conditions, we propose an efficient dial segmentation approach that employs the Gamma correction technique for preprocessing, followed by the TransUNet segmentation network.
The remainder of this article is structured as follows. The existing research methods for the pointer meter reading are discussed in Section 2. The approaches proposed in this study are explained in full in Section 3. Section 4 uses ablation and comparison experiments to validate the algorithmic modules in this paper. Section 5 offers an outline of the paper as well as a plan for further research.

2. Related Works

As deep learning continues to advance, a growing number of researchers have embraced the strategy of integrating “Deep Learning with Traditional Computer Vision” techniques to accomplish the task of pointer meter reading. After thorough research and investigation, this section will focus on the four modules of dial detection, dial information segmentation, dial correction and reading recognition to illustrate the work related to these various methods.

2.1. Dail Detection

The Hough transform [14] and feature matching [15] are two prevalent methods for dial detection. However, the Hough transform method performs poorly when dealing with dial images with complex backgrounds, and the feature matching approach requires previous feature definitions. As deep learning has advanced in the area of object detection, many object detection models have been applied to dial detection due to its robustness and high accuracy. For instance, an enhanced MaskR-CNN network was utilized by Zuo et al. [4] for dial detection. Faster R-CNN was used by Liu et al. [16] to identify dials. Sun et al. used YOLOv4 for dial localization [17]. In comparison to the aforementioned object detection models, YOLOv8 [9] offers a superior accuracy and speed. YOLOv8 has been widely used in complex conditions such as overhead power lines [18] and multimodal robot pose [19]. YOLOv8 introduces a novel structure, ExtremeNet, that enhances the efficiency of image feature extraction, thereby improving the detection accuracy. Furthermore, YOLOv8 employs an anchorless object detection method, which predicts the center of the object directly rather than the offset of a known anchor box. This method lowers the quantity of box predictions and speeds up inference.

2.2. Dial Information Segmentation

The automatic readings of pointer meters necessitate the precise positions of the main scale lines and pointers. Existing methods based on traditional computer vision include image subtraction [20], Hough transform [21], projection methods [22] and region growing methods [23]. However, traditional methods are not robust and do not cope well with interference from the external environment. Some scholars also use CNN-based semantic segmentation models to segment the dial information. Zhang et al. [24] used the DeepLabv3+ network to obtain the dial’s pointer mask image. The dial’s pointer region was segmented using the Mask R-CNN, and the pointer line was then fitted using the PCA approach in [4]. Hou et al. [3] used the Unet to obtain the mask images of the pointer and the scale lines. Chen et al. [1] applied the improved U2Net network to obtain the mask images of the pointers and the scale lines. Due to the special structure of pointer meters, the pointer occupies a long area on the dial, while the main scale line occupies a short area. Due to the local receptive field of CNNs, the ability of CNN-based segmentation models to capture remote information is hindered.However, TransUNet semantic segmentation networks [11] which successfully integrate the advantages of vision transformer (ViT) and Unet, display excellent accuracy performance in acquiring global information and processing local details.

2.3. Dial Correction

The accuracy of pointer meter readings can be significantly enhanced through correction methods [20]. The method adopted in [6,7,25] is used to correct the dial by matching the similarity between the template image and the captured dial image. Nevertheless, when the dial image is impacted by lighting and the surrounding surroundings, the approach performs poorly [8]. An approach based on the relationship between a circle and an ellipse’s perspective transformation was presented in [13]. While this method effectively resolves dial distortion issues, it cannot simultaneously perform rotation correction. In the case of looking at the dial squarely, the information on the dial is fixed and quantifiable, so that correction of the right position can theoretically be achieved regardless of the degree of distortion of the dial image.

2.4. Reading Recognition

The ultimate goal of the task is to compute the pointer meter reading. Hence, employing a practical algorithm is vital to enhancing the final reading’s accuracy. Li et al. [26] used a polar coordinate dimensionality reduction method to calculate the reading. However, when the dial image has a large degree of distortion, this method does not perform well. Huo et al. [27] used the distance method to read the meter. Zhang et al. [28] applied the angle method to obtain the final readings. Calculating meter readings using only two neighboring scales may lead to some errors. To solve this problem, Zhang et al. [29] employed the WAM to accurately calculate the pointer meter reading.

3. Methods

Figure 2 shows the overview of the proposed method in this paper. This section describes each module in the reading process in detail.

3.1. Dial Detection Module Based on YOLOv8

The primary objective of the dial detection module is to extract the dial image from a given image. In this study, we employ the YOLOv8 model for dial detection. Typically, the YOLOv8 model consists of three key components: the backbone, neck, and head. Dial detection using YOLOv8 initially undergoes a hierarchical feature extraction process through the backbone part of the model, which progressively learns to identify intricate patterns relevant to dial detection. Subsequently, these extracted features are refined and merged in the neck of the model, leveraging techniques like feature fusion to create a comprehensive representation of the features. Finally, the head component utilizes convolutional filters to precisely predict the location and class probabilities of dials within the image. This process ensures the dial can be easily extracted from the naturally captured image.

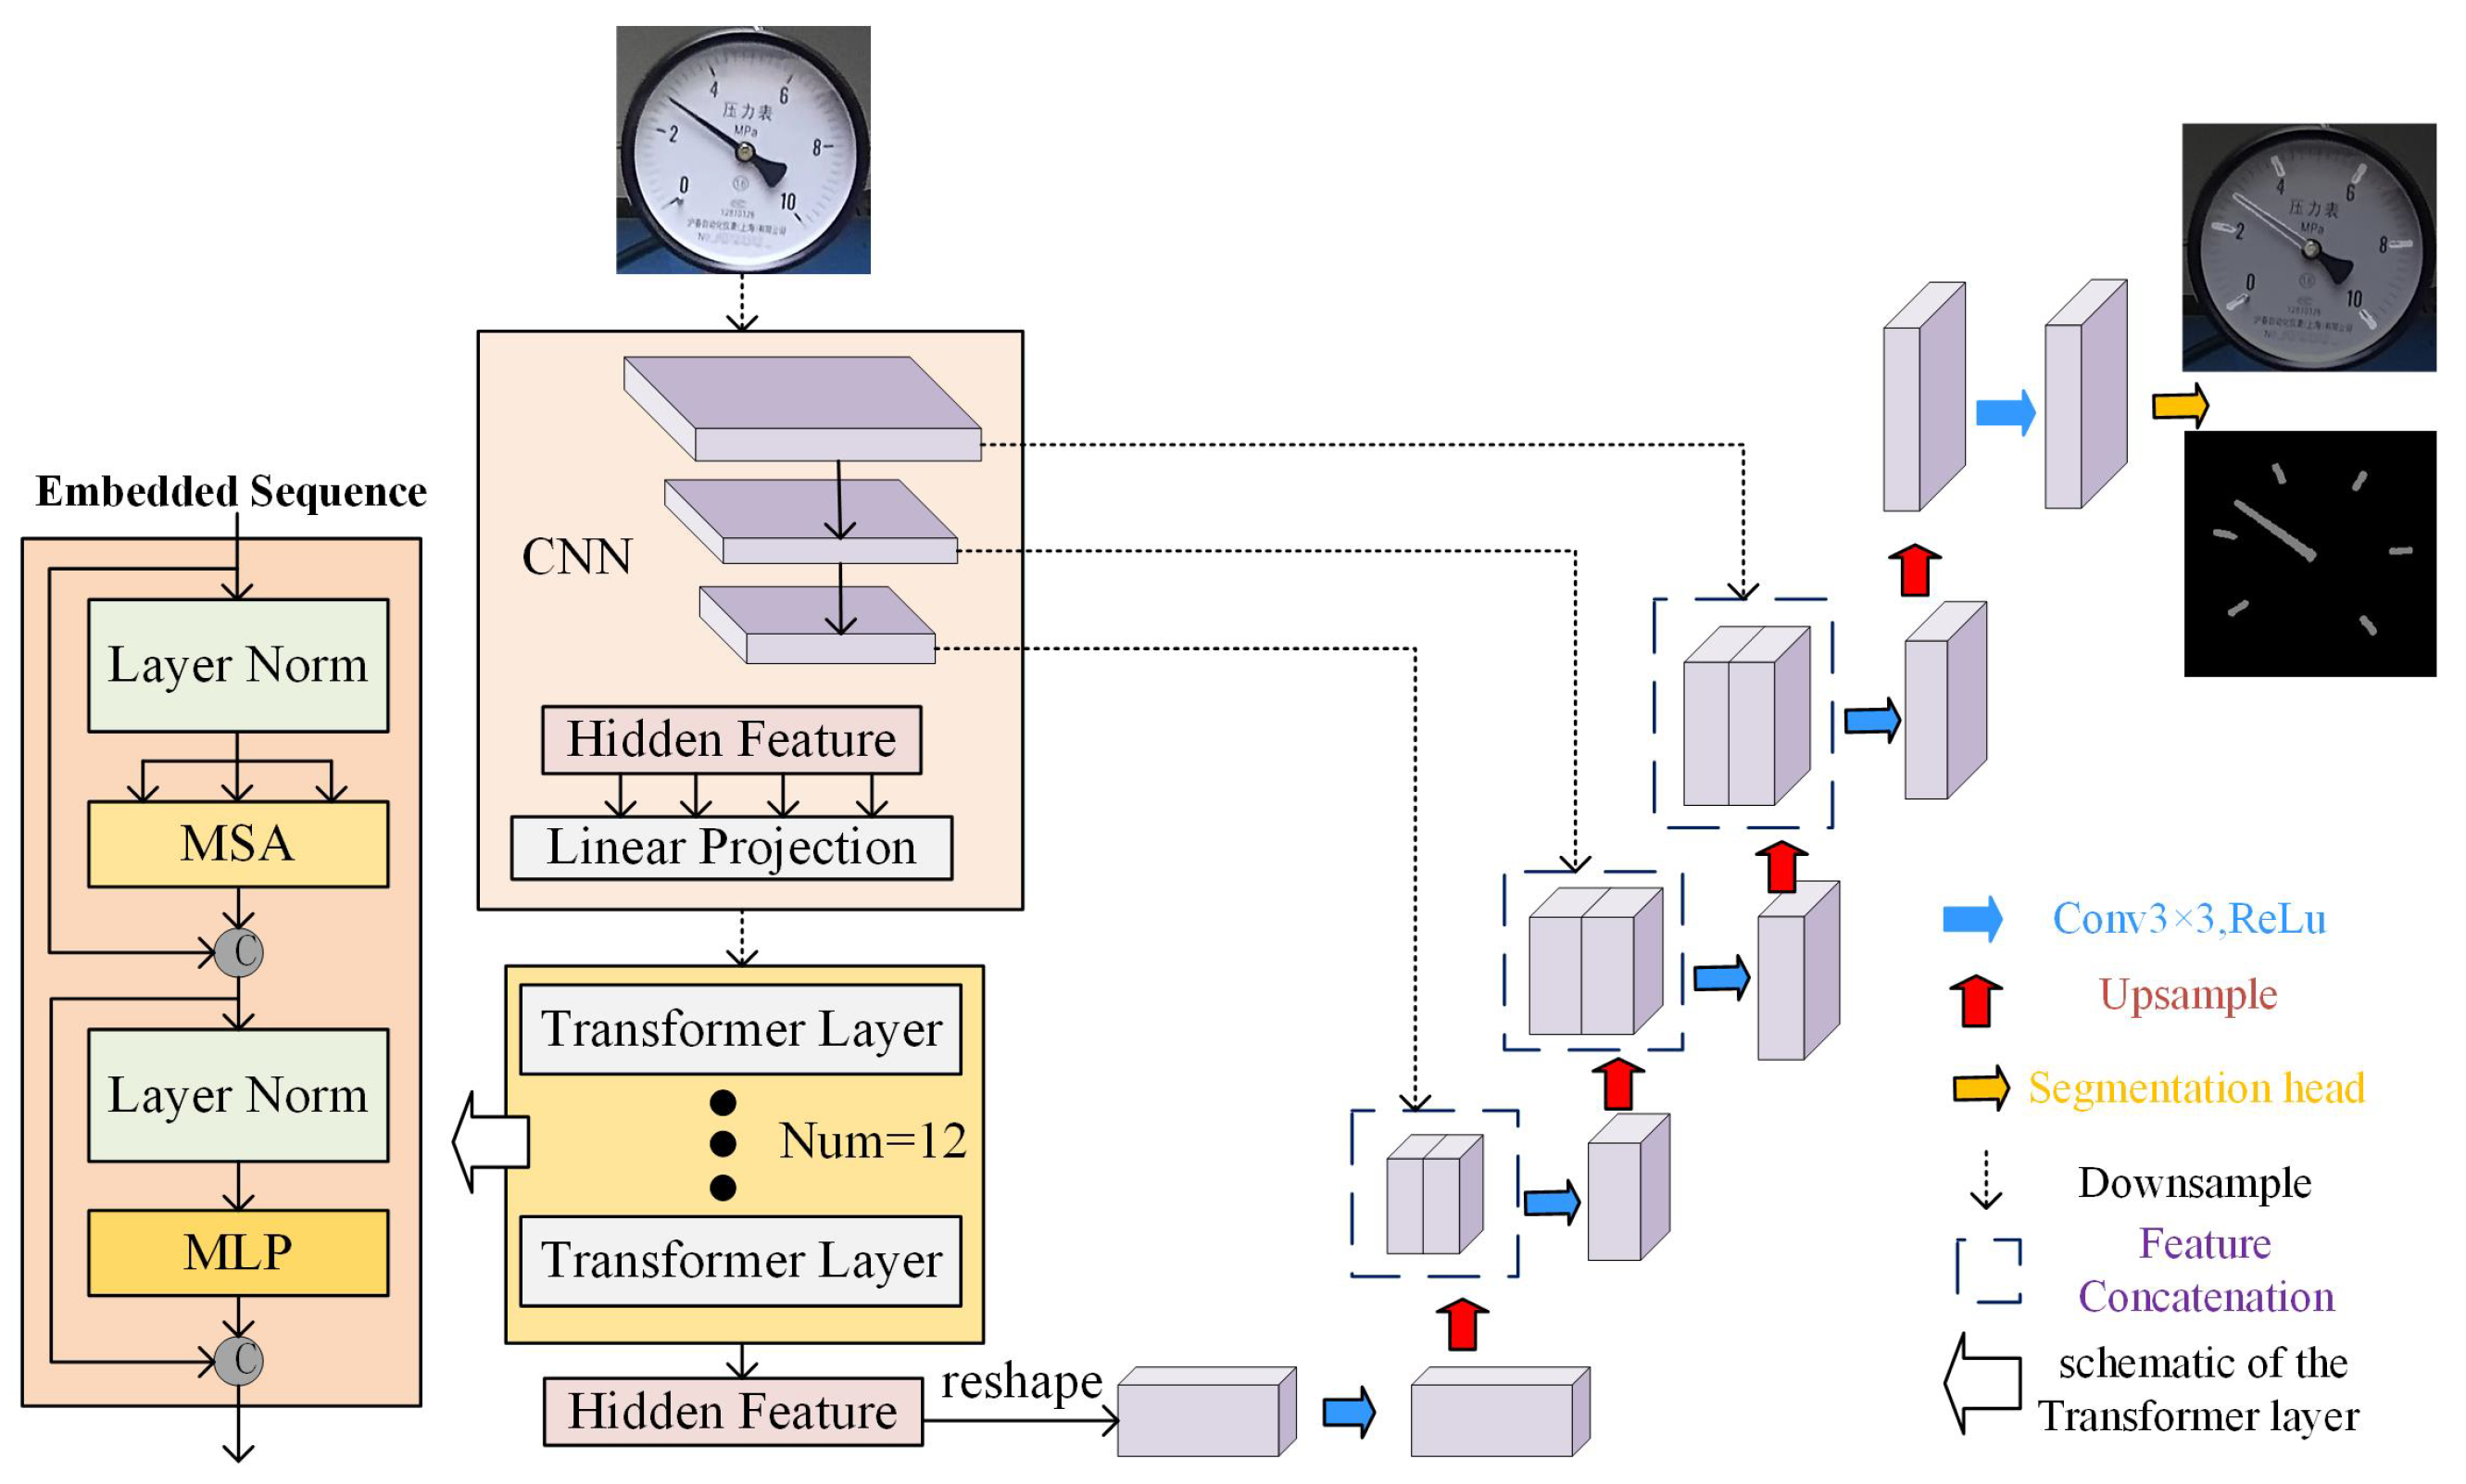
3.2. Dial Information Segmentation Module Based on TransUNet

To optimize the extraction of dial information, this paper applies the automatic Gamma correction technique to enhance the image and then uses TransUnet to segment the dial information. In Section 3.2.1, the preprocessing operation using Gamma correction on the dial image will be introduced, and in Section 3.2.2, the segmentation operation of TransUNet on the dial information will be introduced.

3.2.1. Dial Image Enhancement

Due to the complex environment of a substation, some meters are exposed to strong light in outdoor environments, while others are installed in shaded areas. As a result, the main scale lines and the pointer became indistinguishable from the background, posing a challenge for accurate recognition. To minimize the presence of irrelevant information in the dial images and enhance the detectability of pertinent details, the automatic Gamma correction technique is used to perform a uniform operation on the dial images. By adjusting the dial images that are too bright or too dark, it can enhance the detectability of the useful dial information. Equation (1) illustrates the concept of Gamma correction:
C = I 1 / γ
where C is the value after conversion and I is the value before conversion. The value of the constant γ differs throughout systems.
The steps using Gamma correction to optimize and enhance the dial image automatically are as follows:
(a)
Calculate the mean value of the pixels of the luminance channel after normalization as a representative value of the luminance of the dial image.
(b)
Determine the value of γ .
If you expect the average of all the pixels in the brightness channel of the dial image to be normalized to ϵ , where 0 < ϵ < 1 , then γ can be determined by a variant form of the Equation (1). The variant is Equation (2):
γ = log 10 ϵ log 10 I .
(c)
Obtain the automatic Gamma correction.
Each pixel point of the three RGB channels of the dial image is used as the value of I in Equation (1). The calculated γ is used as the value of γ in the Equation (1). According to Equation (1), the input image can be automatically corrected for nonlinearity, so that the overly bright or dark image can be corrected to normal brightness.
Figure 3 shows the result after Gamma correction. The contrast of the dial is clearly enhanced, which is helpful for the subsequent segmentation operation.

3.2.2. Dial Information Segmentation

TransUNet consists of the encoder, decoder and jump structure. Figure 4 shows its entire architecture.
TransUNet uses a CNN-ViT hybrid model as the encoder. The input dial image is first subjected to feature extraction by CNNs to obtain a series of feature maps. These feature maps are fed into ViT for sequence prediction to capture global information. By weighting and summing the feature maps’ self-attention, ViT uses a self-attention method to gather global contextual information and create a serialized representation. This representation contains not only the local information of the image but also the global contextual information. This ability to model the remote dependencies of different regions contributes to the accuracy and robustness of segmentation, which reduces the interference of shadows, noise and other negative factors.
Subsequently, TransUNet integrates this serialized representation with the high-resolution original feature map of the dial image. The decoder then performs up-sampling on the encoded features, enabling precise localization and gradual restoration to the resolution of the original dial image. Furthermore, the jump structure enables the propagation of detailed dial semantic information from the shallow layer to the corresponding deep layer. Consequently, it guarantees the precision and intricacy of the segmentation outcomes. Figure 5 illustrates the segmentation process of TransUNet.

3.3. Key Point Fitting and Dial Correction Module

When the camera angle is perpendicular to the dial surface, the centers of the main scale lines are uniformly distributed on a circle centered at the dial’s center. The scale values corresponding to each main scale line are arranged in a clockwise order, commencing from scale 0 and incrementing progressively. When the shooting angle is tilted or rotated, the centers of each scale line are distributed in an irregular pattern. In this condition, the centers of the main scale lines deviate from their corresponding positions in the front view. Nonetheless, a perspective relationship can be established among the center points of the main scale lines corresponding to equal scale values. Given this established perspective relationship, the dial image correction can be accomplished.
Establishing perspective relationships and calculating the perspective transformation matrix requires two sets of key points. These two sets of keysets include the keyset { P 1 , P 2 , P 3 , P 4 } before the perspective transformation, and the keyset { P 1 , P 2 , P 3 , P 4 } after the perspective transformation, where any three points are not collinear. The following are the stages involved in computing the perspective transformation matrix:
(a)
Key point fitting.
Given the rectangular nature of the main scale lines in the mask image, this paper employs the method of fitting the smallest enclosing rectangle. The center coordinates of the fitted rectangle are used as the key points. In particular, the center of the four corner points of the outer rectangle fitted against the pointer mask portion is used as the center of the pointer, and the midpoint of the two corner points closest to the center of the image is used as the dial center. The specific steps are shown in Figure 6.
Firstly, edge detection for contouring is carried out using the Canny algorithm. The horizontal, vertical and diagonal portions of the resulting contours are then compressed, leaving only the endpoints. Consequently, the central coordinates can be computed and the key points can be obtained.
(b)
Key point matching.
Due to the possibility of the rotation and distortion of the dial image, it is unclear which scale value corresponds to the center coordinate of the main scale line. This makes it challenging to establish a relationship with the center points under the front view. To tackle this issue, this article proposes a solution.
Firstly, the rectangular coordinates are transformed into polar coordinates, with the dial’s center serving as the origin. The conversion of the rectangular coordinates to polar coordinates is completed using Equation (3): 1.5
θ = arctan y y 0 x x 0 R = ( x x 0 ) 2 + ( y y 0 ) 2
where θ is the polar angle, R is the length of the line connecting the midpoint of the main scale line with the center point of the dial, and ( x 0 , y 0 ) is the coordinate of the dial center.
These coordinates are then sorted in a clockwise manner based on the magnitude of the polar angle. The positions of the polar coordinates corresponding to the minimal and maximal scale values in the clockwise sorted queue can be found using the fundamental principle that the difference between the polar angles of the polar coordinates corresponding to the minimal and maximal scale values is the largest in adjacent polar coordinates. Then, the clockwise queue can be sorted in ascending order, with the polar coordinate corresponding to the smallest scale value as the start of the queue, and the polar coordinate with the largest corresponding scale value as the end of the queue. Consequently, the polar coordinates of all key points to their corresponding scale values can be matched. By converting the polar coordinates to rectangular coordinates, the rectangular coordinates of all key points to their corresponding scale values can be matched. The conversion of polar coordinates to rectangular coordinates is completed using Equation (4):
x = x 0 + R · cos θ y = y 0 + R · sin θ
where the calculated (x, y) is the coordinate in the rectangular coordinate system.
It is worth adding that the upper left corner of the image serves as the origin for the previously specified rectangular coordinate system. It follows the right-hand rule, according to which the origin’s lower side points in the direction of the positive y-axis and its right side points in the direction of the positive x-axis.
(c)
Key point calculation in the front view.
When looking at the dial under the front view, the angle between the midpoint of each adjacent main scale line and the center of the dial can be expressed by Equation (5):
Φ = 2 × π α β 1
where α is the angle between the center points of the main scale lines corresponding to the minimal and maximal scale values and the center point of the dial. β signifies the number of main scale lines displayed on the dial. Figure 7a is a specific diagram of Equation (5).
In the front view of the dial, the polar angle corresponding to the center point of each main scale line can be calculated using Equation (6). Figure 7b is a concrete schematic diagram of the Equation (6): 1.0
θ 0 = π α 2 + α θ 1 = π α 2 4 × Φ θ 2 = π α 2 3 × Φ θ 3 = π α 2 2 × Φ θ 4 = π α 2 Φ θ 5 = π α 2 .
The value of α is determined according to the meter structure. In this paper, α takes the value of 90°. β is the number of main scale lines. R is the shortest distance, measured before transformation, between the center point of each main scale line and the dial’s center. This ensures that the dial in the corrected image will not exceed the image boundary. Thus, the polar coordinates of the key points in the front view can be quantized as (R, θ i ), where the value of i ranges from 0 to 5. Lastly, the rectangular coordinates of the key points in the front view can be calculated using Equation (4).
(d)
Perspective matrix calculation.
The full form of the perspective transformation is shown in the Equation (7):
x y w = P u v w = b 11 b 12 b 13 b 21 b 22 b 23 b 31 b 32 b 33 u v w
where (x, y, w ) denotes the corresponding coordinates following perspective transformation and (u, v, w) denotes the two-dimensional homogeneous coordinates in the original image. With w set to 1, Equation (8) can be used to determine the two-dimensional plane coordinates ( x , y ).
x = x w = b 11 u + b 12 v + b 13 b 31 u + b 32 v + a 33 y = y w = b 21 u + b 22 v + b 23 b 31 u + b 32 v + b 33 .
The two sets of key point coordinates { P 1 , P 2 , P 3 , P 4 } and { P 1 , P 2 , P 3 , P 4 } are substituted into Equation (8). It is possible to calculate the perspective matrix P by setting b 33 = 1. Ultimately, perspective transformation can be used to generate the corrected dial image.

3.4. Reading Recognition Module

The reading is the final part of the whole task, so a reliable reading method is the key to obtaining an accurate reading. Detecting and recognizing the scale values and the unit of the dial based on PP-OCRv3 will be discussed in Section 3.4.1, and the principle of reading using the WAM will be discussed in Section 3.4.2.

3.4.1. Scale Values and Unit Information Recognition Based on PP-OCRv3

The text processing in PP-OCRv3 [12] involves three key stages: text detection, detection frame rectification, and text recognition. Firstly, the model leverages deep convolutional neural networks to extract features from the dial image and generates candidate text regions. These regions are then filtered to retain the most promising ones. Secondly, the detected regions undergo fine-tuning to precisely align with the actual boundaries of the text, utilizing techniques such as regression and deformation. This ensures accurate localization. Finally, the text recognition network, which replaces the CRNN in PP-OCRv2 [30] with SVTR_LCNet, combines the Transformer-based algorithm SVTR [31] and the convolution-based algorithm PP-LCNet [32]. It can efficiently recognize the scale values and the unit information. The recognition results of the scale values and the unit are shown in Figure 8.

3.4.2. Reading Based on the WAM

This paper uses the WAM [29], which considers multiple scales around the pointer and gives different weights to each set of scales to calculate the meter reading more accurately. It is improved based on the angle method. In order to better explain the WAM, the angle method will be described first. The Equation (9) of the angle method is as follows:
V = P l + B A × ( P r P l )
where V represents the reading, P l is the lower value of the scale adjacent to the pointer and P r is the higher value to the pointer. Additionally, A denotes an angle between two straight lines formed by the midpoint of the main scale line on both sides of the hand and the midpoint of the dial. B represents an angle formed by the line between the middle point of the main scale line with the center of the dial and the line where the pointer is located. The schematic representation of the angle method is displayed in Figure 9a.
The Equation (10) used for the WAM is as follows:
V = i 4 e i P l k 1 + B i A i P r k 2 P l k 1
where E = {0.4, 0.25, 0.25, 0.1}, e i E. ( A i , B i ) is the i-th angle set, k 1 = 1, 2, k 2 = 1, 2. Figure 9b provides a clear illustration of the WAM. In addition, in this paper, if there is only one scale to the left or right of the pointer, the angle method will be used instead of the WAM. It overcomes the limitations of using only WAM, making the reading more flexible and reliable. However, for the sake of convenience, the reading method in this article is still named WAM.

4. Experiment

4.1. Experimental Details

4.1.1. Experimental Platform

The software environment is CUDA11.7, OpenCV 4.6.0.66 and Python 3.8.0. The experiments are conducted based on Pytorch1.13.0 + cu117 and paddle2.5.0. The computer’s configuration is detailed in Table 1.

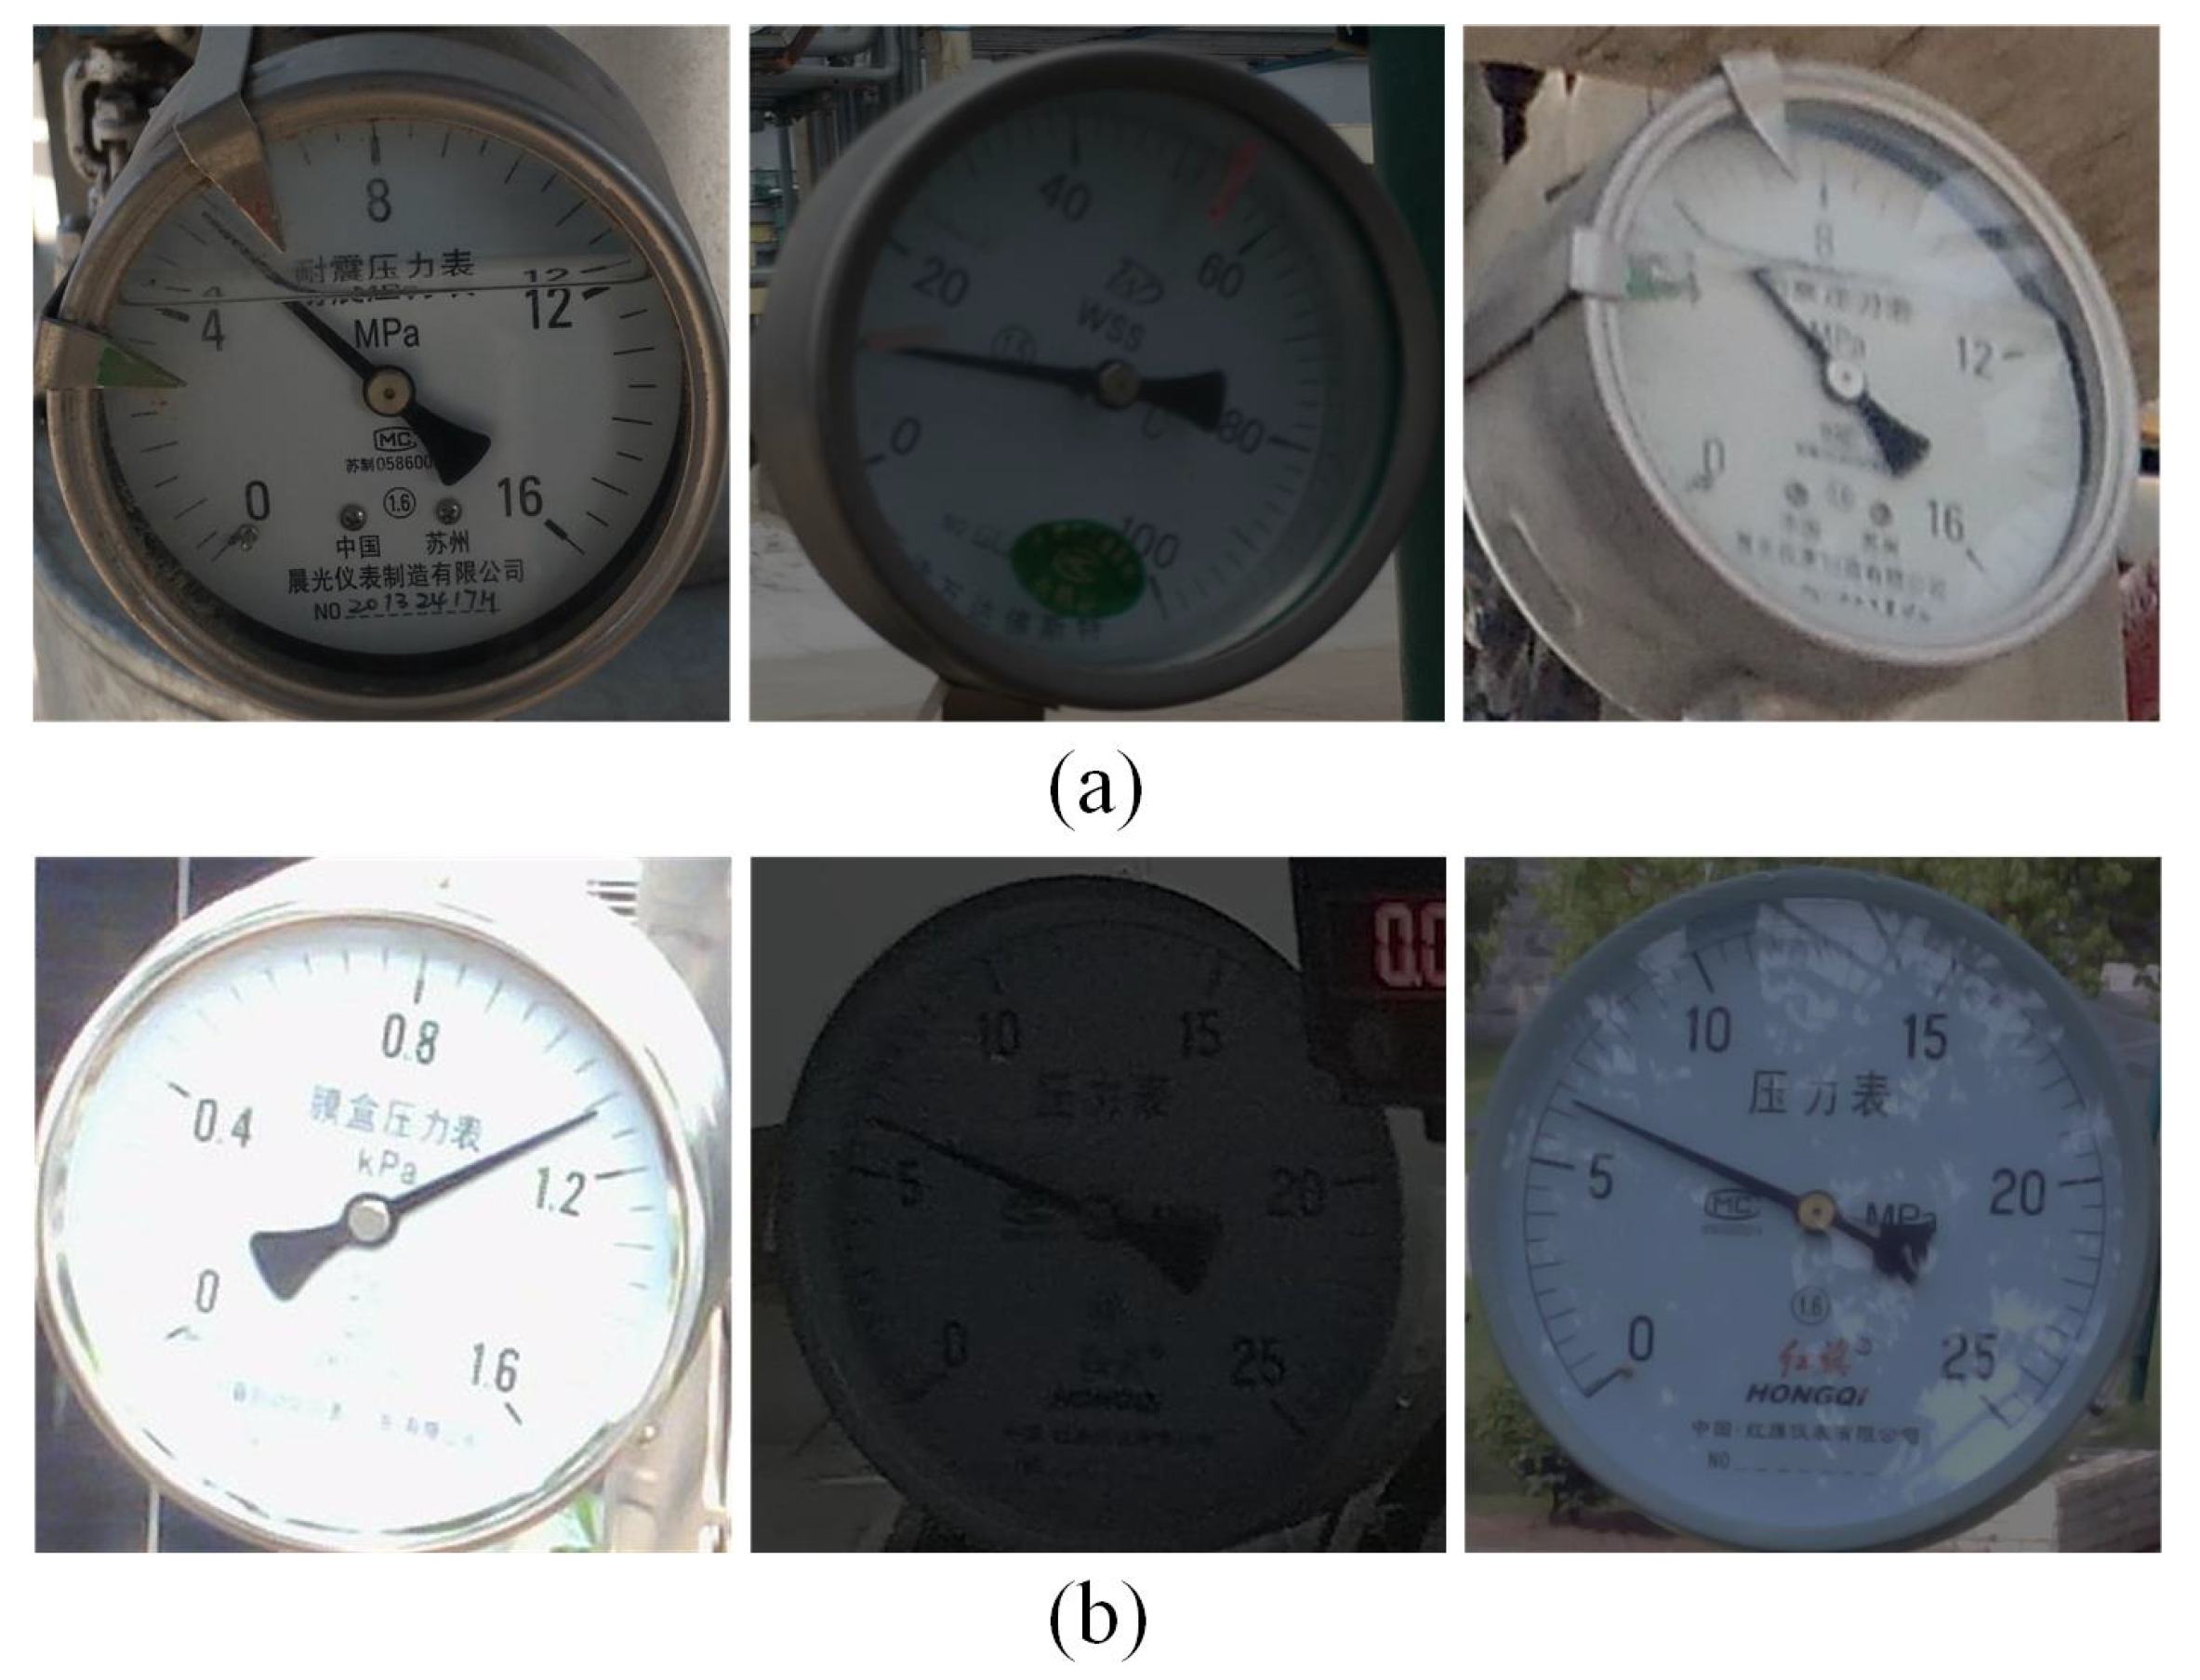
4.1.2. Experimental Datasets

Considering that point meter images are often captured by moving cameras on inspection robots, the main challenges for meter reading recognition include varying illumination, image distortion, etc. To comprehensively evaluate the proposed method, we collect two datasets with different levels of difficulty: Simple-MeterData and Complex-MeterData.
Simple-MeterData: Most images in this dataset are characterized as high resolution, good brightness, and minimal distortion. It has four different types of meters with a total of 1730 images, including 1211 training images, 346 validation images, and 173 test images. As this dataset contains few challenges for meter reading recognition, we thus delegate it as Simple-MeterData.
Complex-MeterData: Compared to Simple-MeterData, Complex-MeterData features lower resolution, worse brightness, and higher levels of distortion in its images. It contains a total of 687 images, with 480 training images, 107 validation images, and 100 test images.
The main characteristics of the above two datasets are summarized in Table 2, and some image examples of these two datasets can be found in Figure 10.
In addition, it is important to emphasize that the datasets of annotations are different for different tasks. For the detection task, the meters are labeled as one class and the rest are labeled as the background. For the segmentation task, the information on the dial is labeled into two categories. The main scale lines are labeled as one class, the pointer is labeled as another class, and the rest are the background.

4.2. Ablative Experiments

4.2.1. Dial Detection Module Testing

In this paper, YOLOv8 is trained using the initial weight, which is the training weight of the COCO128 dataset. AdamW is selected as the gradient descent function, with a batch size of 16 and an epoch count of 300. The performance of YOLOv8 is measured using the mAP50 and mAP50-95 evaluation metrics. mAP50 represents the mean average accuracy when the IoU(Intersection over Union) threshold is 0.5. mAP50-95 represents the mean average accuracy over different IoU thresholds (from 0.5 to 0.95 with a step size of 0.05). The Equations (11) and (12) for the calculation of the mAP value are as follows:
AP = 1 m i m P i = 1 m × P 1 + 1 m × P 2 + + 1 m × P m = P ( R ) d R ,
mAP = 1 c AP 1 + AP 2 + + AP c
where m and c indicate the number of samples and classes respectively, P i represents the probability of actually being positive in a sample predicted to be positive, AP stands for the average precision at different recall rates, and mAP is the average of the AP values across all the categories.
As is evident from Figure 11, the accuracy of dial detection improves as the number of iterations increases. Finally, mAP50 stabilizes at 99.5% and mAP50-95 stabilizes at 91.7%. To test the robustness of YOLOv8, images under exposure, rotation, and low light conditions are selected. Figure 12 illustrates the detection effect of YOLOv8. It is evident that YOLOv8 exhibits an impressive detection capability and robust performance in handling intricate environmental disturbances.

4.2.2. Dial Information Extraction Module Testing

This paper employs three key metrics for evaluating the performance of segmentation models.: accuracy (Acc), mean Intersection over Union (mIoU), and mean pixel accuracy (mPA). The following are Formulas (13)–(15) for determining Acc, mIoU, and mPA:
Acc = ( TP + TN ) ( TP + TN + FP + FN ) ,
mIoU = 1 n + 1 × i = 1 n TP i ( TP i + FP i + FN i ) ,
mPA = 1 n + 1 × i = 1 n TP i ( TP i + FP i )
where n indicate the number of classes, TP represents the positive samples predicted to be in the positive category, TN represents the negative samples predicted to be a negative category, FP represents the negative sample predicted to be a positive category and FN represents the positive samples predicted to be in the negative category.
In this subsection, several experiments are conducted to compare the performance of the TransUNet segmentation model using our proposed method with other advanced segmentation models, including PSPNet [33], DeepLabv3+ [34], and Unet [35]. These models are widely used in various segmentation tasks, and we have adapted them for dial information extraction. The training parameters are configured with a batch size of 4 and 200 epochs.
As is evident from the comparison results presented in Table 3, the segmentation performance of TransUNet surpasses that of other networks in terms of the mPA and Acc. It also further indicates that TransUNet possesses a more powerful performance in extracting dial information.
The comparison results of some images are shown in Figure 13. Under different lighting, pointer shadows and image blurring, TransUNet has similar segmentation results with other networks but performs better in some respects. PSPNet accomplishes the segmentation of the pointer and main scale line region, but the edges of the region are not fine enough after segmentation. The incomplete recognition and incorrect recognition of the main scale lines and a truncated pointer appear, as seen in dial images No.l, No.i, and No.j. Although DeepLabv3+ effectively fits the majority of pixel areas within the main scale lines and pointers, it struggles with accurately fitting the ends of the pointers, such as No.b and No.l, leading to significant errors. Unet excels at edge segmentation, accurately capturing both the main scale lines and the pointer region. However, the end of the pointer as shown in No.b and No.d is too large. Additionally, when the main scale lines in the original image are not obvious, segmentation results such as No.l occur, resulting in a large deviation in the location of the segmented main scale lines.
Upon examination of the segmentation results presented in this paper, it becomes evident that TransUNet’s segmentation effect on the pointer and main scale lines is better compared with other networks in terms of completion, and performs superiorly in resisting the interference of a low-brightness environment as well as fuzzy images. However, the edges of the segmented region are not delicate enough, as in images No.c and No.d, which are still to be improved.
To further corroborate the superiority of TransUNet in extracting dial information compared to other semantic segmentation networks, the method described in this research is merged with many semantic segmentation networks to read every dial in Figure 13. Table 4 presents the comparative results, clearly demonstrating that TransUNet outperforms other semantic segmentation networks in terms of the reading accuracy.
In summary, TransUNet achieves results close to or even beyond those of other semantic segmentation networks. It shows that TransUNet can accomplish the task of segmenting the main scale lines and the pointer of a dial to an excellent standard.

4.2.3. Dial Correction and Reading Module Testing

In this paper, the dial is corrected effectively by establishing a perspective relationship among coordinate points that correspond to equal scale values. After testing a number of dial images, the results show that the correction method in this paper has the ability to correct the deviating points in most dial images to the correct position. The illustrated effectiveness of the dial correction module is shown in Figure 14. The key points fitted before and after correction are displayed in two colors in this paper, and it can be seen that the key points after correction are closer to the real positions.
The experiments are designed to validate the effectiveness of the perspective correction method introduced in this article, along with the WAM, in enhancing the precision of meter readings. The detailed experimental plan is outlined as follows: (a) use the angle method to read the uncorrected dial image; (b) use the angle method to read the perspective-corrected dial image; (c) use the WAM to read the perspective-corrected dial image.
In this work, we utilize the quoted error η , the relative error δ , and the accuracy to quantify the pointer meter reading performance. These metrics can be formulated as Equation (16):
δ = V real V code V real × 100 % η = V real V code V max × 100 % Accuracy = ( 1 δ ) × 100 %
where V real represents the manually read true value, V code signifies the measured value obtained through the algorithm presented in this paper, and V max denotes the maximum scale value of the dial being tested.
All the dial images depicted in Figure 14 are read in accordance with the established experimental scheme. The results shown in Table 5 indicate that the dial image readings acquired without correction using the angle method have the highest mean quoted error and mean relative error.
In contrast to the readings from uncorrected dial images, the mean quoted error and mean relative error of the dial image readings after correction using the angle method are 42.11% and 28.44% lower, respectively. The reason for these results is that each of the main scale lines of the corrected dial is arranged on a circle centered on the center of the dial, ensuring that the angle between each scale line remains uniform. This precision in the layout significantly reduces reading errors.
Using the WAM, the mean quoted error and mean relative error of the corrected dial image readings are reduced by 22.73% and 39.74%, respectively. This improvement is because the traditional angle method relies solely on two sets of scale values for computing the reading. However, there is a significant gap between these two scales. The WAM takes into account four distinct sets of scale values surrounding the pointer and computes the readings individually. These readings are then multiplied by their corresponding weights to arrive at the final reading. This approach ensures that each scale value contributes to the readings in a specific manner, effectively accounting for various distortions present in the dial image.
These results clearly show that perspective transformation correction in conjunction with the WAM efficiently lowers the error, which in turn leads to a notable improvement in the accuracy of the meter readings.

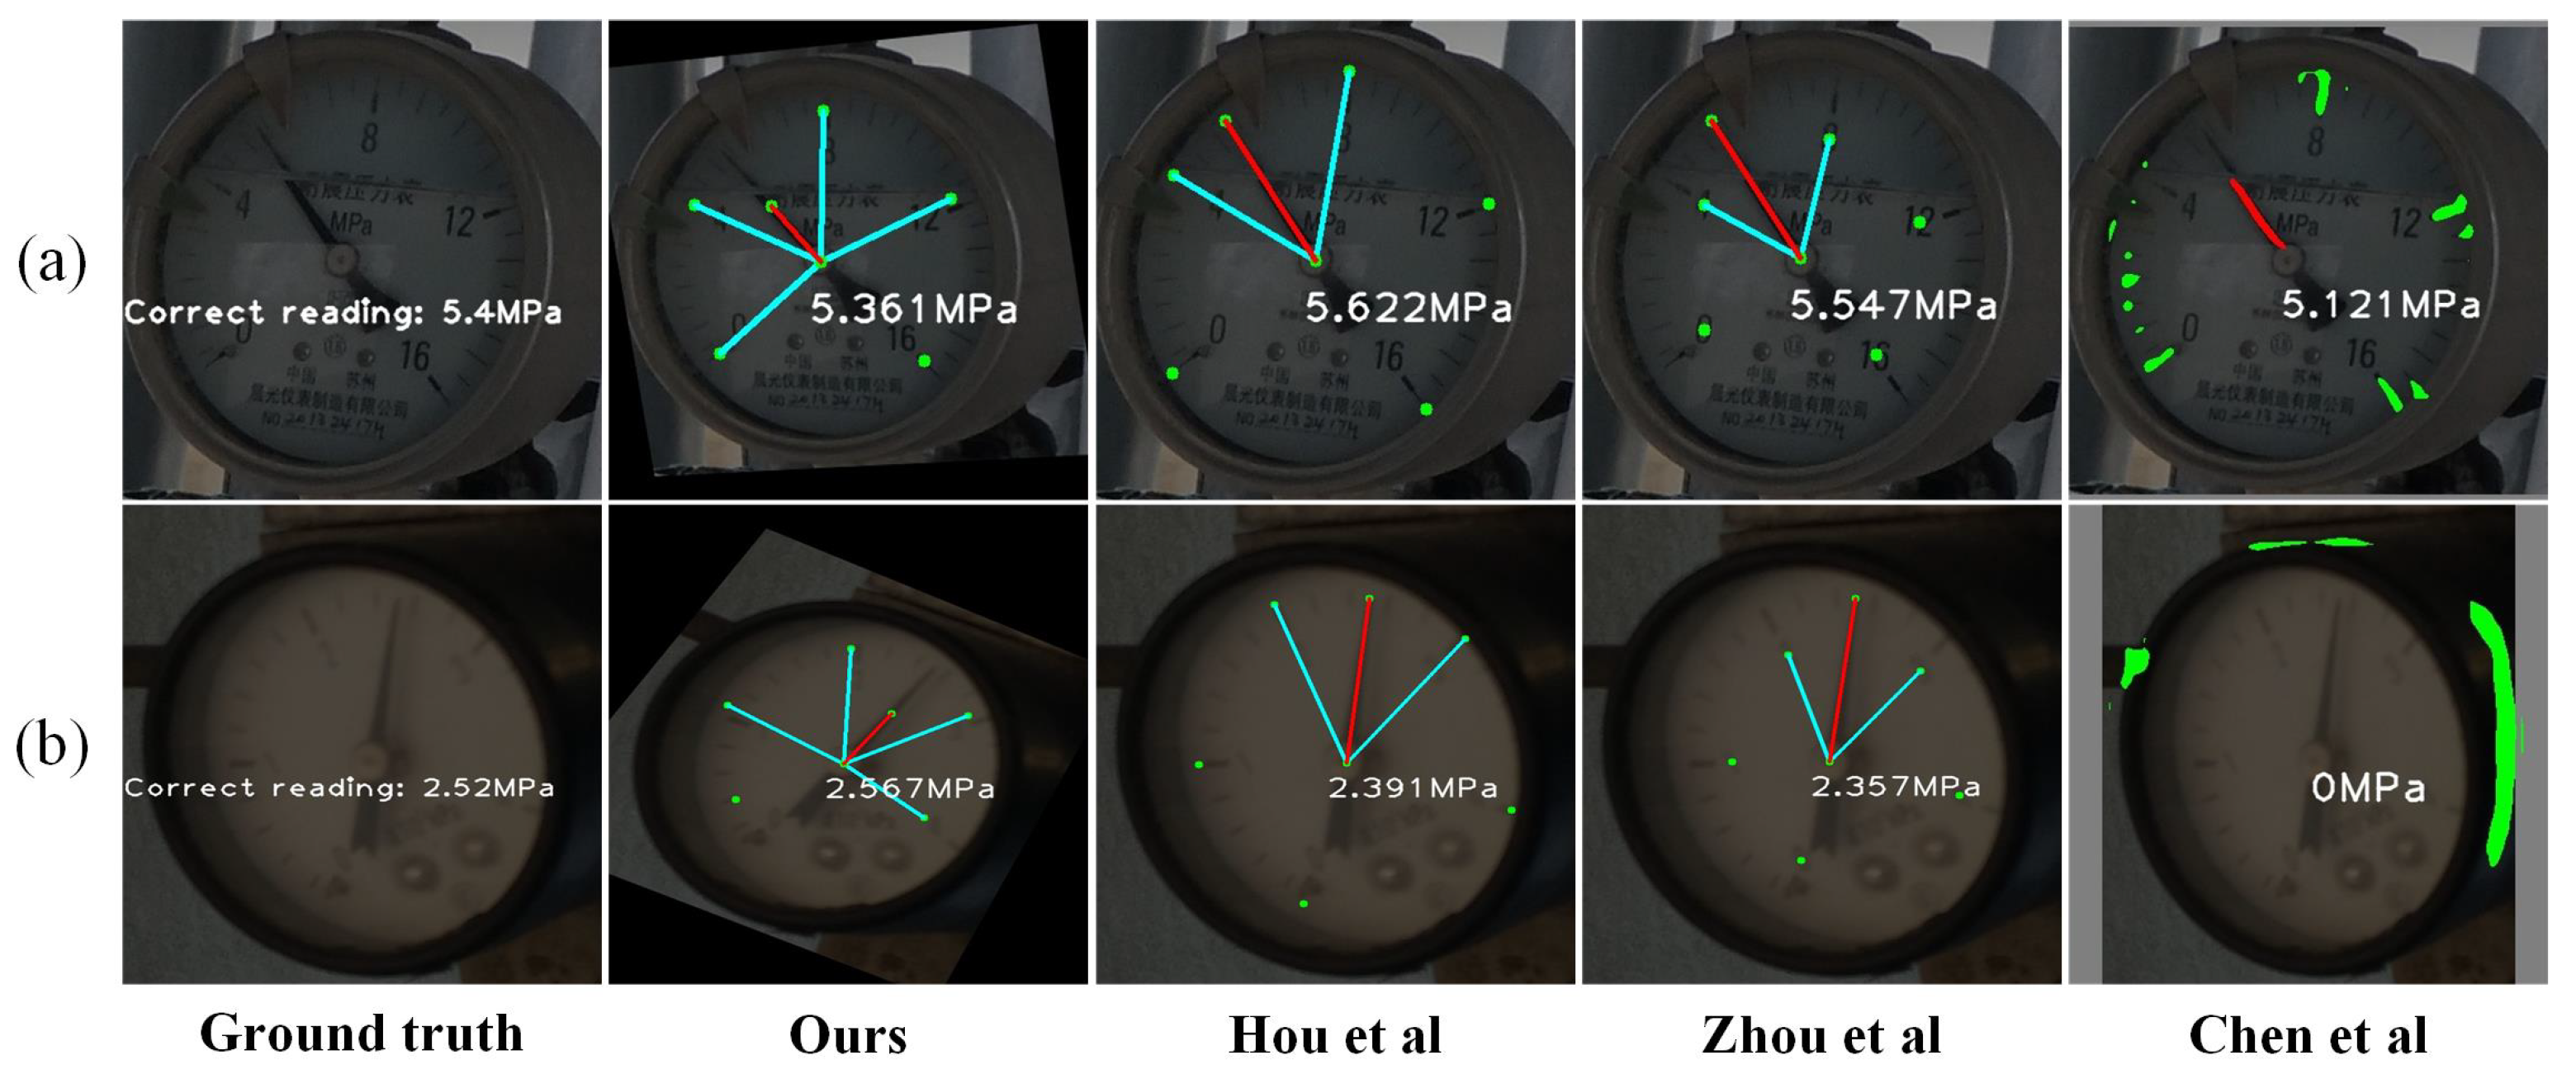
4.3. Comparative Experiments

To further assess the effectiveness of the automatic pointer meter reading method suggested in this work, a comparative experiment is undertaken on Simple-MeterData and Complex-MeterData with other advanced methods released in the last 2 years. The specifics of these comparative methods are outlined below.
(a)
Chen et al. [1] introduced the YOLOv5-U2Net-PCT algorithm, which integrates YOLOv5 for dial detection with U2Net for extracting dial information. The dial image undergoes a perspective transformation correction based on the perimeter length of the rectangle enclosing the dial. Additionally, a polar coordinate dimensionality reduction reading (PCT) method is employed to accurately calculate the meter reading.
(b)
Zhou et al. [2] proposed the YOLOv5-based algorithm. YOLOv5 is used to detect dials and extract dial information. The half-pointer method fits the pointer’s linear equation. The angle method calculates readings based on the scale values on either side of the pointer.
(c)
Hou et al. [3] proposed the YOLOX-Unet algorithm. It uses YOLOX to locate the dial and Unet to segment the dial information. The dial is corrected from an elliptical shape to a circular shape through the application of perspective transformation. The angle method calculates readings based on the scale values on either side of the pointer.
In order to compare the performance of various methods fairly and to highlight the superiority of the proposed methods in the stage of dial information extraction and correction, YOLOv8 is used to detect the dial in the detection stage of all the above-mentioned methods. To clarify the essential technologies employed by the comparison methods, the individual modules of each approach are listed in Table 6 from three perspectives: the extraction of dial information, correction, and reading.
Figure 15 illustrates some reading results for each method on the Simple-MeterData. The comparative results of the pointer meter readings on the Simple-MeterData shown in Table 7 reveal that the method proposed in this paper surpasses other leading-edge approaches in terms of the reading accuracy.
The experimental outcomes clearly evidence the superior performance of our method on the Simple-MeterData. Nevertheless, we are cognizant of the fact that the outcomes derived from a single dataset may not comprehensively and accurately reflect the generality and stability of the method. Therefore, in order to enhance the persuasiveness of the experiment, the method of this paper is tested with the above three methods on Complex-MeterData under the same conditions. Figure 16 illustrates the results of the readings for each method on the Complex-MeterData. The experimental results on the Complex-MeterData shown in Table 8 reveal that our method continues to outperform other advanced methods in terms of the reading accuracy. This underscores the robustness and stability of our algorithm.
The method from Chen et al. exhibits the lowest accuracy, which can be attributed to the inability of perspective correction methods based on rectangular length to achieve effective correction. And the polar coordinate dimension reduction method used in the reading phase increases this reading error. Zhou et al. utilize YOLOv5 to extract the dial information. However, the accuracy using the object detection model is not as high as that of the semantic segmentation model. And the reading error is still large because it does not correct the dial image. In addition, the method of Zhou et al. is based on the angle between the dial numbers. However, the actual meter reading should be based on the angle between the main scale lines on the dial. Among the three compared methods, Hou et al.’s method has the highest accuracy because it adopts a more appropriate correction method, which utilizes perspective changes to transform the dial image from an elliptical region to a circular region.
The proposed method has a much higher reading accuracy than the best method out of those being compared.Three primary causes are identified: (a) Gamma correction is applied for enhancing the dial image. Furthermore, TransUNet performs better in segmentation than Unet. (b) Our approach makes use of a more robust correction technique that can provide both rotation and distortion correction with improved meter reading resilience. (c) The reading accuracy of the WAM employed in this article is higher than that of the proximate angle method.
To evaluate the computational efficiency of the proposed method, we have measured the processing time for each module used at different stages, as shown in Table 9. The results show that in the stage of extraction of dial information, due to the introduction of ViT, the reasoning speed of TransUNet is slower than that of Unet, but it is only 0.02 s slower on average. In the dial correction stage, Hou et al. first use the least square method to fit the ellipse, and then realize the correction according to the obtained perspective matrix. It takes a lot of time in the process of fitting the ellipse. In this paper, the central coordinate of the main scale line on the dial is directly used as the key point for correction, which requires less time, and completes the rotation correction of the dial image at the same time. It achieves the effect of twice as good a result with half the effort. In the reading recognition stage, in order to ensure the accuracy of identifying the dial scale value and unit, this paper adopts the PP-OCRv3 model to realize the detection and recognition of the scale value and unit information, which takes quite a long time, but there is no doubt that the recognition accuracy is improved.

4.4. Discussion

After building the same experimental environment, the experimental part of this paper is carried out in two aspects: ablative experiments and comparative experiments.
The ablative experiments are carried out in three modules: dial detection module, dial information segmentation module, and dial correction and reading module. In the dial detection module, the application of YOLOv8 revealed remarkable robustness, maintaining a high detection accuracy even in challenging conditions such as exposure, rotation, and low-illumination environments. This indicates that YOLOv8 can accurately detect dials without performing image preprocessing before detection. In the dial information segmentation module, the method of this paper is combined with three other segmentation networks. The reading results show that combining TransUNet with the methods in this paper minimizes the error. The quoted error is reduced to only 0.267 % in the tested dial images. This demonstrates that TransUNet is indeed more capable of the task of dial information segmentation than the other networks. However, in the comparison of the training results under the three metrics of mIoU, mPA, and Acc, although the mPA and Acc values of TransUNet’s results are higher than those of the other three networks, the value of mIoU is lower than that of Unet. This shows that there is still room for improvement for TransUNet. In the dial correction and reading module, the reduction in the reading errors shows that the perspective correction method proposed in this paper as well as the cited WAM algorithm helps in dial reading.
The method proposed in this paper is compared with three other advanced methods on two datasets in the comparative experiment. The results show that this paper’s method outperforms the highest accuracy among the three methods by 0.98% on Clear-MeterData and by 5.15% on Complex-MeterData. This demonstrates that the method in this paper is more robust to multiple illumination environments and dial distortions. However, the method in this paper has the lowest speed of all the mentioned methods, mainly due to the fact that the PP-OCRv3 model spends a lot of time on dial value and unit recognition, which is an area that needs to be improved in the future.

5. Conclusions

Reading pointer meters with visual methods remains crucial for data monitoring and analysis in the transition from traditional substations to intelligent substations. Existing recognition methods often struggle to efficiently extract dial image information in various illumination conditions and effectively deal with dial image distortion. To improve the accuracy of pointer meter reading in real-world scenes, this paper proposes a robust method based on TransUNet and perspective transformation correction. The proposed pipeline comprises four main modules: the YOLOv8 network for dial detection, the TransUNet semantic segmentation model for dial image segmentation, the perspective transformation method for dial correction, and the WAM for reading. Extensive ablation experiments have been conducted to evaluate the performance of each individual module within our approach. Furthermore, comparative experiments are carried out to compare the proposed method with other advanced methods on two self-collected datasets. The experimental results indicate that our method exhibits a better robustness and higher reading recognition accuracy compared to other methods, especially under varying illumination and image distortion. The reading accuracy using the proposed method can achieve 97.81% on Simple-MeterData and 93.39% on Complex-MeterData, respectively. Future work will focus on how to further enhance the robustness of the meter reading method in more challenging weather conditions, and extend its capacity for meters with multi-pointer or non-circular dials.

Author Contributions

Conceptualization, L.T., W.W. and Q.L.; methodology, L.T. and W.W.; software, L.T., C.L. and J.D.; validation, L.T. and W.W.; formal analysis, L.T.; investigation, L.T. and W.W.; resources, W.W.; data curation, L.T., J.D. and W.Y.; writing—original draft preparation, L.T.; writing—review and editing, W.W.; visualization, L.T. and W.W.; supervision, W.W.; project administration, W.W. and Q.L.; funding acquisition, W.W. and Q.L. All authors have read and agreed to the published version of the manuscript.

Funding

This work was partly supported by Scientific Research Project of Hunan Education Department of China under Grant 21B0330, Hunan Provincial Natural Science Foundation of China under Grant 2024JJ6063, and Open Fund Project of Hunan Province Key Laboratory of Electric Robot under Grant PROF2101.

Data Availability Statement

The data are unavailable due to privacy.

Conflicts of Interest

The authors declare no conflicts of interest.

References

  1. Chen, L.; Wu, X.; Sun, C.; Zou, T.; Meng, K.; Lou, P. An intelligent vision recognition method based on deep learning for pointer meters. Meas. Sci. Technol. 2023, 34, 055410. [Google Scholar] [CrossRef]
  2. Zhou, D.; Yang, Y.; Zhu, J.; Wang, K. Intelligent reading recognition method of a pointer meter based on deep learning in a real environment. Meas. Sci. Technol. 2022, 33, 055021. [Google Scholar] [CrossRef]
  3. Hou, L.; Wang, S.; Sun, X.; Mao, G. A pointer meter reading recognition method based on YOLOX and semantic segmentation technology. Measurement 2023, 218, 113241. [Google Scholar] [CrossRef]
  4. Zuo, L.; He, P.; Zhang, C.; Zhang, Z. A robust approach to reading recognition of pointer meters based on improved mask-RCNN. Neurocomputing 2020, 388, 90–101. [Google Scholar] [CrossRef]
  5. Ma, Y.; Jiang, Q. A robust and high-precision automatic reading algorithm of pointer meters based on machine vision. Meas. Sci. Technol. 2018, 30, 015401. [Google Scholar] [CrossRef]
  6. Xu, S.; Hou, C.; Wang, Z.; Li, B. Pointer gauge adaptive reading method based on a double match. Meas. Sci. Technol. 2020, 31, 115002. [Google Scholar] [CrossRef]
  7. Yang, Z.; Niu, W.; Peng, X.; Gao, Y.; Qiao, Y.; Dai, Y. An image-based intelligent system for pointer instrument reading. In Proceedings of the 2014 4th IEEE International Conference on Information Science and Technology, Shenzhen, China, 26–28 April 2014; pp. 780–783. [Google Scholar]
  8. Peng, G.; Du, B.; Cao, C.; He, D. Pointer-type instrument positioning method of intelligent inspection system for substation. J. Electron. Imaging 2022, 31, 013001. [Google Scholar] [CrossRef]
  9. Reis, D.; Kupec, J.; Hong, J.; Daoudi, A. Real-time flying object detection with YOLOv8. arXiv 2023, arXiv:2305.09972. [Google Scholar]
  10. Babakhani, P.; Zarei, P. Automatic gamma correction based on average of brightness. Adv. Comput. Sci. Int. J. 2015, 4, 156–159. [Google Scholar]
  11. Chen, J.; Lu, Y.; Yu, Q.; Luo, X.; Adeli, E.; Wang, Y.; Lu, L.; Yuille, A.L.; Zhou, Y. Transunet: Transformers make strong encoders for medical image segmentation. arXiv 2021, arXiv:2102.04306. [Google Scholar]
  12. Li, C.; Liu, W.; Guo, R.; Yin, X.; Jiang, K.; Du, Y.; Du, Y.; Zhu, L.; Lai, B.; Hu, X.; et al. PP-OCRv3: More attempts for the improvement of ultra lightweight OCR system. arXiv 2022, arXiv:2206.03001. [Google Scholar]
  13. Ji, D.; Zhang, W.; Zhao, Q.; Yang, W. Correction and pointer reading recognition of circular pointer meter. Meas. Sci. Technol. 2022, 34, 025406. [Google Scholar] [CrossRef]
  14. Guo, X.; Zhu, Y.; Zhang, J.; Hai, Y.; Ma, X.; Lv, C.; Liu, S. Intelligent pointer meter interconnection solution for data collection in farmlands. Comput. Electron. Agric. 2021, 182, 105985. [Google Scholar] [CrossRef]
  15. Gao, J.; Guo, L.; Lv, Y.; Wu, Q.; Mu, D. Research on algorithm of pointer instrument recognition and reading based on the location of the rotation center of the pointer. In Proceedings of the 2018 IEEE International Conference on Mechatronics and Automation (ICMA), Changchun, China, 5–8 August 2018; pp. 1405–1410. [Google Scholar]
  16. Liu, Y.; Liu, J.; Ke, Y. A detection and recognition system of pointer meters in substations based on computer vision. Measurement 2020, 152, 107333. [Google Scholar] [CrossRef]
  17. Sun, J.; Huang, Z.; Zhang, Y. A novel automatic reading method of pointer meters based on deep learning. Neural Comput. Appl. 2023, 35, 8357–8370. [Google Scholar] [CrossRef]
  18. Wu, Y.; Liao, T.; Chen, F.; Zeng, H.; Ouyang, S.; Guan, J. Overhead Power Line Damage Detection: An Innovative Approach Using Enhanced YOLOv8. Electronics 2024, 13, 739. [Google Scholar] [CrossRef]
  19. Wang, F.; Wang, G.; Lu, B. YOLOv8-PoseBoost: Advancements in Multimodal Robot Pose Keypoint Detection. Electronics 2024, 13, 1046. [Google Scholar] [CrossRef]
  20. Alegria, E.C.; Serra, A.C. Automatic calibration of analog and digital measuring instruments using computer vision. IEEE Trans. Instrum. Meas. 2000, 49, 94–99. [Google Scholar] [CrossRef]
  21. Alegria, F.C.; Serra, A.C. Computer vision applied to the automatic calibration of measuring instruments. Measurement 2000, 28, 185–195. [Google Scholar] [CrossRef]
  22. Chi, J.; Liu, L.; Liu, J.; Jiang, Z.; Zhang, G. Machine vision based automatic detection method of indicating values of a pointer gauge. Math. Probl. Eng. 2015, 2015, 283629. [Google Scholar] [CrossRef]
  23. Hou, L.; Qu, H. Automatic recognition system of pointer meters based on lightweight CNN and WSNs with on-sensor image processing. Measurement 2021, 183, 109819. [Google Scholar] [CrossRef]
  24. Zhang, C.; Shi, L.; Zhang, D.; Ke, T.; Li, J. Pointer meter recognition method based on Yolov7 and hough transform. Appl. Sci. 2023, 13, 8722. [Google Scholar] [CrossRef]
  25. Hou, Z.; Ouyang, H.; Hu, X. Tilt correction method of pointer instrument. In Proceedings of the 2021 China Automation Congress (CAC), Beijing, China, 22–24 October 2021; IEEE: Piscataway, NJ, USA, 2021; pp. 608–612. [Google Scholar]
  26. Li, Z.; Zhou, Y.; Sheng, Q.; Chen, K.; Huang, J. A high-robust automatic reading algorithm of pointer meters based on text detection. Sensors 2020, 20, 5946. [Google Scholar] [CrossRef]
  27. Huo, Y.; Bai, H.; Sun, L.; Fang, Y. Reading recognition of pointer meters based on an improved UNet++ network. Meas. Sci. Technol. 2023, 35, 035009. [Google Scholar] [CrossRef]
  28. Zhang, H.; Chen, Q.; Lei, L. A YOLOv3-Based Industrial Instrument Classification and Reading Recognition Method. Mob. Inf. Syst. 2022, 2022, 7817309. [Google Scholar] [CrossRef]
  29. Zhang, W.; Ji, D.; Yang, W.; Zhao, Q.; Yang, L.; Zhuoma, C. Application of Swin-Unet for pointer detection and automatic calculation of readings in pointer-type meters. Meas. Sci. Technol. 2023, 35, 025904. [Google Scholar] [CrossRef]
  30. Du, Y.; Li, C.; Guo, R.; Cui, C.; Liu, W.; Zhou, J.; Lu, B.; Yang, Y.; Liu, Q.; Hu, X.; et al. Pp-ocrv2: Bag of tricks for ultra lightweight ocr system. arXiv 2021, arXiv:2109.03144. [Google Scholar]
  31. Du, Y.; Chen, Z.; Jia, C.; Yin, X.; Zheng, T.; Li, C.; Du, Y.; Jiang, Y.G. Svtr: Scene text recognition with a single visual model. arXiv 2022, arXiv:2205.00159. [Google Scholar]
  32. Cui, C.; Gao, T.; Wei, S.; Du, Y.; Guo, R.; Dong, S.; Lu, B.; Zhou, Y.; Lv, X.; Liu, Q.; et al. PP-LCNet: A lightweight CPU convolutional neural network. arXiv 2021, arXiv:2109.15099. [Google Scholar]
  33. Zhao, H.; Shi, J.; Qi, X.; Wang, X.; Jia, J. Pyramid scene parsing network. In Proceedings of the IEEE Conference on Computer Vision and Pattern Recognition, Honolulu, HI, USA, 21–26 July 2017; pp. 2881–2890. [Google Scholar]
  34. Chen, L.C.; Zhu, Y.; Papandreou, G.; Schroff, F.; Adam, H. Encoder-decoder with atrous separable convolution for semantic image segmentation. In Proceedings of the European Conference on Computer Vision (ECCV), Munich, Germany, 8–14 September 2018; pp. 801–818. [Google Scholar]
  35. Ronneberger, O.; Fischer, P.; Brox, T. U-net: Convolutional networks for biomedical image segmentation. In Proceedings of the Medical Image Computing and Computer-Assisted Intervention–MICCAI 2015: 18th International Conference, Munich, Germany, 5–9 October 2015; proceedings, part III 18. Springer: Berlin/Heidelberg, Germany, 2015; pp. 234–241. [Google Scholar]
Figure 1. Several challenging image examples posed by (a) image distortion or rotation, (b) various illumination.
Electronics 13 02436 g001
Figure 2. The pipeline of the proposed pointer meter reading recognition method.
Electronics 13 02436 g002
Figure 3. Several examples of Gamma-corrected results.
Electronics 13 02436 g003
Figure 4. The overall structure of the TransUNet.
Electronics 13 02436 g004
Figure 5. The dial information segmentation process with TransUNet.
Electronics 13 02436 g005
Figure 6. The process of key point fitting.
Electronics 13 02436 g006
Figure 7. (a) The explanatory diagram of Equation (4). (b) The explanatory diagram of Equation (5).
Electronics 13 02436 g007
Figure 8. The recognition results of scale values and the unit.
Electronics 13 02436 g008
Figure 9. The schematic diagrams of two different reading recognition methods: (a) traditional angle method; and (b) weighted angle method.
Electronics 13 02436 g009
Figure 10. Several image examples of the Simple-MeterData and Complex-MeterData.
Electronics 13 02436 g010
Figure 11. The training results of dial detection with YOLOv8 in metrics of (a) mAP50 and (b) mAP50-95.
Electronics 13 02436 g011
Figure 12. The dial detection results based on YOLOv8 under different challenging conditions.
Electronics 13 02436 g012
Figure 13. The segmentation results of the main scale lines and the pointer based on different segmentation networks. Subfigures (al) are different meter samples randomly selected from the datasets. The Origin, PSPNet, DeepLabv3+, Unet, and TransUNet represent the original image and different segmentation models, respectively.
Electronics 13 02436 g013
Figure 14. Illustrated effectiveness of the dial correction module. Subfigures (al) are different meter samples randomly selected from the datasets. The left side of the subfigures shows the original images, while the right side displays the images after correction. The red points indicate the key points fitted before correction, while the green ones represent the key points after correction.
Electronics 13 02436 g014
Figure 15. The illustration results for different pointer meter reading methods on Simple-MeterData. Subfigures (a,b) are two meter examples. ’Ground truth’ represents correct reading result, while the reading results with our proposed method and other methods are displayed in other columns.
Electronics 13 02436 g015
Figure 16. The illustration results for different pointer meter reading methods on Complex-MeterData. Subfigures (a,b) are two meter examples. ’Ground truth’ represents correct reading result, while the reading results with our proposed method and other methods are displayed in other columns.
Electronics 13 02436 g016
Table 1. Computer configuration.
NameType
Operating systemWindows 11 64-bit
Graphics cardRTX-3050Ti
Memory16 G
CPUAMD Ryzen 5 5600H
Table 2. Comparison of the characteristics of Simple-MeterData and Complex-MeterData.
DatasetResolutionBrightnessDegree of Distortion
Simple-MeterDataHighMostly goodLow
Complex-MeterDataLowLowHigh
Table 3. Comparison of evaluation metrics for different semantic segmentation networks. The best results are shown in bold. Same below.
ModelmIoUmPAAcc
PSPNet [33]74.9583.2898.98
DeepLabv3+ [34]85.8692.6699.46
Unet [35]87.8893.3399.55
TransUNet86.1294.7599.58
Table 4. Comparison of the readings produced by the TransUNet method with different semantic segmentation networks: (1) PSPNet, (2) DeepLabv3+, and (3) Unet.
Reading δ (%) η (%)
NoReal(1)(2)(3)Ours(1)(2)(3)Ours(1)(2)(3)Ours
a1.121.1911.1081.1081.1086.3391.0711.0711.0714.43750.750.750.75
b6.156.2336.2126.1756.1751.351.0080.4070.4070.3320.2480.10.1
c1.111.0981.1011.1051.1181.0810.8110.450.7210.750.56250.31250.5
d6.236.1536.1616.1776.2421.2361.1080.8510.1930.3080.2760.2120.048
e1.101.1521.1001.1081.0954.7270.9090.7270.4553.250.6250.50.3125
f1.111.1561.1211.1281.1094.1440.9911.6220.092.8750.68751.1250.0625
g1.100.9981.0931.1081.1099.2730.6360.7270.8186.3750.43750.50.5625
h2.802.8232.7742.8442.8120.8210.9291.5710.4290.230.260.440.12
i6.246.3126.2356.2346.2521.1540.080.0960.1920.2880.020.0240.048
j6.256.2546.2786.3556.3720.0640.4481.681.9520.0160.1120.420.488
k1.101.1581.1341.1271.1035.2733.0912.4550.2733.6252.1251.68750.1875
12.792.8522.8312.8112.7922.2221.470.000.0720.620.410.000.02
Avg-----3.141.0460.9710.5561.9260.5430.5060.267
Table 5. Comparison of whether to use correction and whether WAM is used to produce results. P: Perspective correction. A: Angle method.
Reading δ  (%) η  (%)
NoRealAP + AP + WAMAP + AP + WAMAP + AP + WAM
a2.802.812.8172.7830.360.610.610.100.170.17
b2.812.8392.8152.8071.030.180.110.290.050.03
c1.101.1151.0981.1121.360.181.090.940.130.75
d6.206.2926.2646.2211.481.030.340.370.260.08
e2.782.7972.7892.7820.610.320.070.170.090.02
f6.106.2376.3646.1792.254.331.30.551.060.32
g6.206.2596.1966.1950.950.070.080.240.020.02
h0.620.6170.6190.6150.480.160.810.190.060.31
i0.640.6310.6310.6411.411.410.160.560.560.06
j6.256.2596.2456.2090.140.080.660.040.020.16
k0.630.6180.630.631.910.000.000.750.000.00
12.802.8322.8272.8111.140.960.390.320.270.11
Avg----1.090.780.470.380.220.17
Table 6. The module descriptions for different pointer meter reading methods.
Methods Extraction of Dial Information Correction Reading
Chen et al. [1] U2NetPCT
Zhou et al. [2] YOLOv5Proximate angle
Hou et al. [3] UnetProximate angle
OursTransUNetWAM
Table 7. Comparative results for different methods on Simple-MeterData.
Methods Accuracy (%) δ ¯  (%) η ¯  (%)
Chen et al. [1] 91.128.888.24
Zhou et al. [2] 94.765.241.76
Hou et al. [3] 96.833.171.18
Ours97.812.191.04
Table 8. Comparative results for different methods on Complex-MeterData.
Methods Accuracy (%) δ ¯ (%) η ¯ (%)
Chen et al. [1] 86.9713.032.61
Zhou et al. [2] 87.3812.261.87
Hou et al. [3] 88.2411.762.29
Ours93.396.611.49
Table 9. Comparative results of the processing time for each module used at different stages.
Methods Detection (s) Extraction of Dial Information (s) Correction (s) Reading (s) In Total (s)
Chen et al. [1] 0.031.050.011.282.37
Zhou et al. [2] 0.030.0700.010.11
Hou et al. [3] 0.030.150.340.010.53
Ours0.030.170.010.01 + 2.36 (OCR)2.58
Disclaimer/Publisher’s Note: The statements, opinions and data contained in all publications are solely those of the individual author(s) and contributor(s) and not of MDPI and/or the editor(s). MDPI and/or the editor(s) disclaim responsibility for any injury to people or property resulting from any ideas, methods, instructions or products referred to in the content.

