1. Introduction
At present, battery management system technology (BMS) is still not perfect enough. A key factor restricting the large-scale and full-field application of BMS is that it is difficult to accurately estimate the state of health of the battery, which directly affects the effective use of battery capacity. Failure to accurately determine the performance status of the battery will reduce the safety and reliability of the battery system, which causes battery charge and discharge control issues with a lack of sufficient reference information, and ultimately affects battery performance and service life [
1]. In order to ensure the reliable operation of the battery management system, there must be a method to help determine the
SOH of the battery system, so as to provide reference information for decision makers about when to remove or replace the battery [
2].
SOH is usually used to characterize the aging degree of the battery.
SOH represents the ability of the battery to store electric energy, which is related to the initial capacity of the battery. It is defined as the percentage of capacity and initial capacity when discharging to the discharge cut-off voltage under a certain working condition. The calculation formula is as follows:
where
is the capacity of the lithium battery in the
t-th charge discharge cycle, and
is the initial capacity of the battery. Generally, when the estimated value of battery
SOH is less than 80%, it means that the battery is out of service, so the effective estimation of battery usable capacity is equivalent to the indirect estimation of battery
SOH.
The complex chemical structure inside the battery and the influence of working conditions and environment make the degradation of lithium-ion battery nonlinear. The capacity regeneration phenomenon of the lithium battery brings challenges to the accurate estimation of SOH. Capacity regeneration means that the capacity decline of the lithium battery is not a monotonous decreasing process, but a sudden temporary capacity recovery phenomenon, causing capacity fluctuations and changing the trend of the degradation curve.
In order to further improve the performance of health state prediction of the battery system, this paper starts on the prediction model and data preprocessing method. At present, the life prediction methods of lithium-ion battery can be roughly divided into a model-based method and data-driven method [
3,
4,
5]. The model-based method reflects the electrochemical and physical characteristics of lithium-ion batteries by establishing an empirical model, so as to describe the degradation behavior of batteries. Zhang et al. [
6] constructs a physical model of battery aging attenuation, and identifies the parameters of constructing the RUL model by using the least squares method. The prediction results show that the method can control the relative error of training within 1%. Lyu et al. [
7] proposes an electrochemical model that simulates battery charge and discharge, treats the model parameters reflecting battery degradation as state variables, and estimates the service life of the battery using a particle filter. Despite the advantages of the strong real-time performance of the model-based approaches, the modeling and calculation are complex, and with the fixed parameter model it is difficult to accurately track the state of the internal structure of the battery. The data-driven method is the mainstream direction of available capacity estimation at present. It does not need to consider the internal complex structure, and only needs to deal with the relationship between input and output to build a model based on the historical characteristics of the battery. Data-driven methods usually use some machine learning algorithms for model training and prediction, including support vector machine (SVM), neural network (NN), random forest regression (RFM), Gaussian process regression (GPR), etc. [
8,
9,
10,
11]. Due to the local regeneration of capacity in the process of battery degradation, the traditional machine learning model has limited feature-grabbing ability, which leads to a significant reduction in the prediction accuracy of the model.
Compared with the traditional machine learning algorithm, the deep learning algorithm has a deeper hidden layer and can effectively mine the hidden features between the input parameters, so researchers also began to improve the model by using the deep learning network [
12]. Liu et al. [
13] used long-term and short-term memory recurrent neural networks to achieve online battery health assessment. Yang et al. [
14] proposed a battery
SOH estimation method based on a bidirectional long-term/short-term memory neural network, and verified the superiority of this method over back-propagation neural networks. However, these deep neural networks based on a recurrent neural network (RNN) structure inevitably face the problem of long-term dependence, and the degradation information in a long period of time will affect their prediction performance.
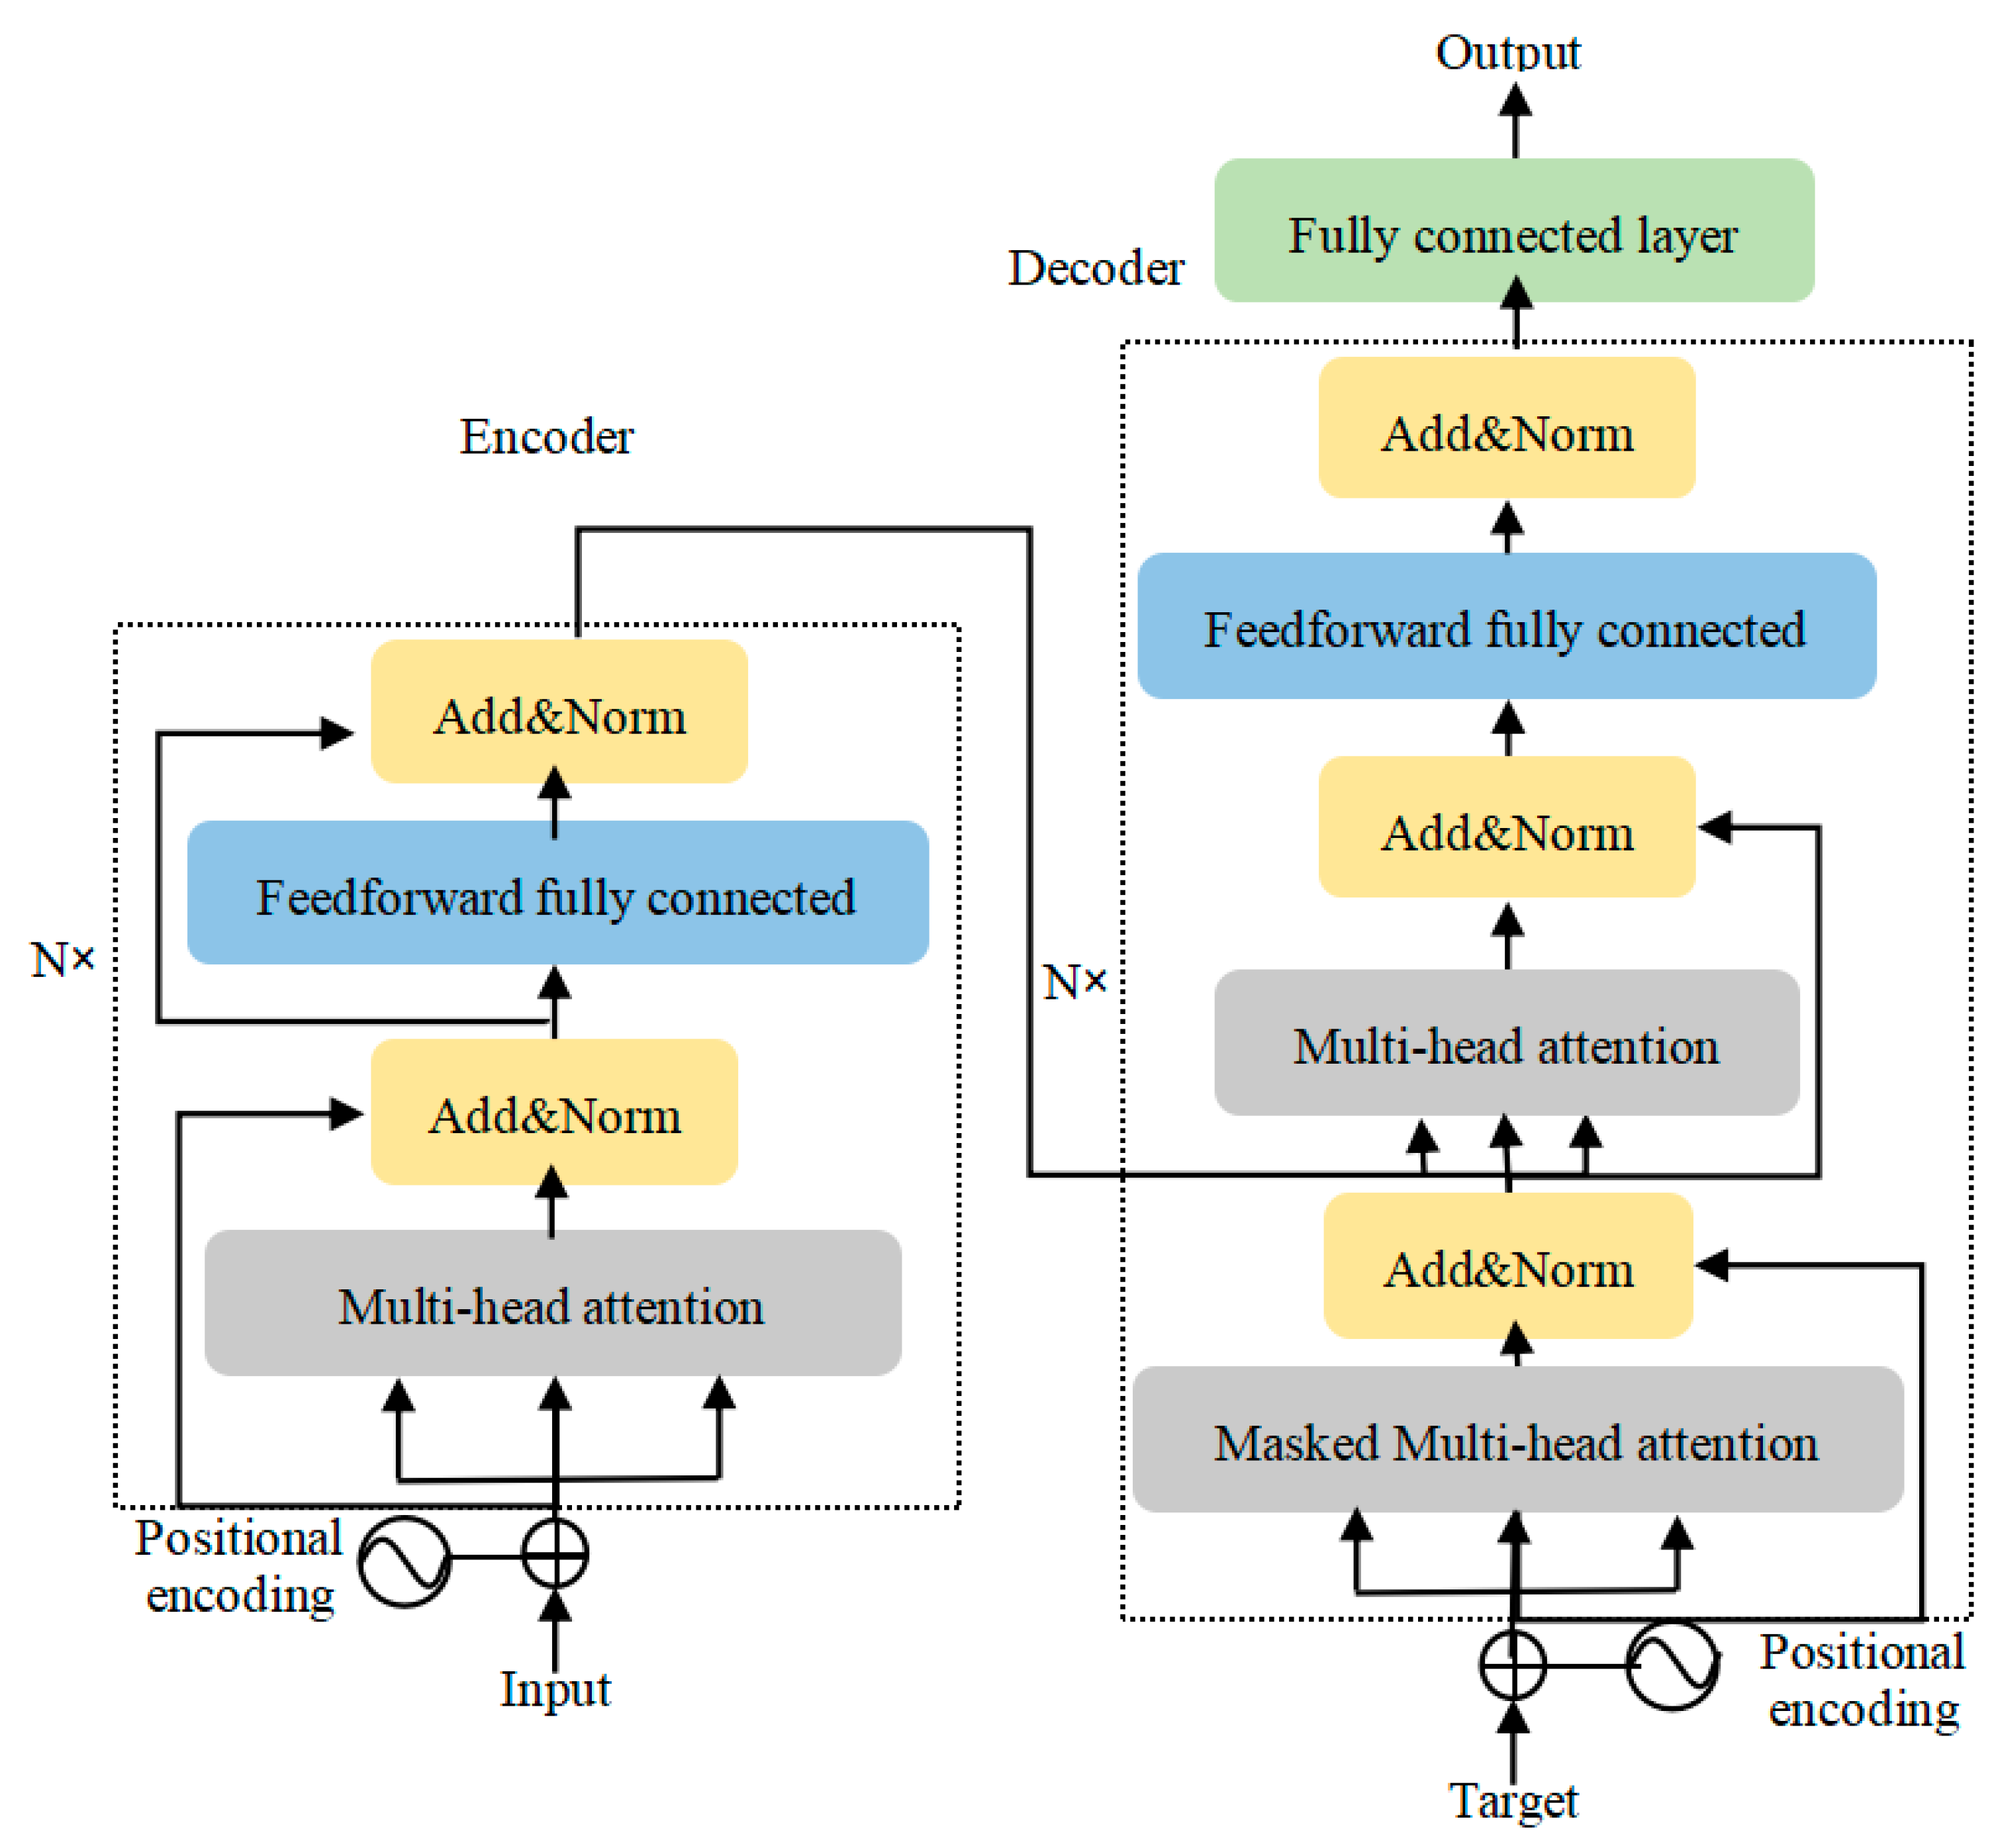
The transformer model is a state-of-the-art deep learning model. The self-attention mechanism is a key feature of this model, which allows the model to capture the dependence between any two positions in the sequence, not just between adjacent elements. The self-attention mechanism in its structure completely discards traditional RNN propagation in the horizontal direction, and propagates only in the vertical direction through the continuous superposition of self-attention layers [
15]. The attention mechanism can dynamically adjust the weight of input features, highlight the impact of important features, enhance the accuracy of model prediction, and has no impact on the calculation and storage capacity of the model. Therefore, the transformer model not only has good feature expression ability, but can also solve the problem that neural networks based on RNN structure will inevitably fall into long-term dependence. Lin et al. [
16] proposed an LSTM network model combining attention mechanism and verified the superiority of the algorithm after adding an attention mechanism on the public Oxford dataset and Massachusetts Institute of Technology (MIT) dataset.
Researchers have used denoising algorithms to preprocess data to reduce the effect of data acquisition error on model prediction performance. The battery degradation data can be regarded as a class of nonlinear, non-stationary time series data, which can be decomposed by a decomposition algorithm into feature components and noise with different time scales, so as to strip the noise [
17]. A singular spectrum analysis algorithm is a data processing algorithm that does not require complex prior information and is very suitable for the analysis and optimization of nonlinear time series data [
18].
In summary, a battery health status prediction model based on singular spectrum analysis and a transformer is proposed in this paper. On the one hand, the singular spectrum analysis algorithm is used to decompose and reorganize the features of the input prediction model, so as to remove the noise; on the other hand, a transformer network can capture key information to access the hidden correlations of degraded features, so as to improve prediction accuracy.
The contributions of this paper can be summarized as follows:
- (i)
Singular spectrum analysis is used to decompose and reconstruct the original capacity sequence to obtain the long-term trend components, so as to filter out the noise components in the series and improve the accuracy of model prediction.
- (ii)
The multi-head attention mechanism of the transformer model is used to capture the hidden correlation in the capacity sequence data, so as to achieve more accurate SOH prediction.
- (iii)
The versatility of the SSA Transformer method is verified by the effective prediction of various types of batteries.
The rest of this paper is organized as follows:
Section 2 introduces the relevant methods and principles.
Section 3 describes the structure and implementation steps of the proposed method in detail.
Section 4 compares and analyzes the specific experimental results.
Section 5 makes a summary and discusses some future work directions.
3. Prediction Model of Battery Health State Based on SSA Transformer
The battery health state prediction process based on SSA Transformer is shown in
Figure 2, with steps detailed below:
Step 1. Data preprocessing: the capacity sequence is decomposed and reconstructed based on singular spectrum analysis to reduce noise.
Step 2. Model training: the grey relational analysis (GRA) method is used to determine the appropriate input factors for the model, and then the training set is used for model training and optimization.
Step3. Model effect evaluation: the tuned model is used to predict the capacity sequence, and the error between the predicted value and real value is calculated to evaluate the effect.
3.1. Model Construction
In this paper, the deep learning toolbox of MatlabR2023b was used to build the transformer model. The overall structure of the model is shown in
Figure 3. The trend sequence of the capacity sequence was first extracted by SSA, then positional encoding was added and input into the self-attention layer of the transformer; then, a 1-D indexing layer extracts the data from the specified index of the time or spatial dimensions of the input data. Finally, the capacity at the next time is output through the full connection layer.
Since the capacity prediction is essentially regression rather than classification, the softmaxLayer of the traditional transformer structure is replaced by a regressionLayer. The general prediction steps can be divided into four steps:
Step 1. Take the battery capacity degradation data C(t) as the battery prediction parameter.
Step 2. The C(t) sequence is decomposed and reconstructed by the SSA algorithm, and the trend component of C(t) is decomposed according to Equations (2)–(4).
Step 3. The trend component is divided into a certain proportion of a training set and test set. This paper uses the first 40% of the dataset as the training set, and the last 60% as the test set.
Step 4. Put the test set into the trained transformer model to obtain the final battery health status prediction results.
3.2. Dataset Selection
In this paper, two publicly available lithium battery datasets are selected to train and validate the SSA Transformer health state prediction model proposed. One is the lithium battery public dataset published by the Center for Advanced Life Cycle Engineering (CALCE) of the University of Maryland, in which there are six groups of CS2 batteries, each group containing between one and four single battery samples. We choose the second group of CS2 battery cells CS2-35, CS2-36, and CS2-37 [
21]. The other is the public lithium battery dataset, from the National Aeronautics and Space Administration (NASA) Prognostics Center of Excellence (PCoE) Research Center [
22]. We selected the cells B0005, B0006, and B0007 of group 1.
The nominal capacity of the CS2-35, CS2-36, and CS2-37 cells in the CALCE dataset is 1.1 Ah. The charging and discharging process is as follows: when charging, the constant current is charged at a rate of 1, constant voltage charging when the battery voltage reaches 4.2 V, and stop charging when the cut-off current (50 mA) is reached; when discharging, discharge to a cut-off voltage of 2.7 V in a constant current mode. The above charge–discharge experiments were repeated until the lithium-ion battery reached the life threshold.
The nominal capacity of battery numbers B0005, B0006, and B0007 in the NASA dataset is 2 Ah, and the charge and discharge process is as follows: during the charging process, charge in a constant current mode of 1.5 A until the battery voltage reaches 4.2 V, and charge continues in a constant voltage mode until the charge current drops to 20 mA. During the discharge process, discharge with a constant current of 2 A until the battery voltage of the cells B0005, B0006, and B0007 drops to 2.7 V, 2.5 V, and 2.2 V, respectively.
3.3. Data Preprocessing and Data Correlation Analysis
In the whole process of battery capacity degradation, there will be local capacity regeneration phenomenon, a result of this being that the degradation curve does not monotonously decrease, and the degradation curve fluctuates greatly. Singular spectrum analysis is used to decompose and reconstruct the capacity data, so as to remove noise and reduce the volatility of degradation curve.
Figure 4 shows the comparison of the degradation curve of the battery before and after processing, and the fluctuation of the degradation curve of each battery is significantly smaller.
In order to evaluate the correlation between the sequence reconstructed by SSA and the original data, the Pearson correlation coefficient and grey relational analysis (GRA) were used for correlation analysis. Grey relational analysis is a method to quantitatively describe the degree of correlation between factors, which can reflect the consistency of the change trend of the two factors. The greater the absolute value of the Pearson correlation coefficient and grey correlation coefficient, the stronger the correlation between the two vectors [
23]. The correlation coefficients of different batteries are shown in
Table 1. The Pearson correlation coefficient and gray correlation coefficient of the original data and the data processed by SSA are greater than 0.8, indicating a strong correlation. The calculation formulas are such as Equations (15) and (16):
3.4. Model Evaluation Index
In order to verify the effectiveness of the available capacity estimation model of lithium batteries based on SSA Transformer developed in this paper, the experimental capacity observation values were compared with the predicted results. The root mean square error (RMSE) and mean absolute percentage error (MAPE), as shown in Equations (17) and (18), are used to evaluate the estimation results of the constructed model. The smaller the value, the higher the estimation accuracy.
4. Analysis of Experimental Results
In the experiment, the first 40% of the dataset was used as the training set, and the last 60% of the data as the test set, and compared with LSTM network and CNN methods. Regarding the LSTM and CNN model parameter settings: the number of iterations was 500, the number of hidden layers was 1, the number of neurons was 200, the initial learning rate was 0.001, using an Adam optimizer. Regarding the transformer network model parameter settings: The learning rate was set to 0.001, and epoch was set to 500; the head number of the self-attention mechanism was 8, the time window length was set to 30, and the step size was 1, and the average absolute error compiled as the loss function.
In order to more intuitively reflect the performance of the proposed model, comparative experiments were carried out on multiple groups of batteries from the NASA dataset and CALCE dataset. The comparison results are shown in
Table 2.
Figure 5a–c show the prediction effects of the four prediction models on batteries B0005, B0006, and B0007 in the NASA dataset, respectively, while
Figure 5d–f, respectively, show the prediction effects of the four prediction models on batteries CS2-35, CS2-36, and CS2-37 in the CALCE dataset.
By comparing the prediction results in
Figure 5 with the error values in
Table 2, it can be seen that the RMSE and MAPE of the SSA Transformer network model proposed in this paper for SOH prediction of different types of batteries are low. After the addition of the SSA method, in the NASA dataset, the SSA Transformer network model had the best prediction accuracy for the B0007 cell, with an RMSE and MAPE of 0.0106 Ah and 0.0072 Ah, respectively. Compared with the RMSE and MAPE of the original transformer model, they were increased by 0.0047 Ah and 0.0025 Ah, respectively; compared to the LSTM model, there were improvements of 0.0101 Ah and 0.0064 Ah, respectively, and compared with the CNN model, there were improvements of 0.0061 Ah and 0.0014 Ah, respectively. In the CALCE dataset, the SSA Transformer network model had the best prediction accuracy for all the CS2-35, CS2-36, and CS2-37 cells. Compared with the original transformer model, the RMSE and MAPE of the CS2-36 cell were improved by 0.0028 Ah and 0.0037 Ah, respectively. Compared with the LSTM model, were improved by 0.0238 Ah and 0.0307 Ah, respectively, and compared with the CNN model, were improved by 0.0226 Ah and 0.0277 Ah, respectively.
5. Conclusions
In this paper, a prediction model based on singular spectrum analysis and a transformer is proposed to predict the health status of lithium batteries. The long-term trend subsequence is obtained by singular spectrum decomposition and reconstruction of the battery historical capacity series, and then trained and predicted based on the transformer model. The following conclusions are drawn.
Compared with other deep learning algorithms, the transformer model based on a self-attention mechanism has more efficient feature extraction ability. The proposed method can reduce the impact of the battery capacity regeneration phenomenon on the prediction model to a certain extent, and further improve the accuracy of battery health state prediction. The SSA Transformer model proposed in this paper has strong versatility and can effectively predict a variety of different types of lithium batteries.
In future work, it is necessary to study the voltage, current, temperature and other related characteristics of battery charge and discharge, and evaluate the health state of the battery from the perspective of multiple factors and multiple characteristics, so as to further improve the accuracy of the prediction results.


