

Evaluating Visual Dependence in Postural Stability Using Smartphone and Stroboscopic Glasses


Abstract
1. Introduction
2. Materials and Methods
3. Results
4. Discussion
5. Conclusions
Author Contributions
Funding
Data Availability Statement
Acknowledgments
Conflicts of Interest
References
- Horak, F.B.; Macpherson, J.M. Postural Orientation and Equilibrium. In Comprehensive Physiology; Springer: Berlin/Heidelberg, Germany, 1996; pp. 255–292. [Google Scholar]
- Honeine, J.-L.; Schieppati, M. Time-interval for integration of stabilizing haptic and visual information in subjects balancing under static and dynamic conditions. Front. Syst. Neurosci. 2014, 8, 190. [Google Scholar] [CrossRef] [PubMed]
- Gao, Y.; Chen, L.; Yang, S.-N.; Wang, H.; Yao, J.; Dai, Q.; Chang, S. Contributions of Visuo-oculomotor Abilities to Interceptive Skills in Sports. Optom. Vis. Sci. 2015, 92, 679–689. [Google Scholar] [CrossRef] [PubMed]
- Laby, D.M.; Appelbaum, L.G. Review: Vision and On-field Performance: A Critical Review of Visual Assessment and Training Studies with Athletes. Optom. Vis. Sci. 2021, 98, 723–731. [Google Scholar] [CrossRef] [PubMed]
- Lee, H.; Han, S.; Hopkins, J.T. Altered Visual Reliance Induced by Stroboscopic Glasses during Postural Control. Int. J. Environ. Res. Public Health 2022, 19, 2076. [Google Scholar] [CrossRef] [PubMed]
- Song, K.; Burcal, C.J.; Hertel, J.A.Y.; Wikstrom, E.A. Increased Visual Use in Chronic Ankle Instability. Med. Sci. Sports Exerc. 2016, 48, 2046–2056. [Google Scholar] [CrossRef] [PubMed]
- Sahin-Uysal, H.; Ojeda Aravena, A.; Ulas, M.; Baez-San Martín, E.; Ramirez-Campillo, R. Validity, Reliability, and Sensitivity of Mobile Applications to Assess Change of Direction Speed. J. Hum. Kinet. 2023, 87, 217. [Google Scholar] [CrossRef] [PubMed]
- Caccese, J.B.; Santos, F.V.; Yamaguchi, F.K.; Buckley, T.A.; Jeka, J.J. Persistent Visual and Vestibular Impairments for Postural Control Following Concussion: A Cross-Sectional Study in University Students. Sports Med. 2021, 51, 2209–2220. [Google Scholar] [CrossRef] [PubMed]
- Danna-Dos-Santos, A.; Driusso, P.; Degani, A.M. Long-term effects of mTBIs includes a higher dependency on visual inputs to control vertical posture. Brain Inj. 2022, 37, 198–207. [Google Scholar] [CrossRef] [PubMed]
- Wilkins, L.; Appelbaum, L.G. An early review of stroboscopic visual training: Insights, challenges and accomplishments to guide future studies. Int. Rev. Sport Exerc. Psychol. 2019, 13, 65–80. [Google Scholar] [CrossRef]
- Appelbaum, L.G.; Erickson, G. Sports vision training: A review of the state-of-the-art in digital training techniques. Int. Rev. Sport Exerc. Psychol. 2016, 11, 160–189. [Google Scholar] [CrossRef]
- Kim, K.-M.; Kim, J.-S.; Grooms, D.R. Stroboscopic Vision to Induce Sensory Reweighting During Postural Control. J. Sport Rehabil. 2017, 26. [Google Scholar] [CrossRef]
- Jang, J.; Knarr, B.A.; Rosen, A.B.; Burcal, C.J. Visual reweighting using stroboscopic vision in healthy individuals. J. Kinesiol. Wellness 2022, 11, 1–11. [Google Scholar] [CrossRef]
- Nashner, L.; Berthoz, A. Visual contribution to rapid motor responses during postural control. Brain Res. 1978, 150, 403–407. [Google Scholar] [CrossRef]
- Assländer, L.; Hettich, G.; Mergner, T. Visual contribution to human standing balance during support surface tilts. Hum. Mov. Sci. 2015, 41, 147–164. [Google Scholar] [CrossRef]
- Pletcher, E.R.; Williams, V.J.; Abt, J.P.; Morgan, P.M.; Parr, J.J.; Wohleber, M.F.; Lovalekar, M.; Sell, T.C. Normative Data for the NeuroCom Sensory Organization Test in US Military Special Operations Forces. J. Athl. Train 2017, 52, 129–136. [Google Scholar] [CrossRef] [PubMed]
- Heick, J.D.; Alkathiry, A. Impact of Concussions on Postural Stability Performance Using the Head Shake-Sensory Organization Test. Int. J. Sports Phys. Ther. 2024, 19, 1454. [Google Scholar] [CrossRef]
- Mucha, A.; Collins, M.W.; Elbin, R.J.; Furman, J.M.; Troutman-Enseki, C.; DeWolf, R.M.; Marchetti, G.; Kontos, A.P. A Brief Vestibular/Ocular Motor Screening (VOMS) Assessment to Evaluate Concussions. Am. J. Sports Med. 2014, 42, 2479–2486. [Google Scholar] [CrossRef] [PubMed]
- Kim, K.-M.; Kim, J.-S.; Oh, J.; Grooms, D.R. Stroboscopic Vision as a Dynamic Sensory Reweighting Alternative to the Sensory Organization Test. J. Sport Rehabil. 2021, 30, 166–172. [Google Scholar] [CrossRef]
- Soangra, R.; Lockhart, T. Smartphone-Based Prediction Model for Postoperative Cardiac Surgery Outcomes Using Preoperative Gait and Posture Measures. Sensors 2021, 21, 1704. [Google Scholar] [CrossRef]
- Pollind, M.L.; Soangra, R. Mini-Logger-A Wearable Inertial Measurement Unit (IMU) for Postural Sway Analysis. In Proceedings of the 2020 42nd Annual International Conference of the IEEE Engineering in Medicine & Biology Society (EMBC), Montreal, QC, Canada, 20–24 July 2020; pp. 4600–4603. [Google Scholar]
- Pollind, M.; Soangra, R. Development and Validation of Wearable Inertial Sensor System for Postural Sway Analysis. Measurement 2020, 165, 108101. [Google Scholar] [CrossRef]
- Soangra, R.; Lockhart, T.E. Inertial Sensor-Based Variables Are Indicators of Frailty and Adverse Post-Operative Outcomes in Cardiovascular Disease Patients. Sensors 2018, 18, 1792. [Google Scholar] [CrossRef] [PubMed]
- Soangra, R.; Lockhart, T.E. Agreement in gait speed from smartphone and stopwatch for five meter walk in laboratory and clinical environments. BioMed Sci. Instrum. 2014, 50, 254–264. [Google Scholar] [PubMed]
- Harper, B.A.; Shiraisshi, M.; Soangra, R. Investigating Agreement and Reliability of Mobile Health App for Continuous Walking on a Figure-Eight Path with Periodic Vision Interruptions. In Proceedings of the 2023 International Conference on Next Generation Electronics (NEleX), Tamil Nadu, India, 14–16 December 2023; pp. 1–5. [Google Scholar]
- Mayagoitia, R.E.; Lotters, J.C.; Veltink, P.H.; Hermens, H. Standing balance evaluation using a triaxial accelerometer. Gait Posture 2002, 16, 55–59. [Google Scholar] [CrossRef] [PubMed]
- Broglio, S.P.; Guskiewicz, K.M. Concussion in sports: The sideline assessment. Sports Health 2009, 1, 361–369. [Google Scholar] [CrossRef] [PubMed]
- McCrea, M.; Barr, W.B.; Guskiewicz, K.; Randolph, C.; Marshall, S.W.; Cantu, R.; Onate, J.A.; Kelly, J.P. Standard regression-based methods for measuring recovery after sport-related concussion. J. Int. Neuropsychol. Soc. 2005, 11, 58–69. [Google Scholar] [CrossRef] [PubMed]
- McCrea, M.; Hammeke, T.; Olsen, G.; Leo, P.; Guskiewicz, K. Unreported Concussion in High School Football Players. Clin. J. Sport Med. 2004, 14, 13–17. [Google Scholar] [CrossRef] [PubMed]
- Massingale, S.; Alexander, A.; Erickson, S.; McQueary, E.; Gerkin, R.; Kisana, H.; Silvestri, B.; Schodrof, S.; Nalepa, B.; Pardini, J. Comparison of Uninjured and Concussed Adolescent Athletes on the Concussion Balance Test (COBALT). J. Neurol. Phys. Ther. 2018, 42, 149–154. [Google Scholar] [CrossRef] [PubMed]
- Furman, J.M. Posturography: Uses and limitations. Baillieres Clin. Neurol. 1994, 3, 501–513. [Google Scholar]
- Lacour, M.; Barthelemy, J.; Borel, L.; Magnan, J.; Xerri, C.; Chays, A.; Ouaknine, M. Sensory strategies in human postural control before and after unilateral vestibular neurotomy. Exp. Brain Res. 1997, 115, 300–310. [Google Scholar] [CrossRef]
- Isableu, B.; Ohlmann, T.; Crémieux, J.; Amblard, B. Differential approach to strategies of segmental stabilisation in postural control. Exp. Brain Res. 2003, 150, 208–221. [Google Scholar] [CrossRef]
- Tjernström, F.; Björklund, M.; Malmström, E.-M. Romberg ratio in quiet stance posturography—Test to retest reliability. Gait Posture 2015, 42, 27–31. [Google Scholar] [CrossRef] [PubMed]
- Kontos, A.P.; Elbin, R.J.; Schatz, P.; Covassin, T.; Henry, L.; Pardini, J.; Collins, M.W. A Revised Factor Structure for the Post-Concussion Symptom Scale. Am. J. Sports Med. 2012, 40, 2375–2384. [Google Scholar] [CrossRef] [PubMed]
- Wallace, B.; Lifshitz, J. Traumatic brain injury and vestibulo-ocular function: Current challenges and future prospects. Eye Brain 2016, 8, 153–164. [Google Scholar] [CrossRef] [PubMed]
- Miner, D.; Harper, B.A.; Glass, S.; Martin, B.; Polizotto, M.; Hearl, S.M.; Turner, E.; Brunelli, S. Test-Retest Reliability of Postural Control Assessment on Biodex BioSwayTM. BioMed Res. Int. 2022, 2022, 7959830. [Google Scholar] [CrossRef]
- Miner, D.G.; Harper, B.A.; Glass, S.M. Validity of Postural Sway Assessment on the Biodex BioSway™ Compared With the NeuroCom Smart Equitest. J. Sport Rehabil. 2021, 30, 516–520. [Google Scholar] [CrossRef]


| Measure | Description | Formula |
|---|---|---|
| Sway AP | The range of CoP movement in the anterior-posterior direction | |
| Sway ML | The range of CoP movement in the medial lateral direction | |
| Sway Path | The trajectory of the resultant CoP sway in the anterior-posterior and medial-lateral directions. Or path of resultant COP. | |
| Sway Velocity | The average speed of CoP sway | |
| Sway Area | The area of smallest ellipse that encompasses 95% of the CoP sway | |
| Turn Index | ||
| RMS AP | Root mean square of CoP in the anterior-posterior direction | |
| RMS ML | Root mean square of CoP in the medial-lateral direction | |
| MPF AP | The median power frequency of the anterior-posterior CoP, calculated by using Welch’s averaged periodogram method. | |
| MPF ML | The median power frequency of the medial-lateral CoP, calculated by using Welch’s averaged periodogram method. | |
| F50 AP | The median frequency of 50% power spectrum density in the anterior-posterior CoP | |
| F50 ML | The median frequency of 50% power spectrum density in the medial-lateral CoP | |
| F95 AP | The median frequency of 95% power spectrum density in the anterior-posterior CoP | |
| F95 ML | The median frequency of 95% power spectrum density in the medial-lateral CoP | |
| Fpeak_AP | Frequency with maximum power in the anterior-posterior direction | |
| FPeak_ML | Frequency with maximum power in the medial-lateral direction | |
| FD | The dominant frequency in the frequency spectrum with maximum power |
| Force plate | Smartphone | |||||
|---|---|---|---|---|---|---|
| EC | EO | Strobe | EC | EO | Strobe | |
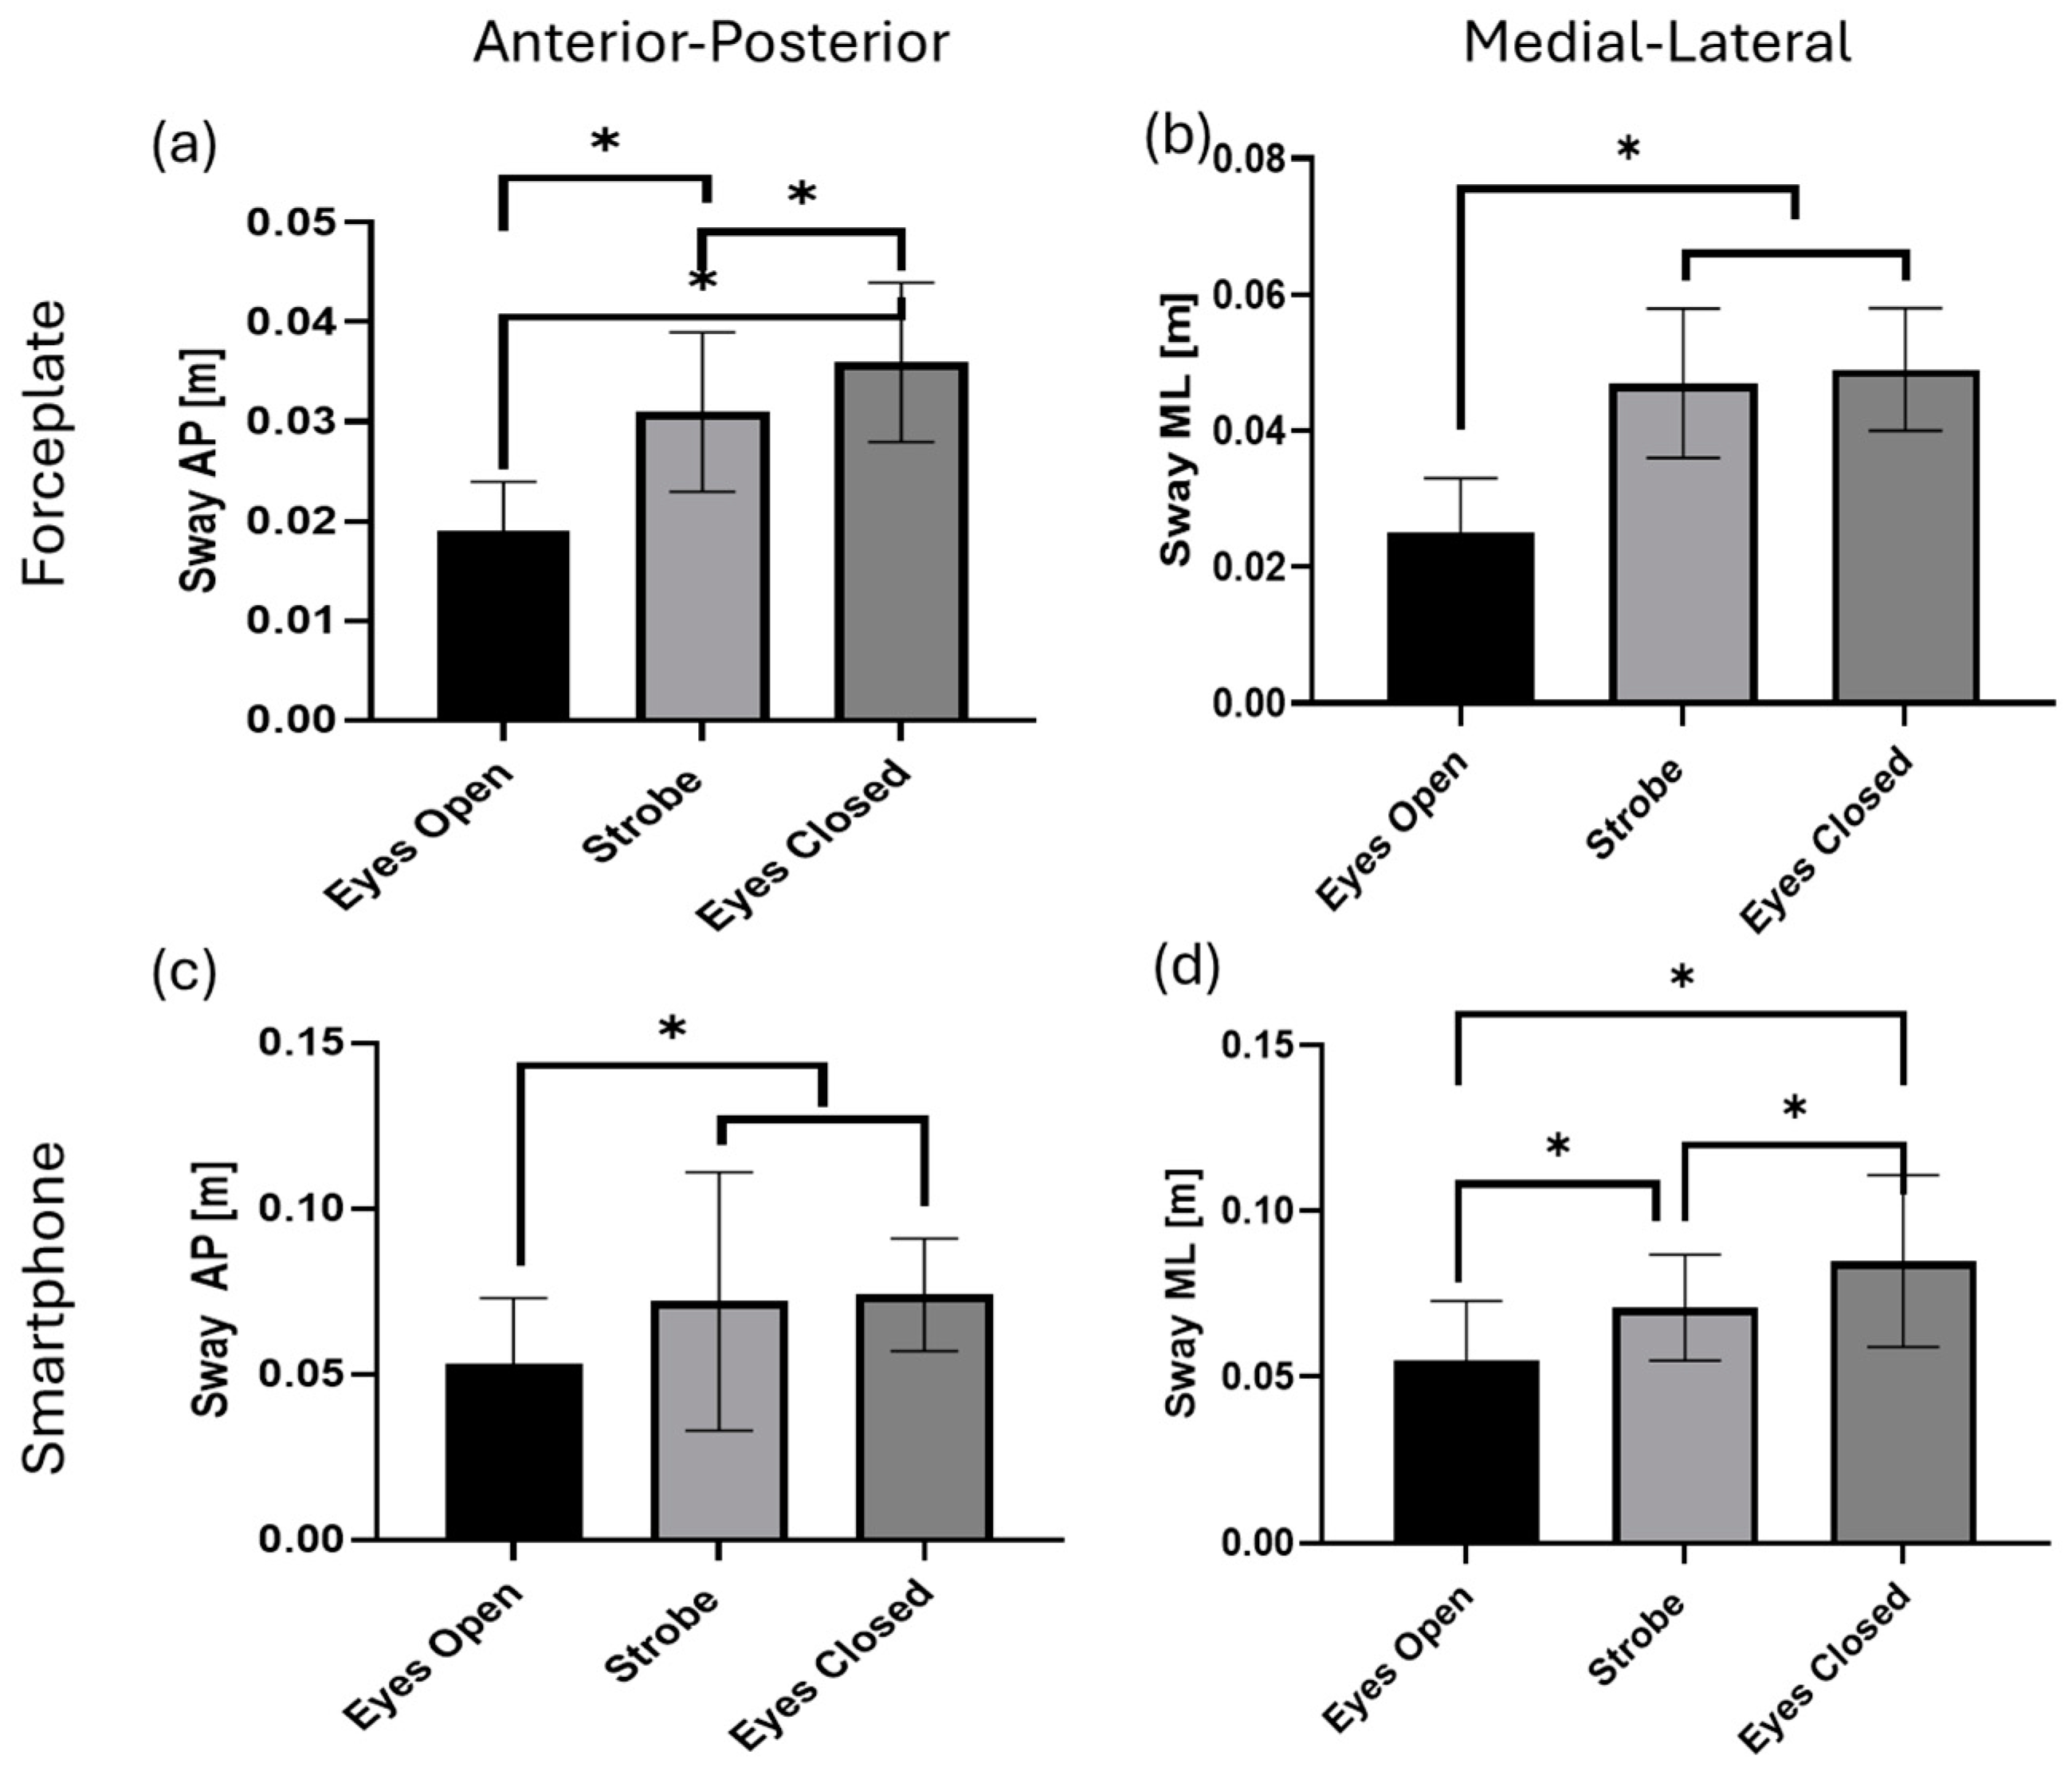
| Sway AP [m] | 0.0363 ± 0.008 | 0.0193 ± 0.0052 | 0.031 ± 0.0081 | 0.0742 ± 0.0166 | 0.0534 ± 0.0205 | 0.0719 ± 0.039 |
| Sway ML [m] | 0.0494 ± 0.0091 | 0.0248 ± 0.0077 | 0.0472 ± 0.0113 | 0.0851 ± 0.0262 | 0.0545 ± 0.0176 | 0.0712 ± 0.0156 |
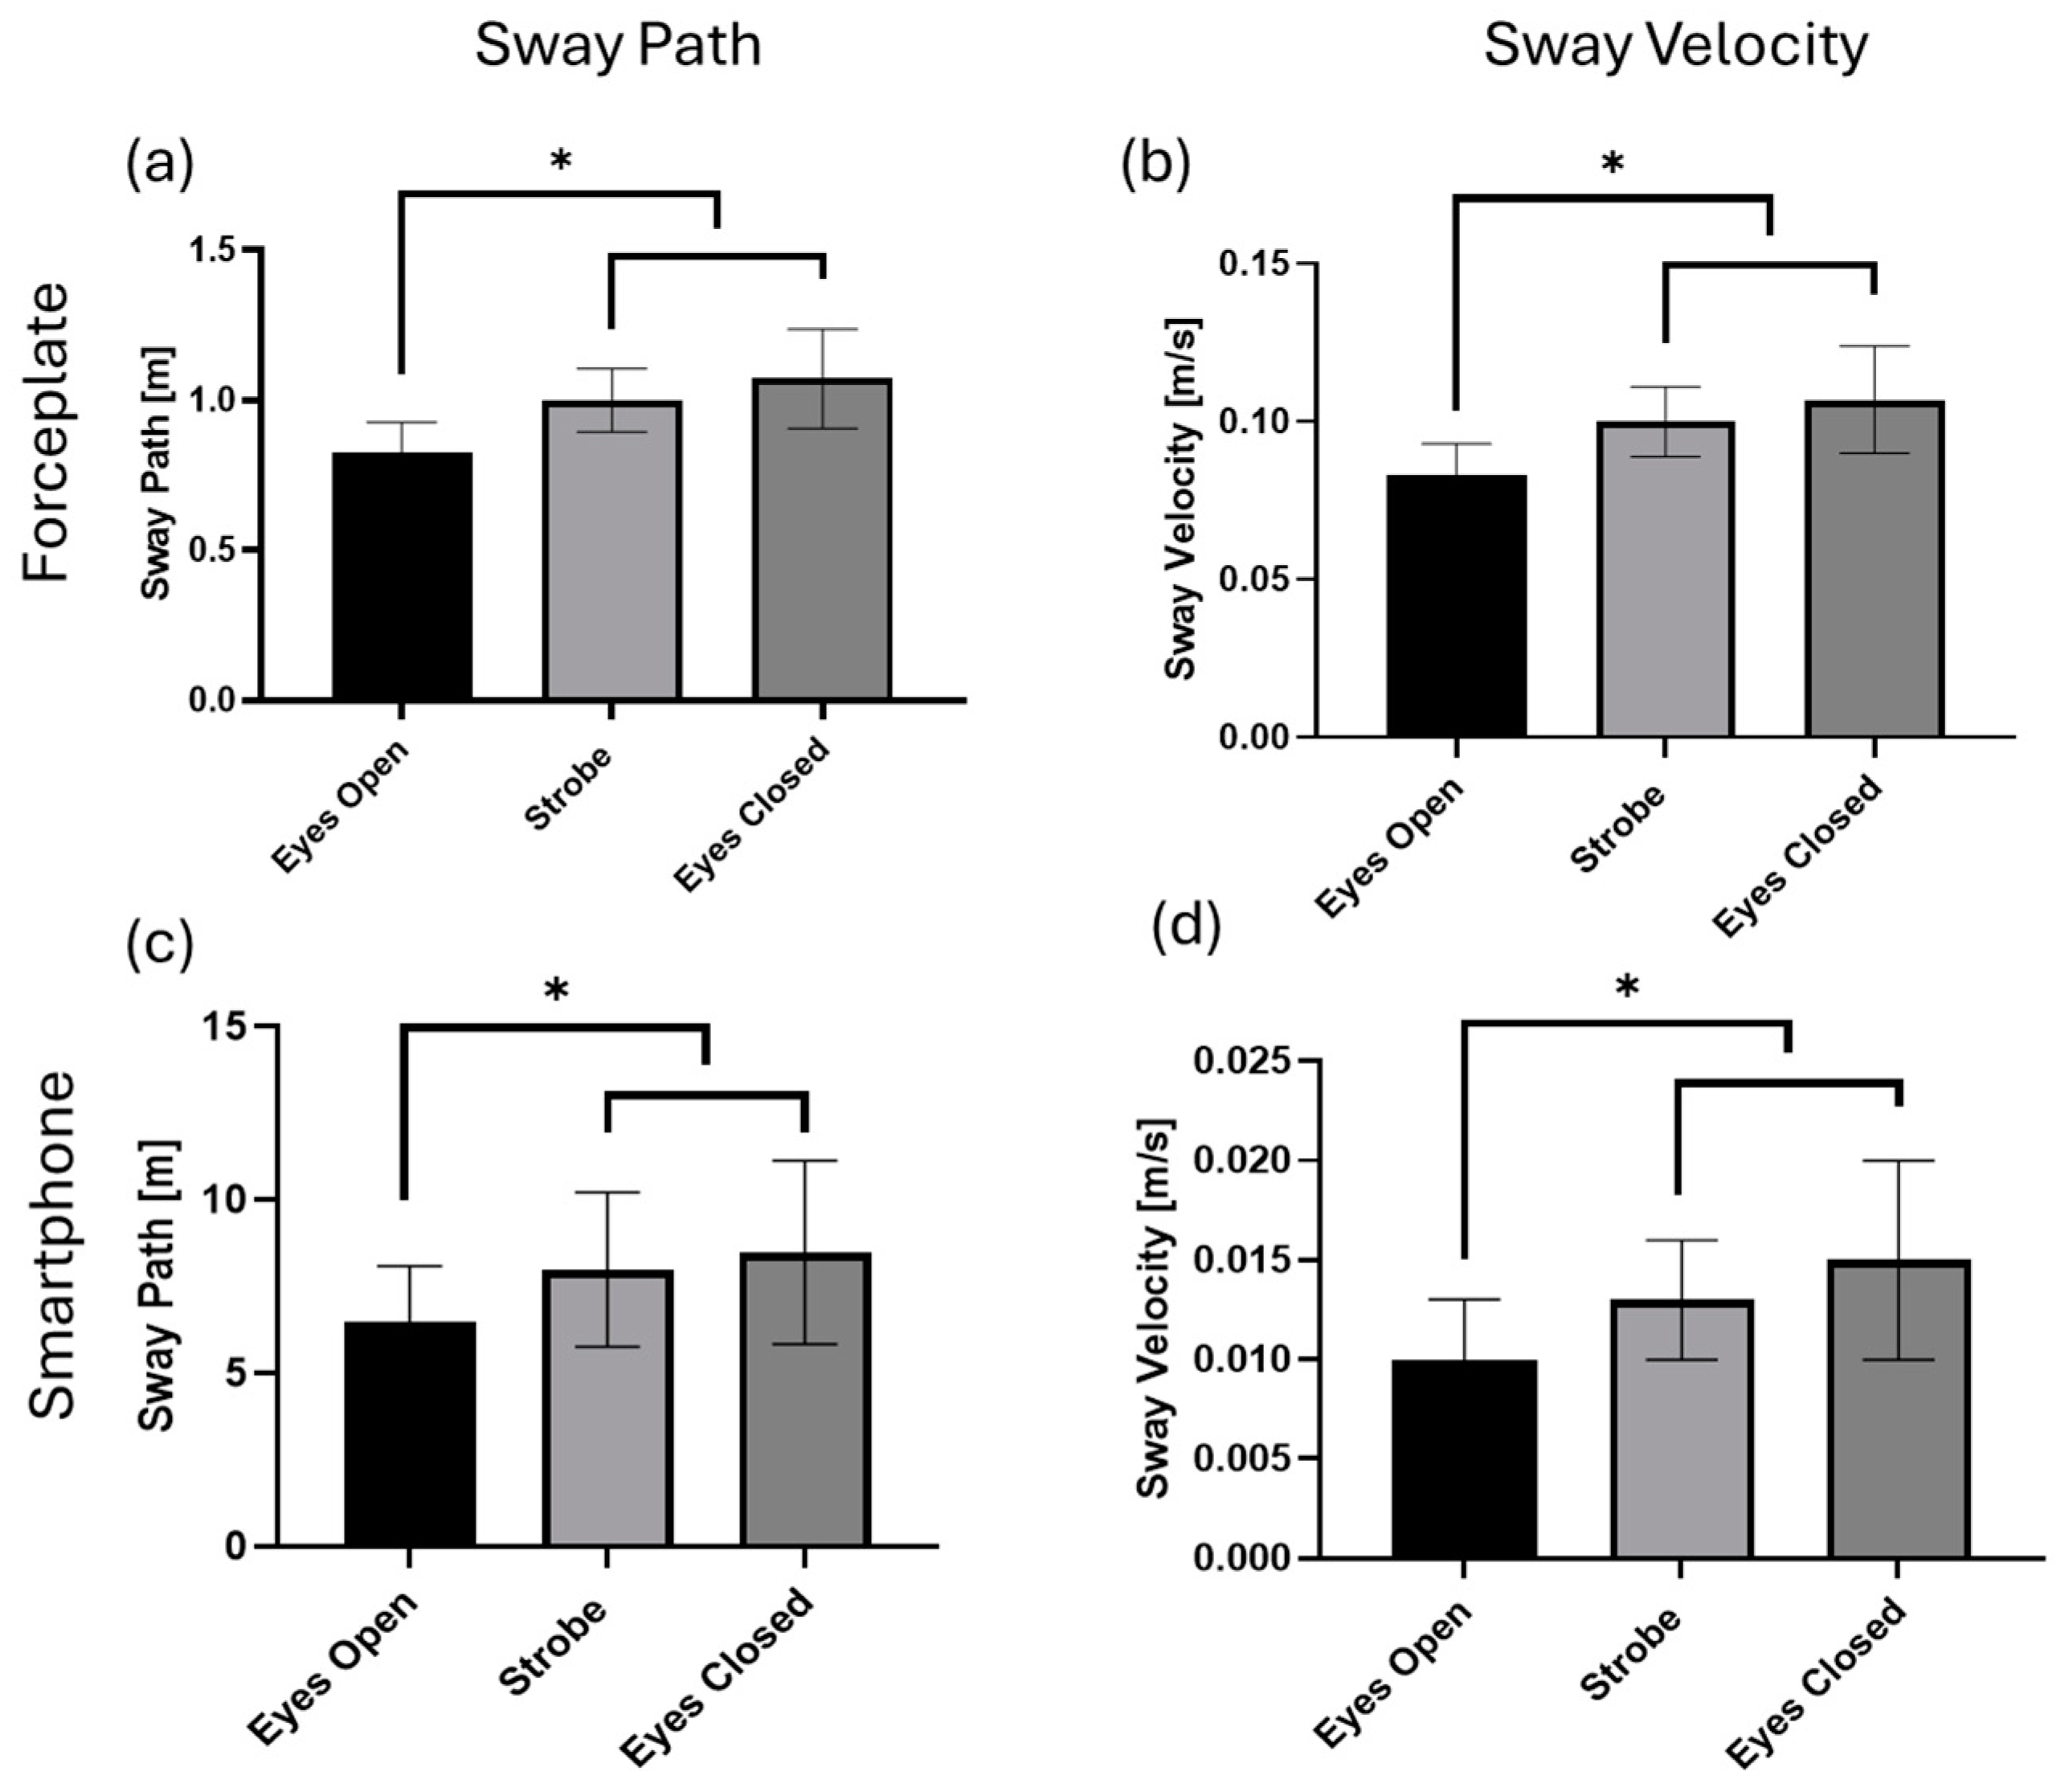
| Sway Path [m] | 1.0723 ± 0.1653 | 0.8257 ± 0.101 | 0.9998 ± 0.1056 | 8.4936 ± 2.6438 | 6.4762 ± 1.6354 | 7.9953 ± 2.2316 |
| Sway Velocity [m/s2] | 0.1072 ± 0.0165 | 0.0826 ± 0.0101 | 0.1 ± 0.0106 | 0.0149 ± 0.0051 | 0.0096 ± 0.0027 | 0.0128 ± 0.003 |
| Sway Area [m2] | 0.0012 ± 0.0004 | 0.0004 ± 0.0002 | 0.0011 ± 0.0005 | 0.0026 ± 0.0014 | 0.0011 ± 0.0005 | 0.0021 ± 0.0009 |
| Turn Index | 136.71 ± 28.423 | 207.3 ± 55.078 | 141.62 ± 29.815 | 780.47 ± 222.02 | 904.44 ± 250.86 | 808.24 ± 233.28 |
| RMS AP [m] | 0.0071 ± 0.0014 | 0.004 ± 0.0015 | 0.0062 ± 0.0016 | 0.0103 ± 0.0022 | 0.0068 ± 0.0017 | 0.0094 ± 0.0025 |
| RMS ML [m] | 0.0097 ± 0.0024 | 0.0051 ± 0.0016 | 0.0096 ± 0.0028 | 0.0137 ± 0.0062 | 0.0089 ± 0.0034 | 0.0117 ± 0.0031 |
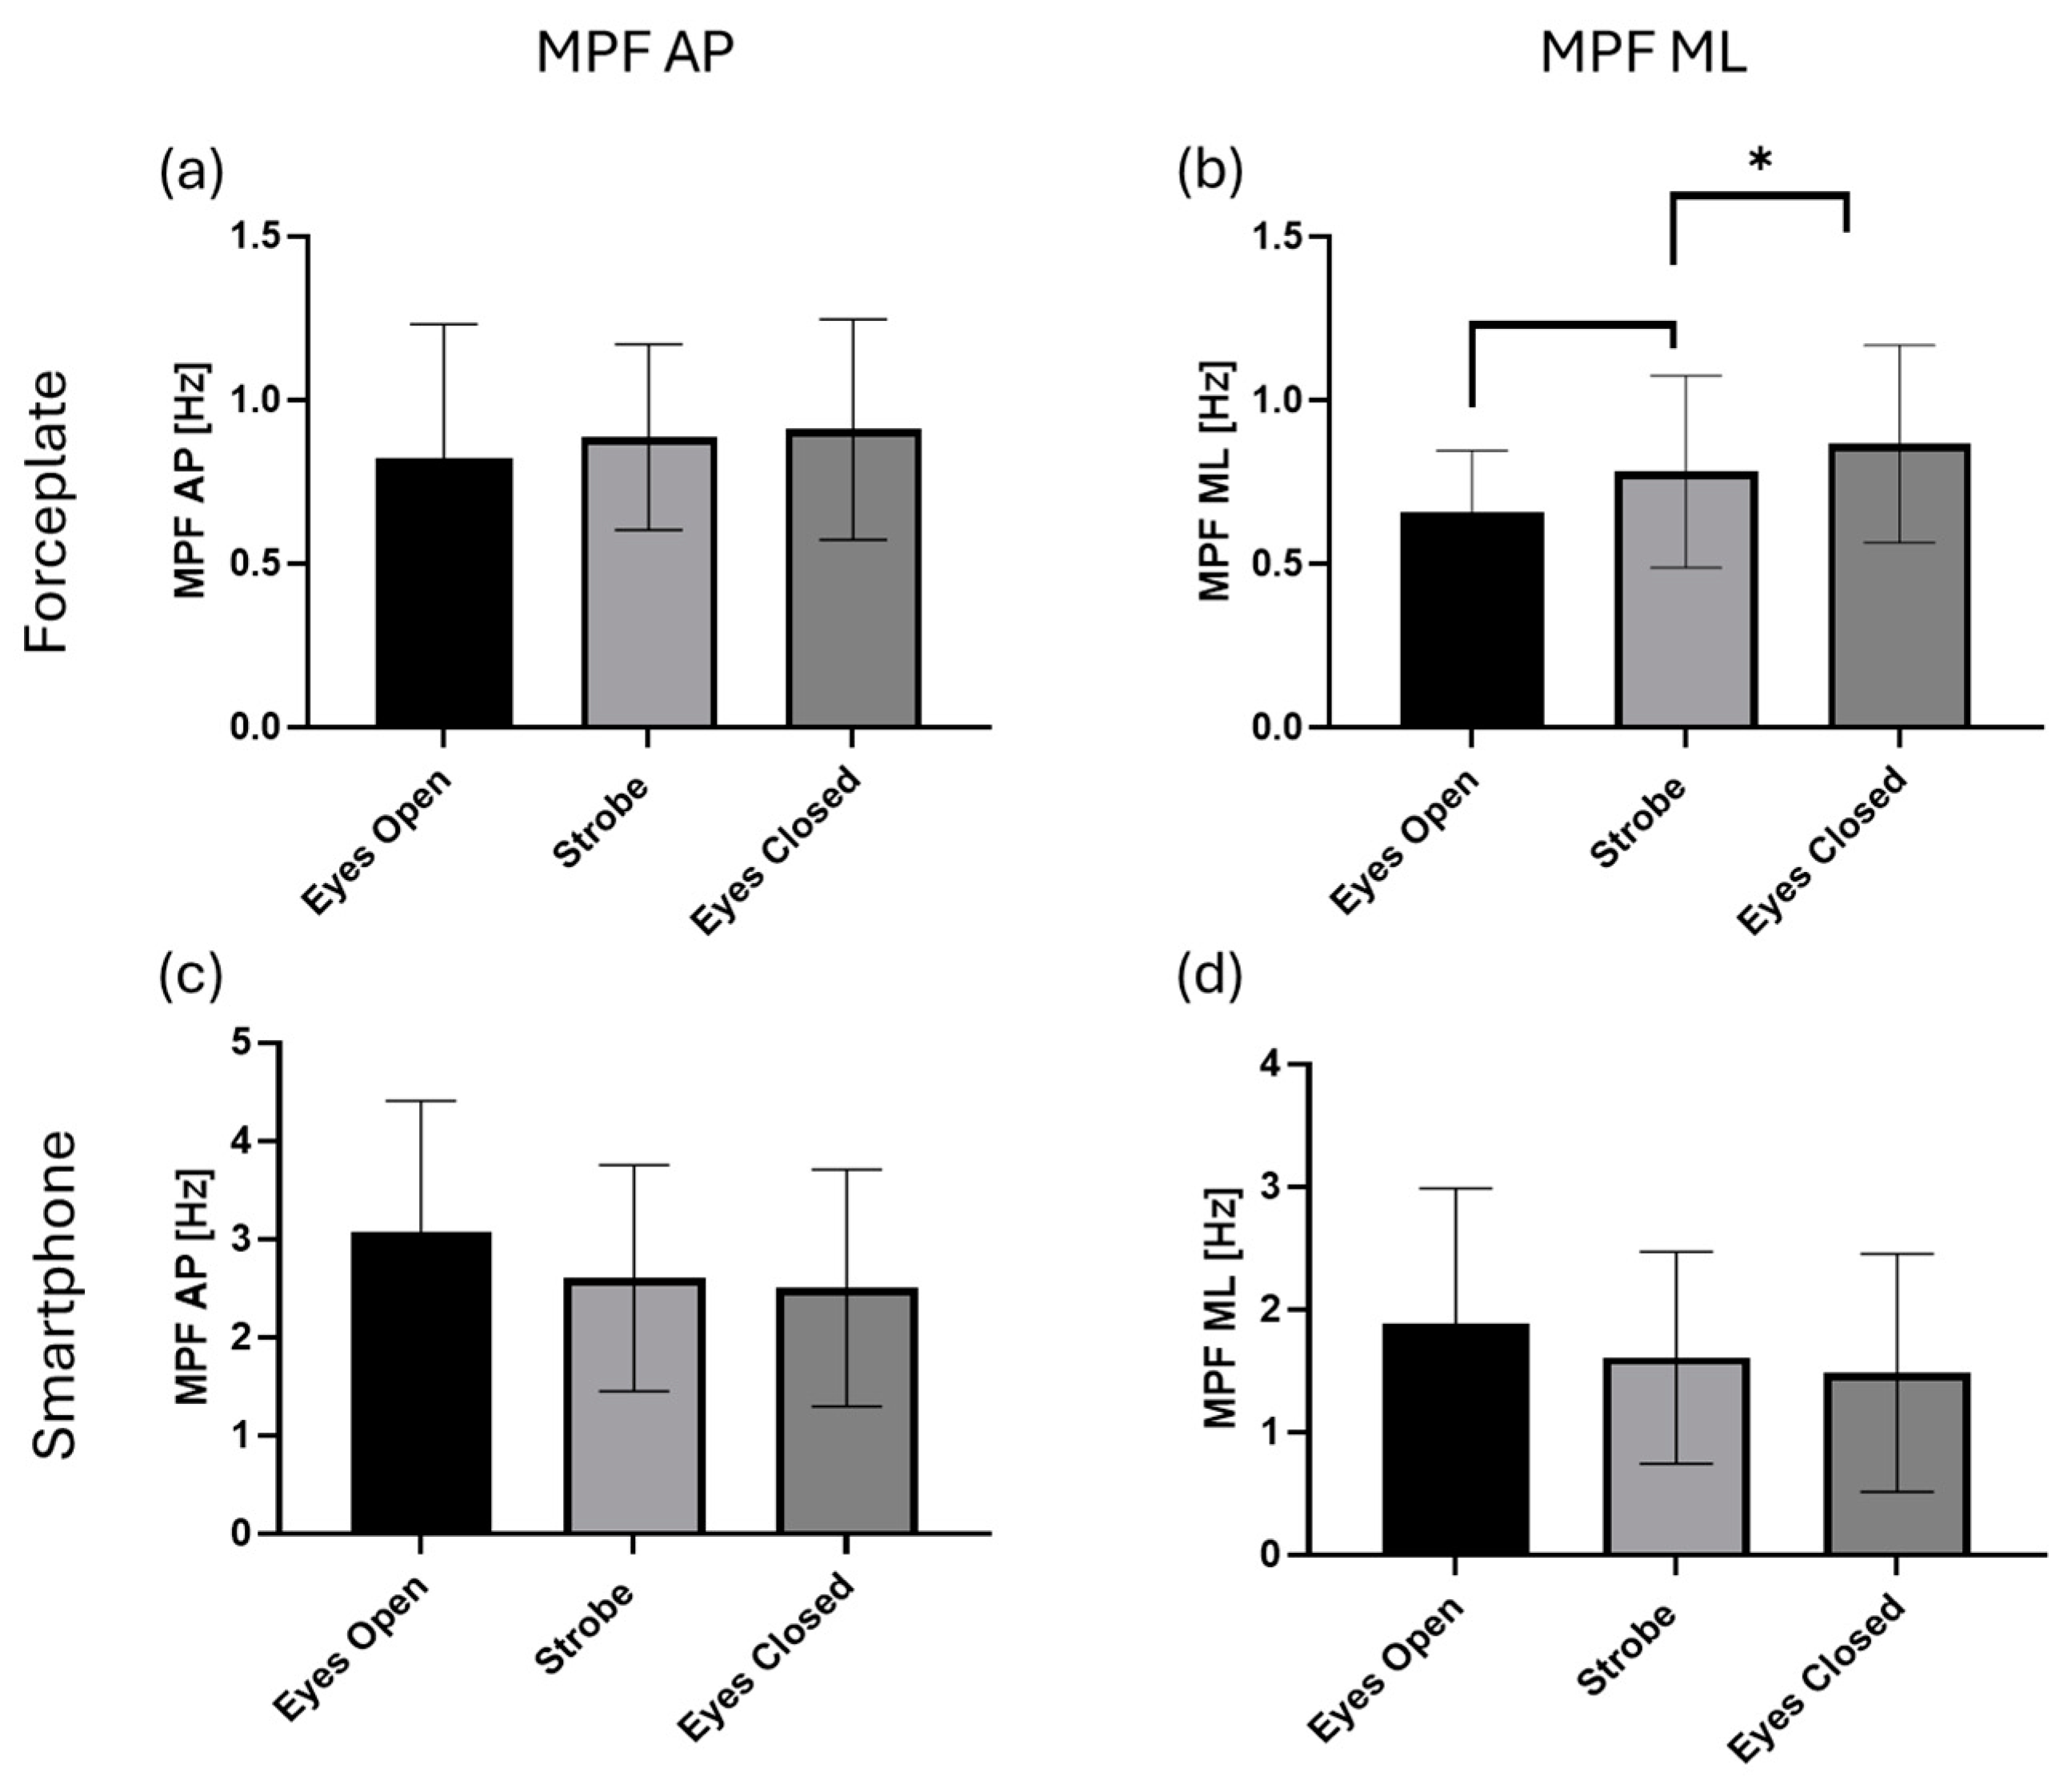
| MPF AP [Hz] | 0.9087 ± 0.3373 | 0.8209 ± 0.4092 | 0.8862 ± 0.2835 | 2.5007 ± 1.2067 | 3.0677 ± 1.3377 | 2.5996 ± 1.1519 |
| MPF ML [Hz] | 0.8661 ± 0.3018 | 0.6574 ± 0.1885 | 0.7806 ± 0.2927 | 1.4827 ± 0.9675 | 1.8855 ± 1.0997 | 1.6062 ± 0.8632 |
| F50 AP [Hz] | 0.7748 ± 0.3299 | 0.7082 ± 0.4825 | 0.7748 ± 0.3299 | 1.0476 ± 1.2431 | 0.9741 ± 1.2321 | 0.8162 ± 0.8161 |
| F50 ML [Hz] | 0.7248 ± 0.3577 | 0.5249 ± 0.1539 | 0.6999 ± 0.3175 | 0.2858 ± 0.1762 | 0.2585 ± 0.2182 | 0.2776 ± 0.1406 |
| F95 AP [Hz] | 2.4827 ± 0.7074 | 2.3077 ± 0.7975 | 2.4245 ± 0.6305 | 10.103 ± 2.5289 | 12.059 ± 3.1484 | 10.483 ± 2.4206 |
| F95 ML [Hz] | 2.5827 ± 0.556 | 2.0828 ± 0.5238 | 2.1662 ± 0.4114 | 7.9634 ± 5.0773 | 10.567 ± 4.8295 | 9.0345 ± 4.3526 |
| Fpeak AP [Hz] | 0.3249 ± 0.3325 | 0.4832 ± 0.5805 | 0.4082 ± 0.3462 | 0.1307 ± 0.168 | 0.1225 ± 0.2329 | 0.1905 ± 0.1774 |
| FPeak ML [Hz] | 0.3666 ± 0.3157 | 0.2249 ± 0.1799 | 0.4666 ± 0.4028 | 0.0953 ± 0.0816 | 0.098 ± 0.0963 | 0.1088 ± 0.0875 |
| FD [Hz] | 0.9756 ± 0.0099 | 0.9925 ± 0.0046 | 0.9794 ± 0.0069 | 0.9659 ± 0.0132 | 0.9634 ± 0.0143 | 0.9629 ± 0.0117 |
| Force plate | Smartphone | |||
|---|---|---|---|---|
| VMS EO | VMS Strobe | VMS EO | VMS Strobe | |
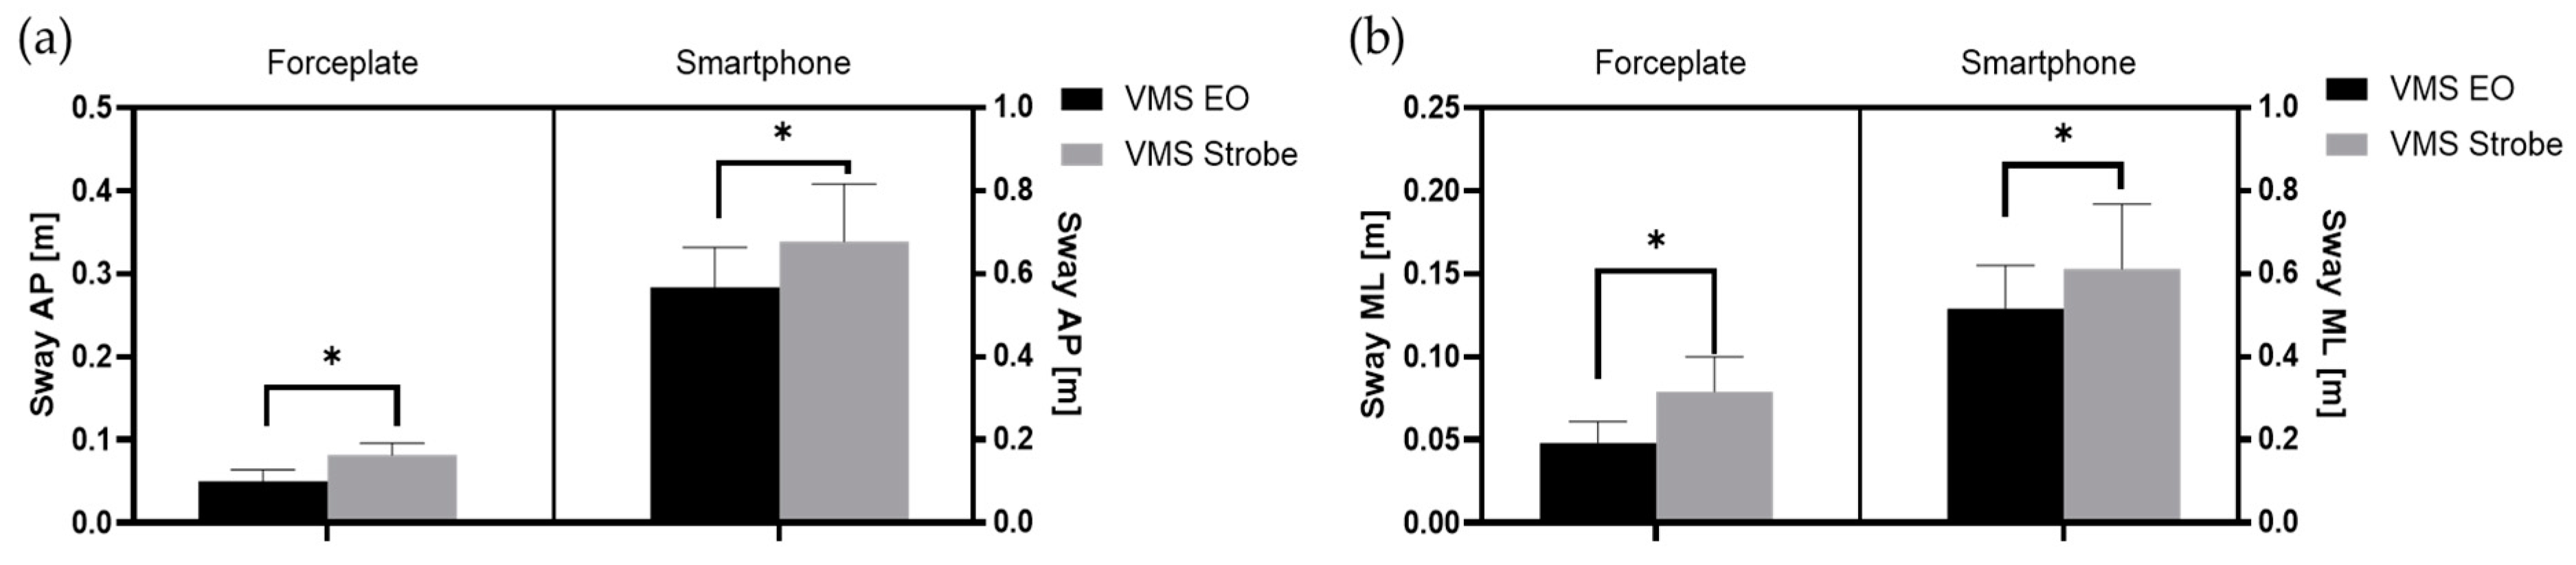
| Sway AP [m] | 0.0501 ± 0.0144 | 0.0816 ± 0.0137 | 0.2843 ± 0.0478 | 0.3393 ± 0.0693 |
| Sway ML [m] | 0.0481 ± 0.0125 | 0.0787 ± 0.0207 | 0.1288 ± 0.0264 | 0.1533 ± 0.0394 |
| Sway Path [m] | 1.2484 ± 0.2483 | 1.804 ± 0.338 | 20.176 ± 5.1712 | 26.018 ± 7.4693 |
| Sway Velocity [m/s2] | 0.1248 ± 0.0248 | 0.1804 ± 0.0338 | 0.0608 ± 0.0112 | 0.0641 ± 0.0141 |
| Sway Area [m2] | 0.0019 ± 0.001 | 0.0045 ± 0.0017 | 0.0245 ± 0.0082 | 0.0303 ± 0.0125 |
| Turn Index | 130.58 ± 18.199 | 117.35 ± 15.652 | 646.83 ± 189.34 | 733.48 ± 204.9 |
| RMS AP [m] | 0.01 ± 0.0029 | 0.0162 ± 0.0028 | 0.0638 ± 0.0106 | 0.0686 ± 0.0146 |
| RMS ML [m] | 0.0097 ± 0.0028 | 0.0149 ± 0.0035 | 0.0211 ± 0.0051 | 0.0235 ± 0.0053 |
| MPF AP [Hz] | 1.034 ± 0.2083 | 1.0042 ± 0.2193 | 0.7245 ± 0.2049 | 0.8697 ± 0.2923 |
| MPF ML [Hz] | 0.7776 ± 0.2177 | 0.9554 ± 0.2276 | 2.3554 ± 1.0812 | 2.5878 ± 0.9779 |
| F50 AP [Hz] | 0.8498 ± 0.1474 | 0.8665 ± 0.218 | 0.3974 ± 0.0267 | 0.3865 ± 0.0267 |
| F50 ML [Hz] | 0.6165 ± 0.1551 | 0.7665 ± 0.268 | 0.6342 ± 0.1028 | 0.626 ± 0.161 |
| F95 AP [Hz] | 3.1159 ± 0.7731 | 2.9243 ± 0.664 | 2.8196 ± 2.0994 | 4.142 ± 2.6235 |
| F95 ML [Hz] | 2.3744 ± 0.7626 | 2.8993 ± 0.6619 | 11.708 ± 5.3354 | 12.801 ± 4.6647 |
| Fpeak AP [Hz] | 0.4666 ± 0.2548 | 0.5665 ± 0.436 | 0.3266 ± 0.0003 | 0.3239 ± 0.0134 |
| FPeak ML [Hz] | 0.3416 ± 0.1998 | 0.4666 ± 0.337 | 0.4518 ± 0.2757 | 0.4545 ± 0.2595 |
| FD [Hz] | 0.9698 ± 0.0106 | 0.9536 ± 0.0099 | 0.9687 ± 0.0079 | 0.9654 ± 0.0072 |
Disclaimer/Publisher’s Note: The statements, opinions and data contained in all publications are solely those of the individual author(s) and contributor(s) and not of MDPI and/or the editor(s). MDPI and/or the editor(s) disclaim responsibility for any injury to people or property resulting from any ideas, methods, instructions or products referred to in the content. |
© 2024 by the authors. Licensee MDPI, Basel, Switzerland. This article is an open access article distributed under the terms and conditions of the Creative Commons Attribution (CC BY) license (https://creativecommons.org/licenses/by/4.0/).
Share and Cite
Harper, B.A.; Shiraishi, M.; Soangra, R. Evaluating Visual Dependence in Postural Stability Using Smartphone and Stroboscopic Glasses. Electronics 2024, 13, 2166. https://doi.org/10.3390/electronics13112166
Harper BA, Shiraishi M, Soangra R. Evaluating Visual Dependence in Postural Stability Using Smartphone and Stroboscopic Glasses. Electronics. 2024; 13(11):2166. https://doi.org/10.3390/electronics13112166
Chicago/Turabian StyleHarper, Brent A., Michael Shiraishi, and Rahul Soangra. 2024. "Evaluating Visual Dependence in Postural Stability Using Smartphone and Stroboscopic Glasses" Electronics 13, no. 11: 2166. https://doi.org/10.3390/electronics13112166
APA StyleHarper, B. A., Shiraishi, M., & Soangra, R. (2024). Evaluating Visual Dependence in Postural Stability Using Smartphone and Stroboscopic Glasses. Electronics, 13(11), 2166. https://doi.org/10.3390/electronics13112166