Article

A Novel Water Level Control System for Sustainable Aquarium Use

1
College of Engineering, Science and Environment, University of Newcastle, Callaghan, NSW 2308, Australia
2
Engineering Cluster, Singapore Institute of Technology, Singapore 138683, Singapore
*
Author to whom correspondence should be addressed.
Electronics 2024, 13(11), 2033; https://doi.org/10.3390/electronics13112033
Submission received: 3 April 2024 / Revised: 6 May 2024 / Accepted: 22 May 2024 / Published: 23 May 2024
(This article belongs to the Section Circuit and Signal Processing)

Abstract

:
The advent of Internet of Things (IoT) technology has paved the way for innovative solutions in various domains, including aquarium maintenance. An IoT-based automated water changing system emerges as a promising solution to ensure a clean and healthy environment for aquarium inhabitants, thereby alleviating basic chores, particularly for aquarium hobbyists. Conventional solutions often fall short in reliability and affordability, merely focusing on water replacement without addressing other crucial factors. In contrast, this novel system integrates cutting-edge features, leveraging wireless monitoring facilitated by Home Assistant and incorporating water seasoning capabilities. Unlike existing systems, which lack comprehensive monitoring, this solution monitors a plethora of water parameters including water height, pH levels, salinity, temperature, and dissolved solids. This holistic approach enables the system to make informed decisions based on real-time data. Utilizing the gathered data, the system employs advanced algorithms to determine requisite actions. For instance, upon detecting a lower water level, it triggers the water vault to replenish water, ensuring optimal water volume for aquatic life. Additionally, it regulates temperature through heating and cooling mechanisms, ensuring the maintenance of ideal conditions for aquatic organisms. Moreover, the system proactively addresses anomalies by generating indicator requests for parameters beyond its operational scope, thereby facilitating timely intervention by the user. By amalgamating state-of-the-art IoT technology with comprehensive water monitoring and proactive decision making capabilities, this automated water changing system represents a significant advancement in aquarium maintenance, promising enhanced efficiency, reliability, and ultimately, a healthier aquatic ecosystem.

1. Introduction

It is a hobby that marries the aesthetic allure of aquatic life with the complicated dynamics of ecosystems management. Indeed, it is a very rewarding effort full of challenges in the water quality management area, one of the critical factors for the health and long life of aquatic inhabitants [1]. Most of this conventional water management has been labour-based and involves manual surveillance during every study period. These labour-based approaches are not only time-consuming but also exposed to inaccuracies, leading to environmental instability, which is harmful to aquatic organisms [2]. While there will be an increased use of the Internet of Things (IoT) technology, monitoring the environment and controlling home automation is just the beginning of the convenience and efficiency that this will bring [3]. This is an intricate area that is difficult to maintain in relation to the aquatic ecosystem, and the Internet of Things presents a compelling solution. All these advancements enable real-time surveillance and automated regulation of water surface pertinent parameters, like temperature, pH, salinity, and dissolved solids, to ensure that the aquatic life environment is sustained, stable and conducive [4]. This project is aimed at designing a IoT-based Automated Water Changing and Monitoring System for cathe aquarium hobbyist community. It responds to the demands of keeping an aquarium by deploying automation processes for replacing the water in aquariums and monitoring the quality of such water to decrease the workload of the hobbyists and improve the health of the aquatic species. With the advent of smart sensors and wireless technology, it may become easy to manage an aquarium from remote locations and through mobile devices, which will provide a handy and effective way for the successful handling of the complex activities involved in maintaining an aquarium [5]. It is an absolute rule to maintain the best water conditions in an aquarium directly related to the vitality, behaviour, and reproductive success of aquatic organisms. Relatively suboptimal quality is a forerunner condition to stress, disease, and mortality among the fish and other forms of aquatic life. Regular water changes, accompanied by monitoring of water parameters, are among the necessary routine operations in the management of aquariums; they are intrinsically labour-intensive activities that cause big challenges, especially for large-sized tank owners or those maintaining several tanks [6]. To overcome these challenges, the proposed IoT system has a set of sensors for monitoring the water parameters, such as water height, pH, salinity, temperature, and dissolved solids. The proposed architecture is designed in such a manner that the system itself can take a few corrective actions concerning the maintenance of the system at optimal environmental conditions. For instance, it is designed in such a way that if the water level it falls below a set level, the system opens a water inlet and fills it up to ensure evenness. Similarly, the system can modulate the temperature through the activation of either heating or cooling units as necessitated by the present conditions [7]. Beyond this, the system is built to notify users of instances that need to be manually intervened upon, such as adjustment to pH or salinity levels. This will allow the aquarist to be watchful over the status of the aquarium and allow time for them to carry out any corrective measures as and when required. Interaction with Home Assistant for conjoint operation makes it a more useful system and allows the aquarium to be managed within an aquarist’s broader home automation ecosystem [8]. In brief, the development of an Automated Water Changing and Monitoring System based on the Internet of Things represents a critical step forward in the evolution of aquarium management. The system promises to initiate unprecedented development in aquarium hobbyist experiences that ensure safe living conditions for aquatic life and the ecological integrity of an aquatic ecosystem. As the project progresses, it shall be of great importance to receive feedback from users and carry out tests in the real world to perfect the functionality and interface of the system with the main objective of promoting the use of IoT technologies in environmental management and conservation [9,10,11,12,13,14,15]. Section 2 will present all the preliminary research carried out for the proposed study, while Section 3 will focus on the overall system design. Furthermore, Section 4 will introduce the individual design of the components, while Section 5 will investigate the project integration of the different sub-blocks. Section 6 will present the results of the measurement and calibration of the water tank, and Section 7 will discuss the results. After which, Section 8 will conclude the study, while Section 9 will briefly outline future work and Section 10 will present the user experience feedback from aquarium hobbyists.

2. Research

In his journal, Zharikov describes using an STM32 microcontroller with an LCD display and Home Assistant (HA) Software V14.6 with powerful options. Enhanced IoT systems necessitate robust system control software proficient in managing diverse functionalities such as data collection, automation, machine learning, and advanced features like facial recognition. Acting as a pivotal link, the gateway is strategically deployed on embedded devices situated proximately to smart objects, facilitating seamless communication and direct interaction with them. Devices communicate with each other using the MQTT protocol while showing constant status updates on their displays. Zharikov implemented a temperature sensor, humidity sensor, and a Co2 PPM sensor on his LCD display and a simple dial for sensor range. Flexible system modularity provided by MQTT connecting devices with unique IDs avoids recording the entire system due to changing or removing devices. C++ coding is easier, so Zharikov chose to use ESP32. He improvised his methods by replacing Co2 humidity values with others.

3. System Design

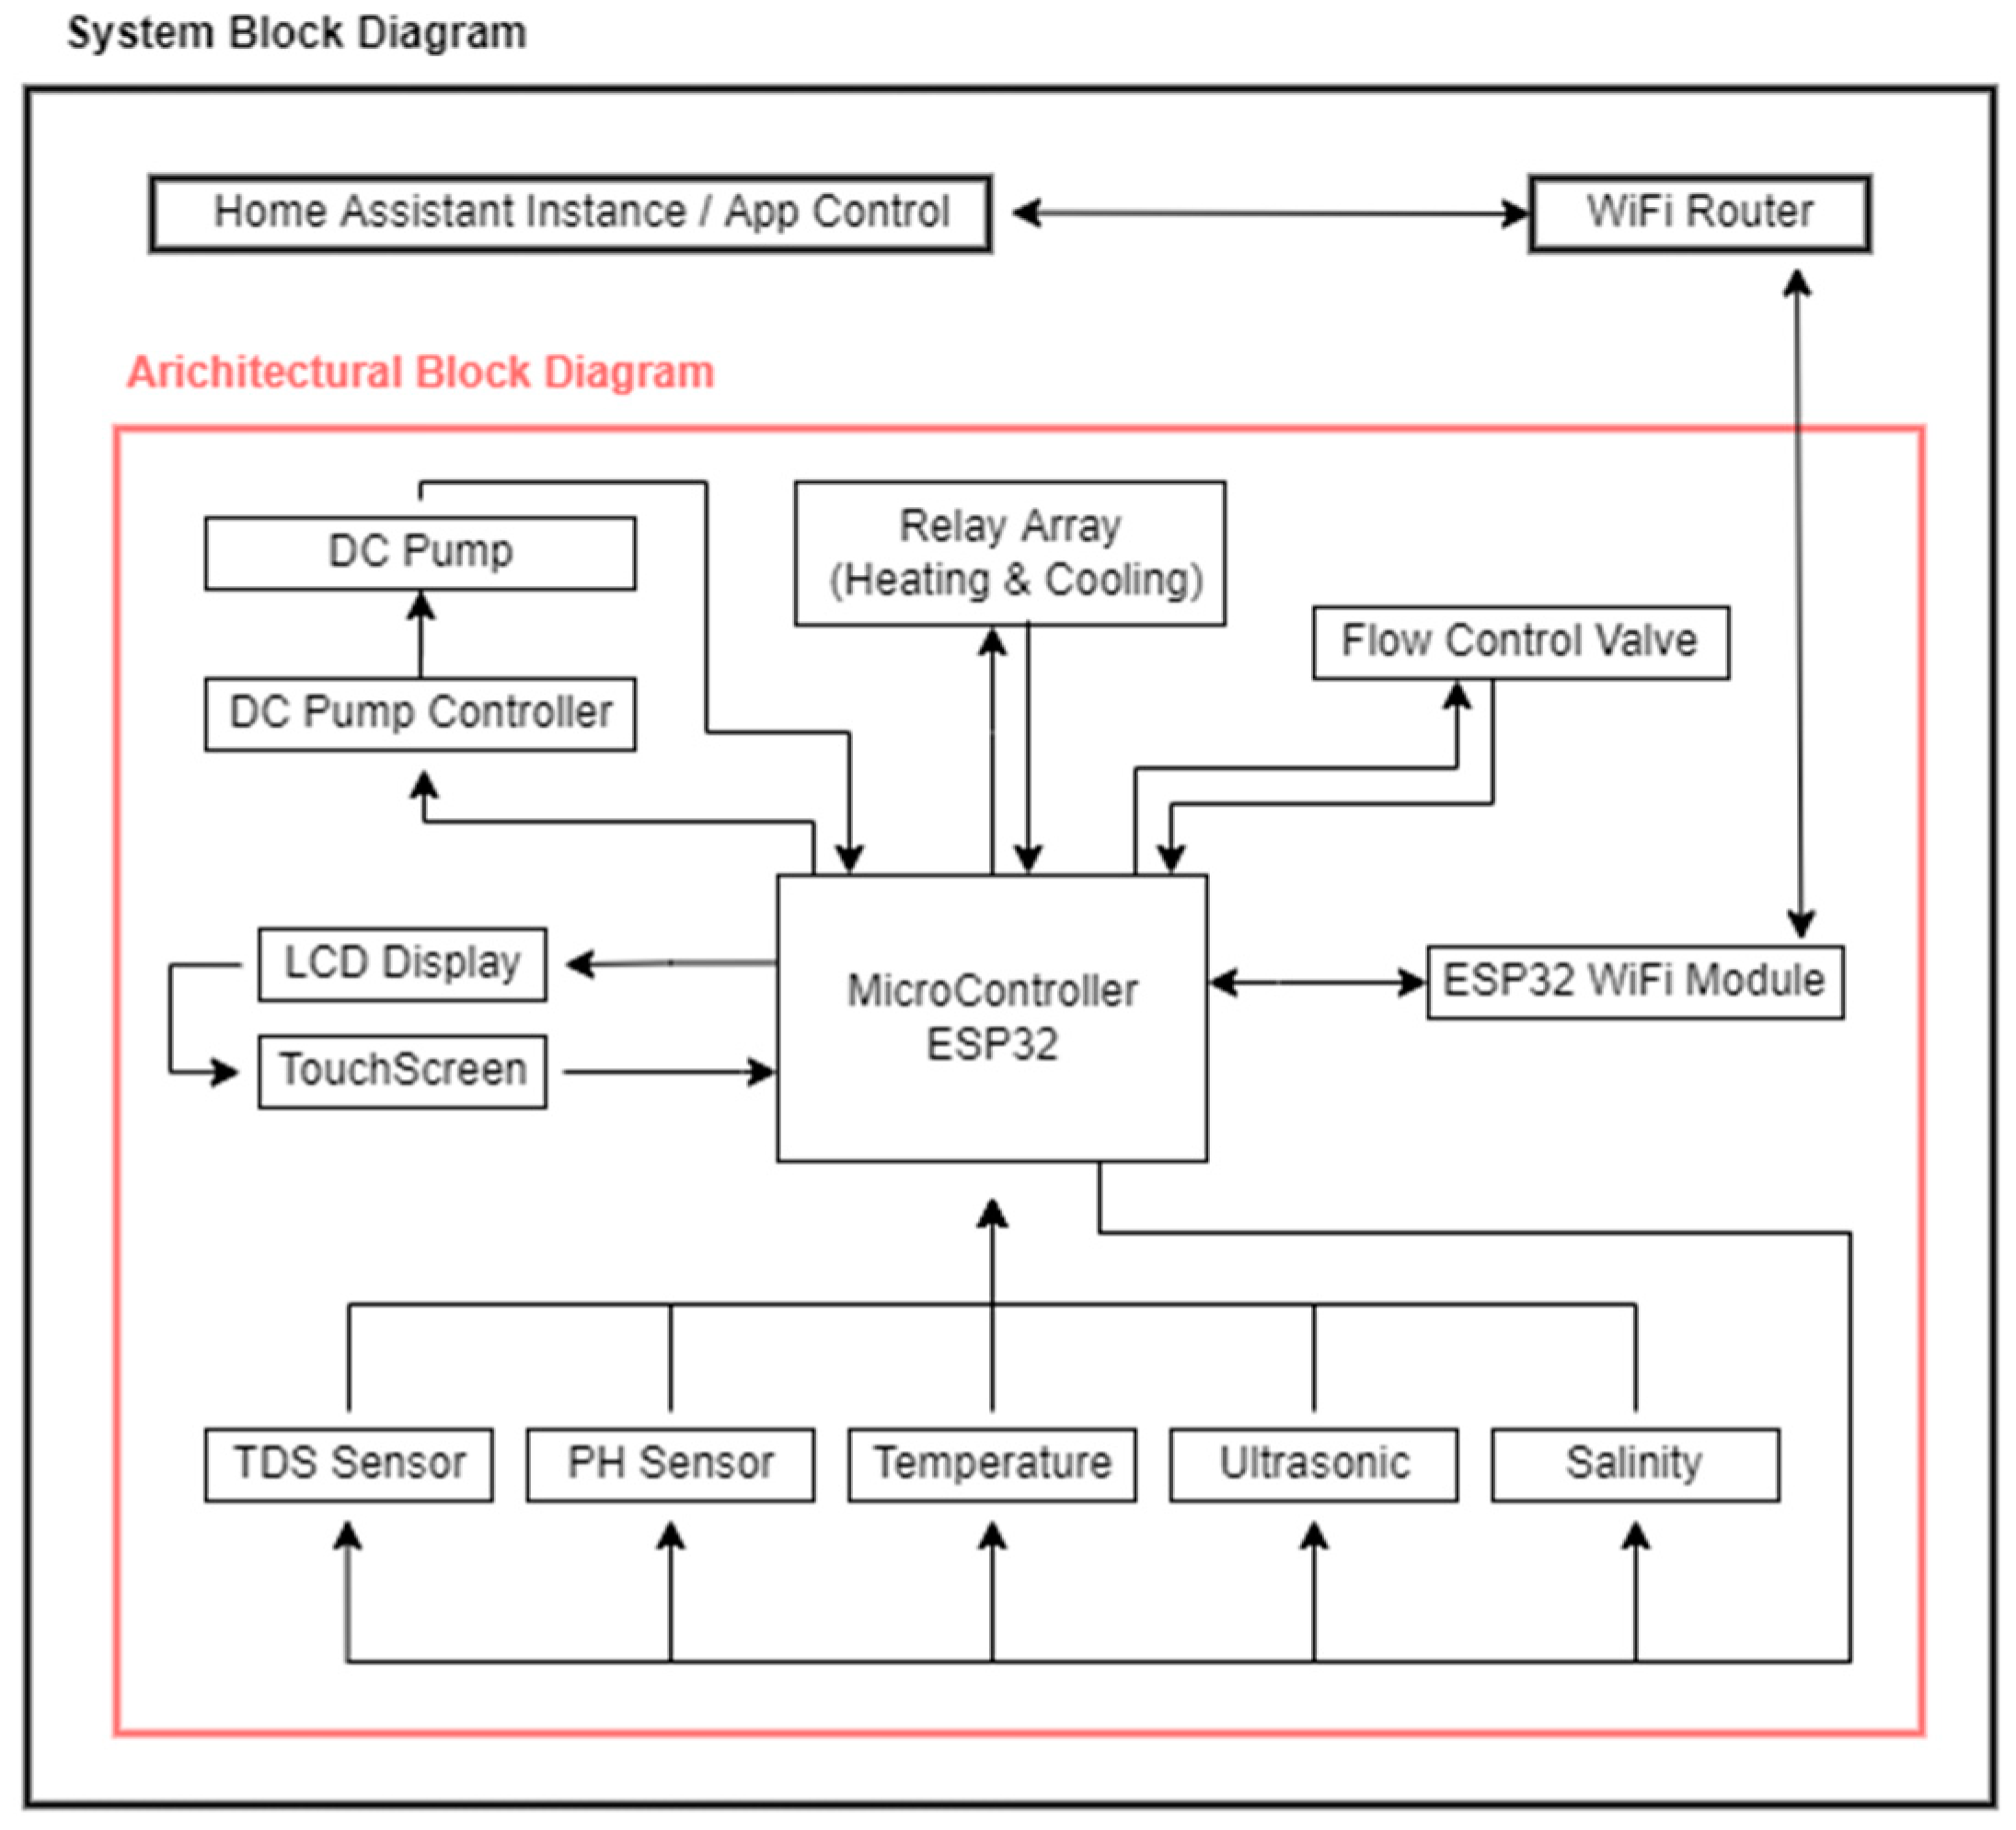
3.1. System Block Diagram

This block diagram shows a water level control system being put up into home automation platforms with enhanced capabilities for monitoring and control. The system focuses on an ESP32 microcontroller platform intended for controlling water levels in the tanks. The use of this microcontroller will make the system intelligent enough for the required control. The data are taken from different types of sensors for the exact levels of water quality adjustment. The information collected will be extracted via an MQTT broker within Home Assistant, ensuring seamless integration [5]. Notably, the system does not just measure the water level with an ultrasonic sensor, but all other main water quality parameters are dealt with, such as pH, TDSs (Total Dissolved Solids), temperature, etc. This multifaceted approach offers a holistic overview of an aquarium’s environmental conditions [4]. The system in Figure 1 follows a closed-loop control mechanism, maintaining the water level inside the reservoir according to the user-specified requirements. This ultrasonic sensor is very instrumental in providing the given real-time water level data to the ESP32 microcontroller for processing so that it can be easily utilized to serve its purpose. When it reaches even lower than the set water level, that is when the microcontroller activates the PWM motor controller. This signals the motor to speed up to create a greater inflow of water into the aquarium. On the other hand, if the water level is above the specified limit, the solenoid valve will be switched on to let surplus water pass out so that the aquarium maintains its set parameters [11]. The ESP32 microcontroller will provide constant feedback from the control loop; it will be a perfect mechanism that enables control of the pH, TDSs, and temperature levels of the aquatic environment simultaneously without exceeding safe levels to ensure its health and stability [6,7].

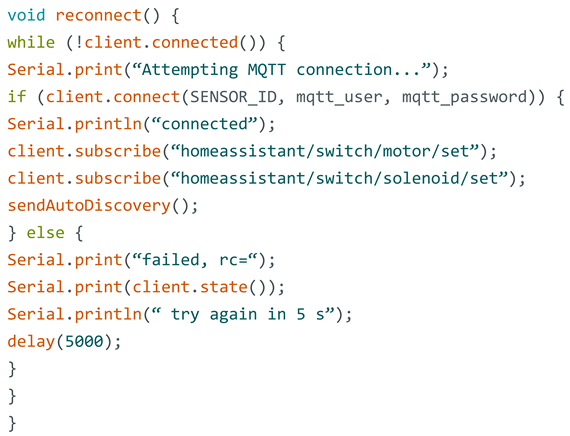
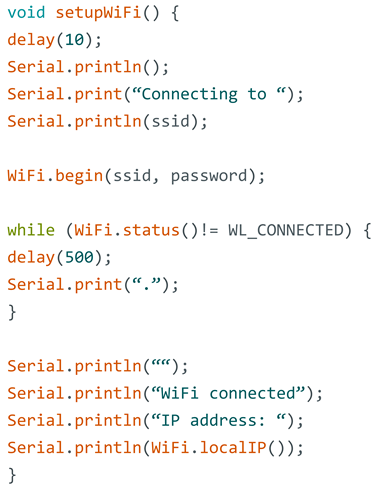
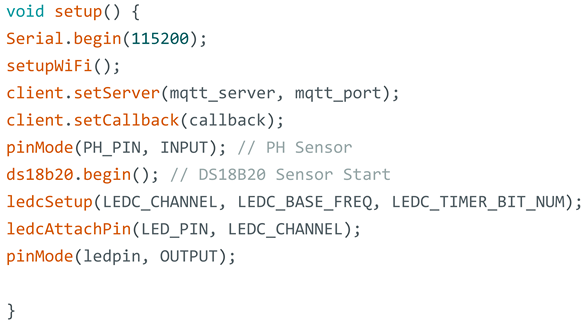
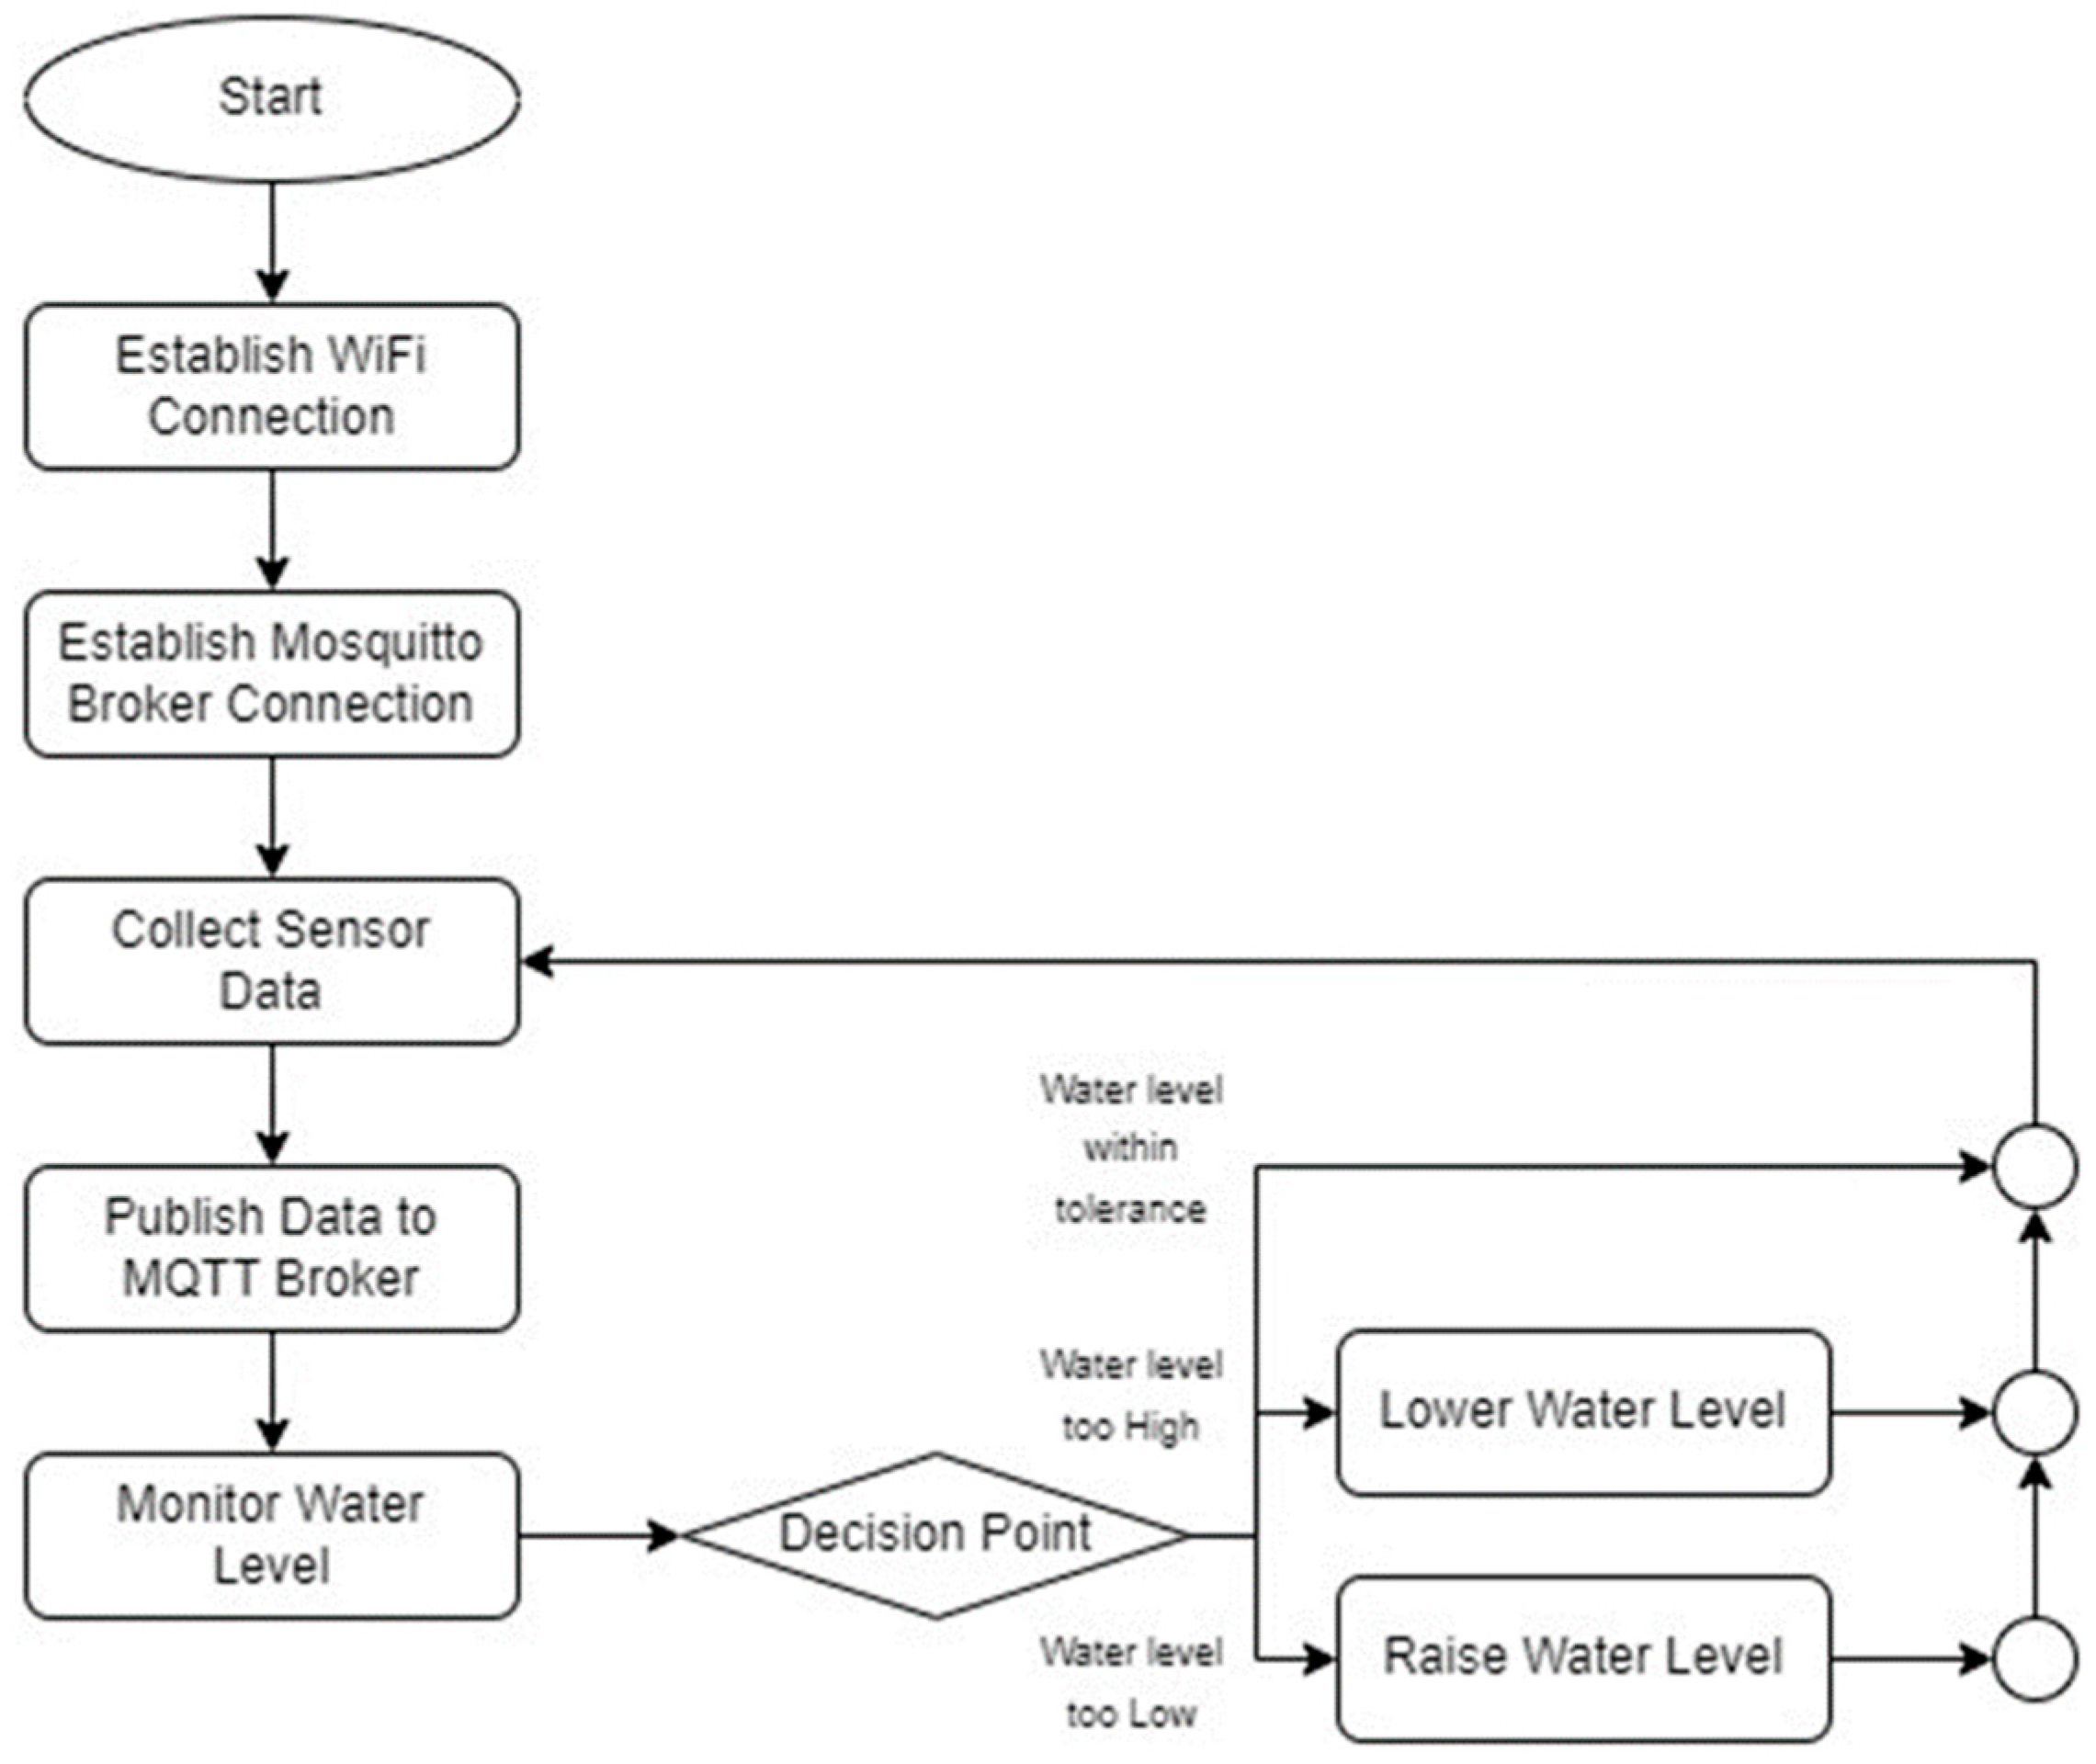
3.2. Firmware and Algorithm Design

This section delves into the intricacies of ESP32 firmware and algorithm design, with a keen emphasis on efficient resource management, seamless sensor data handling, and secure transmission to the Home Assistant server. The firmware initiation involves meticulous configuration of GPIO pins, sensor libraries integration, Wi-Fi setup, and MQTT protocol establishment. Within the main loop, the ESP32 microprocessor adeptly gathers and dispatches sensor data, leveraging its inherent functionalities. The acquired raw sensor data undergo meticulous processing, calibration, and subsequent conversion into JSON format tailored for seamless integration with Home Assistant. Employing the analog function, pH and TDS data are accurately acquired, while the Dallas Temperature library meticulously handles temperature readings. Furthermore, the pulse-in function ingeniously determines water levels by precisely measuring the time delay between emitted and received signals. Regular MQTT publication to Home Assistant is facilitated by the PubSubClient library. Error handling ensures stable functioning, attempting reconnection and resending sensor discovery messages on MQTT loss for consistent data delivery.
Figure 2 shows the flow of firmware and algorithm and the details are given below:
  • Start: system turns on and boots up.
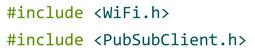
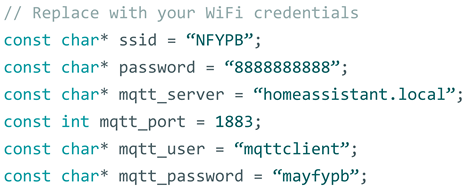
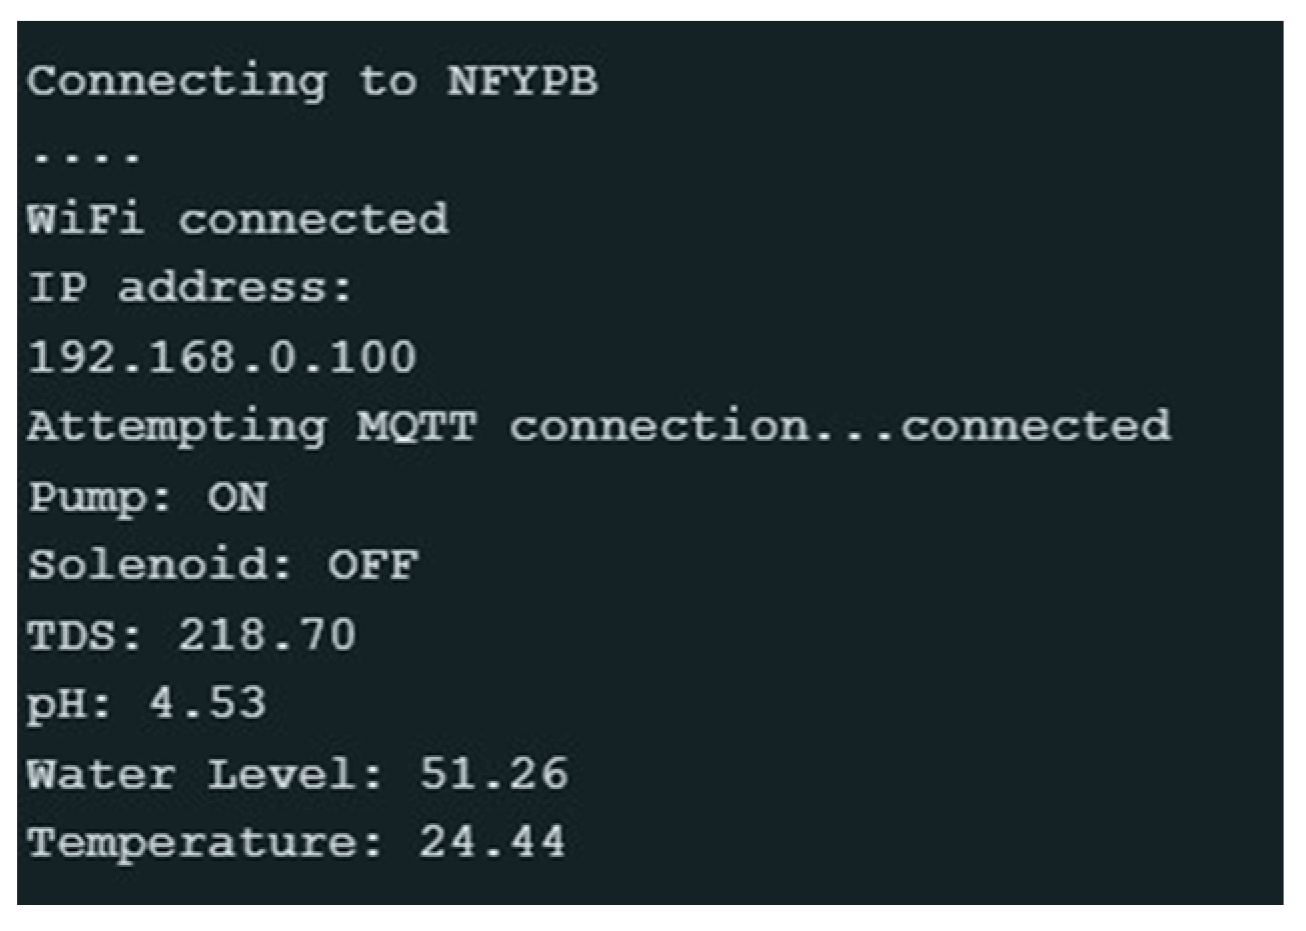
  • Establish Wi-Fi Connection: repeated attempts until connected to the local network.
  • Connect to MQTT Broker: after Wi-Fi, connects to MQTT broker on the Home Assistant (HA), after a successful link.
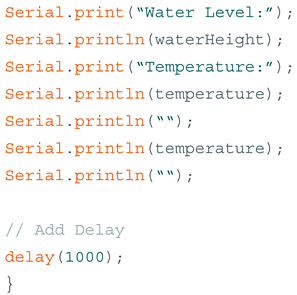
  • Sensor Data Collection: gathers data such as water level, temperature and other pertinent parameters once all connections are in place.
  • Data Transmission: publishes sensor data to Home Assistant
  • Monitor Water Level: constantly checks tank level against the setpoint.
  • Decision Point:
    • High Level: proceeds to Step 8.
    • Low Level: proceeds to Step 9.
    • Within Range: returns to Step 4.
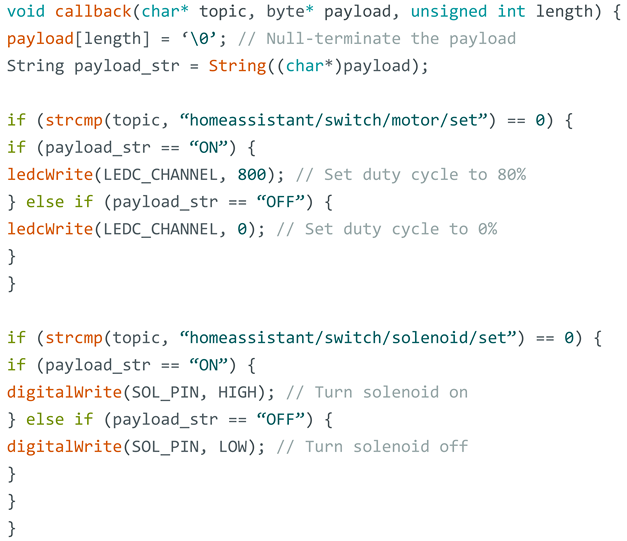
  • Lower Water Level: activates components (e.g., drain valve) to remove surplus water until desired water level, then returns to Step 4.
  • Raise Water Level: activates components (e.g., water pump) to add water until desired water level, then returns to Step 4.

4. Component Design

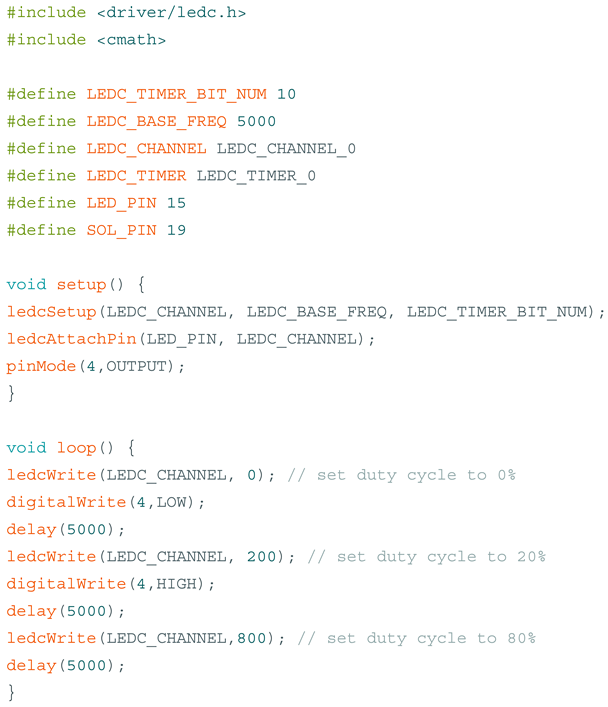
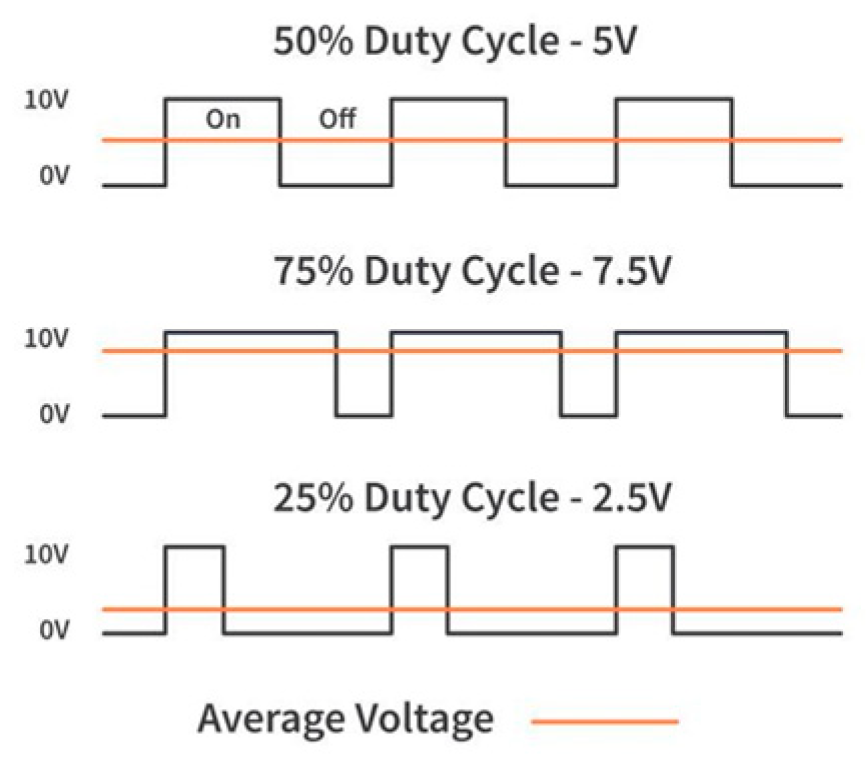
4.1. PWM Controller for Motor

A microcontroller-controlled PWM motor controller offers significantly superior precision in regulating the speed of a DC motor compared to a voltage-controlled speed controller. This heightened precision is achieved by finely adjusting the average voltage applied to the motor through rapid switching between ON and OFF states, a process commonly referred to as duty cycle modulation. As shown in Figure 3, 50%, 75% and 25% duty cycles give average voltages of 5 V, 7.5 V and 2.5 V, respectively, enhancing efficiency. A software-defined duty cycle increases motor voltage control accuracy and precision.

4.2. PWM MOSFET Calculations

For the motor controller, a 12 V 1 A DC motor was chosen to pump water from the reservoir and a 3.3 V PWM signal was output from ESP32. Using these details, calculations are performed for the components. The required MOSFET can cope with low voltages, RDS (on) low resistance, so IRLB3034PBF, IRF3205 and the IRLZ44N in Table 1 are potential choices.
IRLB3034PBF is an excellent choice for our PWM controller due to it having an RDSon value of only 1.4 mΩ at VGS = 10 V, meaning it has a lower power, and the equation can be written as:
Ploss = I2RDS(on)
Ploss for all three MOSFETs is shown below using motor current 1 A:
ΔT = Ploss ∗ RθJA
Ploss for MOSFET IRLB3034PBF = 1.5 mW
Ploss for MOSFET IRF3205 = 8.5 mW
Ploss for MOSFET IRLZ44N = 18.0 mW
VGSth is another factor to consider when choosing a MOSFET to read a 3.3 V signal, which renders IRF3205 with VGSth 2 V–4 V incompatible with the project, presenting the possibility of it not turning on properly. IRLB304PBF is chosen over RLZ44N due to the 12.5 times difference in power loss.
The temperature output is calculated using a power loss of 1.4 mW from the previous calculation and MOSFET thermal resistance values from datasheet RθJA = 62 °C/W using Equation (6) to ensure MOSFET capability. The calculated value is 0.087 °C.
ΔT = Ploss ∗ RθJA

4.3. PWM Gate Resistor Calculations

The gate resistor protects the ESP32 GPIO pin connected to the MOSFET Gate pin from inrush current. It improves the rise and fall times of gate voltage and reduces the surrounding EMI. The starting point range is usually 22 Ω to 100 Ω. Lower resistance results in faster switching but higher EMI, which causes system instability. Higher resistance lowers the EMI but slows the switching time. A switching time of 100 Ω is compared with the PWM switching time to check its capability. Extracted datasheet values of MOSFET and ESP32 are used for calculating the MOSFET switching time.
Gate charges = 130 nC @ VGS = 4.8 V
Current drive (I drive) = 18 mA
Equation (9) derives the rise/fall times of the transistor.
t r   o r   t f = R g a t e Q g I d r i v e
By completing additional derivations, we can get Equation (10).
t r = t f = 100 120   n C 20   m A
The final value is equivalent to 600 ns. The PWM period of MOSFET is calculated using (11) and (12)
T = 1 f
For a 5 kHz PWM signal, the equation becomes (13)
T = 1 5000
The period of the PWM signal is 200 µs for MOSFET. Rise and fall times should be 10% of the total period for minimum power dissipation and maximize efficiency. Equations (11) and (12) show the rise time.
t r = 200 10 0.5

4.4. PWM Pull-Down Resistor Calculations

Incorporating a pull-down resistor is imperative when implementing the PWM motor controller as it effectively addresses the floating gate problem. This resistor facilitates the diversion of current from the GPIO pin to the ground, particularly when the microcontroller enters high impedance states, such as during startup phases or when transitioning between different output states. By ensuring a stable reference point, the pull-down resistor enhances the reliability and consistency of the PWM motor controller’s operation. The implementation approach assures that the MOSFET will be steady and reliable in an off-state every time the condition of not being driven continues; hence, no unwanted switching will occur [16]. Another major role of the pull-down resistor is that of improving the noise immunity of an entire system by effecting a constantly maintained low level of voltage at the gate of the MOSFET and inherently limiting the likelihood of a wrong trigger that might be brought about by wobbling noise. Thus, this results in the overall dependability of the motor controller operation; the latter is by far less vulnerable and sensitive to the impact of electrical interference [17,18].
The value of the pull-down resistor is calculated using IGSS ± 100 nA at 25 °C from the MOSFET datasheet; Vdrop is 10% of 1.35 V VGSth and is placed in (14) to obtain the pull-down resistor value.
R   p u l l d o w n = 0.135   V 100   n A
Rpulldown = 1.35 MΩ, which is relatively high; thus, a lower resistance is recommended for gate capacitance reliable discharge. A range of 10 kΩ to 100 kΩ is chosen for efficiency.

4.5. PWM Diode Calculations

The Schottky diode, particularly the SS34, plays a pivotal role in safeguarding the MOSFET and the entire circuit from voltage spikes induced by inductive loads like motors or solenoids, facilitating secure current re-circulation. The SS34 diode’s selection is a result of its widespread availability and its aptitude, as discerned from thorough analyses of calculations and datasheet specifications. Notably, the SS34 diode, with its capability to handle a forward current of up to 3 A, exhibits a maximum forward voltage drop of merely 0.55 V. This attribute is instrumental in minimizing power consumption during flyback occurrences while effectively shielding the circuit from reverse voltage adversities. Moreover, the SS34’s reverse voltage rating stands at 40 V, which comfortably exceeds the motor’s operational voltage of 12 V, thereby ensuring an added layer of protection. The diode’s forward current rating of 3 A, juxtaposed with the motor’s peak current draw of 1 A, further accentuates its suitability for this application, reinforcing the system’s reliability and operational integrity [19,20].

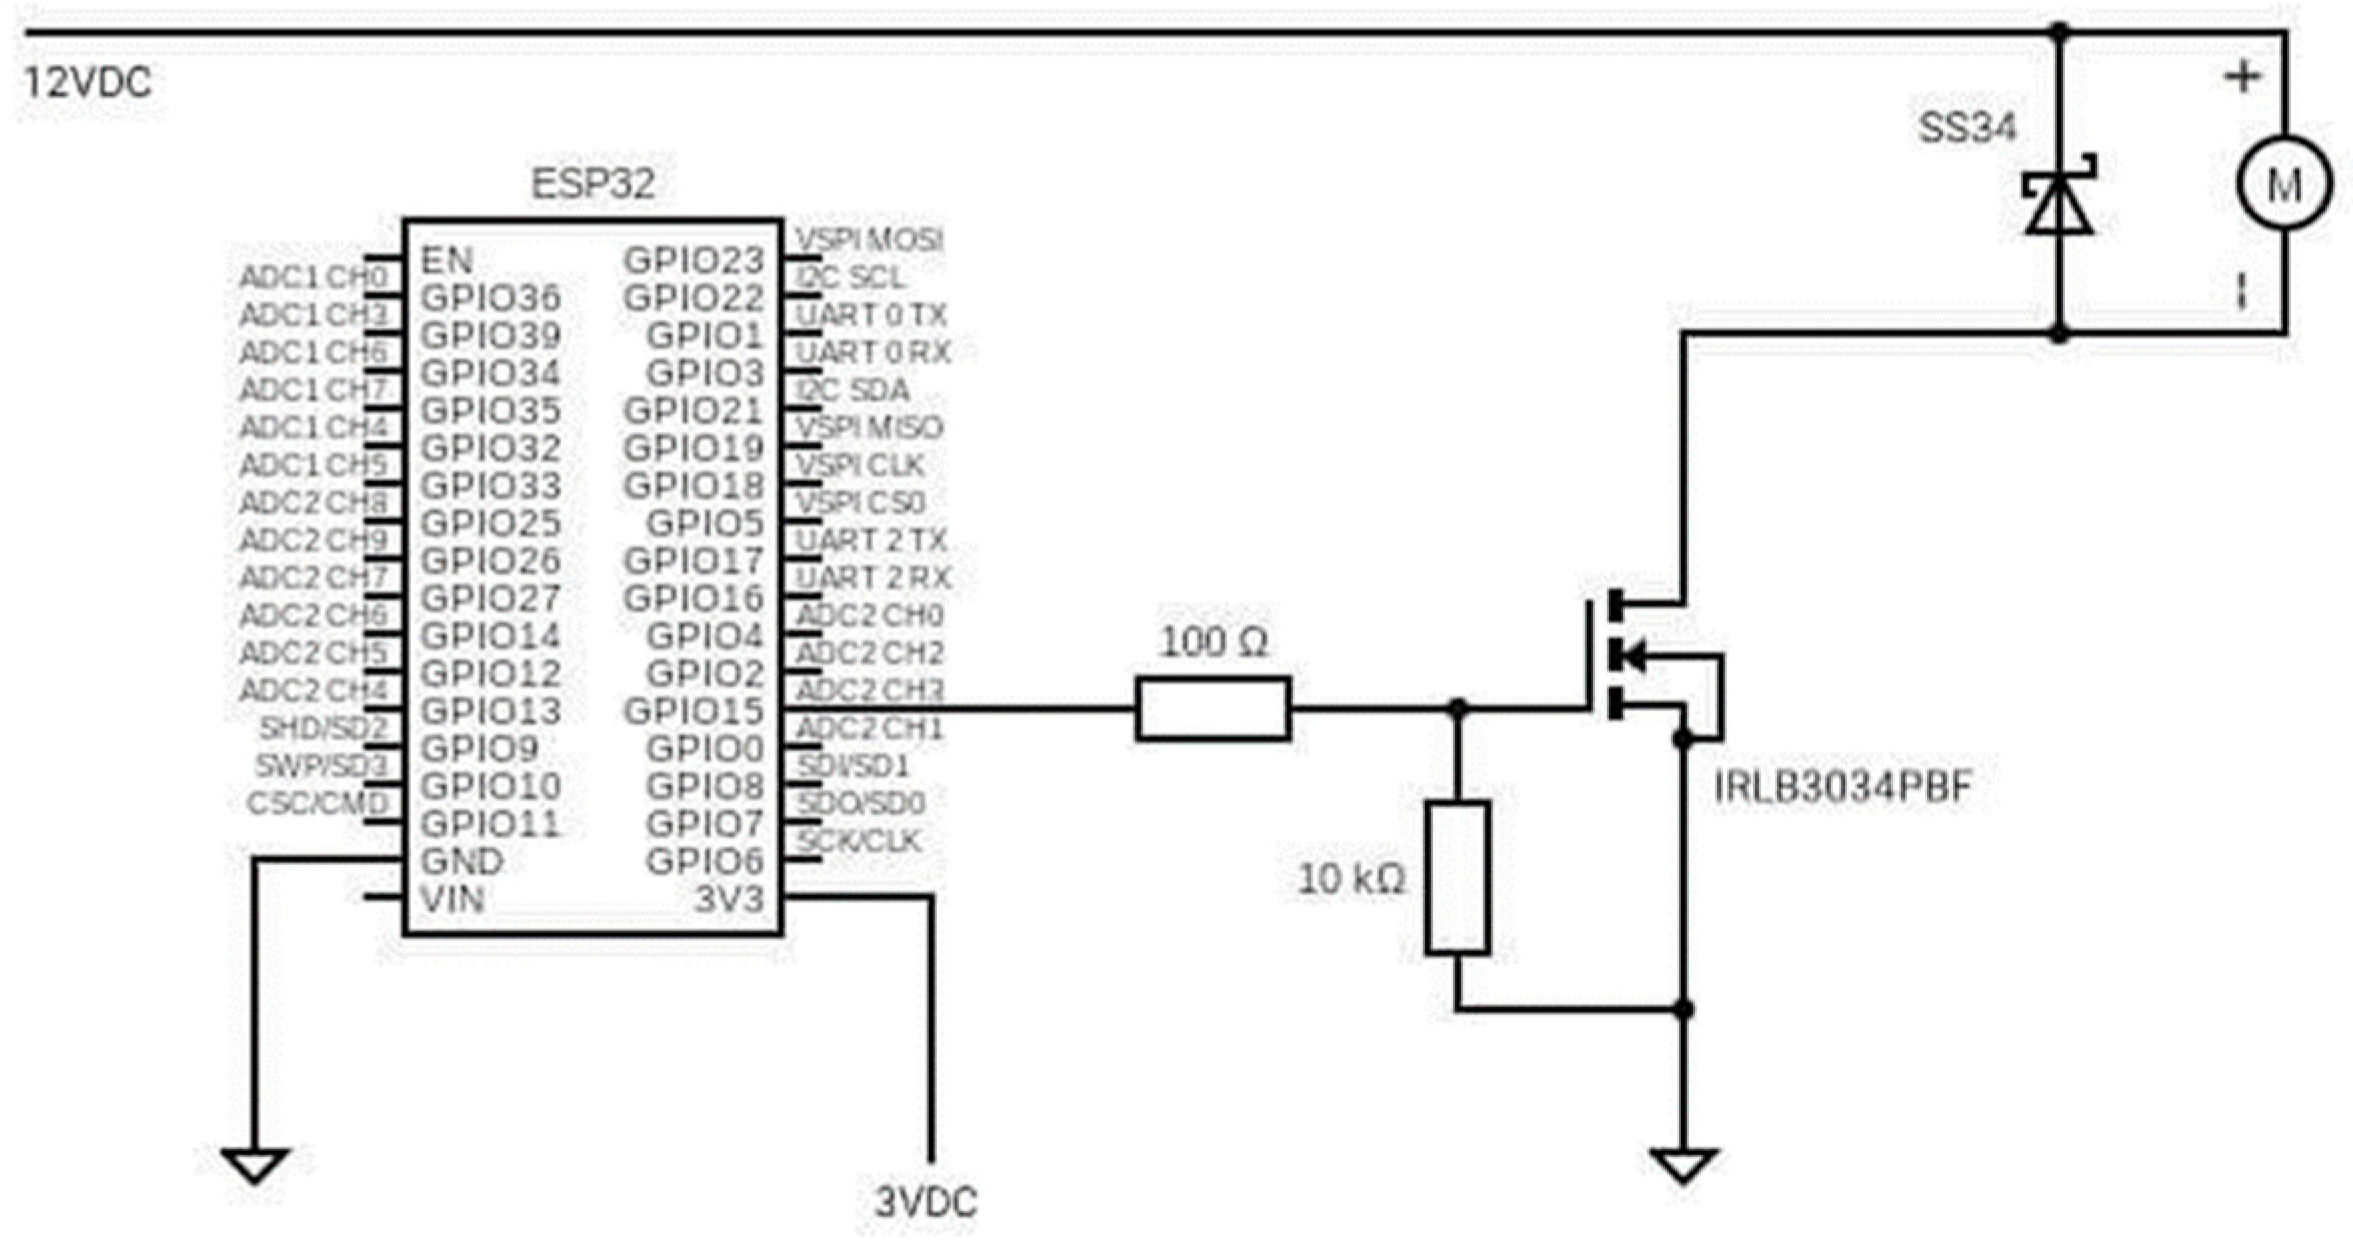
4.6. PWM Circuit Design

Using the methods from previous sections, Figure 4 is formed. DC motor is the load.

4.7. Solenoid Valve Switch

There are four choices to turn the solenoid on and off: a logic-level N-channel MOSFET, P-channel MOSFET, Bipolar Junction Transistor (BJT) and 3.3 V relay module. P-channel MOSFETs can cause system outage or a logic input error of MOSFET and Relay no 12 V and 5 V availability; thus, both are removed. N-channel MOSFETs, which are voltage-controlled, have a larger resistance value than current-controlled BJTs.
The SS34 Schottky diode is used to protect the circuit from voltage spikes, and gate and pull-down resistors are used to assure appropriate MOSFET operation.

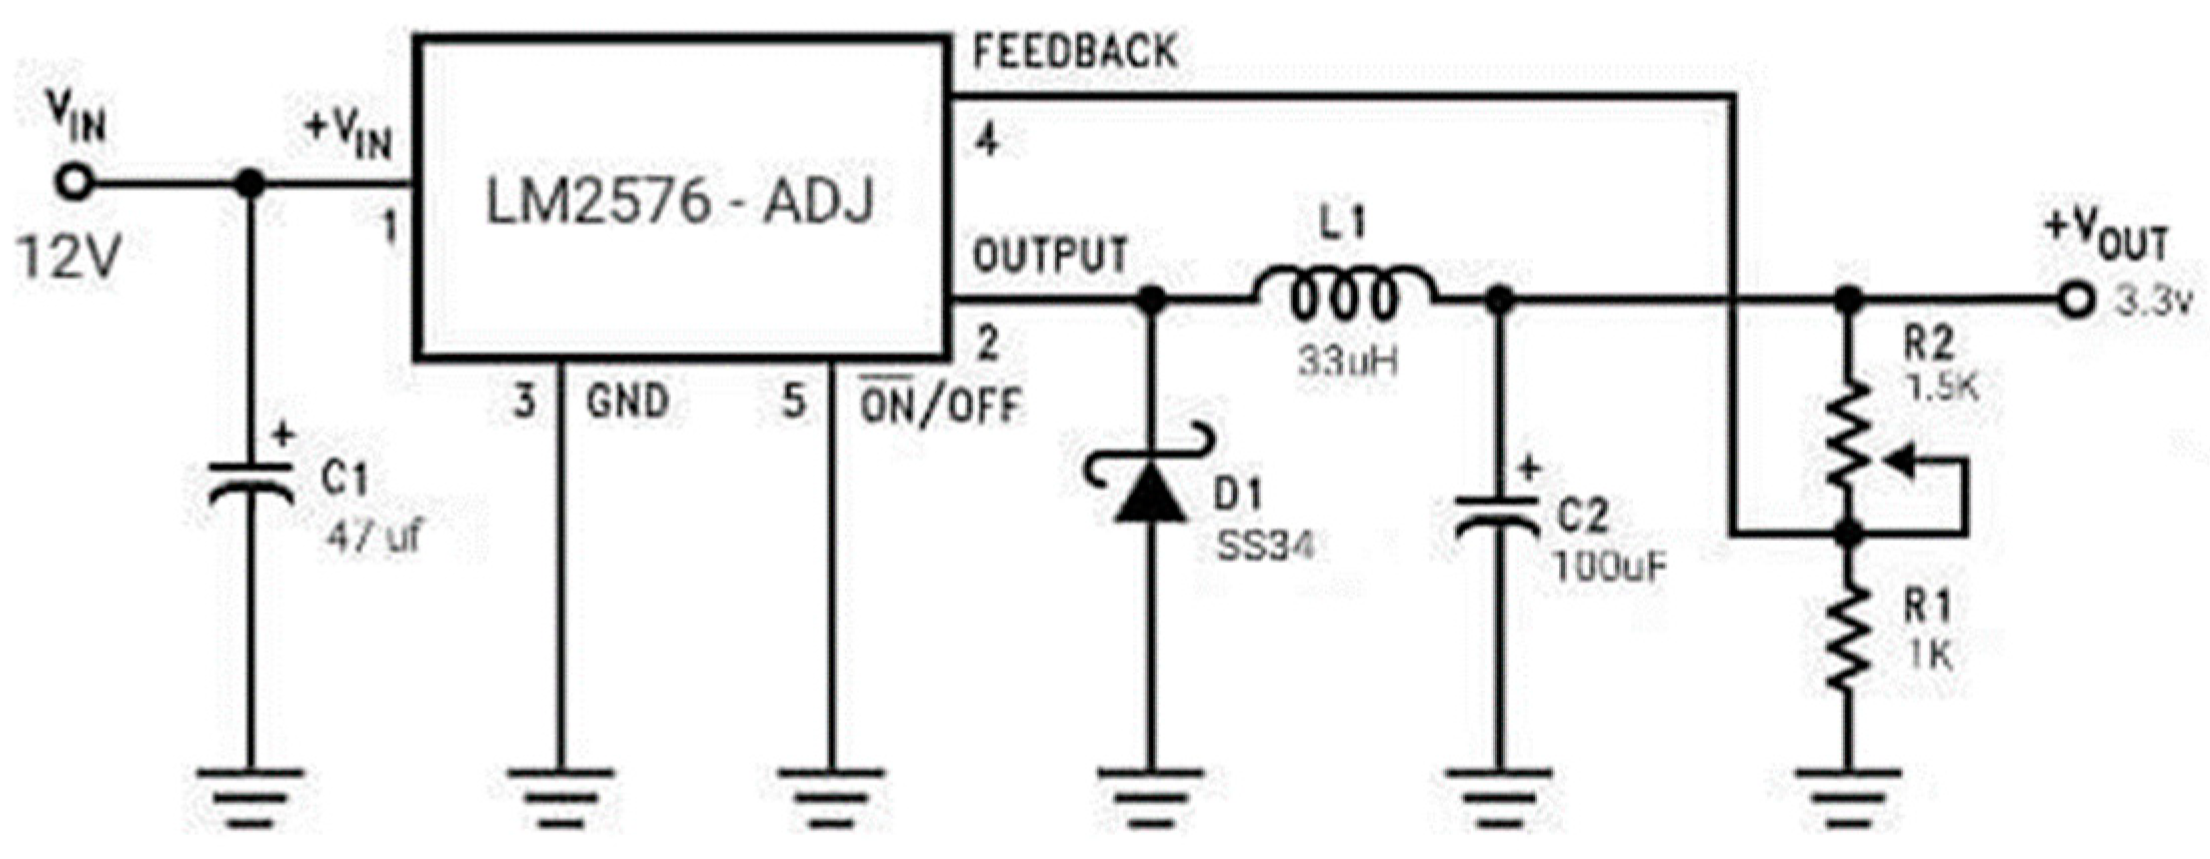
4.8. 12 V to 3.3 V Voltage Converter

Utilizing the LM2576 adjustable switching regulator IC to create a step-down voltage regulator is an optimal choice for supplying the ESP32 microcontroller with a stable 3.3 V output from a 12 V input source. Renowned for its versatility and efficiency, the LM2576 boasts a high level of integration, featuring an inbuilt switch and fixed-frequency oscillation. This compact yet powerful component ensures reliable and precise voltage regulation, making it ideal for various applications, including powering microcontrollers like the ESP32. External resistors R1 and R2 are chosen according to the datasheets and depending on the required output. An input capacitor is required for high-frequency noise filtering from input, an output capacitor is required for voltage stability and ripple elimination, and an inductor and Schottky diode are required for switching circuitry. Based on the datasheet, the recommendations below are made as shown in Table 2.
Equation (15) is used to calculate the resistive load for LM2576 to obtain 3.3 V
V o u t = V r e f     ( 1 + ( R 2 / R 1 ) )
Assuming R1 is 1 kΩ, the formula is arranged to (16) to reach R2.
R 2 = R 1 V o u t V r e f 1
Result is calculated using (17) using the plotted values.
R 2 = R 1 3.3   V 1.23   V 1
The calculated R2 value is 1695 Ω; thus, 1.5 kΩ is chosen, which is a realistic value for a resistor. Thus, R1 and R2 will be 1 kΩ and 1.5 kΩ, respectively. The inductors and capacitor are chosen from the datasheet along with the Schottky diode SS34 with 40 V reverse voltage and 3 A forward current.
Figure 5 is generated from the datasheet.

5. Project Integration

The ESP32 microcontroller serves as the central processing unit of the system, responsible for executing computations, evaluations, and logical operations to enable appropriate reactions to various circumstances. A Graphical User Interface (GUI) inspired by the LabVIEW Control Panel is implemented to ensure that data collected from the ESP32 are easily viewable. The MQTT protocol is utilized to interact with the ESP32, leveraging both C++ and Python V18.2 for smooth integration and interpretation of sensor data. Analog values from sensors range from 0 to 255. A calibration procedure is implemented to map these analog values to corresponding physical measures, such as 0 representing 0 °C and 255 representing 50 °C. Intermediate values are calculated for precision. Data are broadcasted to a Home Assistant broker, making them available to various services. The MQTT protocol ensures reliable data delivery and low-latency updates, enabling real-time monitoring and analysis of sensor readings. The integration of MQTT and ESP32 facilitates scalable and versatile IoT solutions. Sensors are attached to the ESP32, functioning as nodes interfacing with the mainboard using various protocols such as I2C or generic analog signals. Once calibrated, these sensors are integrated into the system, allowing for accurate and real-time monitoring of water parameters in different aquatic scenarios. Waterproof cables, tested according to datasheets, are used to link the sensors to the mainboard to maintain the integrity and reliability of sensor data. A PWM speed controller is connected to the pump, with the output pin of the ESP32 microcontroller, as shown in Table 3, sending PWM signals to control the pump’s speed without directly handling the pump motor’s high voltage and current requirements. The Home Assistant server regularly receives data to automatically discover and configure the sensors. The transmitted messages contain information such as sensor names, units of measurement and device classes. Real-time monitoring and data analysis are made possible through integration. Based on sensor data, users can develop automations, notifications, and adjustments, providing a comprehensive and interactive monitoring solution. At the initial stages of the project, LabVIEW was primarily used more as a tool for proof of concept that would show the possibility of the feasibility of the project rather than being the primary software in the integration and monitoring of the ESP32. The choice was motivated by the objective of obtaining a platform that would be very effective in showing how technically feasible our idea could be and at the same time easy to demonstrate for the preliminary testing. We chose to design the Home Assistant dashboard as an interface for its simplicity and how easy it is for end-users to interact with. The user-friendly design and widespread use makes Home Assistant fit very nicely into our system, ensuring there are no learning curves for the user to face in managing their settings effectively.

6. Results of Component Testing and Calibration

6.1. ESP32 Microcontroller

ESP32 utilizes an advanced processor, RAM and Flash storage capacity. It also runs on the FreeRTOS system, making it programmable by the Arduino IDE program. First, we enable Arduino IDE for code writing, navigate the IDE preferences and add the URL in IDE Board Manager. From the given URL, we search for ESP32, install it and select the board on Arduino window.
To test the microcontroller’s functionality, we connect it to a computer via USB, compile it and upload the sketch to the board.

6.2. PH-5402C pH Sensor

A PH-5402C and probe combo are used to measure the pH level in water quality analysis. GPIO pin 34 from ESP32 is used for the sensors. We start the serial connection on a 115,200 baud rate, connect the serial monitor and take an analog reading of the sensor data. It is converted into voltage form using the equation below. All of the sensors operate at a sampling rate of 1 Hz.
V o l t a g e = s e n s o r V a l u e   s u p p l i e d   v o l t a g e A D C
Since ESP32 has a 12-bit ADC, the ADC digital output range is calculated by adding a power of 12 to the 2 bits of the ADC, giving 4095, which is 3.3 V. Serial.printIn() command prints results are calculated. The code reads the voltage of the sensors, and the results are given in Table 4.
These values are used for a new code for the gradient of data. Gradient formula (19) is
G r a d i e n t = 7.01 4.01 V 7 V 4
After offset, Equation (20) is calculated
O f f s e t = 4.01 s l o p e V 4
Using all of these data, the pH value is calculated using Equation (21)
p H = s l o p e v o l t a g e + o f f s e t
Completing calibration means the system can detect the pH accurately. We can now proceed to the next steps.

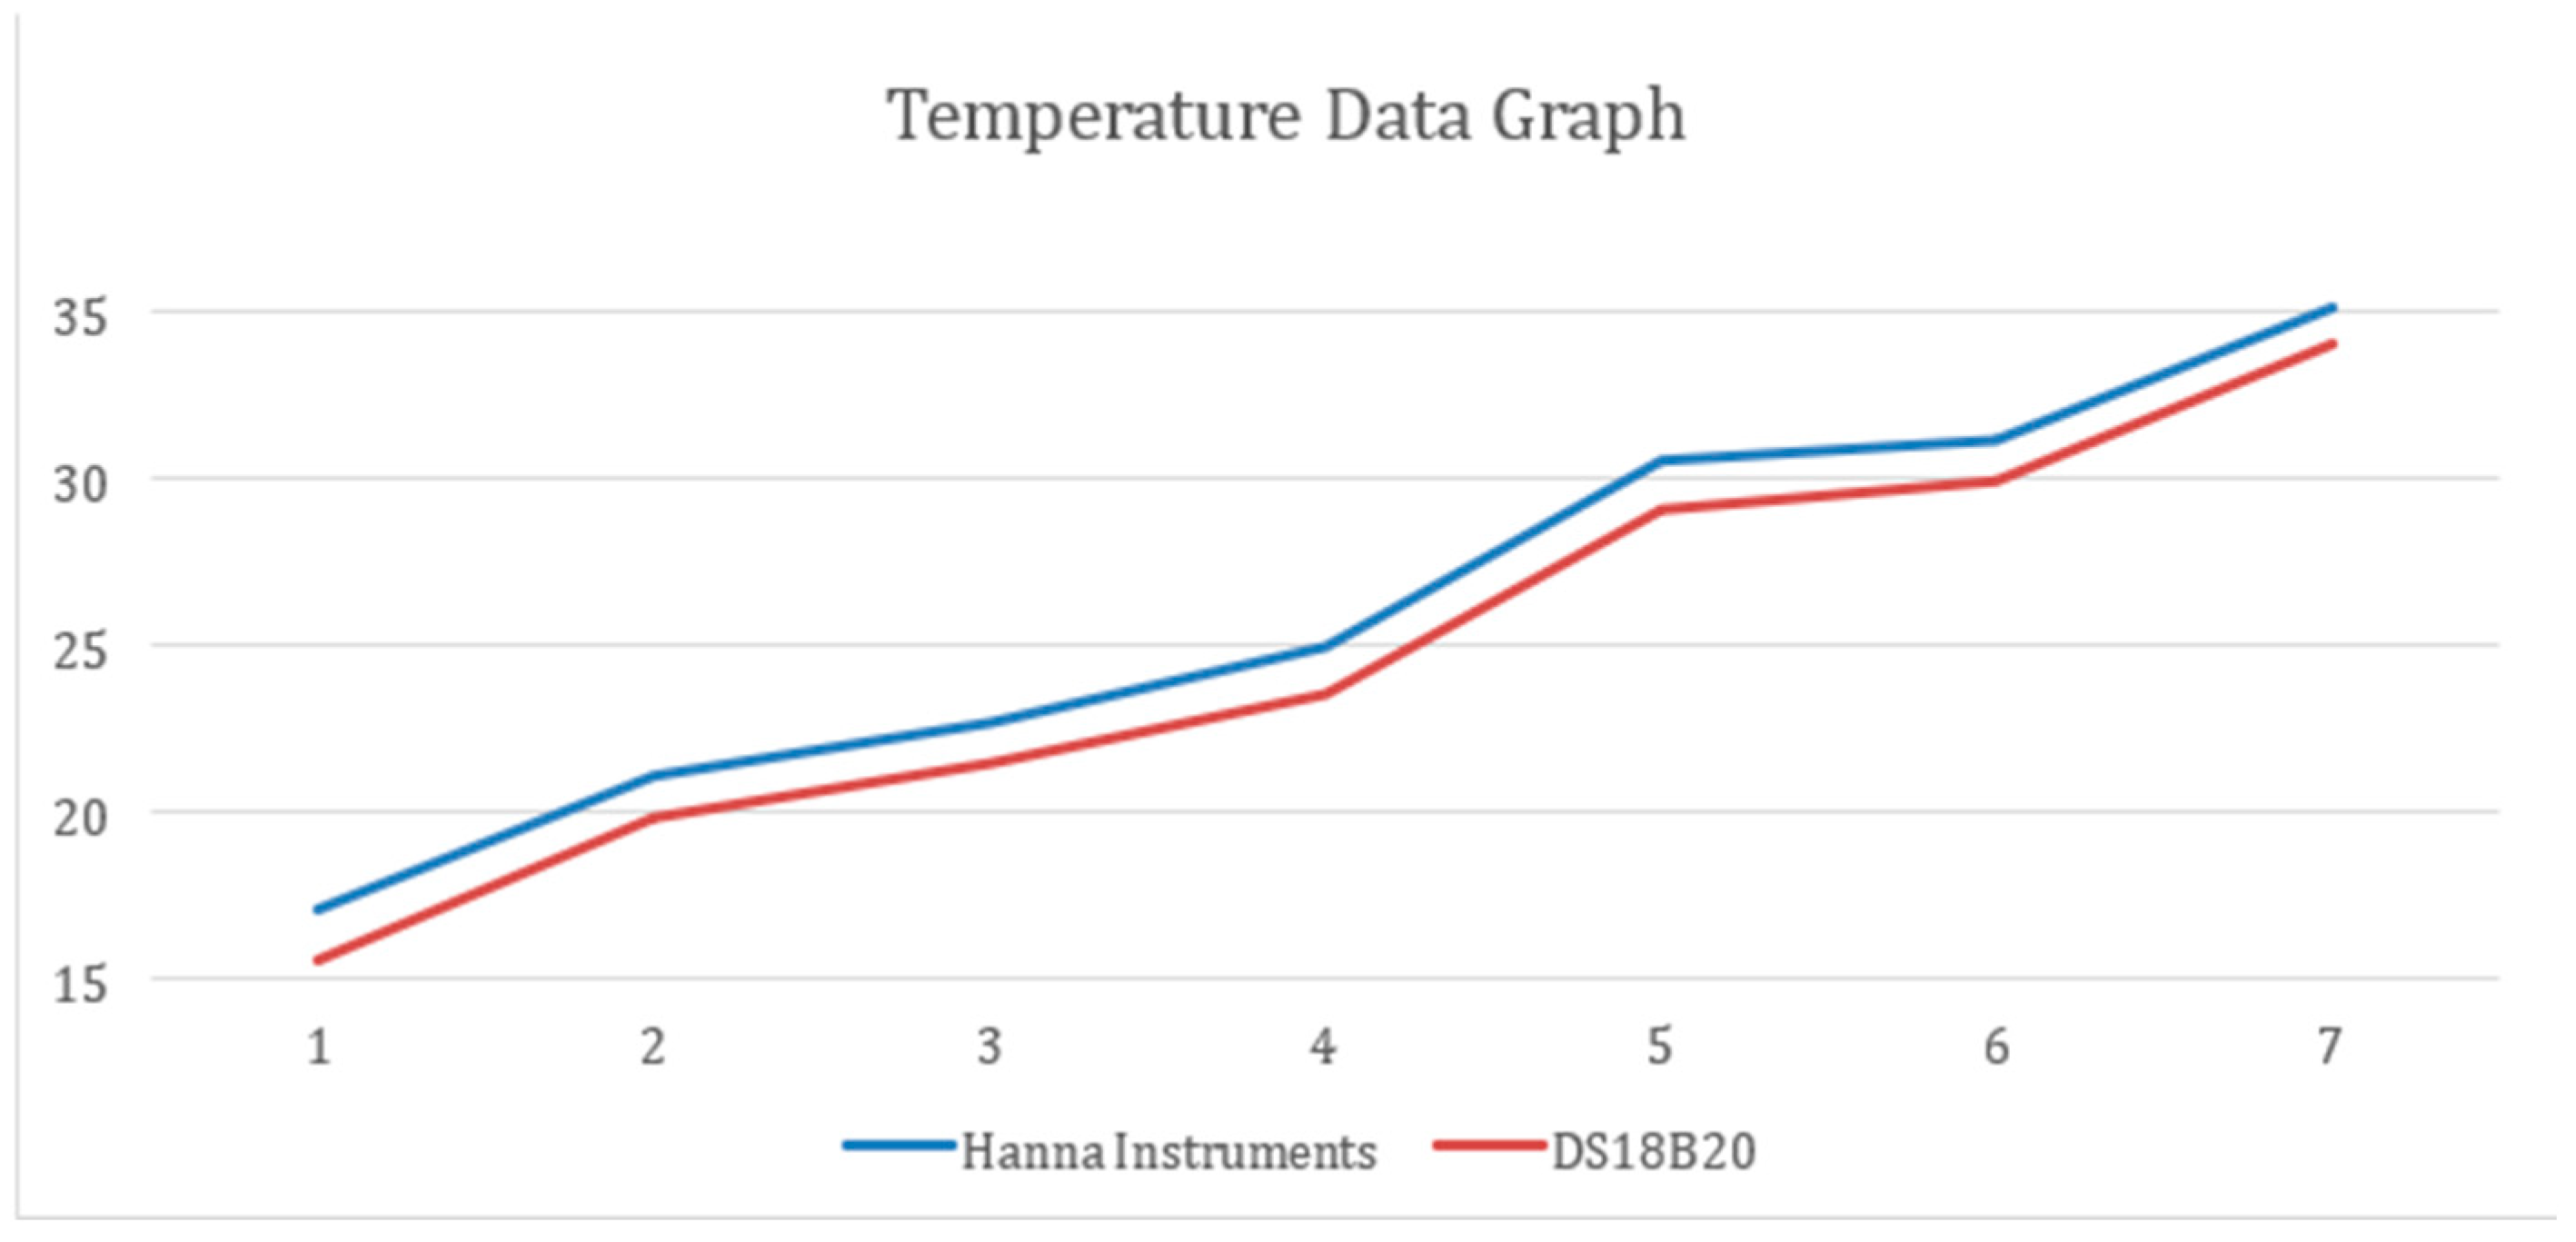
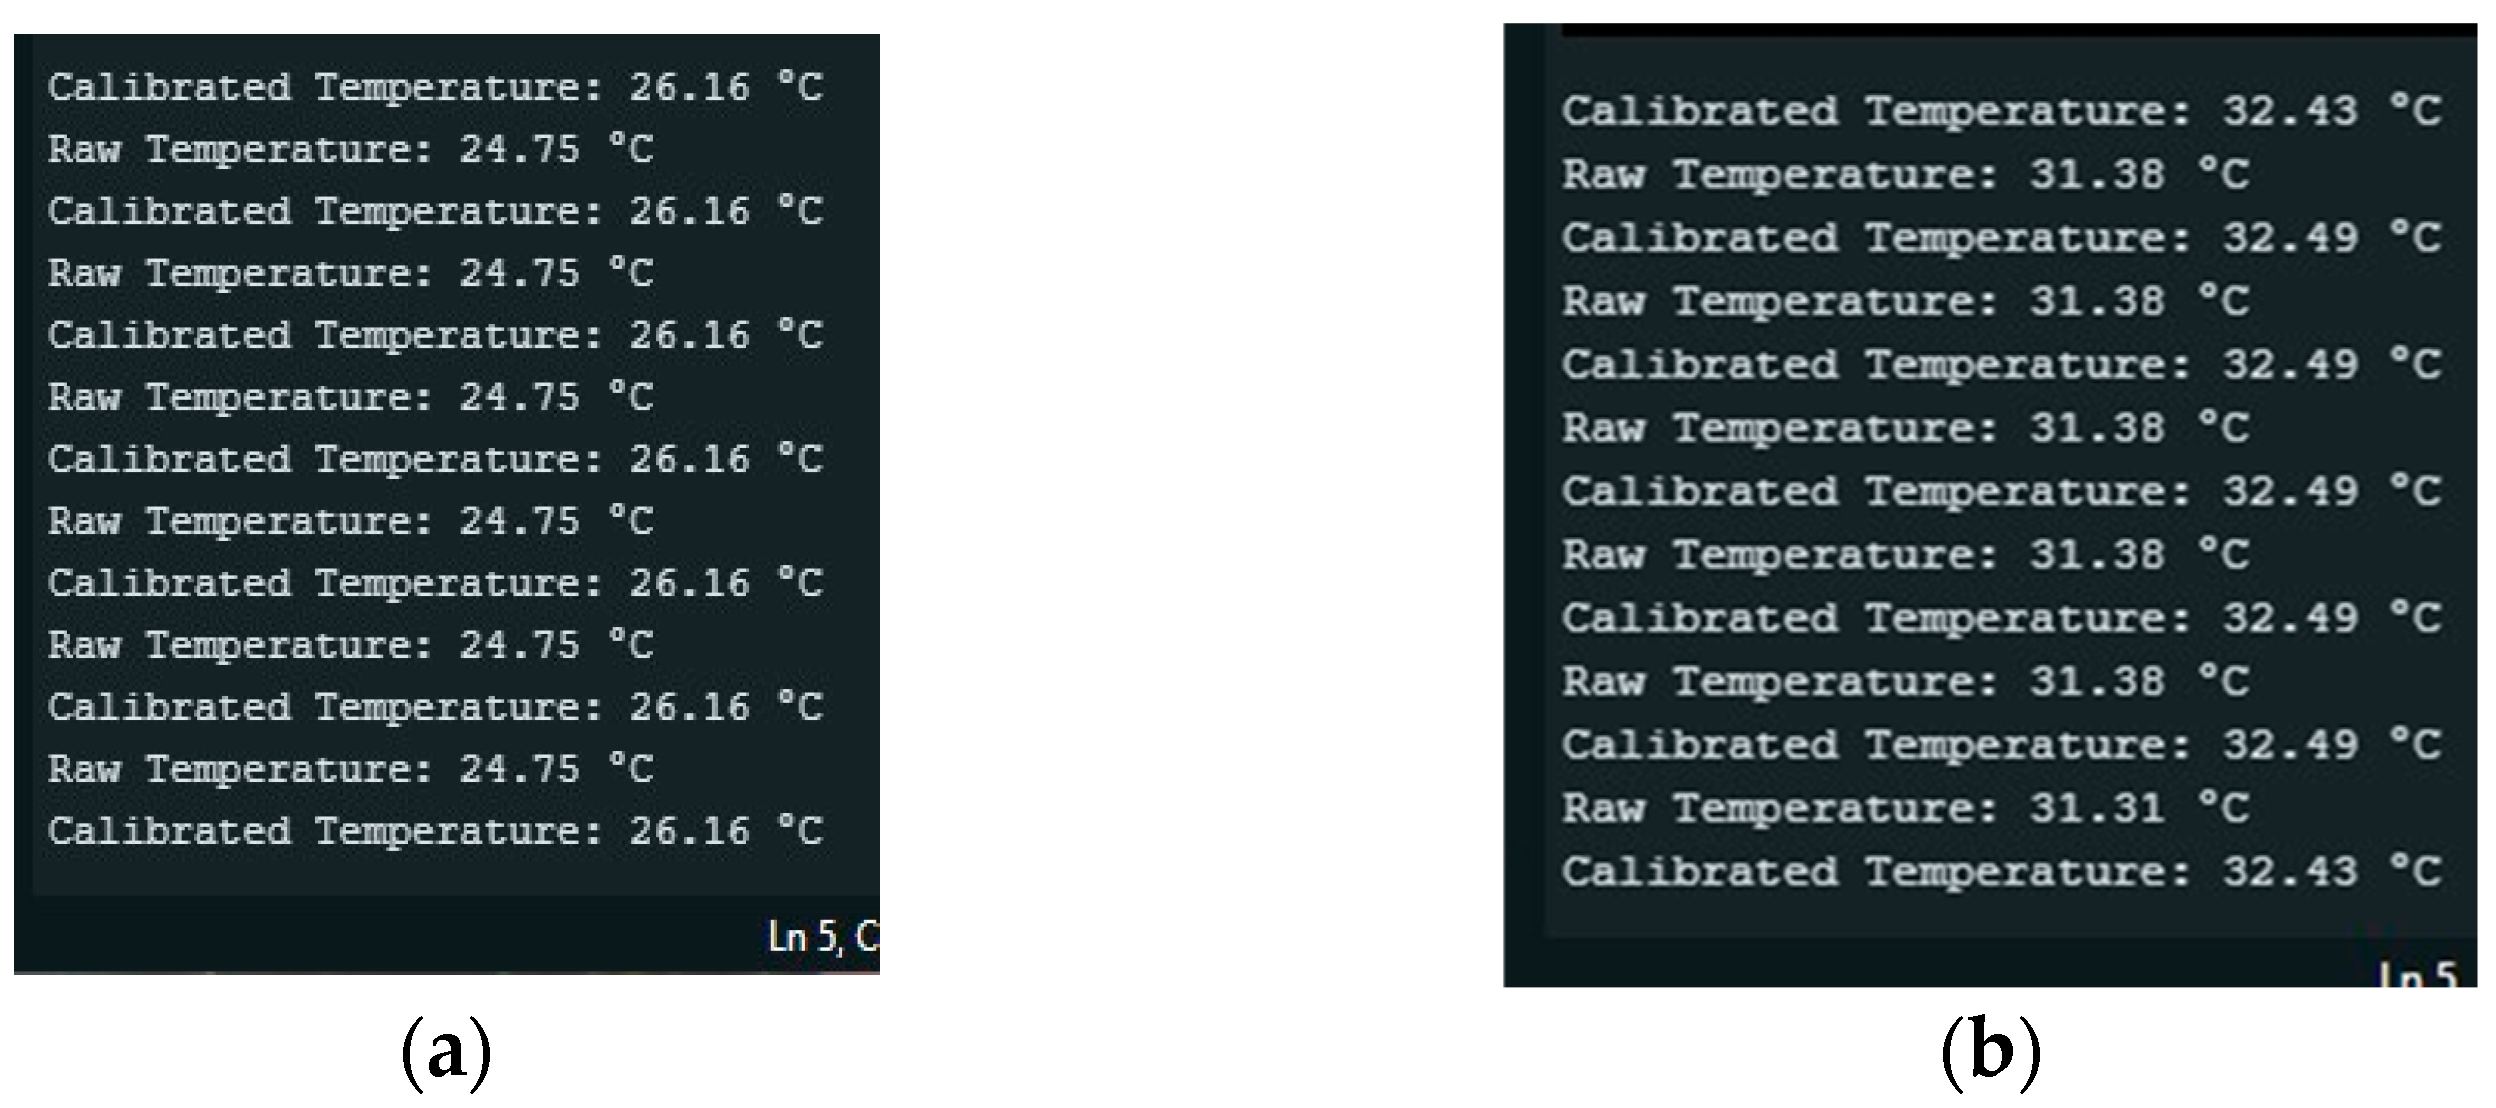
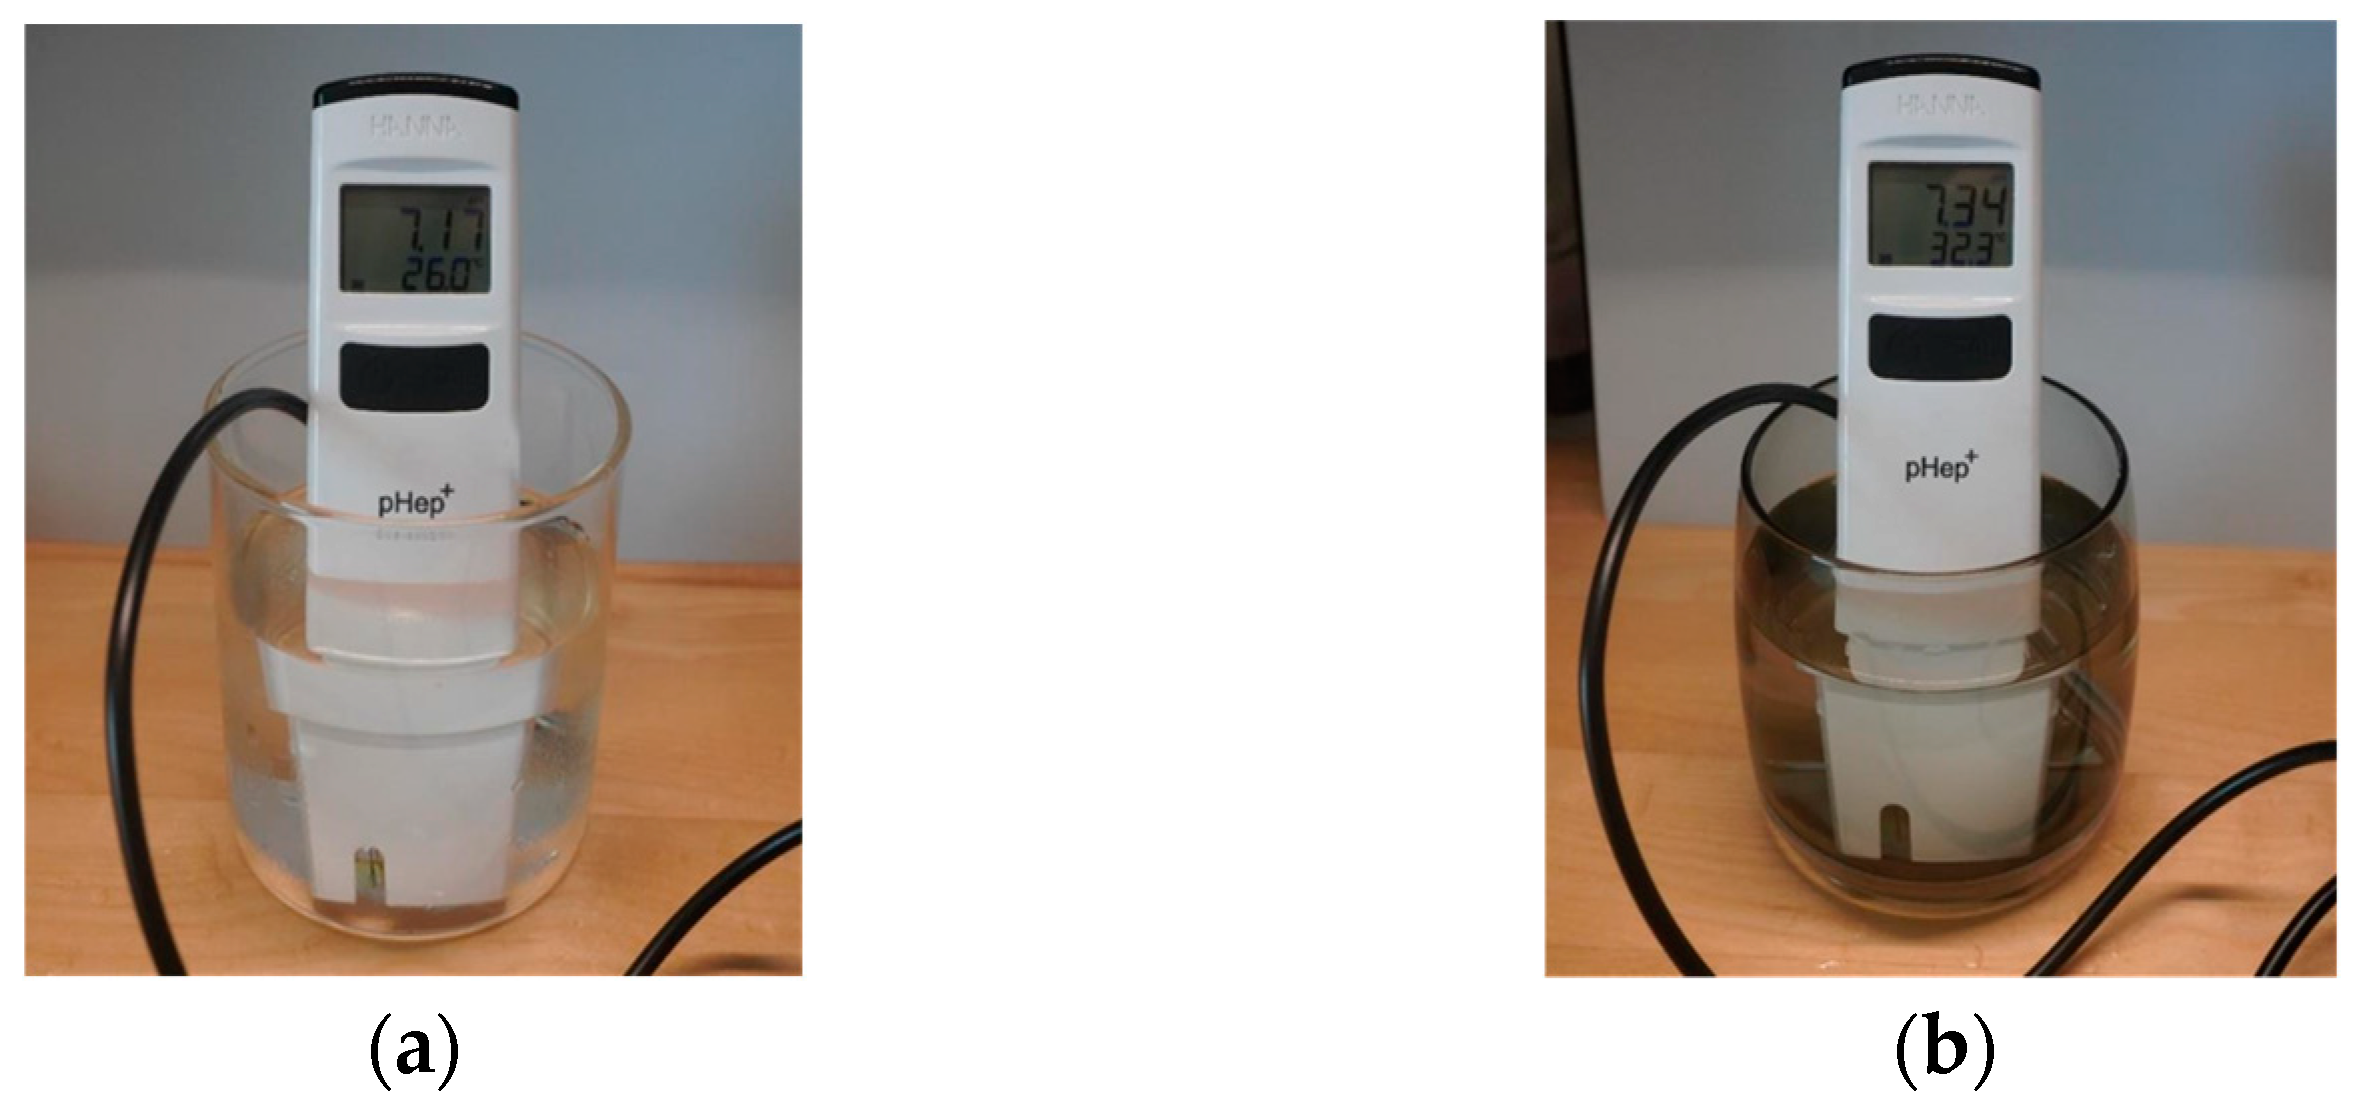
6.3. DS18B20 Temperature Probe

Resistor pull-up establishes a default state for the signal line, preventing noise and interference, ensuring signal integrity by providing a constant current.
The DS18B20 temperature probe is connected to the ESP32 by adding a 4.7 KΩ resistor between the 3.3 V VCC and DATA pins. This resistor pull-up establishes a default state for the signal line, ensuring signal integrity. The final pin configurations for reading the sensor outputs may differ. The ESP32 is linked to the computer via the Arduino IDE for testing after the connections are completed. For temperature testing, for low-level coding, simplification uses commands including libraries like Onewire.h, which provides serial communication and DallasTemperature.h interfaces with DS18B20 sensors.
We have a code which imports two libraries. The code initializes libraries, defines the DS18B20_PIN representing the GPIO pin from ESP32, sets up communication instances, and reads and prints temperature data in a loop with a delay. The sensor is connected to pinD4 for communication.
Raw temperature readings may have inaccuracies, taking a room temperature of 24 °C into consideration. Calibration techniques include linear regression (single- or two-point), polynomial regression, and piecewise linear interpolation. For analysis, multiple different conditioned data are collected.
Figure 6 shows the tabulation procedure using the Hanna instruments in Table 5 and DS18B20, which aids in error detection. In the end, linear interpolation is chosen for simplicity, local accuracy, avoidance of overfitting, and easy updating. Piecewise linear interpolation is implemented in the code.
After running the code and opening the serial monitor, calibrated temperature readings of Figure 7 at 26 °C and 32 °C are accurate, confirmed by Hanna instrument equivalents in Figure 8.

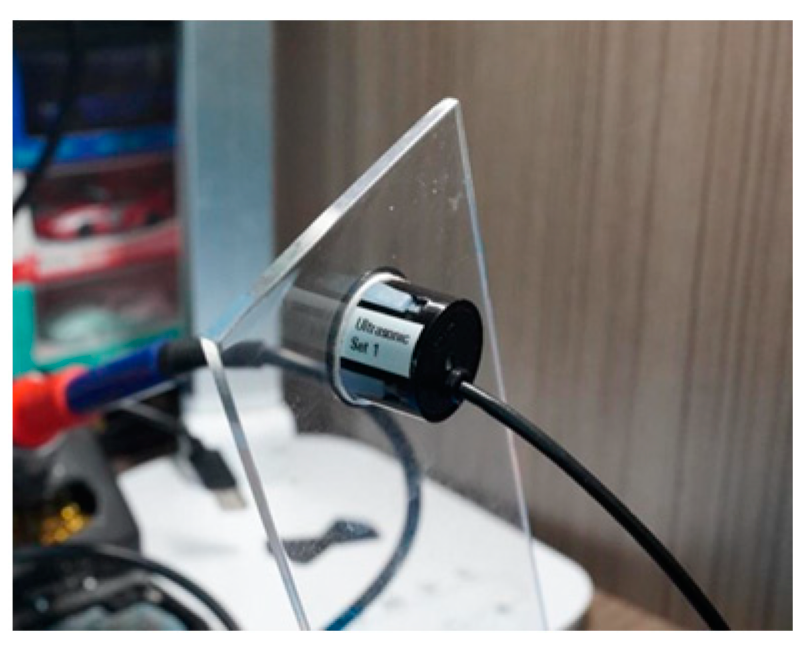
6.4. JST SR04T Ultrasonic Sensor

The JSN-SR04T ultrasonic sensor is known for its waterproof design and accuracy and distance measurement ability. The sensor consists of main transducer and a separate signal processing daughter board as shown in Table 6.
Testing and calibration processes are as follows. Minimizing the ultrasonic reflection requires a solid, even wall. A 1 m measuring instrument is used for distance referencing.
Mounting the JSN-SR04T sensor, as shown in Figure 9, on an adjustable acrylic holder ensures stability, adjustability, and parallel alignment with the wall.
After setup, the sensor is positioned at known distances from the wall and the distances are measured with a measuring instrument. The ESP32 is turned on, the code is uploaded, and the raw distance values are monitored using the serial monitor. This is repeat for various distances.
The recorded raw distance measurements and associated reference distances are shown in Table 7. After studying the overall data of the JSN-SR04T sensor, it exhibits accurate distance measurements within the operational range with low differences between the measuring instrument and sensor readings. In conclusion, no extra calibration is needed for water level detection in a tank.

6.5. TDS Meter V1.0 Sensor

The Total Dissolved Solids (TDSs) sensor monitors dissolved solids in liquids. It comprises a probe and a daughter board, which processes probe data into analogue signals for ESP32. Calibration ensures accurate readings, as outlined below:
To proceed with the testing and calibration process, refer to Table 8 to connect the TDS sensor’s daughter board to the ESP32.
Formula (22) is used to write code that gives volage values.
V o l t a g e = V R E F A D C R E s o l u t i o n a d c V a l u e
The code is employed to read raw voltage values from the sensor.
The sensor is immersed in known TDS concentrations to collect raw data and is sanitized between tests to maintain accuracy; Table 9 shows the linking of raw voltage readings to known TDS concentrations.
The ESP32 code is updated with compensation, which includes calibration parameters and the derived equation. The captured values are used to create a calibration curve using a polynomial equation to correlate raw voltage readings with reference TDS values. This helps to process voltage measurements and map them to the corresponding calibrated TDS values. TDS measurements are validated against 245 ppm TDS concentration using calibrated code. Testing is repeated and the calibration graph is adjusted if errors are detected.
In conclusion, a reliable, accurate TDS measurement system comes from through testing and calibration, while calibrated code aligns sensor measurements with reference TDS levels.

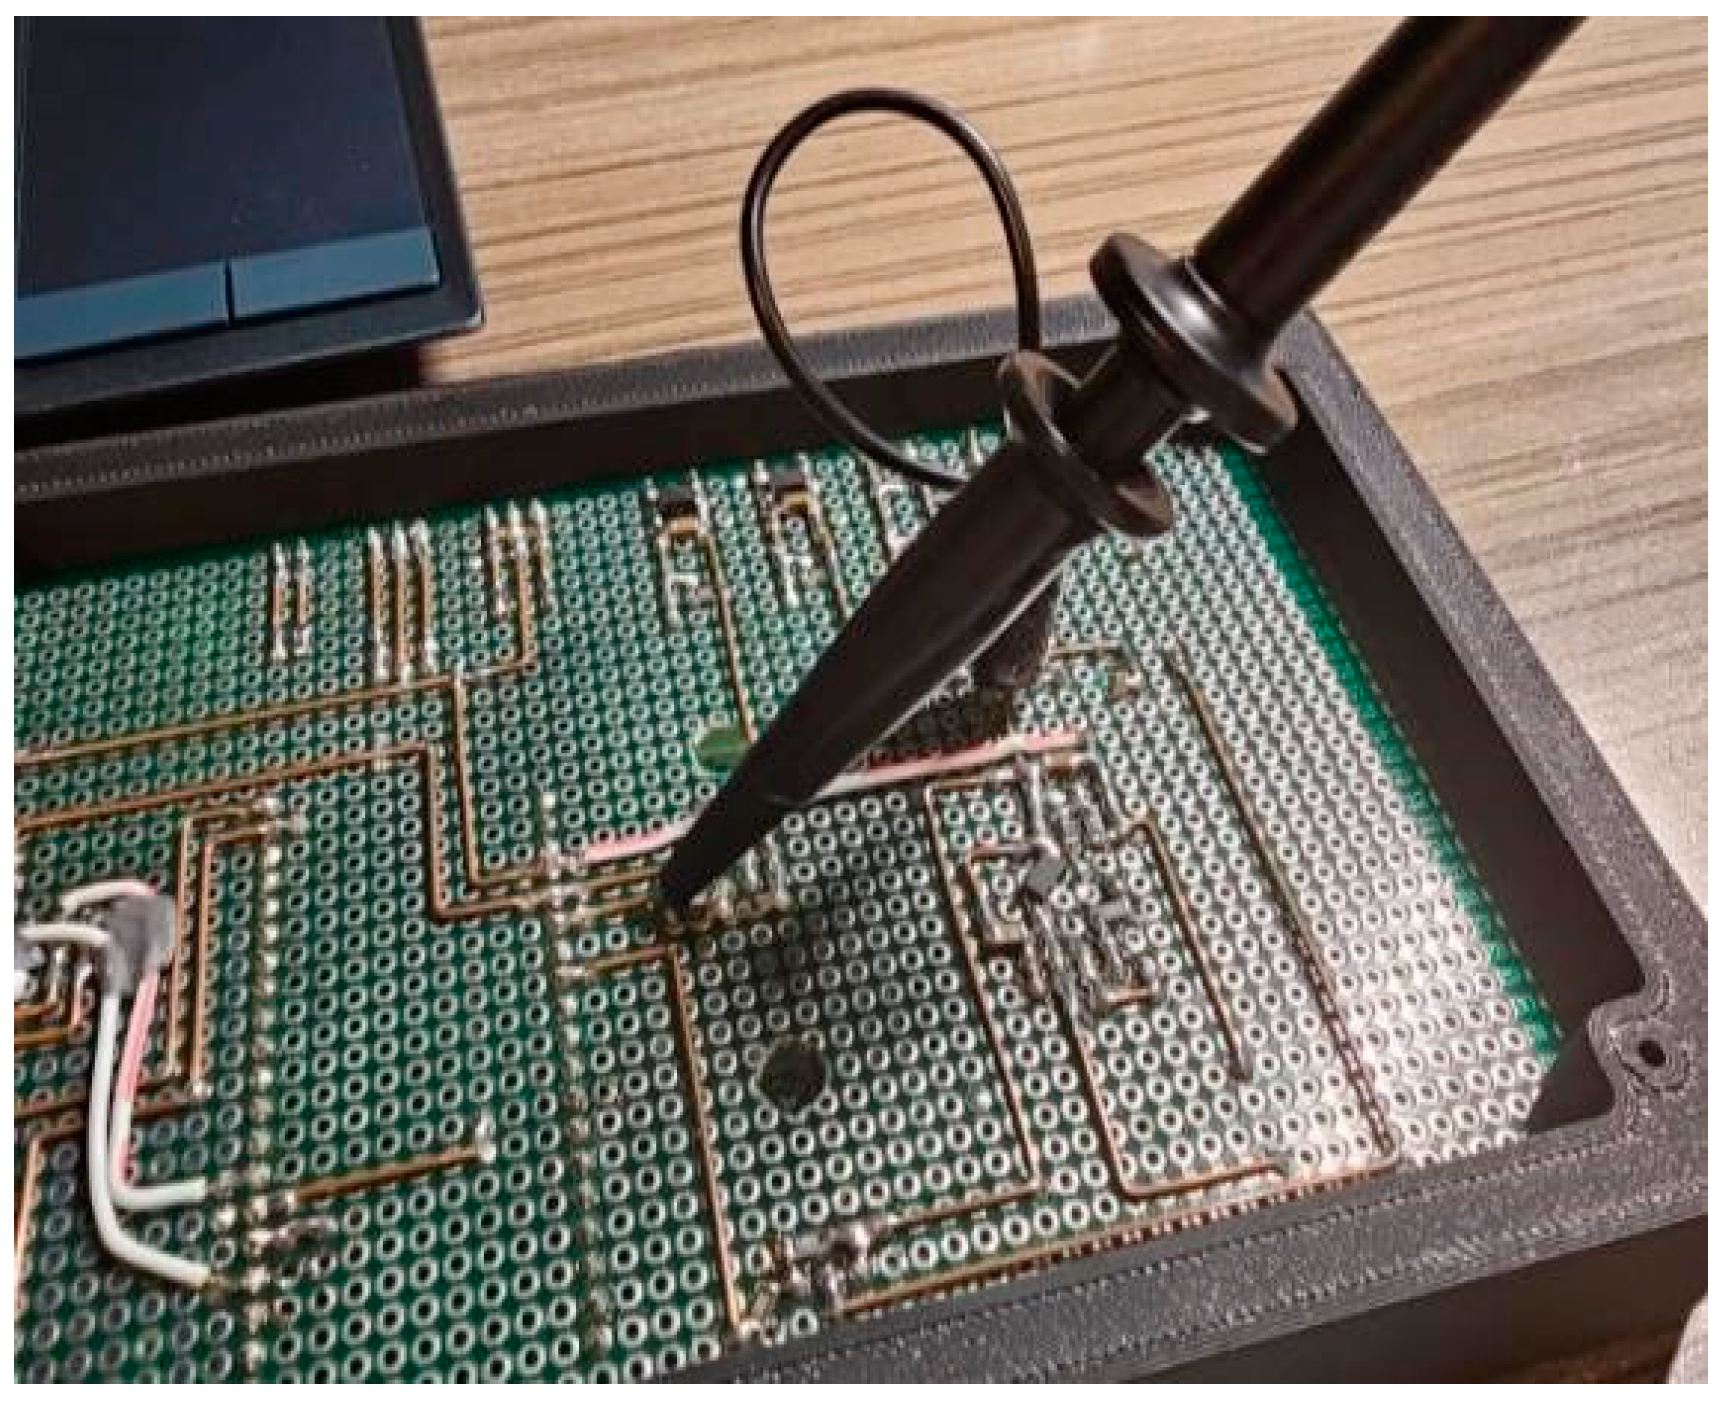
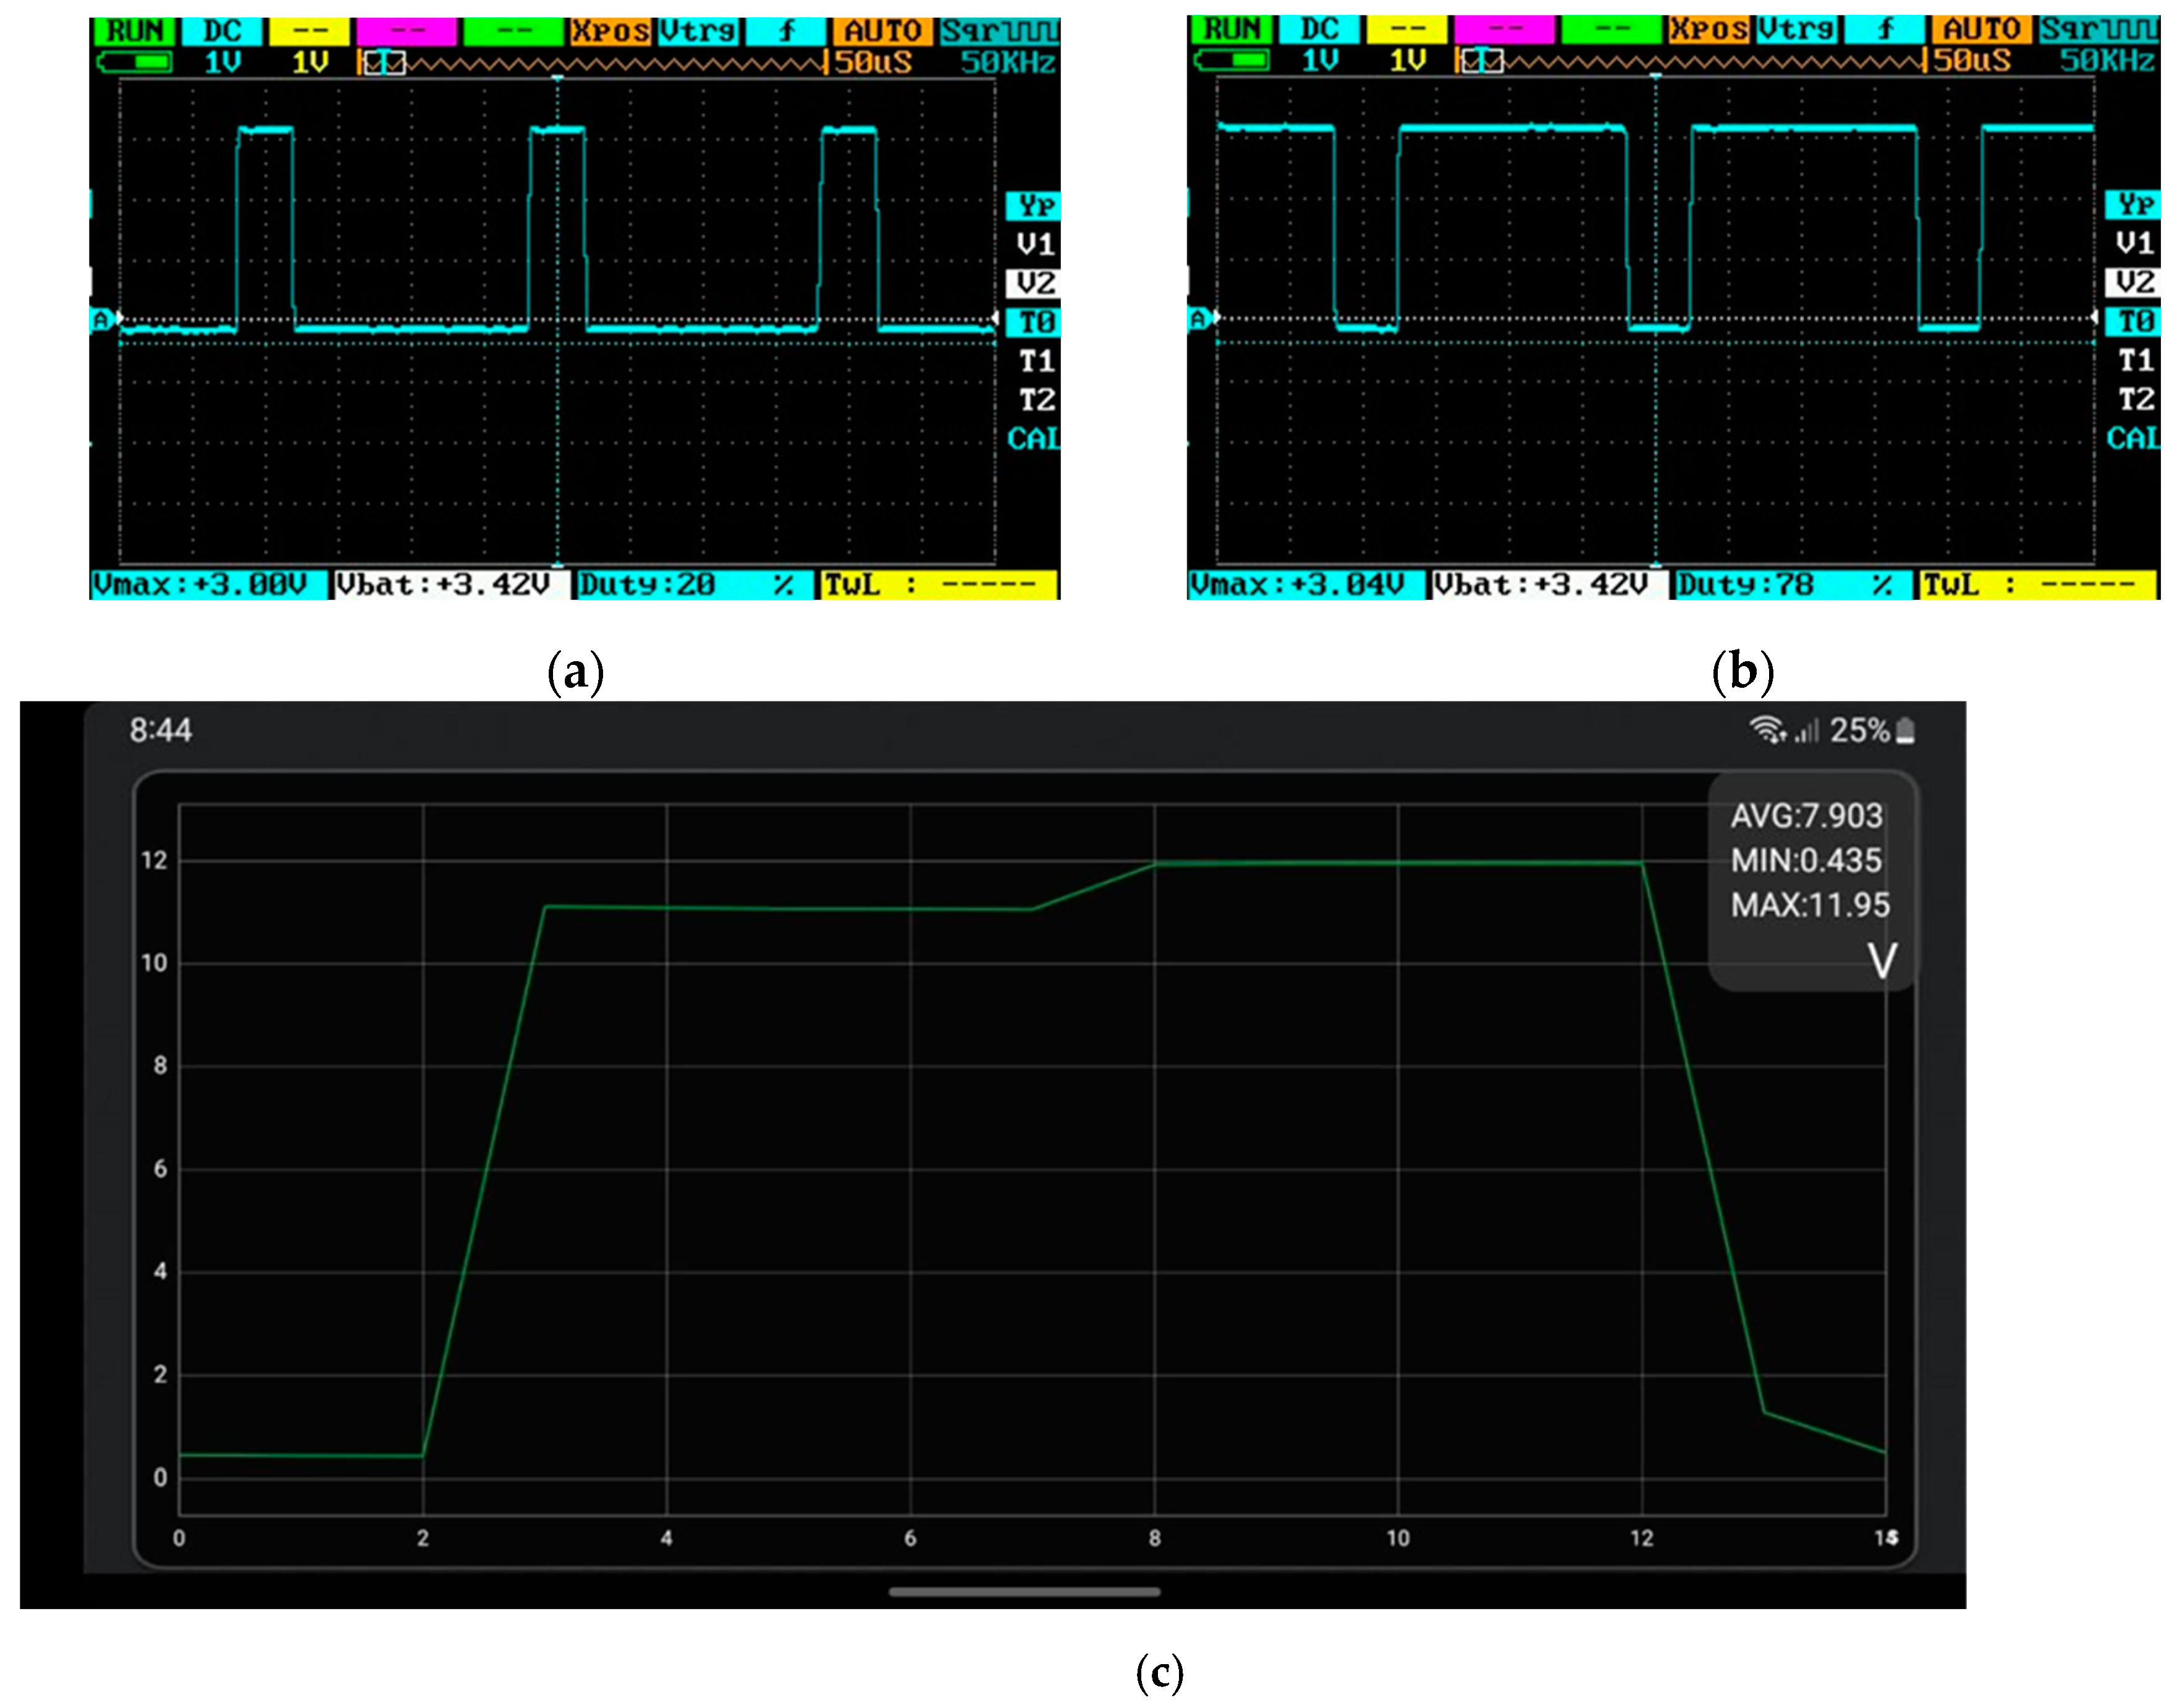
6.6. IRLB3034PBF PWM Motor Controller

Below shows a code to generate a 5 kHz PWM signal with 10-bit resolution from a successfully soldered PWM motor controller. ESP32’s GPIO 15 sends out preset 0%, 20%, and 80% duty cycle loops. As shown in Figure 10, an oscilloscope is attached to the system’s GPIO pin 15 and grounded.
Electronics 13 02033 i001
Figure 11 shows that motor terminal testing indicated a varying voltage from 0 V to 11.5 V, reaching 12 V at an 80% duty cycle, confirming PWM motor controller functionality. Audible changes in motor speed aligned with PWM signal variations, affirming successful testing. The overall measurement results prove that the PWM motor controller operates well and demonstrates robust performance.

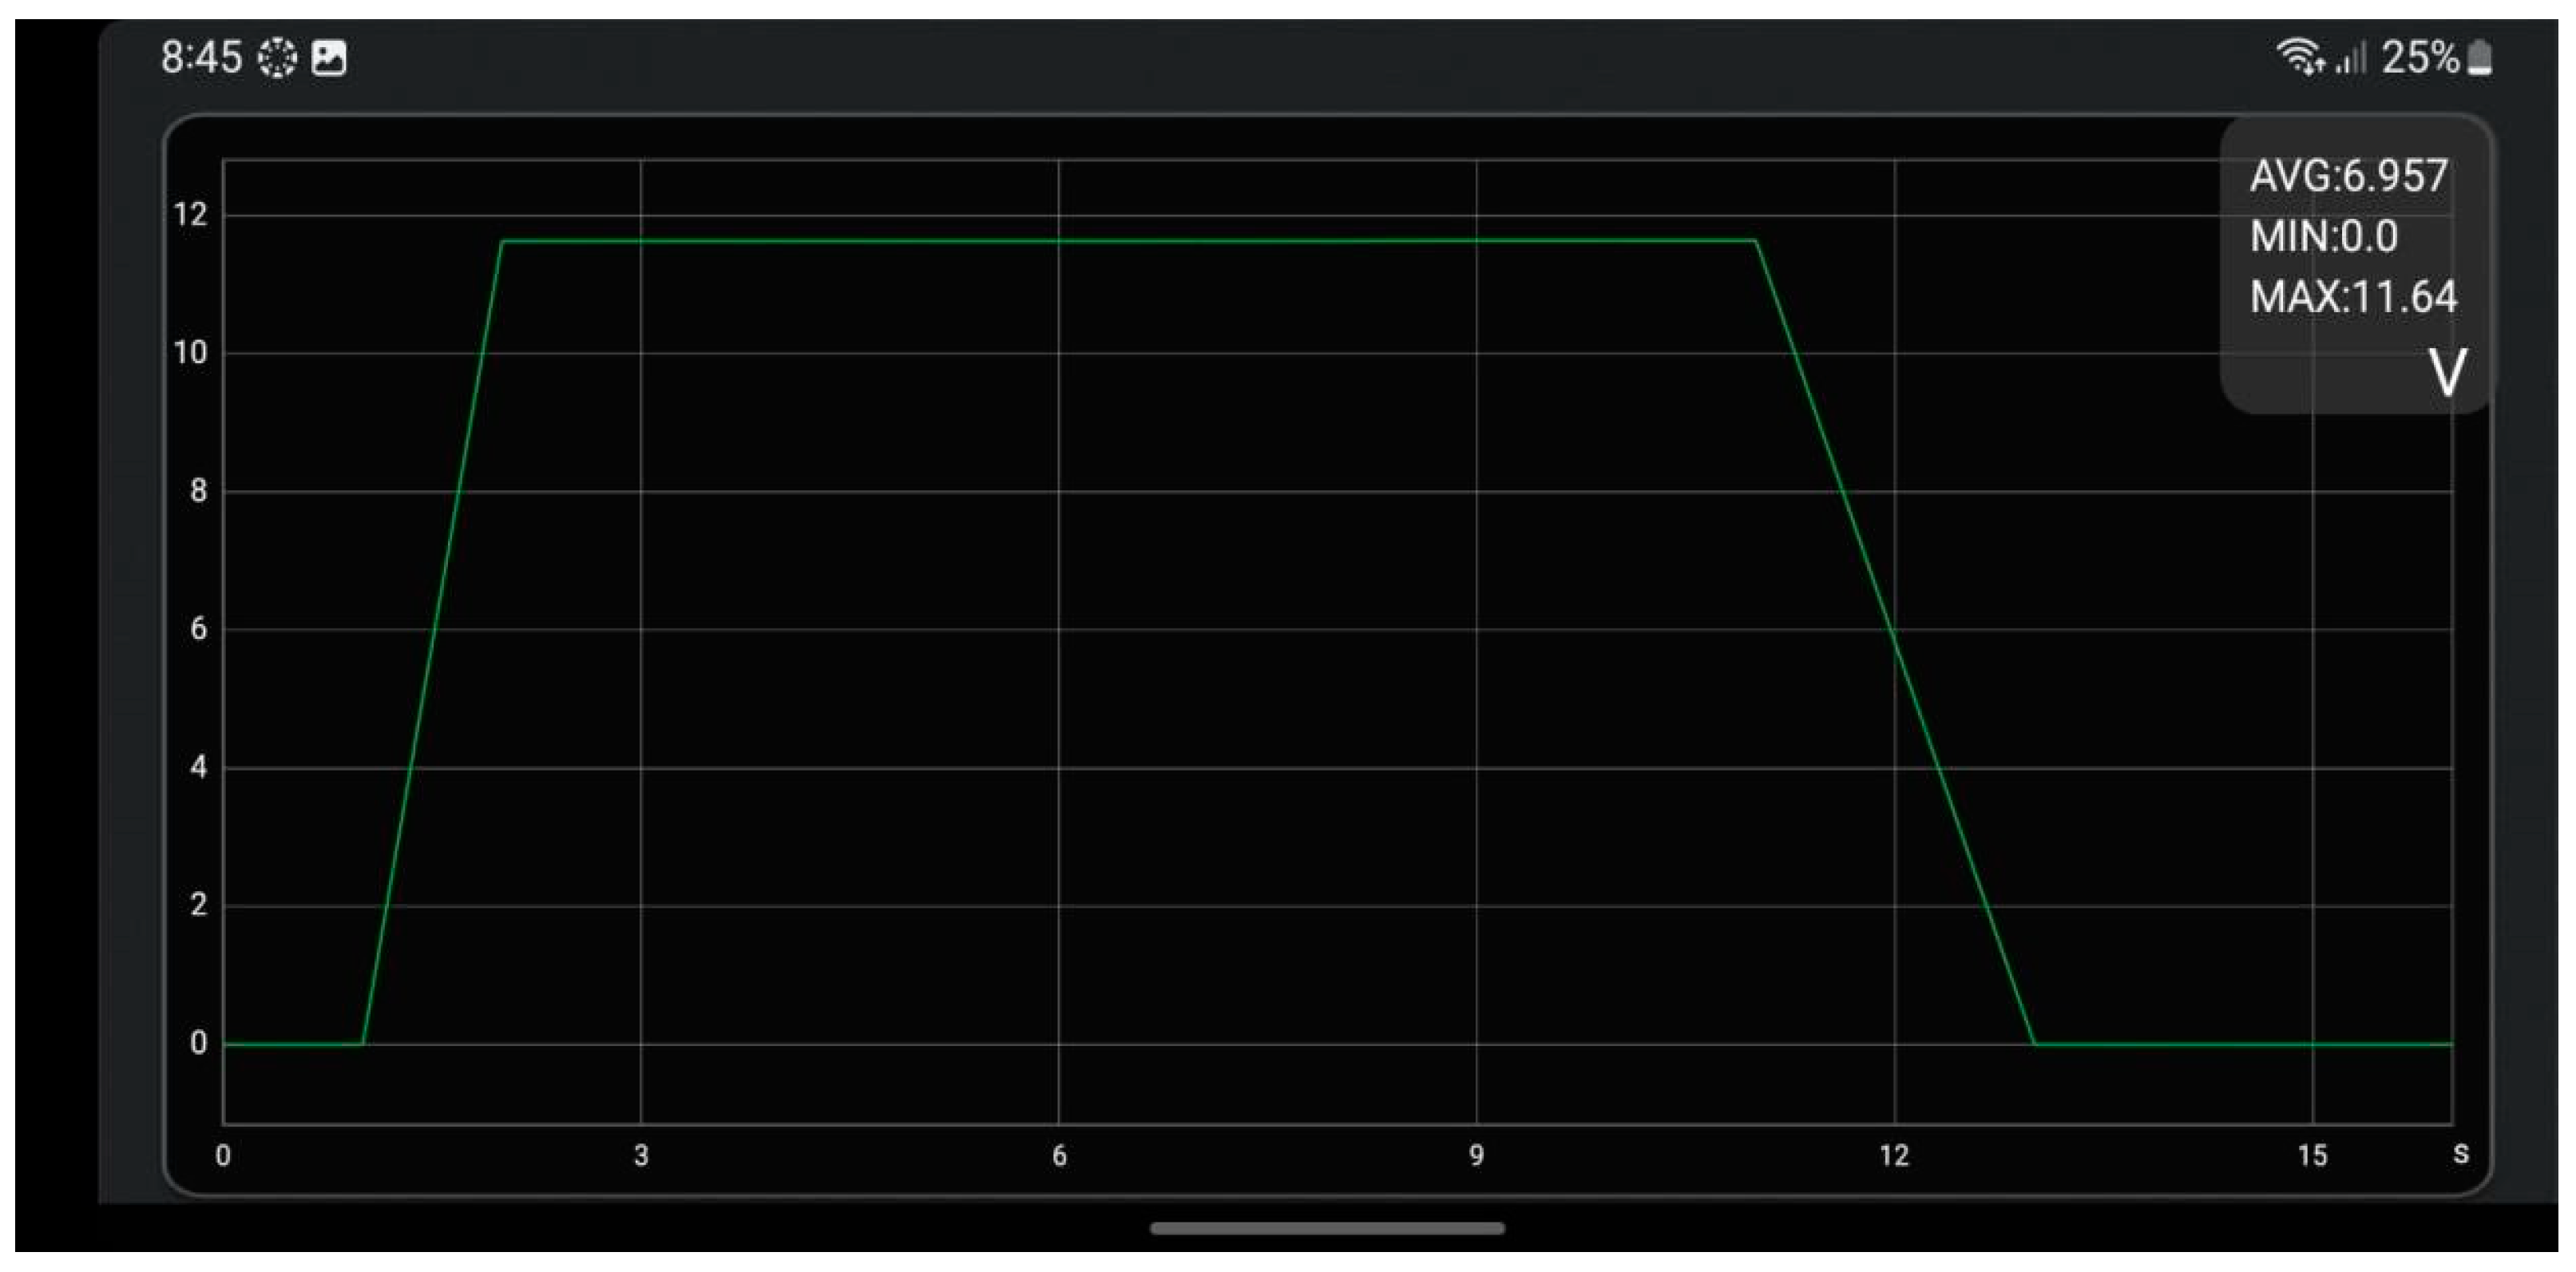
6.7. IRLB3034PBF Solenoid Controller

The code is utilized to test solenoid control. ESP32 outputs 3.3 V for Digital HIGH and 0 V for Digital LOW. The MOSFET output at the solenoid junction is predicted to be 0 V and 12 V.
In Figure 12, we can observe that the system successfully turns the voltage on and off, validating the solenoid control’s correct operation with voltage output. This ensures the system’s ability to manage the required water flow.
A voltage converter is important for the supply of required voltage levels for system components, ensuring compatibility and effective functioning. Circuit input and output voltages are measured at specified locations using a multimeter or oscilloscope, by probing the verified proper voltage levels at the input and output terminals and checking that the converter operates within the predetermined range. Whether the measured voltage is within an expected and tolerable range for proper converter functioning needs to be checked. Deviation from the expected level deviation will negatively impact the overall system performance; thus, it is critical to identify and resolve potential issues.

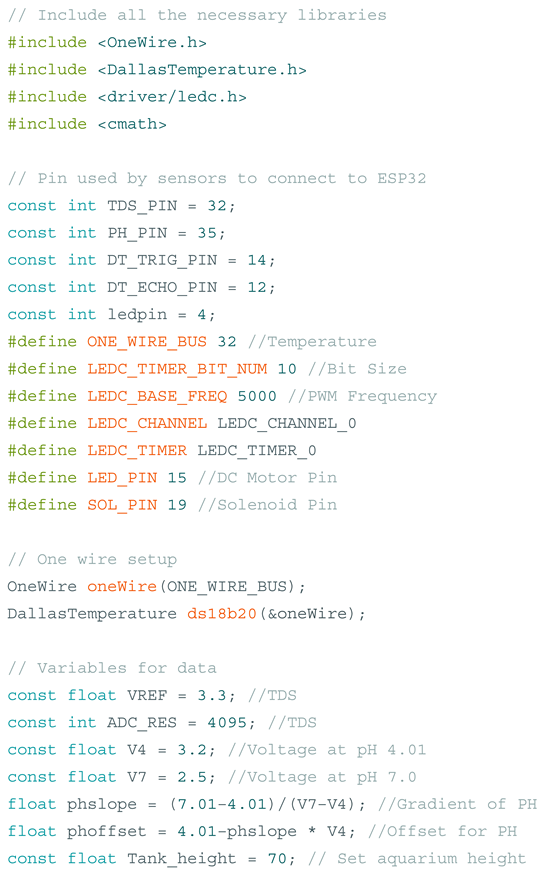
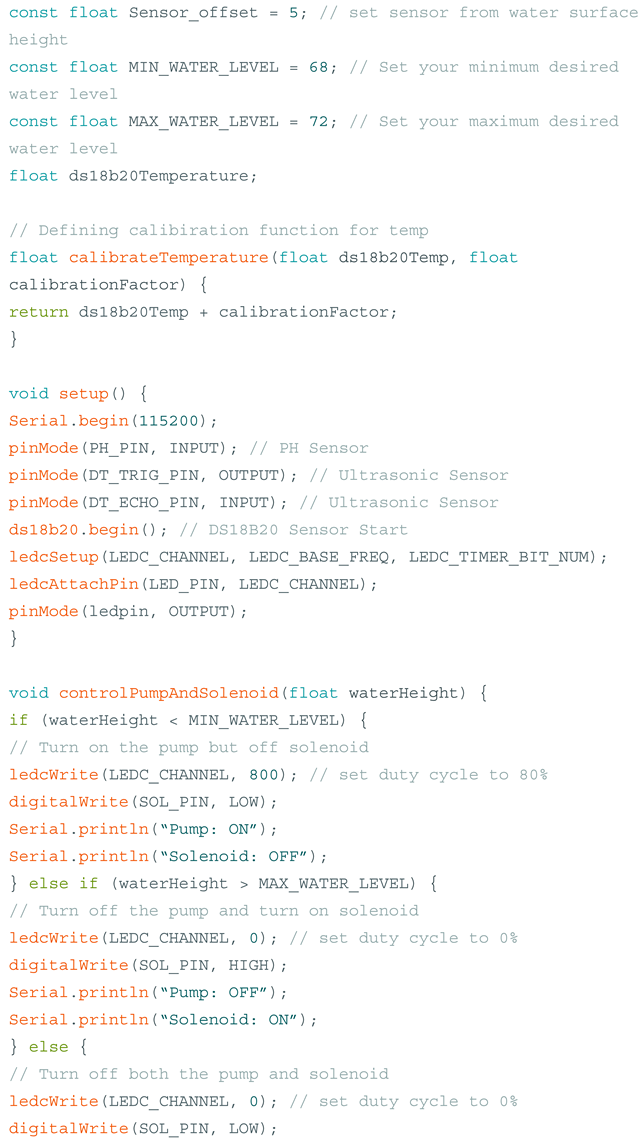
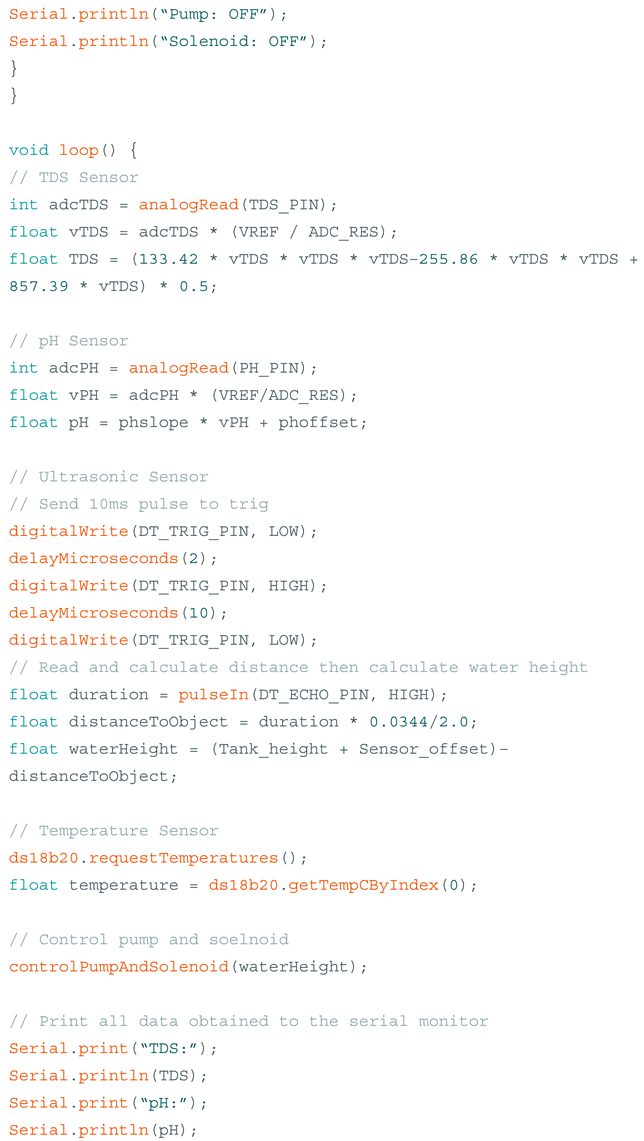
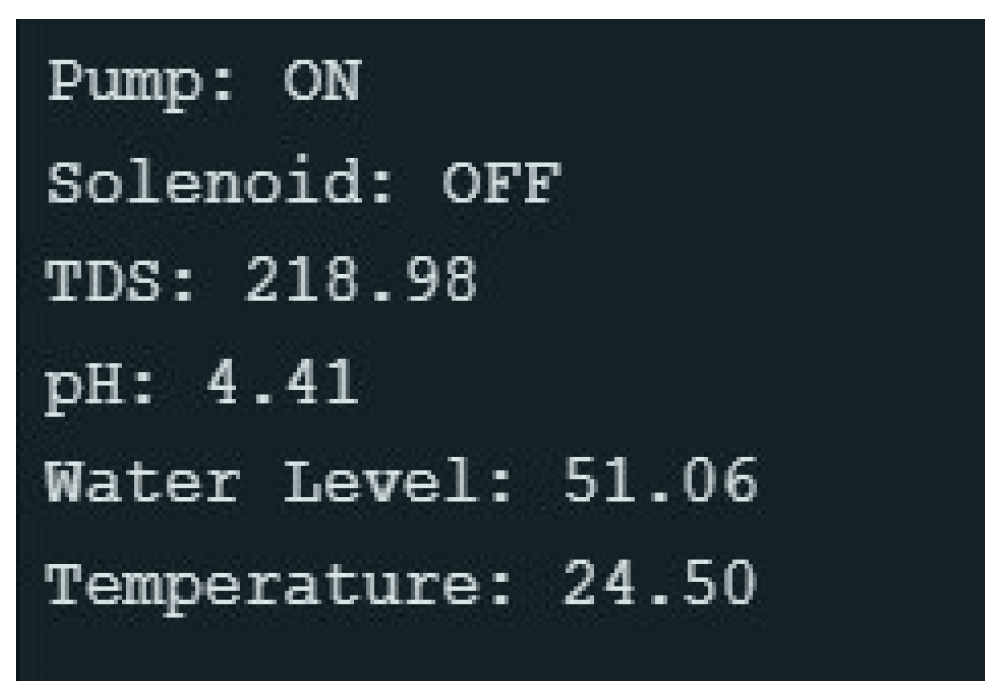
6.8. Sensor Test Final Code

The code below merges sensor functionalities and calibration to obtain accurate data.
Electronics 13 02033 i002a
Electronics 13 02033 i002b
Electronics 13 02033 i002c
Electronics 13 02033 i002d
This gives us the results of all the calibrated code, as shown in Figure 13.
MQTT is now added to ESP32, which manages the motor PWM controller, which manages the solenoid valve and water pump control effectively. The code below shows the WiFi.h package, which allows the ESP32 to connect to Wi-Fi, while the PubSubClient.h library provides MQTT capabilities. WiFi and MQTT libraries are added for communication.
Electronics 13 02033 i003
The code below shows the credentials including the SSID, WiFi password, and the IP address of the MQTT server for WiFi and MQTT servers.
Electronics 13 02033 i004
The code below also shows how the callback() function processes incoming messages from the MQTT server. The motor and solenoid are operated using custom logic callback(), and then arrived message topic is compared to the control groups, the payload value is extracted, and the state is updated accordingly.
Electronics 13 02033 i005
As shown below, the reconnect() segment of the code handles reconnection if MQTT connection is lost from ESP32.
Electronics 13 02033 i006
This part of the code shows the setup_wifi() function, which connects ESP32 to the Wi-Fi network using the provided info. Serial monitor aids in troubleshooting and comprehends the connection process.
Electronics 13 02033 i007
The segment below shows the setup() function, which includes Wi-Fi and MQTT setup. First, setupWifi() is run, followed by MQTT configuration to process messages
Electronics 13 02033 i008
Functionality added to the loop() function checks the MQTT connection and uses reconnect() if not, handles incoming messages, and sends sensor data to the MQTT server. Codes are uploaded to ESP32 and it initializes the variables, pin configuration and PWM signal. It also sends the debugging aid requirement procedure and collects data during the main loop, ensuring appropriate operations, which are shown in Figure 14.
The next phase is Home Assistant interface to display data and operate devices. Figure 15a shows the gauge card after configuration, taking all of the information for sensor data in the previous sections into account. Figure 15b shows the button card for motor and solenoid control by selecting entity and on or off. After the customized dashboard, Figure 15c shows the ESP32 sensor data.

7. Discussion

To ensure the JSN-SR04T ultrasonic sensor data remain accurate over time, it is imperative to periodically revisit the calibration process for fine-tuning. This proactive approach allows for adjustments based on real-world performance deviations, ensuring the sensor maintains its precision in measuring water levels or distances within a given environment. The TDSs (Total Dissolved Solids) measurements can also benefit from future calibration efforts, ensuring the sensor’s accuracy in assessing water quality remains uncompromised. The integration of such calibrated sensors into water management systems transforms the project into a simplified, interactive experience. By making water management more straightforward and user-friendly, the project not only enhances operational efficiency but also promotes a more engaged interaction with the system. The application of calibrated ultrasonic sensors and TDS measurements within this framework paves the way for streamlined, accurate water management practices. This integration underscores the importance of maintaining sensor accuracy through regular calibration, ensuring the long-term reliability and effectiveness of water management solutions [21,22,23].

8. Conclusions

This project introduces an innovative IoT-based aquarium liquid level control system, designed to be remotely accessible through Home Assistant and compatible with smart devices via web and app interfaces. It offers real-time updates and alerts regarding crucial parameters such as water level, pH, and temperature. The system enables automated functions such as water pumping, heating, cooling, and even scheduled weekly water changes, all aimed at ensuring optimal conditions for aquatic life. Throughout the project, meticulous attention was given to the integration of components, rigorous debugging, and comprehensive testing to guarantee seamless operation. The ESP32 microcontroller serves as the central hub, collecting data from various sensors and components, which are then seamlessly transmitted to the Home Assistant platform for monitoring and control. The efficiency and effectiveness of the system are showcased through its integration with a 3D-printed aquarium, demonstrating its practical application in real-world scenarios. Ultimately, this solution offers optimal water management that is not only affordable but also hassle-free and simplified, enhancing the well-being of aquatic life. Looking ahead, future developments will focus on enhancing power and thermal management systems through the implementation of predictive algorithms. This forward-looking approach aims to further improve the system’s efficiency and performance, ensuring continued excellence in aquatic environment management.

9. Future Work

One of the critical targets for the development and further maturation of our IoT-based aquarium management system is its application to a saltwater-based environment for the aquarium. Saltwater aquariums must be able to hold a large variety of inhabitants with a wide variety of unique ecologic needs. They demand precise monitoring and regulation of several critical parameters for health and stability. The idea is to equip even more sensors with measuring abilities necessary for maintaining a saltwater aquarium. These include salinity sensors used for the measurement of the concentration of salts, advanced pH sensors used in the accurate reading of acidity, and redox potential sensors crucial in the oxidative balance accessed in marine environments. Furthermore, we are going to put in sensors for the proper measurement of nitrates, phosphates, calcium and other necessary nutrients and chemicals needed for the well-being of coral and marine invertebrates. Designing our system to encompass these specially designed sensors will significantly enhance the system’s functionality and help advanced aquarists deal with complex saltwater tanks. Careful calibration and testing during the design phase of this component will be required to maintain accuracy and reliability within the saltwater medium. We hope that by addressing these specialized needs, our customers will obtain a comprehensive solution to supporting the thriving lives of diverse aquatic life.

10. User Experience Feedback from Aquarium Hobbyists

Considering our continuous improvement and focus on user-centered design, the feedback from cross-section aquarium hobbyists using our IoT-based aquarium management system was very critical. It was very important for us to consider reflective users that provide valuable insight into the practical applicability and user-friendliness of the system.
  • Positive Feedback:
Most users lauded our system, mainly because of their ability to conduct monitoring in real-time. Most of the received information gives out real-time updates and alerts on parameters of water quality, such as pH, temperature, and liquid levels. This was very helpful, especially to those hobbyists who had limited time; hence, it made their management of the conditions of their aquariums easy.
  • Enhancements Suggested:
The system was generally well liked, although a few improvements need to be made, according to some of the users. The most common one is related to the Home Assistant App user interface, where many said it is a bit tricky to navigate at first. Users also expressed their desire for more customizable setting thresholds so that the alerts can be tailored to their individual needs for either marine or freshwater aquariums.
  • Constructive Criticism:
Some hobbyists have said that the installation process really needs to be much easier, especially if more than one sensor is going to be integrated. They suggest having more detailed information on how to complete the installation, even to the point of offering troubleshooting options, to assist less technically experienced users.

Author Contributions

Conceptualization, methodology, investigation, supervision, resources and software, C.L.K.; methodology, investigation and data curation, C.K.H.; methodology, visualization and formal analysis, N.T.; investigation, supervision, data curation and funding acquisition, Y.Y.K. All authors have read and agreed to the published version of the manuscript.

Funding

This research received no external funding.

Data Availability Statement

The data presented in this study are available in this article.

Conflicts of Interest

The authors declare no conflicts of interest.

References

  1. Ramaiah, N.; DeepaT, P.; Sridhar, S.; Chatterjee, N.; RahulS, N.; Khadka, B. Fish Tank Monitoring System Using IoT. Int. J. Sci. Res. Sci. Technol. 2020, 298–304. Available online: https://consensus.app/papers/tank-monitoring-system-using-ramaiah/967c4098749d50489c422baadead0f49 (accessed on 16 June 2023).
  2. Theagarajan, P.; Padmanaban, B.; Palanisamy, K.; Raja, P.; Poomagan, P. Development of An Automated IoT-based Fish Tank Maintenance Assistive System. In Proceedings of the 2023 7th International Conference on Intelligent Computing and Control Systems (ICICCS), Madurai, India, 17–19 May 2023; Available online: https://consensus.app/papers/development-automated-iotbased-fish-tank-maintenance-theagarajan/1efca537f85c50eea4a46be8d200aa4a (accessed on 16 June 2023).
  3. Likitha, R.; Madhuri, M.G.; Sanjana, N.M.; Manisha, D.; Kavya, A.P. Smart Aquarium Monitoring System Using IoT. Int. J. Res. Appl. Sci. Eng. Technol. 2023, 11, 1526–1529. Available online: https://consensus.app/papers/smart-aquarium-monitoring-system-using-r/00bf1097945157e3a359b675c6ed08ba (accessed on 16 June 2023).
  4. Palconit, M.G.B.; Concepcion, R.S.; Tobias, R.R.; Alejandrino, J.D.; Almero, V.J.D.; Bandala, A.; Vicerra, R.R.; Sybingco, E.; Dadios, E. Development of IoT-based Fish Tank Monitoring System. In Proceedings of the 2021 IEEE 13th International Conference on Humanoid, Nanotechnology, Information Technology, Communication and Control, Environment, and Management (HNICEM), Manila, Philippines, 28–30 November 2021; Available online: https://consensus.app/papers/development-iotbased-fish-tank-monitoring-system-palconit/f6a2da301df755868434b455e6220edf (accessed on 16 June 2023).
  5. Nuanmeesri, S.; Poomhiran, L. Smart Aquarium Water Quality Monitoring and Changing for Ornamental Fish Store Using IoT through Data. 2020. Available online: https://consensus.app/papers/quality-smart-aquarium-water-quality-monitoring-changing-nuanmeesri/aa3f2d01598756518898db5e758cc6dc (accessed on 16 June 2023).
  6. Smitha, J.A.; Shreya Agarwal, K.L.; Hitha, L. Smart Aquarium for Fresh Water Fishes. Int. J. Innov. Res. Adv. Eng. 2023. Available online: https://consensus.app/papers/smart-aquarium-fresh-water-fishes-a/e1a0c50d1f985c86a6f9d51e733fc637 (accessed on 16 June 2023).
  7. Daud, A.K.P.M.; Sulaiman, N.; Yusof, Y.W.M.; Kassim, M. An IoT-Based Smart Aquarium Monitoring System. In Proceedings of the 2020 IEEE 10th Symposium on Computer Applications & Industrial Electronics (ISCAIE), Penang, Malaysia, 18–19 April 2020; Available online: https://consensus.app/papers/iotbased-smart-aquarium-monitoring-system-daud/1bff6b07a0e25fe48884e043bb29692c/?utm_source=chatgpt (accessed on 16 June 2023).
  8. Balasubramani, S.; AakashRam, S.; AkshayBharadwaj, S.; BennetNiffin, N. Smart Aquarium Management System. Adv. Parallel Comput. 2020, 37, 523–527. Available online: https://consensus.app/papers/smart-aquarium-management-system-balasubramani/fcc5cbe02b2d5179934d4fb08e3c82e9/ (accessed on 16 June 2023).
  9. Nuanmeesri, S.; Poomhiran, L. Improvement of Smart Farm by using IoT for Ornamental Fishes and Aquatic Animals Store. Int. J. Innov. Technol. Explor. Eng. 2020, 9, 2201–2206. Available online: https://consensus.app/papers/improvement-smart-farm-using-ornamental-fishes-aquatic/8823ea04632155a897c30cb26420b70c (accessed on 16 June 2023). [CrossRef]
  10. Antonio, D.T.S.; Rivera, J.R.A.; Balid, A.C.N.; Belaos, R.R.P.; Brizuela, A.I.; Caballero, J.A. IoT-Based Water Quality Monitoring and Automated Fish Feeder: Enhancing Aquaculture Productivity. In Proceedings of the 2023 IEEE Region 10 Symposium (TENSYMP), Canberra, Australia, 6–8 September 2023; Available online: https://consensus.app/papers/water-quality-monitoring-automated-fish-feeder-enhancing-antonio/babb9aa01f5f5e72b96b6e6a22e09772 (accessed on 16 June 2023).
  11. Rey, W.P. FishTank: An IOT-based Smart Aquarium Management System for Freshwater Fish Enthusiasts. In Proceedings of the 2023 9th International Conference on Industrial and Business Engineering, Beijing, China, 22–24 September 2023; Available online: https://consensus.app/papers/fishtank-iotbased-smart-aquarium-management-system-rey/aa3a7ff79f2154049befc9a5b18ecf2c (accessed on 16 June 2023).
  12. Arif, M.A.; Reza, M.R.; Mandal, A.B.; Akib, M.A.M.; Shuma, F.M.; Fehir, S.S.M. Towards Developing an IoT-Based Aquaculture Monitoring System. In Proceedings of the 2023 International Conference on Information and Communication Technology for Sustainable Development (ICICT4SD), Dhaka, Bangladesh, 21–23 September 2023; Available online: https://consensus.app/papers/towards-developing-aquaculture-monitoring-system-arif/4bed950d0b5e52ec84f9c261c226ead4 (accessed on 16 June 2023).
  13. Pasika, S.; Gandla, S.T. Smart water quality monitoring system with cost-effective using IoT. Heliyon 2020, 6, e04096. Available online: https://consensus.app/papers/water-quality-monitoring-system-using-pasika/2bf887a523b9521a99a994abfbf6b49d (accessed on 16 June 2023). [CrossRef]
  14. Shaikh, F.A.Z.; Bhaskarwar, U. Smart Aquarium using IoT. Int. J. Res. Appl. Sci. Eng. Technol. 2022, 10, 151–156. Available online: https://consensus.app/papers/smart-aquarium-using-shaikh/406ba1b5d0dd5c18a1a14c9efb0d08e7/ (accessed on 16 June 2023). [CrossRef]
  15. Yasruddin, M.L.; Ismail, M.A.H.; Husin, Z.; Tan, W. Development of Automated Real-Time Water Quality Monitoring and Controlling System in Aquarium. In Proceedings of the 2022 IEEE 12th Symposium on Computer Applications & Industrial Electronics (ISCAIE), Penang, Malaysia, 21–22 May 2022; Available online: https://consensus.app/papers/development-automated-realtime-water-quality-monitoring-yasruddin/b00ddcfc923050069c508ba8ebba1dc0/ (accessed on 16 June 2023).
  16. Makaran, J. Gate Charge Control for MOSFET Turn-Off in PWM Motor Drives Through Empirical Means. IEEE Trans. Power Electron. 2010, 25, 1339–1350. Available online: https://consensus.app/papers/gate-charge-control-mosfet-turnoff-motor-drives-through-makaran/6ac0bc0cf07e5d7ba63b0b61a66f8cc2/ (accessed on 16 June 2023). [CrossRef]
  17. Sengupta, S.J.; Goswami, B.; Das, P.; Sarkar, S. A Noise Immune Double Suspended Gate MOSFET for Ultra Low-Power Applications. Silicon 2021, 14, 5091–5101. Available online: https://consensus.app/papers/noise-immune-double-suspended-gate-mosfet-ultra-lowpower-sengupta/cf2ac0d113495df19368db06cca6a29a/ (accessed on 16 June 2023). [CrossRef]
  18. Covic, G.; Boys, J. Noise quieting with random PWM AC drives. IEE Proc. Electr. Power Appl. 1998, 145, 1–10. Available online: https://consensus.app/papers/noise-quieting-random-drives-covic/74d2b30d2c155f7680d325593a0a8ecd (accessed on 16 June 2023). [CrossRef]
  19. Das, M.; Capell, C.; Grider, D.; Leslie, S.; Ostop, J.; Raju, R.; Schutten, M.; Nasadoski, J.; Hefner, A. 10 kV, 120 A SiC half H-bridge power MOSFET modules suitable for high frequency, medium voltage applications. In Proceedings of the 2011 IEEE Energy Conversion Congress and Exposition, Phoenix, AZ, USA, 17–22 September 2011; Available online: https://consensus.app/papers/half-hbridge-power-mosfet-modules-frequency-medium-das/14d679ac2f1a584796df829b1fbc91bf/ (accessed on 16 June 2023).
  20. Ma, R.; Dai, L.; Qin, G. High-performance nano-Schottky diodes and nano-MESFETs made on single CdS nanobelts. Nano Lett. 2007, 7, 868–873. Available online: https://consensus.app/papers/highperformance-nanoschottky-diodes-nanomesfets-made-ma/3085568c1d34596e9fe1ff4820c6eeac/ (accessed on 16 June 2023). [CrossRef] [PubMed]
  21. Andang, A.; Hiron, N.; Chobir, A.; Busaeri, N. Investigation of ultrasonic sensor type JSN-SRT04 performance as flood elevation detection. IOP Conf. Ser. Mater. Sci. Eng. 2019, 550, 012018. Available online: https://consensus.app/papers/investigation-sensor-type-jsnsrt04-performance-flood-andang/15d4b97ce74f5b7c89b14b1f6dd126f6/ (accessed on 16 June 2023). [CrossRef]
  22. Dswilan, S.; Harmadi; Marzuki. Flood monitoring system using ultrasonic sensor SN-SR04T and SIM 900A. J. Phys. Conf. Ser. 2021, 1876, 012003. Available online: https://consensus.app/papers/flood-monitoring-system-using-sensor-snsr04t-900a-dswilan/9633256366e85784b22409fea07d165c (accessed on 16 June 2023). [CrossRef]
  23. Kumar, A.; Sarangi, A.; Singh, D.K.; Dash, S.; Mani, I. Evaluation of Ultrasonic Sensor for Flow Measurement in Open Channel. J. Sci. Ind. Res. 2023, 82, 1091–1099. Available online: https://consensus.app/papers/evaluation-ultrasonic-sensor-flow-measurement-open-kumar/43ef661478d95ed3b6cfb4db8b9ec8b5/ (accessed on 16 June 2023).
Figure 1. System block diagram.
Electronics 13 02033 g001
Figure 2. Firmware flow chart.
Electronics 13 02033 g002
Figure 3. PWM duty cycle explanation.
Electronics 13 02033 g003
Figure 4. PWM motor controller design.
Electronics 13 02033 g004
Figure 5. Regulator circuitry.
Electronics 13 02033 g005
Figure 6. DS18B20 data graph.
Electronics 13 02033 g006
Figure 7. DS18B20 (a) calibrated at 26 °C; (b) calibrated at 32 °C.
Electronics 13 02033 g007
Figure 8. Hanna instrument (a) 26 °C; (b) 32 °C.
Electronics 13 02033 g008
Figure 9. Ultrasonic acrylic holder.
Electronics 13 02033 g009
Figure 10. Probe.
Figure 10. Probe.
Electronics 13 02033 g010
Figure 11. PWM duty cycle (a) 20%; (b) 80%; (c) voltage.
Electronics 13 02033 g011
Figure 12. Solenoid output measurement.
Electronics 13 02033 g012
Figure 13. Test result.
Electronics 13 02033 g013
Figure 14. Serial monitor output for MQTT code.
Electronics 13 02033 g014
Figure 15. Setting up on HA (a) sensor; (b) motor control; (c) dashboard.
Electronics 13 02033 g015
Table 1. Specification of the MOSFET.
MOSFET ModelRLB3034PBFIRF3205IRLZ44N
VDSS39 V55 V55 V
Drain Current200 A110 A47 A
Resistance at 10 V1.6 mΩ8 mΩ17.5 mΩ
VGS <2.5 V1.9 V–3.9 V1 V to 2 V
Table 2. LM2576T.
Table 2. LM2576T.
Capacitor Value47.0 µF
External Capacitor100.0 µF
Inductor33.0 µH
DiodeVoltage drop < 0.8 V
Table 3. ESP32 connection to sensors.
Sensor ESP32 Pin
TDS Sensor34
PH Sensor33
Ultrasonic Trigger 14
Ultrasonic Echo 12
Solenoid 4
Relay15
Table 4. pH value and voltage reading of sensor.
Sachet pH ValueVoltage Reading of Sensor
4.01 3.2 V
7.01 2.5 V
Table 5. Temperature data points.
Hanna Instruments pHEP+ (°C) DS18B20 (°C)
17.015.5
21.019.81
22.621.44
24.923.5
30.529.06
31.129.94
35.134.06
Table 6. Ultrasonic daughter board connections.
Ultrasonic Daughter Board ESP32
VCC 3V3
GND GND
TRIG GPIO14
ECHO GPIO12
Refer to Table 5 to connect the ultrasonic sensor to the ESP32.
Table 7. Ultrasonic test data collection.
Hanna Instruments pHEP+ (°C) DS18B20 (°C)
17.015.5
21.019.81
22.621.44
24.923.5
30.529.06
31.129.94
35.134.06
Table 8. TDS daughter board connections.
TDS Daughter Board ESP32
GND GND
VCC 3V3
Analog GPIO34
Table 9. TDS raw voltage readings.
TDS Solution Voltage
02.62
3421.91
7001.43
10001.06
Disclaimer/Publisher’s Note: The statements, opinions and data contained in all publications are solely those of the individual author(s) and contributor(s) and not of MDPI and/or the editor(s). MDPI and/or the editor(s) disclaim responsibility for any injury to people or property resulting from any ideas, methods, instructions or products referred to in the content.

