Abstract
Network load in mobile networks is continuously growing, putting pressure on mobile operators to deliver target network performance and user experience. This paper focuses on network capacity improvement through increased spectral efficiency, which can be achieved with overhead reduction by optimizing the demodulation reference signal (DM-RS) configuration, which is one of the channels/reference signals with the largest contribution to overhead. In a high-speed scenario, the Doppler effect noticeably influences the temporal nature of the channel such that a channel interpolation process is required within a slot. However, increasing the number of symbols used for DM-RS has a negative impact on capacity. The Doppler effect was analyzed for various 5G NR configurations of operating frequency and subcarrier spacing (SCS), and various use cases were considered using user equipment (UE) speed as the main parameter. For suitable use cases, the DM-RS configuration was optimized in networks with live traffic. The impact of the configuration change on 5G/NR spectral efficiency, user experience and link adaptation performance was assessed through a deep-dive analysis of active measurements, available performance Management (PM) counters and key performance indicators. An optimized DM-RS configuration is proposed, and it is demonstrated to achieve gains of 5–15%, depending on the metric used, use case analyzed, network load, traffic mix and other relevant network characteristics such as topology and clutter type.
1. Introduction
On average, mobile data traffic has more than doubled every two years for the last 10 years [1]. The current growth rate is approximately 7% per quarter, or 30% year over year. It is forecasted to grow 20–30% per year in most regions in the next few years, with sub-20% growth subsequently. These figures do not include fixed wireless access traffic. The introduction of XR-type services, including augmented reality (AR), virtual reality (VR) and mixed reality (MR), will bring so far unquantified contributions to traffic growth. Simultaneously, the demand for good network performance, high data throughputs and low latency is increasing, which puts pressure on mobile operators to secure sufficient capacity. Network designers can address capacity demands with spectrum addition and introduction of new frequency bands, by increasing network density or by improving spectral efficiency. Spectrum assets are scarce; new bands are typically positioned on higher frequencies with more radio propagation challenges, increasing the cost of deployment. Building new sites, on the other hand, poses huge challenges. In most markets it is difficult to find new locations for macro sites, and small cell deployment is also a challenging and expensive task. In such a situation, achieving optimal spectral efficiency is an important task for mobile operators that directly impacts the total cost of ownership. Each contribution to improved spectral efficiency matters more than ever.
Spectral efficiency is driven by link adaptation performance and the ability to control interference (predominantly inter-cell) [2], MIMO performance in terms of the number of layers used and multi-user MIMO scenario adoption, and finally radio interface time–frequency resource grid organization and related overhead. Concerning overhead reduction and potential spectral efficiency improvements, the DM-RS signal configuration is a good candidate for optimization due to its potentially large contribution to unnecessary overhead and is the subject of research presented in this paper. The main goal was to improve spectral efficiency in commercially deployed 5G/NR networks through the reduction in the allocation of DM-RS signals, without any introduced degradation, within use cases of interest that will not be affected.
In Section 2, an overview of related work by other researchers is provided. Theoretical background is given in Section 3, with a focus on the new 5G/NR radio interface, the main differences compared to the systems of fourth generation (LTE), a deep dive into the DM-RS configuration and current 5G deployments around the world, achieved spectral efficiency and initial settings in commercial networks with a focus on DM-RS configuration aspects. Section 4 analyzes Doppler shifts theoretically and lays the foundation for optimization of the DM-RS configuration for different use cases, network configurations and speeds of terminals. Finally, in Section 5, testing of different DM-RS configurations and analysis of the impact on network performance and user experience from various perspectives is presented, followed by a discussion of the results and a conclusion of the research in Section 6.
2. Related Work
DM-RS signals were introduced with 5G NR systems for the first time; standardization was performed under 3GPP specifications [3] and explained further in the literature [4,5,6]. During the standardization process, the comparative performance of different DM-RS patterns was analyzed, with a focus on throughput and block error rate (BLER) performance in [7] and spectral efficiency and frame error rate (FER) performance in [8] for different configuration and mobility scenarios. Clearly, in the early stages, the main goal was to secure system stability, and the research approach was to design the system for the worst-case scenario, which is reflected in simulations as very high terminal speed assumptions and deployment of the shortest possible SCS (15 kHz) are considered.
A group of papers is dedicated to system design and in particular numerology, frame structure, reference signals, multi-antenna schemes, cell-search and random-access procedures to support high-speed mobility use cases, with a focus on high-speed trains [9,10,11]. Another group of papers [12,13,14] has a similar focus, with the only difference being that some non-terrestrial-network use cases are covered, along with V2X communication with a focus on the design of sidelink. When it comes to reference signal design, the main research direction in these papers is an increase in resource allocation for DM-RS symbols, which enables better channel estimation and network performance for fast-moving terminals. Different metrics are used for benefit assessment; however, in all these papers, the research trend is to address the most challenging use cases, which remain uncommon after several years of commercial deployment of 5G/NR networks, while the opposite direction and reduction in reference signals for better spectral efficiency have not been tackled so far.
Not directly related to DM-RS configuration, but still relevant to the overall picture, is research work conducted in the domain of Doppler effects and modeling, focusing on the analysis of coherence time distribution in [15] and Doppler estimation error performance in [16]. Another domain of research is the application of tools from the artificial intelligence and machine learning (AI/ML) domain in system design, with a focus on channel estimation enhancements [17] while a deep learning-based adaptive DM-RS configuration framework was investigated in [18].
The focus of the research discussed in this paper is an investigation of the negative effects of increased resource allocation for DM-RS and an assessment of use cases where DM-RS may be optimized for improved capacity and better user experience, based on Doppler effects assessment modeled for various configurations and use cases. To the best of our knowledge, there is not much research in this direction with such a systematic approach. In addition to the aforementioned novelty, an important contribution of this research is the implementation of different configurations in commercial networks for various use cases, with a systematic review and deep-dive analysis of the impact of system design on different aspects of network performance and connection quality, based on real measurements in the field.
3. Theoretical Background
3.1. 5G/NR Introduction
The history of mobile communications started more than 40 years ago, with early deployed systems like Advanced Mobile Phone System (AMPS) and Nordic Mobile Telephony (NMT), considered first-generation mobile systems. These systems were limited to voice services. Today, we have fifth-generation systems deployed commercially and sixth-generation systems under development. During the evolution of mobile communication, new use cases were introduced, like data transfers and web browsing supported by Wireless Application Protocol (WAP) in the second generation, video calls in the third and truly mobile broadband experience in the fourth. The fifth generation was designed to support additional use cases, accelerate the Internet of Things (IoT) and boost the Fourth Industrial Revolution. The use cases were categorized into three segments, with different requirements:
- Enhanced Mobile Broadband (eMBB), with requirements for extreme capacity (as high as ), high data rates (peak up to 20 Gbps) and high spectral efficiency (peak for downlink);
- Ultra-Reliable Low-Latency Communications (URLLC), with requirements for extreme mobility (as high as 500 km/h), low latency (as low as 1 ms) and ultra-high reliability (99.99% success probability for up to 32 bytes within 1 ms);
- Massive Internet of Things/Massive Machine-Type Communications (mMTC), with requirements for high connection density (as high as ), low complexity and energy efficiency.
The design of 5G NR systems is based on several principles, as shown in Figure 1. To obtain additional spectrum assets and channels with higher bandwidth, it is clear that the system must operate on higher frequency bands.
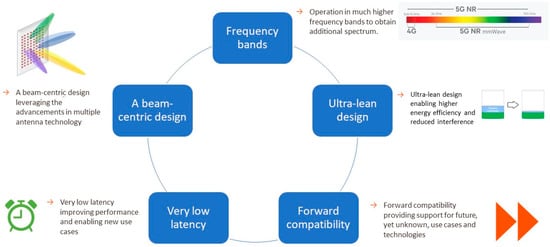
Figure 1.
5G/NR Design principles.
The system was built to support very low latency, which is one of the major requirements. Learning from mistakes in LTE deployments, where always-on signals like Cell Reference Signal (CRS) affected system performance and capacity, the 5G system was designed to be ultra-lean. Both principles are reflected in DM-RS design, which will be discussed in detail in the following sub-section.
Another important design principle embedded from the first day is forward compatibility and flexibility, to support different requirements, not only to address early anticipated use cases segmented in the three domains discussed, but also to cope with new use cases that were not known initially. To meet all requirements, the system relies on advanced antenna systems, with beamforming as a key functionality that requires a whole mind shift towards beam-centric system design, again reflected in the realization of DM-RS signals.
3.2. 5G/NR Radio Interface and DMRS Configuration
Radio interface in 5G NR systems defines a number of reference signals that are used by the physical layer; however, unlike physical channels, they do not carry information originated by higher layers. The main purpose of these signals is related to channel status reporting and estimation and coherent demodulation. Unlike LTE, which relies on always-on cell-specific reference signals, 5G NR uses different reference signals for different purposes, which include demodulation reference signals (DM-RSs), phase-tracking reference signals (PT-RSs), CSI reference signals (CSI-RSs), tracking reference signals (TRSs) and sounding reference signal (SRSs).
Demodulation reference signals are intended for channel estimation and equalization for better decoding and are included in the downlink channels Physical Downlink Control Channel (PDCCH), Physical Downlink Shared Channel (PDSCH) and Physical Broadcast Channel (PBCH), where DM-RS is configured individually for each physical channel. When it comes to PDSCH DM-RS, which is the focus of this research as it has a major impact on system performance and capacity, the main parameters of its configuration defined by 3GPP standard are dmrs-Type, dmrs-maxLength and dmrs-AdditionalPosition, which are provided by higher layers via DMRS-DownlinkConfig message.
To achieve low latency, DM-RS is located early in the transmission, as the first OFDM symbol immediately after the PDCCH, which allows the receiver to obtain a channel estimate early. The parameter dmrs-Type defines whether Type 1 (DMRS Mapping Type A) or Type 2 (DMRS Mapping Type B) is used (Figure 2). The main difference is that in Type1, DMRS is configured on six out of twelve resource elements in the frequency domain during one symbol, or 50% of resources, and the used resource elements are non-contiguous. On the other hand, with Type 2, four out of twelve resource elements, or 33% of resources in that symbol, are used as two pairs of adjacent resource elements. The start position may vary for different antenna ports, to obtain some kind of orthogonality. Most of the 5G solutions available today have a configuration with predefined DMRS Mapping Type A.
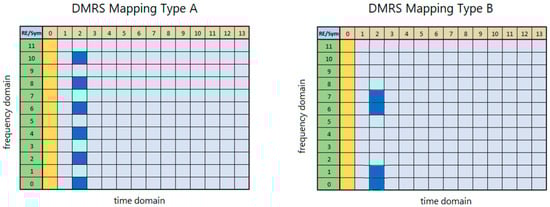
Figure 2.
DM-RS configuration for different mapping types.
Another important parameter is dmrs-maxLength, which defines the length of the DM-RS signal in the time domain and allows values of one or two consecutive symbols. The idea of deploying DM-RS length longer than one symbol is to allocate more DM-RS resources to support the multi-user MIMO (MU-MIMO) scenario, as a single symbol can support up to four antenna ports when DMRS Mapping Type A is deployed or six antenna ports in case of DMRS Mapping Type B. Adding an additional symbol for DM-RS doubles support for antenna ports to eight and twelve, respectively. Equipment manufacturers typically enable a configuration where the allocation of additional symbols happens dynamically, in accordance with needs, thus avoiding additional unnecessary overhead.
The third parameter, dmrs-AdditionalPosition, defines additional symbols to be used for DM-RS in the slot, to cope better with challenging channel conditions caused by Doppler frequency shift primarily for high-speed using mobiles. Parameter dmrs-AdditionalPosition allows setting values of zero, one, two or three. Setting higher values sacrifices peak data throughput and capacity in favor of system robustness. A summary and overview of the impact of various parameter settings on DM-RS configuration are presented in Figure 3 through several examples.
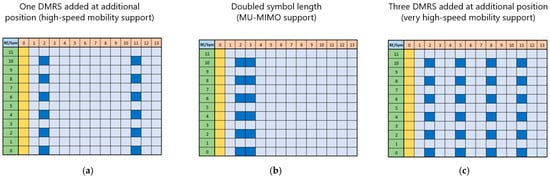
Figure 3.
DMRS configuration examples for different combinations of dmrs-MaxLength and dmrs-AdditionalPosition parameter values: (a) dmrs-Type = 1, dmrs-maxLength = 1, dmrs-AdditionalPosition = 1; (b) dmrs-Type = 1, dmrs-maxLength = 2, dmrs-AdditionalPosition = 0; (c) dmrs-Type = 1, dmrs-maxLength = 1, dmrs-AdditionalPosition = 3.
Non-optimal configuration of the parameter dmrs-AdditionalPosition may cause significant overhead increase and affect spectral efficiency; hence, it will be the main subject of optimization. On the other hand, the reduced number of symbols and insufficient density of DM-RS signals may compromise the quality of the connection for users who move rapidly. Therefore, in Section 4, Doppler shifts will be analyzed in detail to see possible negative effects for individual use cases and to determine the possibilities for optimizing the configuration.
3.3. 5G/NR Network Deployment Today
At the time of writing (beginning of 2024), the 5G market is estimated to have 1.6 billion subscribers, making up approximately 19% of the global population [1], and is predicted to grow to 50% over the next five years. The main 5G use case today is still mobile broadband (MBB) in a non-standalone (NSA) scenario. At the current stage of network maturity, the main focus for further 5G network development and the next steps is still the question of coverage improvement. Achieved latency improvements are still neglectable; network slicing and wider mobile edge computing (MEC) are the main factors for further reduction and introduction of new use cases. A typical initial spectrum deployment scenario with a 10 MHz channel available at low band (700 MHz) and a 100 MHz channel available at a sub-6 GHz band (3.5 GHz) provides a significant spectrum upgrade. However, the first congestions in 5G networks degrading user experience have already been observed, especially in networks widely used for the fixed wireless access (FWA) use case.
From a spectral efficiency performance perspective, improvements achieved compared to LTE networks are evident. As discussed earlier, spectral efficiency drivers are link adaptation, MIMO performance and achieved radio interface overhead. Improvements compared to LTE are obtained mainly through improved link adaptation and MIMO performance, which are often correlated [19]. Link adaptation improvements are obtained through higher usage of 256 QAM modulation, while better MIMO performance in 5G NR is mainly due to a higher probability of achieving spatial multiplexing over three and four parallel layers, which was rarely seen in LTE. Also, spectral efficiency is driven by network load [20], which is lower in 5G NR networks compared to LTE. However, the currently achieved spectral efficiency is still far from the target of 30 bps/Hz. Hence, any improvement that can be achieved today is more than welcome, especially in congested networks. While waiting for spectral efficiency improvements that are expected with wider usage of the multi-user MIMO technique as 5G networks mature, it is worth considering redesigning the radio interface, with the goal of achieving potential overhead reduction and much-needed spectral efficiency improvements.
DM-RS signal configuration was identified as an area for optimization and is the subject of the research presented in this paper. Initial analysis of commercial 5G NR network deployments in several markets showed that the typical initial configuration recommended by RAN vendors and deployed by operators defined one DM-RS added at an additional position, with doubled symbol length, which is the configuration strategy presented in Figure 3b, probably with the intention of remaining conservative and supporting both high-speed mobility and multi-user MIMO. However, the selected strategy clearly may affect system capacity and user experience in terms of downlink throughputs, as the related overhead is probably unnecessarily high. This especially happens in the case of networks heavily loaded by the FWA use case, where low mobility is expected, and the negative effects of Doppler frequency shift are rarely experienced. Finally, initial network design, on top of being cautious, is typically prepared as a one-size-fits-all solution, while in our vast experience in 5G NR network strategy deployment consultancy, network design and performance improvement programs, optimal network performance typically requires highly customized network design and parametrization, taking into consideration mobile operator specifics like network topology, spectrum assets, deployed use cases and traffic mix.
During the standardization process, the comparative performance of different DM-RS patterns was analyzed in [7], where simulations resulting in expected frame error rate (FER) and spectral efficiency for various SCS configurations (15 kHz, 30 kHz, 60 kHz) and relative speeds (40 km/h, 120 km/h, 240 km/h and 500 km/h) pointed to the optimal DM-RS density for various use cases. In moderate mobility scenarios and typical speeds for urban environments of 40 km/h, configuration with one or two DM-RS symbols was advised. This encouraged further investigation, which started with Doppler frequency shift analysis, as detailed in the next section.
4. Doppler Frequency Shift Analysis
The main objective of this section is to analyze Doppler effects in detail to lay the foundation for the optimization of DM-RS configuration, with a focus on the minimization of additional DM-RS symbols, introduced to cope with challenges of channel estimation for high-speed users. As discussed earlier, 5G NR systems were designed to support various use cases with the flexibility to operate in different frequency bands. The focus of Doppler shift analysis is to determine minimal DM-RS density for most typical 5G/NR configurations in terms of operating frequency and subcarrier spacing (SCS), and for different types of user behavior in terms of mobility and related speeds.
The channel time variations due to Doppler effects are closely related to the velocity ( of the transmitter/receiver, where variation between OFDM symbols may become significant when speed is increased. The Doppler effect is mostly modeled by the Jakes model [11,21], the autocorrelation function of which is the first-order Bessel function where is the maximum Doppler shift (calculated as = Fc ∗ v/c), Fc is the carrier frequency, v is the velocity and is the time separation. An autocorrelation channel function above 67% is considered good enough to secure smooth communication (marked in Figure 4 and Figure 5 with a red dotted line). Owing to this model, the interval between two consecutive DM-RSs can be selected to ensure an arbitrary coherence time.
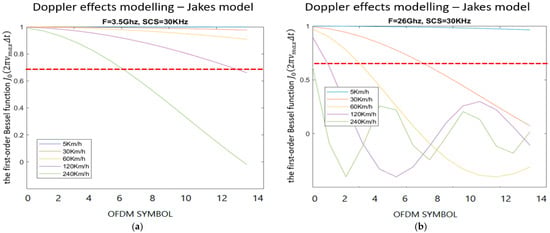
Figure 4.
Impact of vehicle speed channel estimation, Doppler shift modeled with the first-order Bessel function: (a) midband (sub-6 GHz) deployment scenario: Fc = 3.5 GHz, SCS = 30 kHz; (b) millimeter-wave band deployment scenario: Fc = 26 GHz, SCS = 30 kHz.
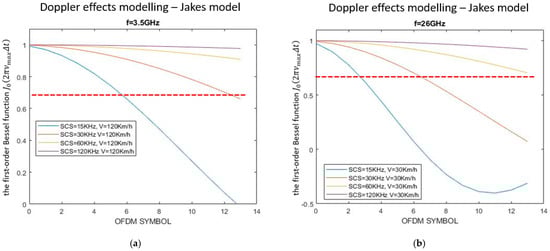
Figure 5.
Impact of subcarrier spacing (SCS) on channel estimation, Doppler shift modeled with the first-order Bessel function: (a) midband (sub-6 GHz) deployment scenario: Fc = 3.5 GHz, v = 120 km/h; (b) millimeter−wave band deployment scenario: Fc = 26 GHz, v = 30 km/h.
Before modeling the impact and severity of the Doppler shift for moving UEs, it can be noticed that Doppler effects are driven by the operating frequency, as well as frame structure and length, which depends on subcarrier spacing (SCS). When it comes to frequencies allocated for 5G, various frequency bands are supported. At the same time, the radio interface in 5G NR systems is designed with high flexibility to address different use cases. One of the key functionalities is support for different numerologies, where SCS can be configured as 15 kHz, 30 kHz, 60 kHz, or 120 kHz.
The first step was to analyze the impact of speed; the Doppler shift was modeled for standard widely adopted carrier frequencies of 3.5 GHz and 26 GHz, the most frequently used SCS of 30 kHz was selected, and speed was varied between values of 5 km/h, 30 km/h, 60 km/h, 120 km/h and 240 km/h (Figure 4). What can be observed in Figure 4 is that for most frequently mid-band deployment (use case: 3.5 GHz, SCS = 30 kHz) and users moving with speeds up to 120 Km/h, the autocorrelation function does not drop below the target value of 67% for all fourteen symbols in one time slot, and the configuration of second DM-RS symbol makes sense for speeds above 120 km/h. At the same time, for millimeter-wave deployment (26 GHz, SCS = 30 kHz) single DM-RS can support only very slow-moving UEs (up to 10–20 km/h).
The next step was to analyze the impact of subcarrier spacing, which varied between values of 15 kHz, 30 kHz, 60 kHz and 120 kHz. The Doppler shift was modeled for midband deployment (Fc = 3.5 GHz) with the assumed speed of 120 km/h, while for millimeter-wave deployment (Fc = 26 GHz), a speed of 30 km/h was selected. What can be observed in Figure 5 is that for most common midband deployments (Fc = 3.5 GHz), even at 120 km/h speed, a single DMRS is enough for SCS greater than or equal to 30 kHz. Furthermore, for millimeter-wave deployment (Fc = 26 GHz), a single DM-RS is enough for speeds below 30 km/h if the selected SCS is above 60 kHz.
The main outcome of Doppler frequency shift analysis is that for 5G NR deployment in the 3.5 GHz band with SCS of 30 kHz, in an area where speeds above 120 km/h are not expected (urban areas, no highways or high-speed trains), reserving a single symbol for DM-RS (dmrs-AdditionalPosition = 0) is a legitimate strategy for optimizing the capacity of the system worth testing. For 5G NR deployments in the millimeter-wave band, DM-RS reduction is still possible; however, there are stringent requirements for supported mobility and SCS configuration of 60 kHz or 120 kHz.
5. DM-RS Optimization, Achieved Network Capacity and Performance Improvements
Optimization of the DM-RS configuration was performed with two mobile operators who deployed 5G NR networks in different markets and with significant differences in deployment strategy, available spectrum assets, deployed use cases and related traffic mixes. An overview of the most relevant information about the two networks is presented in Table 1.

Table 1.
Tested networks overview: use cases, network loads and spectrum assets.
In the first network which was subject to DM-RS optimization and is operating with a total of 140 MHz bandwidth of available spectrum, the dominant use case is fixed wireless access. As offered traffic, driven by traffic profile and number of users, already caused heavy congestion in some hot spots in the network, the main goal of DM-RS optimization activity was to improve capacity.
The second network operates with more spectrum assets and a total bandwidth of 200 MHz, while the dominant use case is mobile broadband. The network is not congested, but the targeted user experience is very high, and the main goal of DM-RS optimization was to improve user experience in terms of peak downlink throughputs. The results of the two DM-RS optimization campaigns will be discussed separately.
5.1. DM-RS Optimization for FWA Use Case and Improved Capacity
As discussed earlier, a DM-RS optimization campaign was conducted in a 5G NR network that serves both FWA and MBB use cases, where the data payload generated by the FWA use case is dominant, while the MBB use case is served in parallel but with significantly lower data payloads. 5G/NR is configured over two channels, on different frequencies (3.5 GHz and 2600 MHz) and with different bandwidths (100 MHz and 40 MHz, respectively). The initial DM-RS configuration had the following parameter values: dmrs-Type = 1, dmrs-maxLength = 2, dmrs-AdditionalPosition = 1.
Optimization of DM-RS was executed on a group of heavily loaded sites, with very high physical resource block (PRB) utilization, reaching values above 70% during busy hours. The main goal of the optimization activity was to achieve capacity improvements in a heavily loaded network, reduce PRB utilization for the same payload and release some PRBs through overhead reduction so additional traffic could be served. Optimization measures included a decrease in the parameter dmrs-maxLength to a value of 1 and a change in dmrs-AdditionalPosition configuration from two symbols to adaptive configuration, allowing the scheduler to decide if a second symbol is needed or not, based on parameters of the connection.
As the dominant use case in the observed network is FWA, with users with limited mobility, the impact of optimization measures was tested mainly through an analysis of key performance indicators (KPIs) obtained from the 5G/NR performance management (PM) system. The focus was on KPIs that measure data payload, amount of data transferred through the network; resource utilization, average PRB occupancy in time; and spectral efficiency, measured as achieved throughput per resource block, calculated as a ratio between data payload in a cell and the average number of used PRBs. All KPI measurements were based on counters collected from the PM system on the cell level, with a granularity period of 1h. The analysis focused on performance comparison during periods of one week before and after the changes were implemented. In addition, a longer period was observed, with a focus on network performance during the first week of three consecutive months, with initial settings deployed during the first month and optimized settings tested in the second and third months.
Figure 6 presents spectral efficiency and PRB utilization one week before and one week after the parameter change was implemented. Before a deep-dive analysis of spectral efficiency, it is worth mentioning that it is a metric that is highly correlated with traffic patterns and data payload. Typically, higher spectral efficiency values are achieved for heavy traffic use cases like FTP or video streaming, while lower spectral efficiency is achieved for bursty traffic like messaging, where the buffer is not full, and the full potential of 4G/LTE or 5G/NR radio interface may not be utilized. For that reason, the data payload is presented in parallel in the lower part of Figure 6a. Weekend days are highlighted since slightly different traffic patterns and higher data payload may be observed compared to the Monday–Friday period.
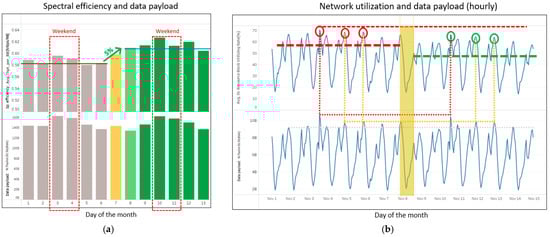
Figure 6.
DM-RS optimization for FWA use case, capacity improvements: (a) spectral efficiency improvements measured by counters from 5G NR performance management (PM) system; (b) PRB utilization changes and data payload in the network.
In a comparison of two weeks, it was found that an improvement of spectral efficiency of approximately 5% was achieved in the second week with optimized settings. Figure 6b presents changes in PRB utilization with hourly resolution. Focusing on busy hours during the day with approximately similar data payload, a decrease in PRB usage of approximately 5–8% may be observed, which is in line with expectations.
Figure 6 clearly shows improvements in spectral efficiency and a decrease in PRB utilization, but also a high level of correlation between observed metrics and traffic patterns. For that reason, the impact of DM-RS parameter changes was observed during a longer period, to avoid the impact of traffic pattern changes that typically happen during the month. For example, the beginnings of months are typically periods with the most load in the network, since user data buckets are full at the beginning of the measurement period, and users consume more data services. For that reason, network performance was observed and analyzed during the first week of three consecutive months. The standard DMRS configuration was kept during November, and new settings were deployed during December and January; the results are presented in Figure 7a. With such an approach, the impact of traffic pattern changes during the month is minimized. To minimize the impact of other seasonal traffic pattern changes between different months affecting conclusions, network performance was observed in parallel for the same period for a control group of sites where DM-RS parameters were not changed, and the results are presented in Figure 7b. It should be considered that January is a specific month, especially during the first week, due to public holidays and significant related impact on traffic changes and users’ mobility, followed by an observed traffic increase in comparison with December for the control group of sites. Improvements in spectral efficiency in the range of 5–10% are observed for optimized sites. In parallel, in the control group of sites, spectral efficiency performance in December is on par with November, while degradation may be noticed in January, probably driven by seasonal traffic pattern changes. In conclusion, DM-RS optimization has undoubtedly improved spectral efficiency by 5–10%.
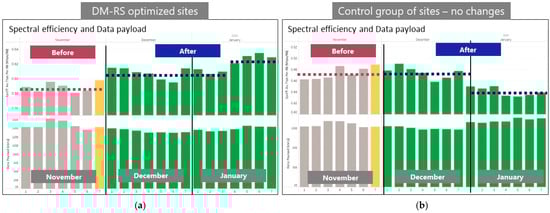
Figure 7.
DM-RS optimization for FWA use case, capacity improvements, longer observation period: spectral efficiency for (a) optimized sites and (b) control group of sites with original settings.
As discussed earlier, the main motivation for DM-RS configuration optimization was to improve the spectral efficiency and capacity of congested networks. From that perspective, it is interesting to introduce another metric into the analysis and observe the behavior of the correlation function between PRB utilization presented on the x-axis and the amount of data transferred through the network presented on the y-axis, for the period before and after the changes in DM-RS configuration (the first week of November versus the first weeks of December and January). The results are presented in Figure 8, showing an analysis conducted in parallel for optimized sites (8a) and a control group of sites where initial settings were unchanged (8b). It can be noticed that when PRB utilization is high (above 30–40%), the optimized 5G NR network can deliver a larger data payload with the same PRB utilization. The gain depends on the load of a cell and increases with the load increase. For PRB utilization of 70%, we will notice 12% more data being transferred through the optimized network compared to initial settings.
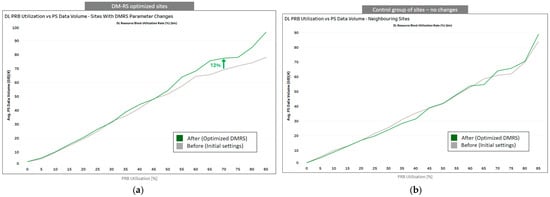
Figure 8.
DM-RS optimization for FWA use case, capacity improvements, data transferred through network vs. PRB utilization: (a) optimized sites and (b) control group of sites with original settings.
5.2. DM-RS Optimization for MBB Use Case and Improved Peak User Experienced Downlink Throughputs
The second DM-RS optimization example is a 5G NR network with a dominant MBB use case. The network is not congested as, unlike in the previous network, the FWA use case is not deployed, and there are more spectrum assets available, with two channels on different frequencies (3.5 GHz and 3.4 GHz), both with a bandwidth of 100 MHz. It is worth mentioning that the traffic management and carrier aggregation deployment strategy that was implemented in this network did not balance traffic between two carriers. The network load and PRB utilization on the primary cell were higher compared to the secondary cell. The main goal of optimization and overhead reduction was to improve peak performance in terms of downlink user throughput. This network had the same initial DM-RS configuration as the first network analyzed in Section 5.1, with initial parameters set to the following values: dmrs-Type = 1, dmrs-maxLength = 2, dmrs-AdditionalPosition = 1. The same DM-RS optimization measures were implemented, with a decrease in the parameter dmrs-maxLength to a value of 1, while the parameter dmrs-AdditionalPosition was, like in the previous case, set to adaptive configuration.
New optimized parameter settings were tested in one city with more than one hundred base stations deployed. Like the tests described in the previous section, an analysis of the impact of DM-RS optimization measures on network performance was conducted based on counters obtained from the 5G NR performance management (PM) system, with a focus on KPIs measuring data payload, resource utilization and spectral efficiency. All KPI measurements were collected from the PM system on the cell level, with a granularity period of 1 h. The analysis focused on performance comparison during three consecutive weeks, where standard network configuration was implemented during the first and third weeks while optimized parameters were configured during the second week (marked with green in Figure 9b). Furthermore, drive test measurements were used in the analysis due to the importance of mobility for the MBB use case. Measurements were conducted on two consecutive days, with standard and optimized setting configurations, where the same drive test route was used during the same hours during the day, and traffic was generated in the same way (long FTP download testing scenario).
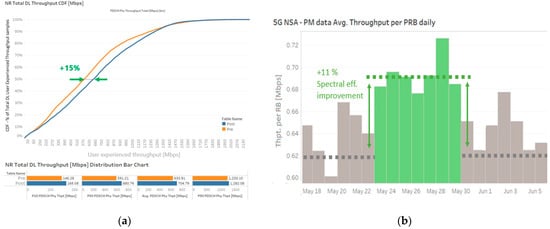
Figure 9.
DM-RS optimization for MBB use case: (a) user-experienced downlink throughput measured by drive test; (b) spectral efficiency improvements measured by counters from 5G NR performance management (PM) system.
Figure 9a presents the cumulative distribution function (CDF) of user experience throughput during two drive test campaigns, before and after parameter changes, where a 15% improvement for median downlink throughput may be observed, with similar gain over different percentiles. Spectral efficiency measured as throughput per RB with the same methodology described in Section 5.1 shows an 11% improvement.
It is worth mentioning that the assessment of spectral efficiency based on counters from the PM system provides pessimistic values compared to drive test results that will be shared later. The main reason behind this is the fact that network statistics are not able to segment heavy traffic use cases (like FTP download or streaming services generated during the drive test) from use cases with bursty traffic where the buffer is not full and cannot utilize the full potential of 5G NR system.
The CDF of spectral efficiency measured from a drive test is presented in the following figure for primary (Figure 10a) and secondary cells (Figure 10b), where significant performance improvement is observed for both carriers, while gains on the less loaded secondary cell seem higher.
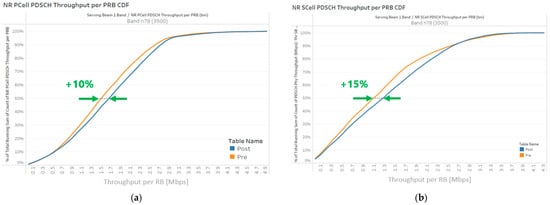
Figure 10.
Spectral efficiency improvements measured from drive tests: (a) primary cell—Fc = 3.5 GHz; (b) secondary cell—Fc = 3.4 GHz.
The impact of DM-RS optimization on spectral efficiency performance in different radio conditions was analyzed through correlation with the used modulation coding scheme (MCS), which can take a value between 0 and 28, where a higher value is used for better radio conditions. The results presented in Figure 11 show that spectral efficiency improvement may be observed regardless of radio conditions, with comparable gains on both carriers.
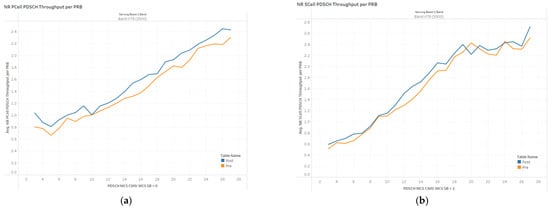
Figure 11.
Correlation of achieved spectral efficiency and used MCS: (a) primary cell—Fc = 3.5 GHz; (b) secondary cell—Fc = 3.4 GHz.
A deep-dive analysis of the impact of DM-RS reduction on link adaptation performance was conducted to assess potential degradation due to channel estimation inaccuracy. The analysis of modulation distribution in two drives presented in Figure 12a did not show major differences. A slight redistribution may be noticed, where usage of best-performing modulation from a spectral efficiency perspective, 256 QAM, decreased from 47% to 44% with the implementation of new settings. On the other hand, a decrease in usage of worst performing QPSK modulation is observed in parallel from 8.7% to 8%. The analysis of block error rate (BLER) performance presented in Figure 12b shows only a minor degradation of 2% that may be neglected.
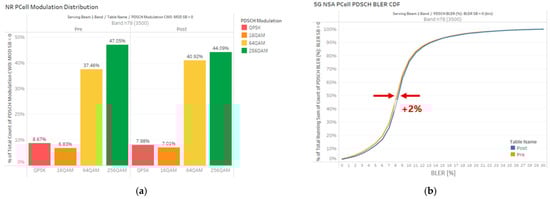
Figure 12.
Link adaptation performance comparison before/after: (a) modulation distribution—QPSK vs. 16 QAM vs. 64 QAM vs. 256 QAM; (b) block error rate (BLER).
The improvement of achieved spectral efficiency brings lower PRB utilization in the system and a positive impact on user experience through the allocation of additional RBs and peak throughput increase. The comparative analysis of PRB allocation during two drives presented in Figure 13 shows higher PRB allocation on both primary and secondary cells in the second drive after DM-RS optimization. Higher gains are seen in situations when the load is higher and fewer PRBs are allocated (11% gain on 20th percentile vs. 2% gain on median).
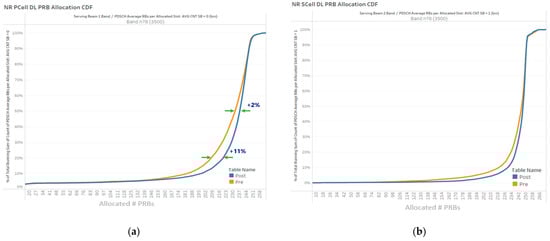
Figure 13.
PRB allocation improvement due to better spectral efficiency, comparison before/after: (a) primary cell—Fc = 3.5 GHz; (b) secondary cell—Fc = 3.4 GHz.
6. Discussion and Conclusions
As 5G networks become more mature and new use cases are being introduced, first network congestions may be observed in some markets, and there is an evident trend of moving focus from securing coverage to ensuring sufficient capacity. 5G systems were designed as ultra-lean, and always-on signals were minimized. Still, further optimization and additional margins of capacity and performance that may be unleashed through overhead reduction are more than welcome. In this paper, potential gains that may be achieved through DM-RS optimization were considered, starting from a technical background and a deep dive into Doppler shift phenomena, through feasible proposals for configuration optimization that will not affect performance, to testing on commercial networks and live traffic and verification of results. An overview of achieved improvements in domains of spectral efficiency, network capacity, user-experienced throughput and resource allocation or utilization is presented in Table 2.
Table 2.
Overview of improvements achieved in tested networks.
The main outcome of the research is findings that the initial configuration settings proposed by RAN vendors seem to be quite conservative, especially for the common deployments today, where a 3.5 GHz frequency band is used with standardly implemented SCS of 30 kHz and the speed of users does not exceed 120 km/h. As per the outcome of the research presented in this paper, there is significant room for capacity improvement to be achieved through DM-RS reconfiguration and parameter optimization. The set of observed key performance indicators depended on the deployed use case and analysis methodology, but in general, improvements were verified in the range of 5–15% depending on the network specifics, such as traffic mix, spectrum assets, network load, topology and deployment strategy. With increasing demands for 5G/NR capacity, operators will search for network improvements in different areas, from network deployment strategy revisions, system reconfiguration and optimization to the deployment of additional capacity that may be achieved through the implementation of even more advanced antenna solutions or network topology densification. The proposed capacity improvement methodology does not conflict with other methods, and the implementation of this method is very efficient with minimal related costs. The next steps in research are to extend the analysis and cover use cases for faster-moving terminals, and to explore possibilities for automatic detection of the presence of users with very high speeds and dynamic adjustments of the DM-RS configuration accordingly.
Author Contributions
Conceptualization, I.T., D.D. and P.I.; data curation, I.T., U.S., D.T. and A.L.; formal analysis, I.T., U.S., D.T. and A.L.; investigation, I.T. and U.S.; methodology, I.T. and D.T.; project administration, I.T.; software, I.T., U.S. and D.T.; supervision, I.T., D.D. and P.I.; validation, I.T.; visualization, I.T.; writing—original draft, I.T.; writing—review and editing, I.T., D.D. and P.I. All authors have read and agreed to the published version of the manuscript.
Funding
This research received no external funding.
Data Availability Statement
The data presented in this study are available on request from the corresponding author. The data are not publicly available due to confidentiality issues and may be provided only with prior approval from data owners, which are mobile operators that Aspire Technology supports. However, as PM systems and counters are quite unified, similar data can be fetched from any other mobile operator where DM-RS optimization is executed.
Acknowledgments
The authors would like to express gratitude to NEC Aspire Technology for various types of support during the project. The authors also would like to acknowledge the support of the Ministry of Education, Science and Technological Development of the Republic of Serbia (contracts 451-03-65/2024-14/200103 and 451-03-66/2024-03/200223).
Conflicts of Interest
Authors Igor Tomić, Uroš Savković, Djordje Tešić and Aleksandar Lorić was employed by the company NEC Aspire Technology Limited. The remaining authors declare that the research was conducted in the absence of any commercial or financial relationships that could be construed as a potential conflict of interest.
References
- Ericsson Mobility Report, November 2023. Available online: https://www.ericsson.com/en/reports-and-papers/mobility-report (accessed on 6 December 2023).
- Tomic, I.; Bleakley, E.; Ivanis, P. Predictive Capacity Planning for Mobile Networks—ML Supported Prediction of Network Performance and User Experience Evolution. Electronics 2022, 11, 626. [Google Scholar] [CrossRef]
- 3GPP, Technical Specification Group Radio Access Network. Physical Channels and Modulation, Standard (TS) 38.211. v17.6.0, Sec. 7.4.1, 3rd Generation Partnership Project (3GPP), Technical Specification, September 2023. Available online: https://www.etsi.org/deliver/etsi_ts/138200_138299/138211/17.06.00_60/ts_138211v170600p.pdf, (accessed on 31 January 2024).
- Dahlman, E.; Parkvall, S.; Skold, J. 5G NR: The Next Generation Wireless Access Technology; Academic Press: San Diego, CA, USA, 2018. [Google Scholar]
- Zaidi, A.; Athley, F.; Medbo, J.; Gustavsson, U.; Durisi, G.; Chen, X. 5G Physical Layer; Elsevier: Amsterdam, The Netherlands, 2018. [Google Scholar]
- Kottkamp, M.; Pandey, A.; Raddino, D.; Roessler, A.; Stuhlfauth, R. 5G New Radio: Fundamentals, Procedures, Testing Aspects; Rohde &Schwarz: Munich, Germany, 2019. [Google Scholar]
- 3GPP TSG RAN WG1 #99 R1-1712244, Evaluation Results of DMRS Design for DL Data Channel; Huawei, HiSilicon: Prague, Czech Republic, 2017.
- 3GPP TSG RAN WG1 #99 R1-1912283, Physical Layer Design for NR V2X Sidelink, Mitsubishi Electric, RAN1 NRAH#1901; Reno, NV, USA, 2019. Available online: https://www.3gpp.org/ftp/TSG_RAN/WG1_RL1/TSGR1_99/Docs/R1-1912283.zip, (accessed on 31 January 2024).
- Noh, G.; Hui, B.; Kim, J.; Chung, H.S.; Kim, I. DMRS design and evaluation for 3GPP 5G new radio in a high speed train scenario. In Proceedings of the 2017 IEEE Global Communications Conference (GLOBECOM), Singapore, 4–8 December 2017; pp. 1–6. [Google Scholar]
- Noh, G.; Hui, B.; Kim, J.; Kim, I. High speed train communications in 5G: Design elements to mitigate the impact of very high mobility. IEEE Wirel. Commun. 2020, 27, 98–106. [Google Scholar] [CrossRef]
- Li, Q.; Sibel, J.-C.; Berbineau, M.; Dayoub, I.; Gallée, F.; Bonneville, H. Physical Layer Enhancement for Next-Generation Railway Communication Systems. IEEE Access 2022, 10, 83152–83175. [Google Scholar] [CrossRef]
- Martín, J.R.; Pérez Leal, R.; Armada, A.G. Design of DMRS schemes for 5G vehicular communications. In Proceedings of the 2021 IEEE 93rd Vehicular Technology Conference (VTC2021-Spring), Helsinki, Finland, 25–28 April 2021; pp. 1–5. [Google Scholar] [CrossRef]
- Pawase, C.J.; Chang, K. 5G-NR Physical Layer-Based Solutions to Support High Mobility in 6G Non-Terrestrial Networks. Drones 2023, 7, 176. [Google Scholar] [CrossRef]
- Garcia, M.H.C.; Molina-Galan, A.; Boban, M.; Gozalvez, J.; Coll-Perales, B.; Şahin, T.; Kousaridas, A. A Tutorial on 5G NR V2X Communications. IEEE Commun. Surv. Tutor. 2021, 23, 1972–2026. [Google Scholar] [CrossRef]
- Wang, S.; Guan, K.; He, D.; Li, G.; Lin, X.; Ai, B.; Zhong, Z. Doppler Shift and Coherence Time of 5G Vehicular Channels at 3.5 GHz. In In Proceedings of the 2018 IEEE International Symposium on Antennas and Propagation & USNC/URSI National Radio Science Meeting, Boston, MA, USA, 8–13 July 2018; pp. 2005–2006. [Google Scholar] [CrossRef]
- Lin, X.; Lin, Z.; Löwenmark, S.E.; Rune, J.; Karlsson, R. Doppler shift estimation in 5G new radio non-terrestrial networks. In Proceedings of the 2021 IEEE Global Communications Conference (GLOBECOM), Madrid, Spain, 7–11 December 2021; pp. 1–6. [Google Scholar] [CrossRef]
- Sun, B.; Wang, Z.; Yang, A.; Liu, X.; Jin, S.; Sun, P.; Tamrakar, R.; Jiang, D. AI enlightens wireless communication: Analyses and solutions for DMRS channel estimation. China Commun. 2023, 20, 275–287. [Google Scholar] [CrossRef]
- Shojaeifard, A.; Mourad, A.; Haghighat, A.; Hemadeh, I. Deep Learning-based DMRS Configuration for MIMO Channel Estimation. In Proceedings of the WSA 2021: 25th International ITG Workshop on Smart Antennas, French Riviera, France, 10–12 November 2021; pp. 1–4. [Google Scholar]
- Tomić, I.; Lukić, Đ.; Davidović, M.; Drajić, D.; Ivaniš, P. Statistical analysis of CQI reporting and MIMO utilization for down-link scheduling in live LTE mobile network. In Proceedings of the 2019 27th Telecommunications Forum (TELFOR), Belgrade, Serbia, 26–27 November 2020; Volume 12, pp. 8–12. [Google Scholar] [CrossRef]
- Tomić, I.; Davidović, M.; Drajić, D.; Ivaniš, P. On the impact of network load on CQI reporting and Link Adaptation in LTE systems. In Proceedings of the IcEtran, Stanišići, Bosnia and Herzegovina, 8–10 September 2021; pp. 612–624. [Google Scholar]
- Jakes, W.C. Microwave Mobile Communications; Wiley: Hoboken, NJ, USA, 1974. [Google Scholar]
Disclaimer/Publisher’s Note: The statements, opinions and data contained in all publications are solely those of the individual author(s) and contributor(s) and not of MDPI and/or the editor(s). MDPI and/or the editor(s) disclaim responsibility for any injury to people or property resulting from any ideas, methods, instructions or products referred to in the content. |
© 2024 by the authors. Licensee MDPI, Basel, Switzerland. This article is an open access article distributed under the terms and conditions of the Creative Commons Attribution (CC BY) license (https://creativecommons.org/licenses/by/4.0/).