1. Introduction
There has been a growing trend toward smart homes in recent years, driven by the increasing diversity and availability of heterogeneous devices and smart objects [
1]. As technology improves, artificial intelligence (AI) and machine learning (ML) are integrated into smart homes to enhance functionality, such as home automation systems [
2], energy management [
3], and home security [
4].
Internet of Things (IoT) is a network of physical devices, vehicles, home appliances, and other items embedded with electronics, software, sensors, and network connectivity, which enables these objects to collect, exchange, and analyze data [
5]. The wide-ranging IoT applications have been adopted and deployed in smart homes in the last few years to increase the ability to monitor and control devices remotely, implemente the automation of various household tasks and systems, and provide the residents with a more comfortable, convenient, energy-efficient, and secure living experience [
6,
7]. The possibilities are endless as new devices and technologies continue to emerge.
However, many IoT devices have limited or no built-in security features and are vulnerable to cyberattacks. Some IoT devices can generate, collect and transmit sensitive data, making them a prime target for cybercriminals. Due to the diversity of devices and technologies involved in IoT, it can be challenging to ensure consistent and effective security across the entire system. Some of the security challenges specific to the heterogeneous nature of IoT include different security standards, incompatibility between devices, vulnerability to attack, and complexity in management. Currently, some existing ML-based IoT IDS approaches [
8,
9] monitor the IoT telemetry data (such as the GPS location values, temperature, and atmospheric pressure) to detect attacks against IoT devices. Other ML-based IoT IDS studies [
10,
11] follow the traditional NIDSs way by considering the network traffic only. It is important to note that these two types of NIDS methods are fundamentally different. The network traffic-based NIDS detects patterns in network traffic to determine whether it constitutes an attack. In contrast, the telemetry data-based NIDS monitors the status of potential victim devices by analyzing their telemetry data as input. While the telemetry data is transmitted in the form of network traffic, the telemetry data-based NIDS does not analyze the behavior of the traffic. Instead, it focuses on the content of the traffic, specifically the current telemetry values. The telemetry data-based NIDS determines whether the devices are under attack, even if the telemetry traffic itself is not necessarily malicious. For instance, as a result of an attack, a temperature sensor may show a temperature that is outside the expected range. In summary, the network traffic-based NIDS focuses on the behavior of attack traffic, whereas the telemetry data-based NIDS focuses on the impact of attack traffic on the device’s telemetry values.
In this work, we aim to combine network traffic-based NIDS and telemetry data-based NIDS together. Since each type of those two NIDS methods only has a single view of the smart home network, it is hard to learn generalized insight knowledge based on the limited view. Therefore, we propose a transformer-based IoT IDS, which detects each flow by taking both the flow’s statistical features and the current IoTs’ telemetry values as input. It is important to note that a smart home network can vary depending on the setup.
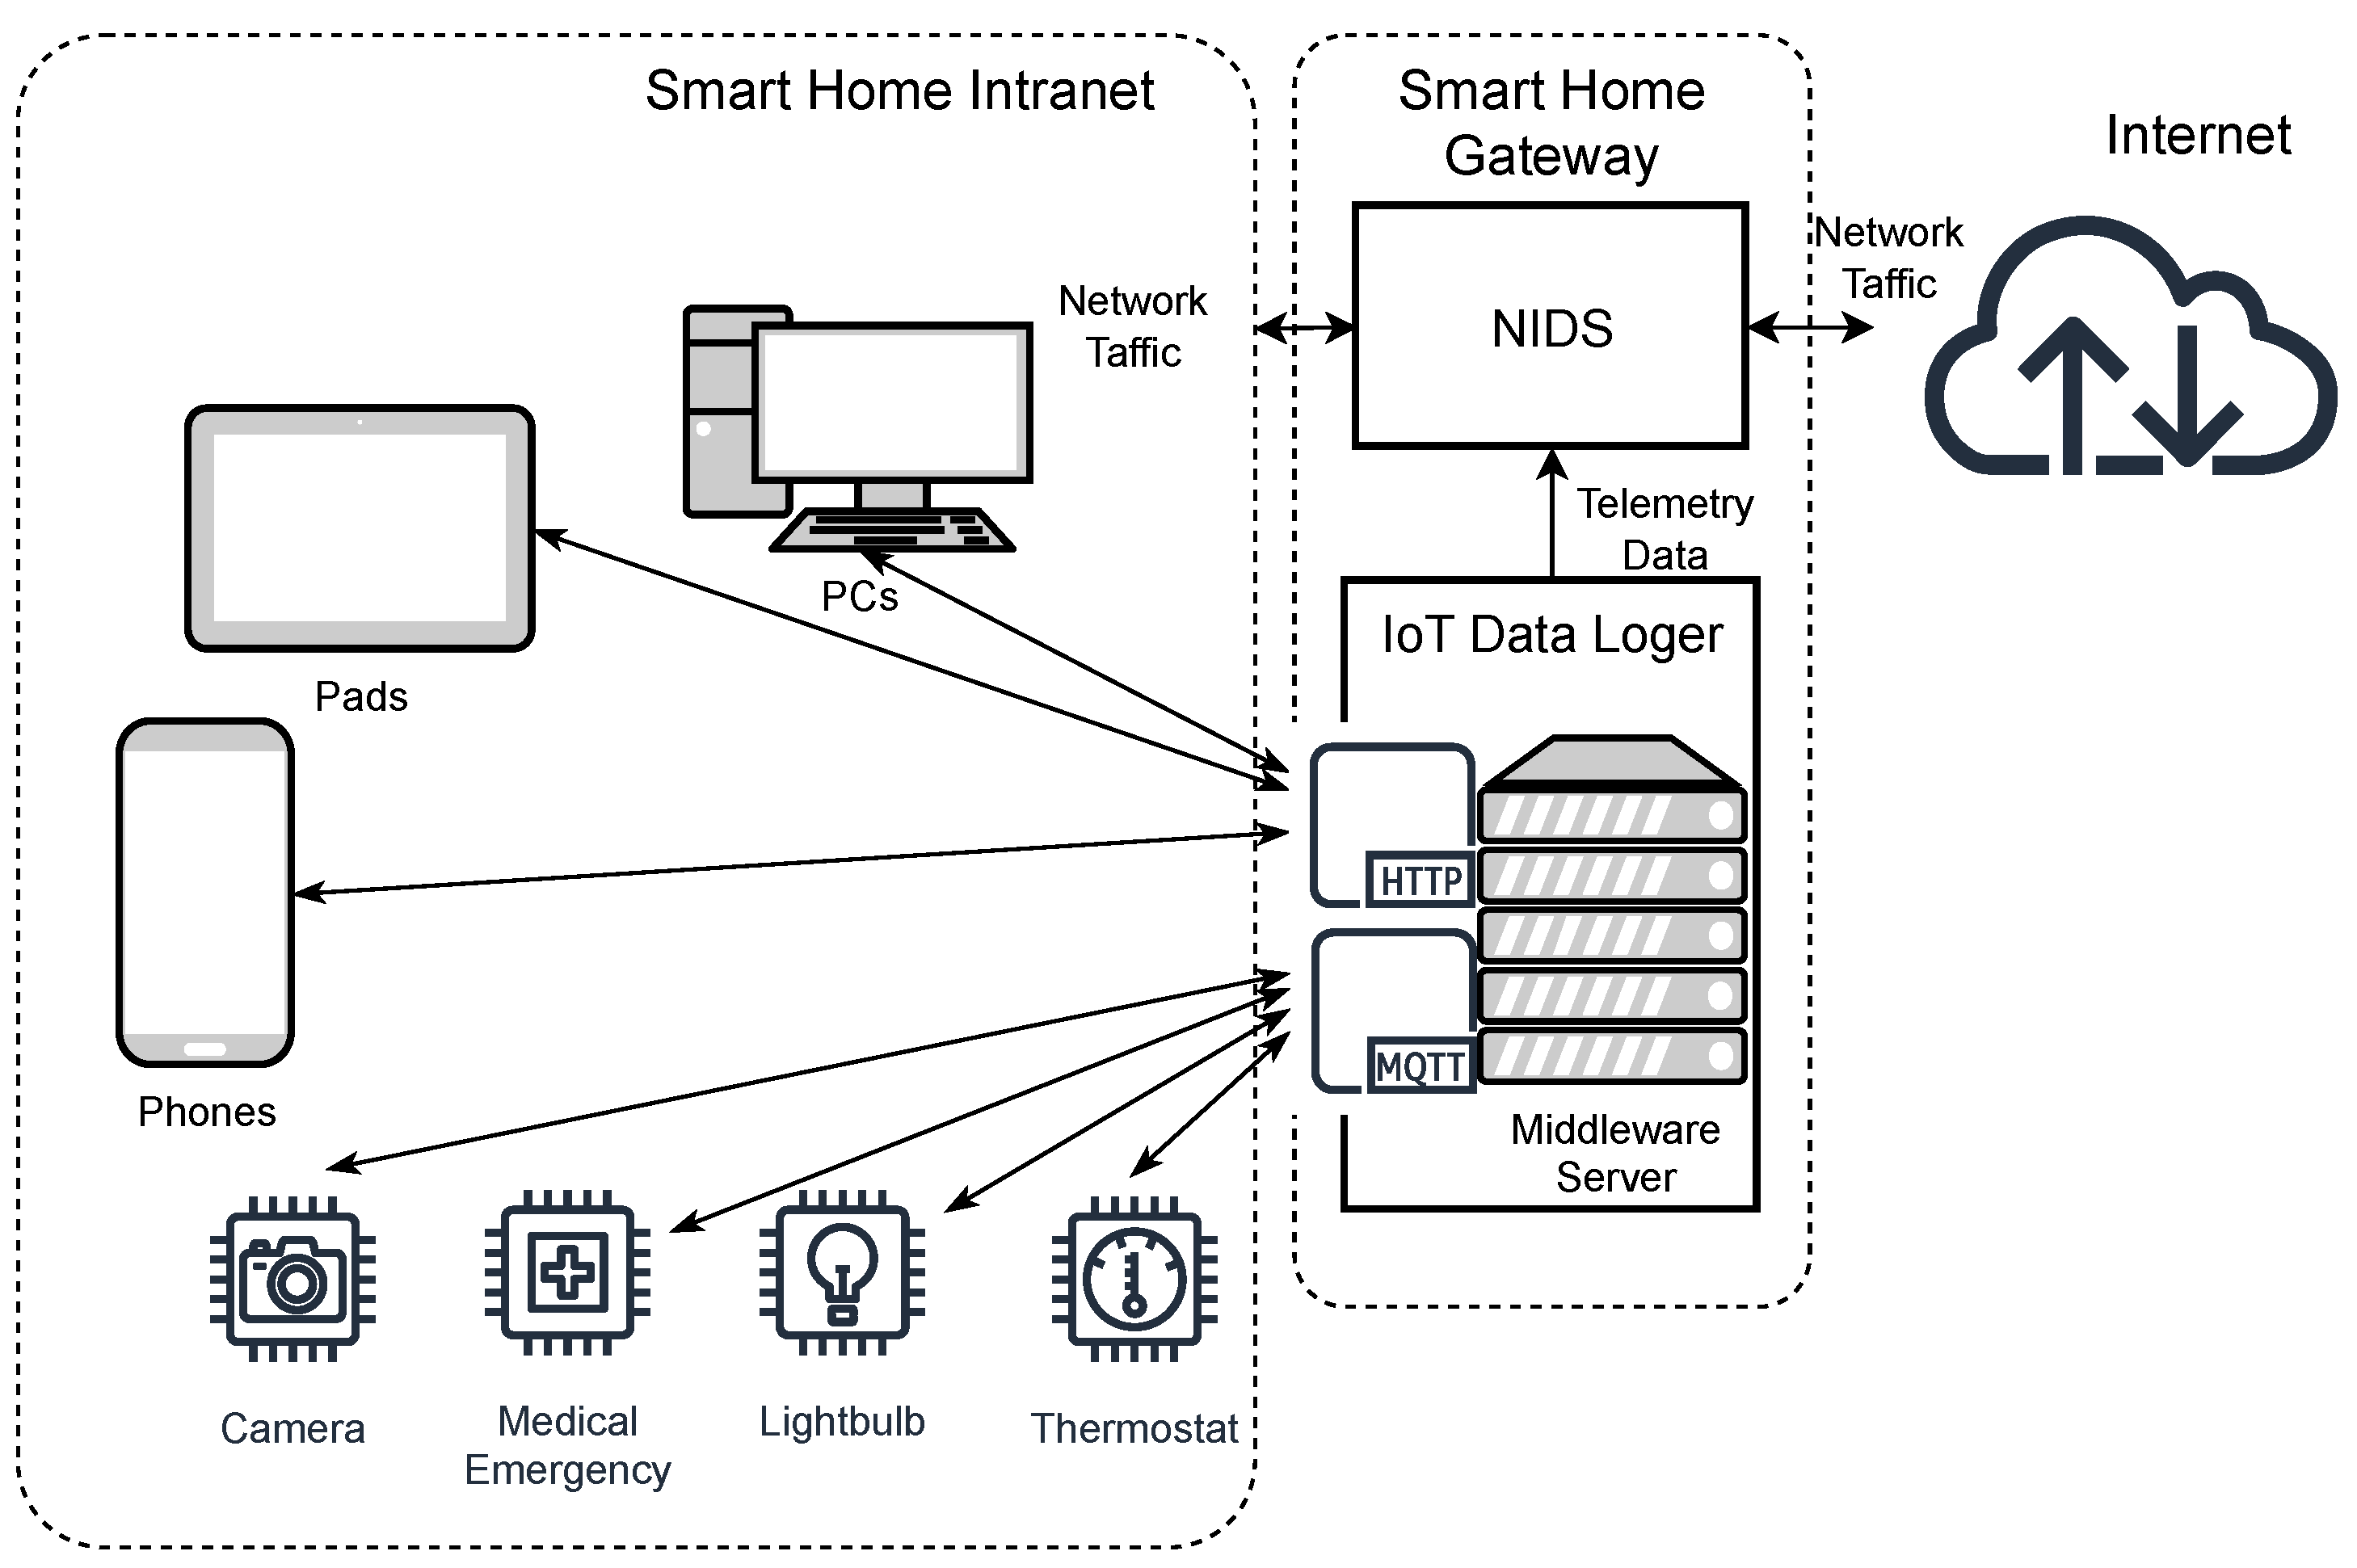
Figure 1 shows an example of a smart home network and illustrates how our NIDS design can be integrated into a smart home network.
As
Figure 1 shows, we set up a smart home gateway to provide a connection between the home intranet and the internet. The smart home gateway consists of a NIDS, which is responsible for securing the whole home intranet, and a middleware server, which runs all IoT services and provides interfaces for users to access IoT services. The IoT services indicate that home members and authorized users can connect their smart devices to the home intranet and control home IoT devices, such as making some coffee, controlling the gate, or checking the temperature and air quality. In the intranet of the smart home, the IoT devices publish their telemetry data to the middleware server through the MQTT protocol (a lightweight, publish-subscribe, machine-to-machine network protocol for IoT message queue/message queuing service), and users can subscribe to those data (such as temperature and moisture) on other devices, such as smartphones or PCs, through the HTTP protocol (an application-layer protocol for web services and other purposes). Nowadays, various cyber-security incidents (i.e., DDoS and ransomware, XSS—Cross-Site Scripting, backdoor, and injection) are launched against different IoT sensors [
12].
NIDS is a beneficial tool for monitoring and securing IoT networks. It can analyze multiple types of data from various sources, such as network packets, system logs, and application data [
13]. The use of deep learning for intrusion detection in smart homes and IoT has been a growing research area, as deep learning algorithms can help detect and prevent malicious activities on these devices. However, traditional DL-based NIDS faces some challenges in using the heterogeneous feature tabular data and working with IoT’s mixed data.
First, it has been well known that the different scales and value types of heterogeneous features challenge the DL-based models [
14]. Heterogeneity is an original property of features in network traffic data for flow-based NIDS. For instance, KDD-99 [
15], UNSW data [
16], and CICIDS data [
17] provide tabular data consisting of different types of features to represent network traffic flow. Those features include both categorical features (such as “Protocols”, “Service”, and “Flags”) and numerical features (such as “Source bytes”, “Average Transport Speed”, and “Flow duration”).
Second, current NIDSs may face compatibility issues in integrating and analyzing data from various data sources in IoT scenarios. Booij et al. [
18] demonstrated the relevance of data set heterogeneity for effective intrusion detection in IoT environments. They proposed a heterogeneous IoT network architecture, which consists of three components: “Edge Layer”, “Fog Layer”, and “Cloud Layer”. For the IoT NIDS task, the heterogeneity of IoT brings mixed data sources to NIDS models. Moreover, traditional network data collected in the smart home gateway, and distributed IoT devices will also generate telemetry data, which will be recorded in the IoT middleware server. If IoT devices are being targeted, their telemetry sensor values can indicate an anomaly trend that can be employed for detecting intrusions. For instance, if a smart fridge is being attacked, the temperature sensor readings inside it may display an unusual pattern, either too high or too low, signaling an intrusion. In order to detect IoT attacks, smart home NIDS should monitor all traffic flows and telemetry data, but the network data are collected in terms of traffic flow, and the telemetry data of IoT systems is recorded in terms of time. The NIDS operates on a per-flow basis, while telemetry data are recorded based on time. As a result, longer network flows can have several telemetry data records, whereas shorter ones may not have any, leading to what is known as a missing sensor record. Therefore, the mismatch of mixed data sources will result in serious partial data missing in the combination of multiple data sources. It is important for ML that the learning model receives a fixed-format input for each detection. In our method, both network flow data and IoT telemetry data are included as parts of the input. Thus, if there is a mismatch between the two, it can result in incorrect input for the ML model.
In order to address the mentioned challenges of heterogeneous features and mixed data sources, we propose a Transformer-based IoT NIDS method. The overview of the proposed method workflow is shown in
Figure 2. The multi-head self-attention mechanism [
19], which is the core component of Transformer, can learn adaptive embedding for both categorical and numerical features. Compared with traditional ML/DL methods, our method can match the state-of-the-art performance on binary detection tasks. Further, we evaluate our method on the ToN_IoT dataset for multiple-class detection. The results show that our method can efficiently distinguish different types of malicious behaviors. Finally, we test our method on the combination of mixed data sources. We use the network data source and IoT telemetry data source to simulate smart home scenarios. Our method can achieve better performance on mixed data sources than using network data only, even if there is a large amount of “NaN” value in the IoT telemetry part of the combined data. The results prove that our method has good robustness on mixed data in the aspects of both feature heterogeneity and source heterogeneity.
We summarize our main contributions as follows:
Proposing a Transformer-based IoT NIDS method. The method includes a data processing algorithm for combining IoT data with network traffic data, and an FT-Transformer-based model can adaptively learn from heterogeneous inputs.
Evaluating our method on the ToN_IoT dataset. The evaluation consists of the binary and multiple classification performance of our method on network traffic data. Further, we evaluate our method with the combination of network and IoT telemetry data. To the best of our knowledge, this paper is the first to use the extra IoT data and network data of the ToN_IoT dataset at the same time.
The results show that our method can match the performance of the state-of-the-art methods with 97.95% and 95.78% detection accuracy for binary and multiple classifications on pure network data. The additional results show that the extra IoT data can enhance classification performance to 98.39% (+0.44%) and 97.06% (+1.28%), respectively.
The remainder of this paper is organized as follows, background and related work are introduced in
Section 2.
Section 3 introduces the dataset, and the design of the corresponding data processing method.
Section 4 describes the architecture of the transformer-based IoT Intrusion Detection system. The evaluation results and analysis are shown in
Section 5. Finally,
Section 6 presents our conclusion and future work.
3. Dataset and Data Processing
In this section, we introduce the adopted ToN_IoT dataset and illustrate the data processing modules for pure network data and the combination of network and IoT data.
3.1. Dataset ToN_IoT
The ToN_IoT dataset is the new generation of Industry 4.0/Internet of Things (IoT) dataset [
18], which is collected from a systematic testbed in a lab environment. The ToN_IoT includes mixed data sources, such as sensor data, network data, and log data, which are collected from the same realistic and large-scale network environment. Such heterogeneity property of the ToN_IoT dataset can reflect the characteristics of the IoT environment.
In this work, we utilize both network and IoT telemetry data in the ToN_IoT dataset to represent the smart home NIDS scenario. For the pure network traffic data, 10 types of network traffic are included: which are Normal Flow, Scanning Attack, Denial-of-Service (DoS) Attack, DDoS Attack, Ransomware Attack, Backdoor Attack, Injection Attack, Cross-Site Scripting (XSS) Attack, Password Attack, and Man-in-the-Middle (MITM) Attack. In order to classify IoT attacks, 43 features are extracted to illustrate each flow. According to the types of carried information, all features are divided into 6 sub-sets, which are connection activity features, statistical activity features, DNS activity features, SSL activity features, HTTP activity features, and violation activity features. The specific training and testing sets used in the paper are the officially published sub-set of ToN_IoT. This sub-set includes 300,000 normal flows and 20,000 flows for each class of attack, except the XSS attack, which only has 1043 flow records. For the purpose of training and testing the ML model, this sub-set is randomly split into two parts with the ratio 0.6/0.4.
The ToN_IoT dataset also provides IoT sensor data, which is sent from IoT devices, to study the relevance of dataset heterogeneity for effective intrusion detection in IoT [
18]. The IoT telemetry data [
12] are generated in the same IoT environment by IoT devices, such as Fridges, GPS Trackers, Motion Light, Garage Door, Modbus, Thermostat, and Weather Monitor. To combine the network and IoT telemetry data, our research involves examining all the data collected by IoT sensors in order to identify data records that are temporally relevant to the network data records being used. The details of the matching method will be described in Algorithm 1.
3.2. Data Processing
In order to prepare the input data to be more suitable for our Transformer-based NIDS model, we design a different data processing module from most NIDS works. Generally, data processing for NIDS includes four steps: data cleaning, data normalization, feature selection, and dataset splitting. In this work, we use different data cleaning methods and different separated data normalizations. Further, we use all of the features instead of only selecting the important ones. Compared to traditional NIDS modules, the differences in our data processing modules are as follows:
The first difference is that we do not clean data by dropping the invalid data samples. In the ToN_IoT dataset, there is a lot of missing data for some functional sub-sets of features, such as “DNS activity features”, “SSL activity features”, and “HTTP activity features”. Those missing data points are filled by the string “-”. Instead of dropping those data records, we transform all invalid values of categorical features into the string “-” and all invalid values of numerical features into the value “−1”.
The second difference is that we separately embed numerical features and categorical features. In many traditional DL-based NIDS methods, the categorical features are transformed into numerical values first; then all features are normalized in the same way. In our method, we encode each categorical feature with a value between 0 and
U, where
U is the number of unique contents for this categorical feature. The values are further used to calculate embedding vectors for categorical features (see Equation (
2)). Then we only normalize numerical features.
The third difference is that we use all the features instead of only using the more important features.
We make the above changes according to the embedding learning ability of our FT-Transformer-based model. The FT-Transformer model includes a Feature Tokenizer (FT) module for embedding the input features into a vector representation. Therefore, we can make the first difference since those invalid values also can be encoded into representation vectors for FT-Transformer. In the FT module, the embedding process for numerical and categorical features is separated. Therefore, we can make the second difference. Further, the transformer-based method is built upon a self-attention mechanism, which can generate adaptive attention for all features. In other words, the self-attention mechanism adaptively learns from more important features. Hence, it is reasonable to use all features in our method.
Combination of Network data and IoT data. To integrate the network traffic-based NIDS and telemetry data-based NIDS, we need to merge the two types of input data. Our NIDS monitors all network traffic and current telemetry data values of IoT devices. For each traffic flow, the NIDS analyzes its behavior. Simultaneously, the telemetry data values of IoT devices are collected and utilized to aid in traffic behavior analysis. Consequently, our NIDS can detect IoT attacks based on both the attack behavior and its impact.
For collecting telemetry data from different IoT devices, it is desirable for NIDS to monitor all telemetry data from all IoT devices at all available time instances for optimal detection accuracy. In order to detect any attacks on IoT devices, the telemetry data values from different IoT devices within the same time instance should be combined into a mixed telemetry vector. This mixed telemetry vector can aid in network traffic analysis by the NIDS. The selected telemetry data should be within the same time window as the traffic-detecting duration, which is typically a very short period. However, to create the mixed telemetry vector quickly, we use a random selection method to choose telemetry data values within the time period for each IoT device. Because this period is very short, we do not mix flows from different devices in a random way.
In the ToN_IoT dataset, the two originally provided data sources cannot be simply combined. After analyzing the ToN_IoT dataset, we found that the network data records do not match well with IoT data records. The reason is that the network and IoT data are asynchronous. Specifically, network data samples are recorded in terms of traffic flows, which have a duration, but IoT sensor data samples are instantaneously recorded with time stamps. Therefore, we provide a matching algorithm to look for corresponding IoT records for network data. In this work, we use provided training and testing sets of network data the same as [
18]. Although the ToN_IoT dataset also provides a training and testing set of IoT data, we use the entire IoT data to match the network records as much as possible. The matching algorithm is shown as Algorithm 1.
| Algorithm 1: Matching the network and IoT data |
Require: , for to do for do while do add to end while add to if none of matched, add invalid values ‘-’ or ‘−1’ to end for end for
|
In Algorithm 1, we first assign the start and end time stamps of a traffic flow as and . Then we search each type of IoT device’s data to look for all records whose time stamps are in the range between and . Then we randomly choose one for this traffic flow record. The reason is that if our NIDS needs to collect current telemetry data reflecting the current state of IoT devices (which could be either attacks or normal traffic), the telemetry data may be updated multiple times throughout the duration of the traffic flow. We chose random sampling because, during the traffic flow duration, the telemetry data likely will not change significantly. Additionally, the telemetry data received from different IoT devices inherently have different time instances, making it acceptable to select them randomly within a short time period. While there are other ways to sample telemetry data, random selection has little effect on NIDS detection accuracy, and speed is crucial for a quick response. Therefore, we made a trade-off by utilizing random sampling. If there is no IoT record in that duration, we fill in invalid values “-” or “−1” for the empty categorical and numerical features, respectively.
4. FT-Transformer-Based NIDS Model
In order to solve the heterogeneity problem in IoT NIDS, we design an FT-Transformer-based NIDS model [
41]. The unique designs of the FT-Transformer make it extremely suitable for heterogeneous data in aspects of both different feature types and different data sources. The overview of our model is illustrated in
Figure 3. The matched IoT data are concatenated with the original network data. Similar to the network data, all columns of IoT telemetry data are split into numerical and categorical parts, which are fed into the model separately. As the model is named, FT-Transformer generally includes a Feature Tokenizer part and a Transformer part followed by an MLP layer for final classification.
Feature Tokenizer. The Feature Tokenizer module is responsible for transforming the input feature values into learnable embeddings. Specifically, the Feature Tokenizer module takes categorical features and numerical features as two parts of input (
and
) separately. Each part can include network data only or a combination of network and IoT data. The categorical features and numerical features are embedded in different ways, which are explained as Equations (
1) and (
2) in detail, where
and
are the weights of the numerical embedding layer and bias, and
and
are the categorical embedding function and bias.
Besides the categorical and numerical embeddings, a learnable classification embedding
, which has the same tensor shape as each feature embedding, is created and combined with all feature embeddings. The classification embedding
is used for participating in the further learning processing and extracting valued features in Transformer. Therefore, the output embeddings are a normalized concatenation of categorical features, numerical features, and classification embeddings, which is described in Equation (
3).
Transformer blocks. As shown in
Figure 3, the output of Feature Tokenizer,
, is fed into multiple Transformer encoders, which is a stack of
in this work. Each block [
19] has a multi-head attention layer and a fully connected feed-forward network. Each of them is followed by the residual link and normalization layer. In particular, more hyperparameters we adopted in this work are 8 heads of multi-head attention layers, 32 embedding dimensions, a 0.1 post-attention dropout ratio, and a 0.1 feed-forward dropout ratio.
The core component of the Transformer encoder is the multi-head attention (MHA) layer. MHA allows the model to adaptively learn information from different features’ embedding representations. MHA consists of multiple (M = 8 in this work) heads of self-attention, which are also named “scaled dot-product attention” [
19].
As shown in
Figure 3, the output of Feature Tokenizer,
, is fed into multiple Transformer encoders, which is a stack of
in this work. Each block [
19] has a multi-head attention layer and a fully connected feed-forward network; each of them is followed by the residual link and normalization layer. Equation (
5) illustrates the details of calculating the attention. Based on the input embedding
, three learned vectors are calculated: the query (
Q) vector, the key (
K) vector, and the value (
V) vector. Weighted sums of
V vectors are computed using them by taking the dot product of the
Q vector with the
K vector and then applying the softmax function to the result to obtain the weights.
Classification. The output of Transformer encoders is the learned embeddings for all input features, but we do not classify all of them. Instead, we only feed the learned to the final MLP layers because the input has taken advantage of the attention mechanism to extract information from all other feature embeddings. As an independent third-party embedding (not numerical or categorical feature embeddings), it is more suitable for final classification.
5. Results and Discussions
In this section, we first introduce the experimental environment, then we discuss the experiments and results to show why our method is suitable for IoT NIDS. In
Section 5.2, we evaluate our method on the network data of the ToN_IoT dataset for binary and multi-classes classification. Then we take both the network data and IoT sensor data into consideration in
Section 5.3. In addition, we compare our method with classical ML-based methods in
Section 5.4. Finally, we present an interpretability analysis by visualizing the attention map in
Section 5.5.
5.1. Experimental Environment
To train models, we use a high-performance computer running Ubuntu 18.04 on 3.30GH Intel(R) Core(TM) i9-9820X CPU with 128 GB main memory equipped with two NVIDIA GeForce RTX 2080 Ti GPUs. All models are built with Pytorch 1.11.0 and distributed and trained on two GPUs using the Distributed Data-Parallel module.
5.2. Evaluation Results on Pure Network Data on the ToN_IoT Dataset
In this section, we evaluate our method on pure network data from the ToN_IoT dataset to prove our method can address the problem of heterogeneous features. The training and testing data are the same as the data in [
18]. The training and testing data are passed to the data processing module, which is introduced in
Section 3.2. During data processing, we first drop three columns for “ts”, “src_ip”, and “dst_ip”, which could work as spurious features to harm IDS models. Then, we separate the other columns by two types of numerical or categorical features. We select 12 features as numerical type, which are “src_port”, “dst_port”, “duration”, “src_bytes”, “dst_bytes”, “missed_bytes”, “src_pkts”, “src_ip_bytes”, “dst_pkts”, “dst_ip_bytes”, “http_request_body_len”, and “http response_body_len”. The other 28 features are categorical types. As shown in
Figure 3, the numerical or categorical features are separately fed into the Feature Tokenizer for generating embeddings, which actually are the instances participating in further learning progress.
Figure 4 shows the binary classification performance by using a confusion matrix, which performs a total accuracy of 97.95%; both true positive and true negative are around 98%, the false positive is 2.1%, and the false negative is 1.9%. More evaluation results for the binary classification on network data are shown in the FT-Transformer1 column in Table 3, particularly the F1 score is 97.09% and the AUC score is 99.82%.
The multiple classification performance on pure network data is shown in
Figure 5 and
Table 1; our method can achieve 95.78% overall accuracy. Based on the result in
Figure 5, we observe that the three attacks with the worst detection accuracy are “mitm (Man In The Middle)”, “injection”, and “password” attacks with accuracies of around 65%, 73%, and 85%, respectively. The confusion matrix presents that the poor performance of “injection” and “password” are caused by the difficulty in distinguishing them from each other. Around 28% of “mitm” attacks are classified in normal traffic.
We also evaluate our method in terms of precision, recall, false positive rate (FAR), and F1 score. More details about multiple classification performance are presented in
Table 1. Although the confusion matrix shows that our model has a high recall on “XSS” attack, the high FAR 22.48% problem is shadowed. However, the table also illustrates that our method can successfully detect “normal”, “scanning”, “dos”, “ddos”, “ransomwave”, and “backdoor” traffic flows.
5.3. Evaluation Results on Both Network Data and IoT Sensor Data
In this section, we show that our method is capable of handling the data from heterogeneous sources. First, the entire IoT data source is matched with the same training and testing network data, which have been mentioned in
Section 5.2, by using Algorithm 1. The network data and matched IoT data are combined, as shown in
Figure 3. For the seven provided types of IoT device data, there are 11 numerical features, which are “fridge_temperature”, “temperature”, “pressure”, “humidity”, “latitude”, “longitude”, “FC1_Read_Input_Register”, “FC2_Read_Discrete_Value”, “FC3_Read_Holding_Register”, “FC4_Read_Coil” (which are the “input register”, “discrete value”, “holding register”, and “coil” of Modbus), and “current_temperature”, and six categorical features, which are “temp_condition”, “motion_status”, “light_status”, “door_state”, “sphone_signal”, and “thermostat_status”. For the reason of asynchronous data collection, we cannot find the matching IoT data records for many flows’ feature records in network data. In order to maintain the same training and testing sets of network data as the previous experiment in
Section 5.2, we fill invalid values ’-’ or ’−1’ in the empty positions of categorical and numerical features, respectively.
The binary classification performance on the combination of network and IoT data is shown as the confusion matrix in
Figure 6. With the extra IoT sensor data, our method achieves 98.39% binary accuracy, which increases by 0.44% compared with pure network data performance. The true positive is around 99% and the true negative is around 98%, the false positive is 1.9% and the false negative is 1.0%. More evaluation results for binary classification on the combined data are shown in the FT-Transformer2 column of Table 3. Specifically, the F1 score is 97.72% and the AUC score is 99.88%.
Figure 7 reports the confusion matrix of multiple classification performances on the combined data. Compared with
Figure 5, the performance has improved overall. In particular, the extra IoT data enhanced the detection performance by around 10%, 16%, and 4% in terms of true positive ratio on the classes of “mitm”, “injection”, and “password” attacks, which are hard to detect with only network data. An interesting finding is that the entire IoT data does not include any records about “mitm” attacks, but the detection performance on “mitm” is improved after using extra IoT sensor data. We believe there are two reasons: (1) Only the “mitm” class has data on all IoT-related features that are invalid values and that can also be recognized as a discriminate character. Given that features belonging to other types of traffic consistently comprise some valid values in the IoT-related part, the presence of invalid values indicates a significant likelihood of being a ’mitm’ attack. (2) The extra IoT data can improve the FT-Transformer model’s ability to distinguish normal traffic and attacks. Based on
Figure 7, we can see that fewer “mitm” flows are recognized as a “normal” flow.
Table 2 reports more evaluation results about the multiple classification performance on the combined data by using Precision, Recall, False Positive Rate (FAR), and F1 score. Compared to
Table 1 and
Table 2, the attack classes with high FAR in
Table 1, such as “mitm”, “xss”, “password”, and “injection”, have all been improved across all evaluation metrics, specifically, their FARs are decreased by 16.16%, 6.96%, 12.41%, and 4.53%, respectively.
The performance on combined data shows that even though the IoT data are asynchronous with network data, our method can still extract valuable information to enhance the classification performance. Those results prove that our method can achieve the matched performance with the state-of-the-art on pure network data of ToN_IoT. For the combination of network and IoT data, our method outperforms the state-of-the-art ML method on all metrics of accuracy, F1 score, and AUC.
5.4. Comparison with Classical ML-Based Methods
We compare the binary classification performance of our FT-Transformer-based NIDS model with three classical methods: Gradient Boosting Machine (GBM), Random Forest (RF), and Multi-Layer Perceptron Neural Network (MLP), which have been investigated in [
18]. Meanwhile, we also compare the performance of our FT-Transformer on pure network data and the combination of network and IoT data.
The evaluation metrics of accuracy, F1 score, and AUC score are presented in
Table 3. In this table, the FT-Transformer1 represents the model, which is trained and tested on pure network data of the ToN_IoT dataset, and the FT-Transformer2 works on the combination of network and IoT data. If only considering the first three columns of this table, RF has the best performance of all classical methods with 98.08% accuracy, 97.26% F1 score, and 99.69% AUC score. As known, the tree-based ML methods normally can achieve better performance on tabular data than other NN-based methods, no matter whether deep or not [
14]. However, our FT-Transformer-based method can achieve 97.95% (−0.13%) accuracy, 97.09% (−0.17%) F1 score, and 99.82% (+0.13%) AUC score, a matched performance with RF on pure network data. Our method outperforms the MLP method, which is also a neural network method.
With extra IoT data, the column of FT-Transformer2 outperforms all of the other methods with 98.39% accuracy, 97.72% F1 score, and 99.88% AUC score. This result further proves that the FT-Transformer-based method cannot only address the problem of heterogeneous features (including both numerical and categorical features) but also improve performance by combining mixed data sources.
Additionally, we compare the multi-classes classification performance of our proposed method with that of four existing methods. Two NIDS methods, named CNN-IDS [
11] and FED-IDS [
10], are proposed for IoT scenarios. Another two methods, named ResNet-50 [
8] and P-ResNet [
9], are proposed to detect intrusion through learning on sensors’ telemetry data. Based on the different “data usage” in the sixth column of
Table 4, the CNN-IDS and FED-IDS only utilize the network data in the ToN_IoT dataset, but ResNet-50 and P-ResNet only utilize the IoT sensors’ telemetry data. Specifically, the result of ResNet-50 [
8] is evaluated on a smaller sub-dataset, which consists of 8 classes, but other methods all use datasets with 10 classes.
Table 4 reports that the FT-Transformer1 outperforms other network data-based methods. Further, FT-Transformer2, which uses both network and IoT data, achieves the best performance.
5.5. Interpretability Analysis
Our FT-Transformer-based method is built upon the self-attention mechanism, which can relate different elements of input and compute representation embeddings for each element. In the self-attention mechanism, the attention matrix, which is described in Equation (
5), is used by the neural architecture to emphasize the relevant element embeddings.
In our case, the attention matrix can show the relations between input features. A very important characteristic of FT-Transformer is that the input does not only include the heterogeneous features but also a learnable classification embedding , which also participates in the self-attention calculations and is further used for final classification. Hence, we can claim that the learned classification embedding is the element that is directly relevant to our final task—intrusion detection. Therefore, the attention weights of the classification embedding with other features can show the relevance degree of all input features with , which can be further considered as the feature importance.
In order to visualize the attention-based feature importance, we extract the attention matrix of the last Transformer layer. We only select the row of attention values belonging to
. Before visualizing, we also need a summation of the head dimension for the reason for our model uses eight heads for MHA, as mentioned in
Section 4. We collect the attention-based feature importance for all testing data and calculate the global average.
The attention-based feature importance figures on pure network data and the combination of network and IoT data are shown in
Figure 8 and
Figure 9 separately. In
Figure 8, the horizontal axis represents all input features of network data, and the vertical axis is a different type of flow. For normal and attack flow, a one-dimension heat map of attention weights is used to show the contribution of each feature. Based on the lightest parts, we notice that the “duration” makes the most contribution to identifying a normal flow and the “ssl_established” feature is the most important one for attack flow. Similarly,
Figure 9 shows the attention-based feature importance for all features from both network and IoT sensor data. Comparing these two figures, we find that the “duration” is always a light region for both images. Additionally, “src_bytes” and “dst_bytes” are important to detect an attack for both situations. However, the “ssl_established” feature, which has a large attention weight in
Figure 8, becomes less contributed in
Figure 9. Therefore, we claim that the attention weights have limited interpretability and further study and more experiments are required. Interpretability is important for ML-based NIDS for the reason that users need to understand why the decision was made.
5.6. Reproducibility Details
We use PyTorch to implement the FT-Transformer-based NIDS model on a server with GPU machines. The dropout ratio is set to 0.1 for each Feed Forward layer, and for each attention map in Equation (
5), layer normalization is performed before each layer in the model. The embedding dimension is set to 32 for each input feature. The depth of the model is set to 6, which is also the number of Transformer encoders. For each MHA layer in Equation (
4), the number of heads is set to eight. The output dimension of the final MLP layer is set to 10, which is the number of traffic types. During the training process, we used Adam optimizer [
42] with a 0.001 learning rate and a 4096 training batch size. We also evaluate the efficiency and complexity of our model in our experimental environment by using the PyTorch profiler. During the execution of the model’s operators for one input, the model’s total CPU time is 952.775 ms, total CUDA (GPU) time is 367.000 us, total CPU memory is 372 bits, and total CUDA memory is 2.03 Mb.


