Abstract
This paper compares two finite-control-set model predictive control (FCS-MPC) strategies in the context of a grid-connected single-phase quasi-Z source inverter (SP-qZSI). Both schemes use discrete-time models of the inductor current and capacitor voltage for the DC side, as well as the output current on the AC side. To enhance the converter’s performance, given the non-minimum phase characteristics of the DC side, a long prediction horizon is implemented for the predictive control. However, a horizon of this nature can be highly demanding in terms of processing load, rendering it inapplicable for some microcontrollers. To address this issue and mitigate the processing load, an alternative control strategy is presented that divides the total number of candidate solutions to be evaluated into smaller segments. The performance of the two control strategies is compared using total harmonic distortion (THD) and simulation times as evaluation metrics. The results indicate that the proposed strategy achieves significantly shorter simulation times than the compared control strategy when increasing the prediction horizon. Additionally, a reduction in the THD was observed in the proposed strategy, reaching an average of 2.8%, which is lower than the compared strategy that exhibited THD close to 3.5%.
1. Introduction
Conventional Voltage Source Inverters (VSI) and Current Source Inverters (CSI) are present in various applications such as adjustable speed drives, distributed energy systems, and electric vehicles, among others [1,2,3,4]. Over the years, conventional inverters have been adapted to increasingly demanding operating conditions. More stringent regulations, penetration of new energy sources into the grid, or greater energy demand are some of the reasons that have contributed to this change, which has accentuated certain characteristic limitations of these converters. In particular, VSIs can only perform step-down voltage, while CSIs can perform step-up voltage on the load side [4,5]. Thus, many applications that require step-down and step-up operations are beyond the reach of conventional inverters alone, and must be coupled to an additional DC–DC converter as one of the solutions to overcome this problem [5]. As a result, a more complex and expensive two-stage conversion is obtained, which demands a larger installation volume [5,6].
For applications requiring a wide operating range, such as buck-boost operations, quasi-Z source inverters (qZSIs) offer an alternative to conventional inverters with built-in DC–DC converters. qZSIs combine buck-boost functions on the DC side and DC-AC conversion in a single stage. This is made possible by the quasi-Z network, which consists of two capacitors, two inductors, and a diode on the DC side. The network can elevate or decrease the voltage and behave as a non-minimum phase system [7,8]. As a result, it is relevant that the control strategies used in this type of converter consider some important design factors: (i) the control variables on both the DC and AC sides must be controlled simultaneously in a single set of power switches, (ii) in the case of traditional linear controllers, the interaction of the control loops on the DC side and AC must be avoided. This is to obtain satisfactory system performance. Finally, (iii) the DC side behaves as a non-minimum phase system, which demands a particular approach in the design of the controller [8,9,10].
Implementing a traditional linear control strategy in a quasi-Z source inverter (qZSI) can be challenging and may not yield the desired results [8,11,12,13]. To address these challenges, various nonlinear control techniques have been proposed, including fuzzy control [14,15,16], sliding-mode control [17,18], neural networks control [19,20], and finite-control-set model predictive control (FCS-MPC) [21,22,23,24,25]. FCS-MPC, also known as direct model predictive control, has gained significant interest in the past 20 years due to its ability to provide fast dynamic responses, handle multiple objectives, and leverage the available computational power. Consequently, FCS-MPC has emerged as an attractive alternative for power electronics applications [9,26,27].
The FCS-MPC operates in the discrete-time domain and employs a model of the plant to predict its future dynamics up to a predefined prediction horizon [26]. The selection of states is based on minimizing a cost function that collects and quantifies the desired dynamics of the system in real time [10]. Once the states are selected, they are directly applied to the converter switches at a sampling instant without requiring a modulation stage. However, FCS-MPC does not achieve optimal results in every application case, leading to the development of hybrid predictive strategies [28,29,30] and techniques that reduce the impact of uncertainties or parameter discrepancies [29,31]. Various modified FCS-MPC schemes aim to address certain aspects not fully covered by the traditional approach [32,33]. Implementing FCS-MPC can be challenging, especially when systems exhibit non-minimum phase behavior. In such cases, an extended horizon predictive strategy can ensure proper management across the control range [10,34].
Using FCS-MPC with long prediction horizons can significantly improve system performance and reduce total harmonic distortion (THD) [34,35,36,37]. Some studies indicate that a short horizon is not always the best alternative for systems with non-minimum phase behavior, such as the DC side of the qZSI converter. In these cases, a sufficiently long horizon length is required for the controller to predict beyond the initial adverse dynamics of the system [8,38,39]. However, the practical implementation of a long prediction horizon is challenging due to the exponential growth of computational complexity with the length of the horizon. As a result, implementing an FCS-MPC with a long prediction horizon may become unfeasible in practice [36,37]. For the reasons mentioned, efforts are made to reduce the computational processing required when operating with an extended horizon in the FCS-MPC strategy; In this context, some new approaches have been proposed in recent years [36,40]. It is known that there will be differences in the implementation of the different FCS-MPC strategies mentioned; in this regard, a brief comparison is provided in Table 1.

Table 1.
Comparison between some different FCS-MPC techniques for power converters.
This document presents the formulation of an FCS-MPC strategy that can be proposed thanks to the discrete model of the converter, which allows the prediction of the behavior of the inductor current and the capacitor voltage on the DC side, as well as the behavior of the output current on AC side. For the discretization of the system, the forward-Euler method is used, to transform the model from continuous time to the discrete-time domain. In addition, an extended prediction horizon is used to improve system performance given the non-minimum phase characteristics of the DC side of qZSI. However, the use of an extended horizon can significantly complicate the practical implementation of the system, increasing the processing load required. To overcome this difficulty, a control strategy is proposed that fragments the total number of candidate solutions to be evaluated. This technique helps to reduce the required processing load, which in turn facilitates the implementation of long prediction horizons. In this way, it is possible to improve the performance of the system and optimize the efficiency of the algorithm in solving complex problems. To visualize the effectiveness of the proposed strategy, its performance is compared with a similar control strategy that considers all the states of the qZSI to obtain a solution.
In Section 2 the qZSI model is presented considering both sides of the converter. In Section 3, the corresponding control strategies are presented, which will be compared in this article. Section 4 presents the test results for each strategy presented. Finally, Section 5 presents the main conclusions of the work.
2. Single-Phase Quasi-Z Source Inverter
The SP-qZSI converter that is presented in this work is powered by a DC voltage source , and it is mainly made up of two parts; (i) the quasi-Z network, and (ii) the H-bridge, which, in this case, is connected to a single-phase network with voltage through an inductive filter, as shown in Figure 1a.
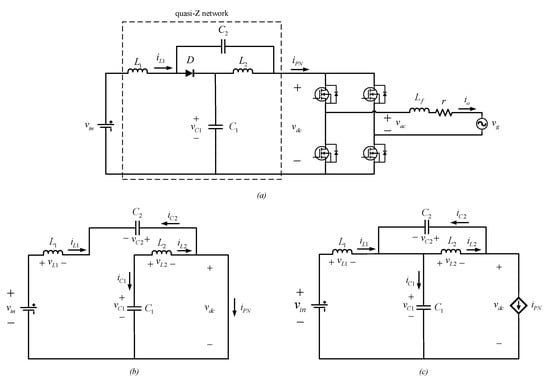
Figure 1.
Single-phase inverter quasi-Z source: (a) SP-qZSI connected to the network, (b) shoot-through mode of operation, (c) non-shoot-through mode of operation.
The quasi-Z network is made up of two inductors , two capacitors and a diode . The latter gives the converter the possibility to switch between its two modes of operation; Shoot-Through (ST) mode and non-Shoot-Through (nST) mode s. The ST mode introduces three states called non-Shoot-Through States (nSTS) oriented to the AC side; (i) the positive state when the load is positively energized, (ii) the negative state when the load is negatively energized, and (iii) the null state when no power is flowing to the load, but diode D still conducts. On the other hand, the ST mode introduces the states called Shoot-Through States (STS) oriented to the DC side. These states correspond to the simultaneous closing of the upper and lower switches of at least one of the legs of the H-bridge, causing a short circuit and the non-conduction of diode D. As a result, the DC link voltage can be increased or decreased by toggling between ST and nST modes.
2.1. Shoot-Through Mode Operation
Figure 1b shows the representation of the DC side when the qZSI is operating in ST mode. During this mode, at least one of the legs of the H-bridge is shorted making diode D non-conducting. This implies that the inductors draw power from the power supply and capacitors. Therefore, the dynamics of the current through the inductances can be written as
while the dynamics of the voltages on the capacitors are given by,
With these models defined, for both modes, it is possible to formulate a single description, using a conditional variable, to contain both modes of operation in a single set of equations for the DC side of the qZSI.
2.2. Non-Shoot-Though Mode Operation
Figure 1c shows an equivalent circuit representation of the DC side when the qZSI operates in the nST mode. The conduction state of diode D allows the quasi-Z network to absorb power just like the AC side of the converter, if an nSTS makes it possible. In this way, it is feasible to describe the dynamics of the currents in both inductances as
where and are the currents in the inductances and , respectively, and the voltage in the capacitances and , respectively. The dynamics of the voltage across the capacitors are given by,
where corresponds to the current delivered by the quasi-Z network, which is defined as
with the current through the capacitor .
2.3. Model with Conditional Variable
The previously displayed models can be formalized in a single representation, by introducing the conditional variable , which indicates the operating mode of the converter. This variable has two possible values that are defined as,
In this way, the model of the DC side can finally be expressed as:
Likewise, it is possible to express the model of the AC side using a conditional variable called, in this case, . This variable is immersed in the output current equation and helps to capture the dynamics for each possible nSTS, therefore, it has three possible values that are defined as
Thus, the model for the output current can be expressed as follows:
where is the alternating current output through the inductance of the filter , r the resistance associated with , the network voltage, and the link voltage of DC that thanks to can have three possible values {, 0, }.
3. Two FCS-MPC Alternatives in SP-qZSI
Two FCS-MPC strategies are presented in this section. Both use the same mathematical models and share the same control objectives. The difference lies in the total number of candidate states that each strategy evaluates for a solution. This section begins by presenting the models to be used to end with the presentation of each FCS-MPC strategy in a particular way.
3.1. Formulation of the FCS-MPC Strategies to Be Used
The control objective for the FCS-MPC strategies that will operate in the SP-qZSI is the regulation of the output alternating current on the AC side, as well as the regulation of the current of the inductor and the voltage of the capacitor , on the DC side. Consequently, the qZSI consists of three equations in the prediction model; one for the AC side and two for the DC side. It is important to note that, for control purposes, the regulation of the currents and can be achieved by regulating only , while the regulation of the voltages and can be achieved by regulating only , assuming and , respectively. Thus, the variables of interest , and are compared with their reference variables, immersed in a cost function that is minimized to select an optimal commutation vector corresponding to the selected optimum switching state, defined as
The selected state is directly applied at a sampling instant after its selection to the converter switches, without the need for a modulation stage.
The converter states are specified in Table 2, where seven possibilities of states that can be applied to the H-bridge are displayed. However, in practice, only four states are selected, due to the different alternatives that exist to achieve the same result. In the case of the STS, state N° 7 was chosen since it prioritizes a low level of switching losses [41]. Regarding the , it is possible to alternate the two possibilities that exist (state N° 3 and N° 4) to contribute to a homogeneous use of the converter switches.

Table 2.
SP-qZSI valid switching states.
Using the forward-Euler discretization method and the expression = − , it is possible to express the dynamics of the current and the voltage for the DC side in the discrete-time domain, as follows,
and
where is the sampling time used, and correspond to the prediction at instant and the measurement at instant k, respectively of the current through the inductor , and correspond to the prediction at and the measurement at k, respectively of the voltage in the capacitor and, finally, the current delivered by the quasi-Z network defined in (5).
The cost function, necessary to regulate the dynamics of expressions (15) and (16), can be expressed as,
where corresponds to the prediction horizon, while and are the weighting factors for the voltage and current, respectively.
The voltage reference of the capacitor must not interfere in the tracking of the reference for the output alternating current and must guarantee that, between the DC and AC sides, there is no interaction. Thus, some papers have chosen to use a voltage reference greater than twice the voltage present on the AC side [42,43]. In particular, in this work, the voltage reference will be given by:
with the amplitude value of the main voltage. Meanwhile, the reference for the inductor current will be formulated from the following expression:
with the value of the output power reference.
Finally, as for the DC side, it is possible to express the dynamics in the discrete-time domain of the AC model from the expression defined in (13), leaving as follows:
where and are the prediction and measurement, respectively, of the output current through the output inductance L, R is the resistance associated with L, and the conditional variable defined in (12).
Finally, the cost function of the AC side can be expressed as
where the value for the output current reference is formed from the following expression:
The formulation of the cost functions (17) and (21) will make it possible to generate a minimization stage in the control algorithm that will make it possible to search for an optimal switching state to follow up on desired referrals. It should be noted that Equations (15), (16) and (20) present a single prediction step. Therefore, they will only serve as reference equations for the tests that will be carried out in Section 4, those that will consider different prediction horizons.
3.2. Classic FCS-MPC for SP-qZSI
Based on the mathematical models shown in the previous section, the control scheme of Figure 2 is presented. Here, the measurements , , , and are fed back from the system to be incorporated into the prediction models of the DC and AC side.
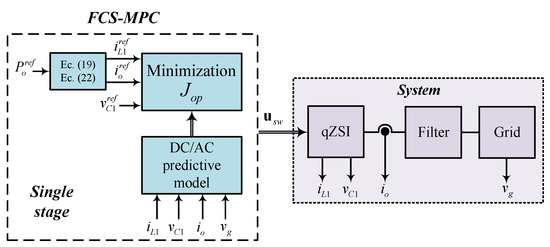
Figure 2.
Diagram of the classic FCS-MPC strategy.
The discrete models presented in the previous section are evaluated under a single prediction horizon , where the equations that make up the plant model share the same evolutionary length. As a result, the obtained values of each variable are compared in a cost function named that incorporates the functions of both sides of the converter in a single function. Mathematically it can be represented as:
After evaluating , the control advances to the next stage where the cost function is minimized to select the optimal switching state .
Figure 3 is intended to express in greater detail the basic minimization of the control strategy presented. For the execution of this minimization to be effective, the control must evaluate all the states considered, which in this case correspond to the nSTS plus the STS specified in Table 2, i.e., the minimization is subject to the evaluation of four possible states. Therefore, the number of states to be evaluated by the strategy will be given by the following relation:
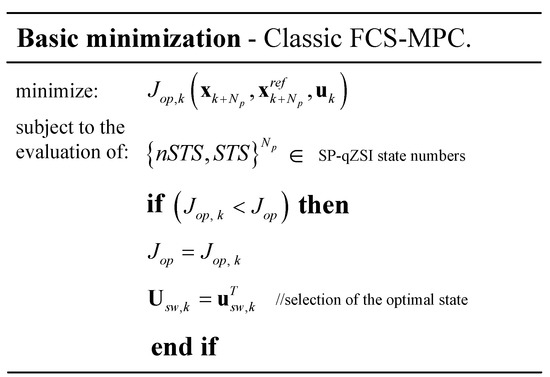
Figure 3.
Basic minimization in the classic FCS-MPC.
In turn, when the current value of the cost function that depends on the state variables , the reference variables and the input variables , is less than the last recorded value, i.e., the algorithm updates the value of and selects the optimal switching state to be applied in a subsequent control iteration.
In general, the strategy presented in Figure 2 can become computationally demanding when dealing with long prediction horizons, since the number of states to be evaluated could be large, which would imply that the computational capacity, may not be enough to implement the algorithm. As the long prediction horizon is required in some systems to improve performance, the next section presents an alternative to reduce the computational load in an FCS-MPC strategy for an SP-qZSP.
3.3. Proposed FCS-MPC for an SP-qZSI
In practice, the control strategy depicted in Figure 2 can consume significant computational resources when a long prediction horizon length is required. As an alternative, the strategy presented in Figure 4 offers a possible solution to the computational burden problem by fragmenting the number of states to be evaluated through the separation of the DC and AC side models into two different stages, where the models can be evaluated with different prediction horizon lengths. This separation enables the strategy to obtain a solution while considering a lower number of candidate states compared to the strategy in Figure 2.
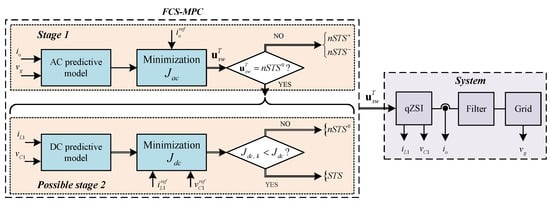
Figure 4.
Diagram of the proposed FCS-MPC strategy.
The scheme presented in Figure 4 demonstrates that the variables , , , and are fed back from the system and incorporated into the AC and DC side models or, in other words, stages 1 and 2, respectively. Stage 1 is an essential component of the control system and operates independently of Stage 2. It involves minimizing the cost function which takes into account the dynamics of the current in the search for a solution, with three possible candidate states. Stage 2 is only activated if the solution found in the previous stage is . Stage 2 involves minimizing the cost function which incorporates the dynamics of both the current and the voltage in the search for a solution, with two possible candidate states.
Figure 5 depicts in detail the problem of basic minimization of the control strategy. First, Stage 1 consists of minimizing the cost function that depends on , and . The result of the minimization has three possible candidate states for the solution; , and , i.e., all the considered shown in Table 1. In particular, when the algorithm updates the value of and selects the optimal switching state . If the solution found is , the algorithm immediately selects the state to be applied in a subsequent control iteration. Otherwise, if the algorithm advances to stage 2, being a conditional stage within the control. This stage is made up of the minimization of the cost function . The result of said minimization has two possible states for the solution; a and a . When , the algorithm updates the value of and will select the state . Otherwise, if the value will not be recorded and the algorithm will select a , whose state is a candidate for the solution from Stage 1. Thus, the total number of states to be evaluated will be given by the following expression:
where and are the prediction horizons used in Stage 1 and Stage 2, respectively.
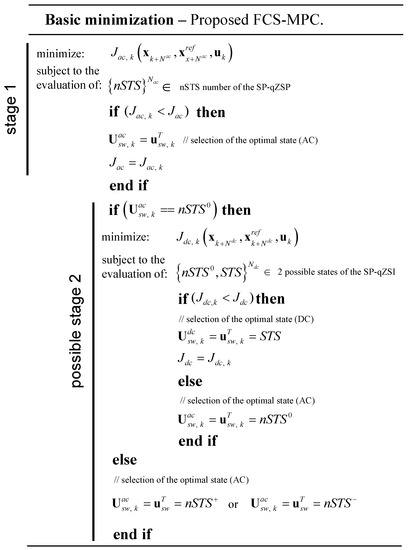
Figure 5.
Basic minimization in the proposed FCS-MPC.
In short, the two stages of control operating with different cost functions allow the DC and AC side models to be evaluated separately and with different horizon lengths. This implies that the extended prediction horizon can be allocated only where it is required, i.e., the DC side of the converter, given its non-minimum phase characteristics. Thus, since the AC side does not present adverse initial dynamic characteristics, a short horizon of a single step is sufficient. In this way, the processing load of the algorithm is reduced compared to the previous control strategy. On the other hand, Stage 2 is only possible when there is a as a solution in Stage 1; therefore, not only can the extended prediction horizon be focused on the DC side, but also, the algorithm decides when required, which decreases the probability of requiring the extended prediction horizon belonging to the DC side, and, consequently, being able to further reduce the processing load of the algorithm.
4. Simulation Results
To verify the results, a simulation of both control strategies was implemented to compare their performance. The tests were carried out on a computer with a 2.3 GHz, 2-core, 6th generation Intel Core i3-6100U processor. Stepwise benchmark changes for power were considered up to a prediction horizon and . The performance is quantified through the THD of the output current, and the simulation times required for each test.
The circuit diagram parameters are shown in Table 3, as well as the references. Table 4 shows the control parameters used, sampling frequency, and weighting factors. These values have been defined for both strategies according to known indications in [10].

Table 3.
Simulation circuit diagram parameters.

Table 4.
Control parameters.
4.1. qZSI Operating with the Classic Control
The first test focuses on the performance of the classic FCS-MPC control before an instantaneous reference change in the power , with a prediction horizon . The results show that, before a change from 200 W to 600 W power reference, the controller fails to keep the voltage regulated, through the reference trajectory, which can be observed in Figure 6c. This voltage significantly increases its ripple and suffers a drop that stabilizes at an average value of 100 V in approximately 0.1 s, which does not prevent the currents and from continuing to be regulated through the reference trajectories. Figure 6a shows that as the reference is varied, the pulse frequency of the current decreases, while its amplitude increases around the average value of the reference. The peak values recorded reach up to 13 [A], which is adequate for the correct operation of the prototype. Finally, the sinusoidal output current adequately follows the reference, showing a constant behavior along the trajectory, as shown in Figure 6e.
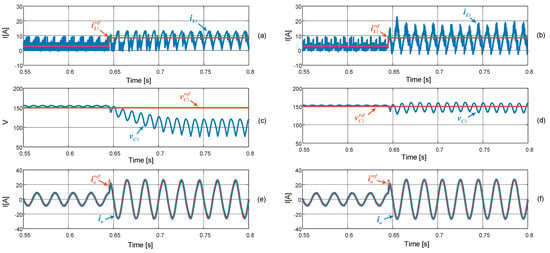
Figure 6.
Response of the classic FCS-MPC scheme to a reference step of 200 W to 600 W: (a) response of the current of the inductor with a horizon , (b) response of the current of the inductor with a horizon , (c) voltage response of the capacitor with a horizon , (d) voltage response of the capacitor with a horizon , (e) response of the output current with a horizon , (f) response of the output current with a horizon .
On the second test, the same power reference change was used as in the previous test, but with the particularity that the FCS-MPC controller operated with a prediction horizon . Figure 6d shows that the controller maintained the regulated voltage , unlike the previous test. In addition, the voltage ripple showed smaller pick-to-pick variations of approximately 25 V. In Figure 6b it can be seen that the current remains regulated, but unlike the previous test, peaks of up to 18.5 [A] are presented. On the other hand, Figure 6f shows that the output current remains regulated at all times. However, the tracking of the reference in this test shows a slight improvement compared to the test presented in Figure 6e.
4.2. qZSI Operating with the Proposed Control
The third test focuses on the performance of the proposed FCS-MPC control before an instantaneous reference change in the power , with prediction horizons and similar to the previous tests. The result in Figure 7c shows that, upon a change from 200 W to 600 W in the power reference, the controller fails to maintain the regulated voltage , using the reference trajectory. This increases its ripple and suffers a drop that stabilizes at an average value of 90 V in a time of approximately 0.2 s, longer than the previous test. The current shown in Figure 7a, manages to remain regulated, but when the reference change occurs, it becomes less pulsating and its average value increases, reaching maximums of up to 13 [A] approximately, similar to the result in Figure 6a. Regarding the current shown in Figure 7e, it manages to remain regulated using the reference sinusoidal trajectory, but with difficulties in reaching the maximum values of the signal, which implies an error of approximately 1.5 [A] between the reference signal and the current measurement.
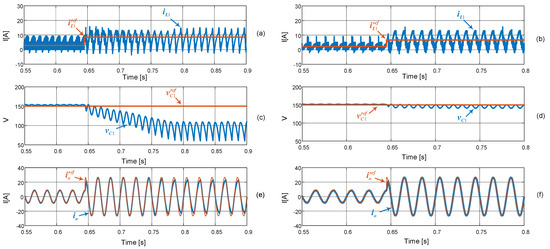
Figure 7.
Response of the proposed FCS-MPC scheme to a reference step of 200 W to 600 W: (a) response of the current of the inductor with a horizon and , (b) response of the current of the inductor with a horizon and , (c) voltage response of the capacitor with a horizon and , (d) voltage response of the capacitor with a horizon and , (e) response of the output current with a horizon and , (f) response of the output current with a horizon and .
In the fourth test, the same change in reference power occurs as in the previous tests. Here, the proposed FCS-MPC is operating with a prediction horizon and , which allows the generation of the desired comparison effect. Figure 7d shows that the voltage response performs better than in the three tests performed previously. Similarly to the results observed in Figure 6d, the voltage satisfactorily follows the reference path, but shows a voltage ripple of no more than 10 [V] when the change in reference occurs. Regarding the current shown in Figure 7b, it presents a more pulsating behavior than the results of Figure 6b and the maximums of current are lower, registering values that do not exceed 13[A]. Finally, the output current shown in Figure 7f properly follows the path of the sinusoidal reference at all times. There are no difficulties to reach the maximum of the reference, unlike what occurs in the results of Figure 7e.
4.3. Performance Comparison
The THD is commonly used to quantify the energy losses that come from the harmonic content of a certain signal of the alternating type. This metric is often used as an indicator of power quality, which is why it is of great interest in this work. Mathematically, it can be represented as:
where is the harmonic amplitude of the output current at frequency , where is the fundamental frequency, and .
The results of Figure 8a were processed with an exponential type fit in the MATLAB software. Here, the results confirm that the THD can decrease significantly as the length of the prediction horizon increases, regardless of the control strategy implemented. However, the proposed FCS-MPC strategy presents, on average, a lower THD than the classical FCS-MPC strategy of 2.8% and 3.5%, respectively. Both strategies show a decreasing trend as the length of the horizon advances. However, a small difference can be observed in the rate of decreasing of the classical FCS-MPC strategy, which is slightly faster than the rate of the proposed FCS-MPC.
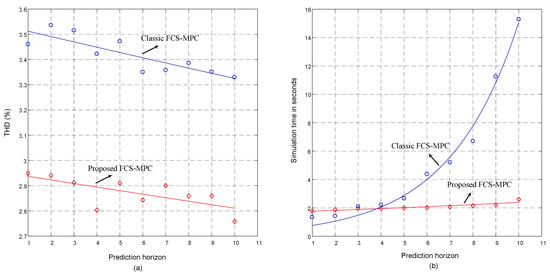
Figure 8.
Performance analysis between the classic FCS-MPC vs. the proposed FCS-MPC strategies: (a) total harmonic distortion, (b) simulation times.
Figure 8b shows the simulation times required for the tests presented in Figure 6 and Figure 7, as a function of the prediction horizon. It can be seen that the classical FCS-MPC strategy presents a remarkable exponential growth in simulation times, while the proposed strategy presents a significantly lower growth rate. Although the classical FCS-MPC strategy shows lower simulation times than the proposed strategy for a prediction horizon and , the gap widens to approximately seven times longer using a horizon in the classical strategy and a in the proposed strategy. Both controls show an increasing trend in simulation times, but the proposed FCS-MPC manages to reach a maximum simulation time of about 2.5 s. These results can serve as a tool to select the most appropriate control strategy depending on the performance requirements and available resources.
The proposed FCS-MPC strategy has been observed to perform better than the classical strategy, with lower THD indexes and simulation times. This strategy separates the DC and AC models used in control, which is a good alternative to reduce the computational load without affecting the quality of the results. These simulation times indicate the processing demand of the strategy, which is a good precedent to consider implementing the proposed FCS-MPC approach. However, it is essential to note that parameter mismatches or non-idealities in the physical system can affect system performance relative to the model. Although earlier studies have suggested that minor parameter discrepancies are unlikely to significantly impact the outcome of predictive strategies applied with sufficiently high sampling frequencies in converters, significant mismatches, and lower sampling frequencies can alter the results of the proposed approach. As demonstrated in [44], a parameter sensitivity analysis can examine the effects on total harmonic distortion (THD). Alternatively, as shown in [29,31], integral-action algorithms can minimize control errors caused by parameter mismatches or non-idealities in impedance source inverters controlled with predictive strategies.
5. Conclusions
This study proposes an FCS-MPC strategy for an SP-qZSI to improve its performance compared to a similar classical FCS-MPC method, particularly when using extended prediction horizons. Both approaches use the same mathematical models, but the proposed FCS-MPC strategy employs a state-fragmentation technique that separates the DC and AC models into two stages, enabling the implementation of different prediction lengths. This technique is crucial due to the non-minimum phase behavior of the converter. The simulation parameters used in all tests were the same and are presented in Table 3 and Table 4. The proposed FCS-MPC strategy shows superior performance in terms of both total harmonic distortion and simulation time required. The results from various tests were analyzed using MATLAB and approximated using an exponential adjustment function.
The results have demonstrated that the proposed FCS-MPC strategy, applied to the SP-qZSP, outperforms the classical FCS-MPC method. Specifically, the proposed control strategy exhibited lower total harmonic distortion (THD) in all the tests performed compared to the classical approach across all the evaluated prediction horizons. On average, the proposed strategy achieved a THD of about 2.8%, while the classical approach reached an average of about 3.5%. Furthermore, as the prediction horizon increased, the simulation times of the proposed strategy were significantly lower than those of the classical approach. The proposed method obtained simulation times up to approximately seven times lower than the classical approach for prediction horizons and . These results demonstrate that the proposed control strategy offers superior performance compared to the classical approach, and has promising potential for practical implementation in modern distribution networks, distributed generation with renewable energy sources, and microgrids, which are expected to become increasingly prevalent in the coming years.
Author Contributions
Conceptualization, J.L.S. and C.R.B.; methodology, J.L.S. and E.I.M.; simulation, J.L.S.; validation, C.R.B. and M.R.; formal analysis, J.L.S. and C.R.B.; investigation, J.L.S., C.R.B. and E.I.M.; resources C.R.B., P.E.M. and J.C.H.; writing—original draft preparation, J.L.S.; writing—review and editing, J.L.S. and C.R.B.; visualization, E.I.M. and A.C.; supervision, C.R.B., J.C.H. and M.R.; project administration, C.R.B.; funding acquisition, C.R.B., M.R. and J.C.H. All authors have read and agreed to the published version of the manuscript.
Funding
This research was partially funded by two grants, Grant 1201308 and Grant 1201683, under the ANID/FONDECYT Projects. Additionally, it received partial support from the Council of Andalucía (Junta de Andalucía, Consejería de Transformación Económica, Industria, Conocimiento y Universidades, Secretaría General de Universidades, Investigación y Tecnología) through Project ProyExcel_00381.
Institutional Review Board Statement
Not applicable.
Informed Consent Statement
Not applicable.
Conflicts of Interest
The authors declare no conflict of interest.
References
- Colli, V.; Cancelliere, P.; Marignetti, F.; Di Stefano, R. Voltage control of current source inverters. IEEE Trans. Energy Convers. 2006, 21, 451–458. [Google Scholar] [CrossRef]
- Xie, H.; Angquist, L.; Nee, H.P. Design Study of a Converter Interface Interconnecting Energy Storage with the DC Link of a StatCom. IEEE Trans. Power Deliv. 2011, 26, 2676–2686. [Google Scholar] [CrossRef]
- Ko, S.H.; Lee, S.; Dehbonei, H.; Nayar, C. Application of voltage- and current-controlled voltage source inverters for distributed generation systems. IEEE Trans. Energy Convers. 2006, 21, 782–792. [Google Scholar] [CrossRef]
- Ahmed, H.F.; Cha, H.; Kim, S.H.; Kim, H.G. Switched-Coupled-Inductor Quasi-Z-Source Inverter. IEEE Trans. Power Electron. 2016, 31, 1241–1254. [Google Scholar] [CrossRef]
- Peng, F.Z. Z-source inverter. IEEE Trans. Ind. Appl. 2003, 39, 504–510. [Google Scholar] [CrossRef]
- Anderson, J.; Peng, F. Four quasi-Z-Source inverters. In Proceedings of the 2008 IEEE Power Electronics Specialists Conference, Rhodes, Greece, 15–19 June 2008; pp. 2743–2749. [Google Scholar] [CrossRef]
- Liu, Y.; Abu-Rub, H.; Ge, B. Z-SourceQuasi-Z-Source Inverters: Derived Networks, Modulations, Controls, and Emerging Applications to Photovoltaic Conversion. IEEE Ind. Electron. Mag. 2014, 8, 32–44. [Google Scholar] [CrossRef]
- Ayad, A.; Karamanakos, P.; Kennel, R. Direct Model Predictive Current Control Strategy of Quasi-Z-Source Inverters. IEEE Trans. Power Electron. 2017, 32, 5786–5801. [Google Scholar] [CrossRef]
- Vazquez, S.; Leon, J.I.; Franquelo, L.G.; Rodriguez, J.; Young, H.A.; Marquez, A.; Zanchetta, P. Model Predictive Control: A Review of Its Applications in Power Electronics. IEEE Ind. Electron. Mag. 2014, 8, 16–31. [Google Scholar] [CrossRef]
- Karamanakos, P.; Liegmann, E.; Geyer, T.; Kennel, R. Model Predictive Control of Power Electronic Systems: Methods, Results, and Challenges. IEEE Open J. Ind. Appl. 2020, 1, 95–114. [Google Scholar] [CrossRef]
- Gajanayake, C.J.; Vilathgamuwa, D.M.; Loh, P.C. Development of a Comprehensive Model and a Multiloop Controller for Z-Source Inverter DG Systems. IEEE Trans. Ind. Electron. 2007, 54, 2352–2359. [Google Scholar] [CrossRef]
- Ellabban, O.; Van Mierlo, J.; Lataire, P. A DSP-Based Dual-Loop Peak DC-link Voltage Control Strategy of the Z-Source Inverter. IEEE Trans. Power Electron. 2012, 27, 4088–4097. [Google Scholar] [CrossRef]
- Bakeer, A.; Magdy, G.; Chub, A.; Vinnikov, D. Predictive control based on ranking multi-objective optimization approaches for a quasi-Z source inverter. CSEE J. Power Energy Syst. 2021, 7, 1152–1160. [Google Scholar] [CrossRef]
- Abu-Rub, H.; Iqbal, A.; Moin Ahmed, S.; Peng, F.Z.; Li, Y.; Baoming, G. Quasi-Z-Source Inverter-Based Photovoltaic Generation System with Maximum Power Tracking Control Using ANFIS. IEEE Trans. Sustain. Energy 2013, 4, 11–20. [Google Scholar] [CrossRef]
- Hou, T.; Zhang, C.Y.; Niu, H.X. Quasi-Z source inverter control of PV grid-connected based on fuzzy PCI. J. Electron. Sci. Technol. 2021, 19, 100021. [Google Scholar] [CrossRef]
- Mosalam, H.A.; Amer, R.A.; Morsy, G. Fuzzy logic control for a grid-connected PV array through Z-source-inverter using maximum constant boost control method. Ain Shams Eng. J. 2018, 9, 2931–2941. [Google Scholar] [CrossRef]
- Shinde, U.K.; Kadwane, S.G.; Gawande, S.P.; Reddy, M.J.B.; Mohanta, D.K. Sliding Mode Control of Single-Phase Grid-Connected Quasi-Z-Source Inverter. IEEE Access 2017, 5, 10232–10240. [Google Scholar] [CrossRef]
- Bagheri, F.; Komurcugil, H.; Kukrer, O.; Guler, N.; Bayhan, S. Multi-Input Multi-Output-Based Sliding-Mode Controller for Single-Phase Quasi-Z-Source Inverters. IEEE Trans. Ind. Electron. 2020, 67, 6439–6449. [Google Scholar] [CrossRef]
- Rostami, H.; Khaburi, D.A. Neural networks controlling for both the DC boost and AC output voltage of Z-source inverter. In Proceedings of the 2010 1st Power Electronic & Drive Systems & Technologies Conference (PEDSTC), Tehran, Iran, 17–18 February 2010; pp. 135–140. [Google Scholar] [CrossRef]
- Rastegar Fatemi, M.J.; Mirzakuchaki, S.; Rastegar Fatemi, S.M.J. Wide-Range Control of Output Voltage in Z-source Inverter by Neural Network. In Proceedings of the 2008 International Conference on Electrical Machines and Systems, Wuhan, China, 17–20 October 2008; pp. 1653–1658. [Google Scholar]
- Xu, Y.; He, Y.; Li, S. Logical Operation-Based Model Predictive Control for Quasi-Z-Source Inverter without Weighting Factor. IEEE J. Emerg. Sel. Top. Power Electron. 2021, 9, 1039–1051. [Google Scholar] [CrossRef]
- Bakeer, A.; Ismeil, M.A.; Orabi, M. A Powerful Finite Control Set-Model Predictive Control Algorithm for Quasi Z-Source Inverter. IEEE Trans. Ind. Inform. 2016, 12, 1371–1379. [Google Scholar] [CrossRef]
- Liu, Y.; Abu-Rub, H.; Xue, Y.; Tao, F. A Discrete-Time Average Model-Based Predictive Control for a Quasi-Z-Source Inverter. IEEE Trans. Ind. Electron. 2018, 65, 6044–6054. [Google Scholar] [CrossRef]
- Baier, C.R.; Villarroel, F.A.; Torres, M.A.; Pérez, M.A.; Hernández, J.C.; Espinosa, E.E. A Predictive Control Scheme for a Single-Phase Grid-Supporting Quasi-Z-Source Inverter and Its Integration with a Frequency Support Strategy. IEEE Access 2023, 11, 5337–5351. [Google Scholar] [CrossRef]
- Diaz-Bustos, M.; Baier, C.R.; Torres, M.A.; Melin, P.E.; Acuna, P. Application of a Control Scheme Based on Predictive and Linear Strategy for Improved Transient State and Steady-State Performance in a Single-Phase Quasi-Z-Source Inverter. Sensors 2022, 22, 2458. [Google Scholar] [CrossRef] [PubMed]
- Rodriguez, J.; Cortes, P. Model Predictive Control. In Predictive Control of Power Converters and Electrical Drives; John Wiley & Sons: Hoboken, NJ, USA, 2012; pp. 31–39. [Google Scholar] [CrossRef]
- Khan, W.A.; Ebrahimian, A.; Iman Hosseini S., S.; Abarzadeh, M.; Weise, N.; Al-Haddad, K. A Generalized Analytical Tuning Approach for Model Predictive Controlled Grid-Tied Converters Under Wide Range of Grid Inductance Variation. IEEE Access 2022, 10, 108261–108275. [Google Scholar] [CrossRef]
- Gonzalez-Prieto, A.; Martin, C.; González-Prieto, I.; Duran, M.J.; Carrillo-Ríos, J.; Aciego, J.J. Hybrid Multivector FCS–MPC for Six-Phase Electric Drives. IEEE Trans. Power Electron. 2022, 37, 8988–8999. [Google Scholar] [CrossRef]
- Ramírez, R.O.; Baier, C.R.; Villarroel, F.; Espinoza, J.R.; Pou, J.; Rodríguez, J. A Hybrid FCS-MPC with Low and Fixed Switching Frequency without Steady-State Error Applied to a Grid-Connected CHB Inverter. IEEE Access 2020, 8, 223637–223651. [Google Scholar] [CrossRef]
- Ali, M.; Hafeez, G.; Farooq, A.; Shafiq, Z.; Ali, F.; Usman, M.; Mihet-Popa, L. A Novel Control Approach to Hybrid Multilevel Inverter for High-Power Applications. Energies 2021, 14, 4563. [Google Scholar] [CrossRef]
- Favato, A.; Carlet, P.G.; Toso, F.; Torchio, R.; Bolognani, S. Integral Model Predictive Current Control for Synchronous Motor Drives. IEEE Trans. Power Electron. 2021, 36, 13293–13303. [Google Scholar] [CrossRef]
- Liu, X.; Qiu, L.; Wu, W.; Ma, J.; Fang, Y.; Peng, Z.; Wang, D. Neural Predictor-Based Low Switching Frequency FCS-MPC for MMC with Online Weighting Factors Tuning. IEEE Trans. Power Electron. 2022, 37, 4065–4079. [Google Scholar] [CrossRef]
- Kaymanesh, A.; Chandra, A.; Al-Haddad, K. Model Predictive Control of MPUC7-Based STATCOM Using Autotuned Weighting Factors. IEEE Trans. Ind. Electron. 2022, 69, 2447–2458. [Google Scholar] [CrossRef]
- Geyer, T.; Karamanakos, P.; Kennel, R. On the benefit of long-horizon direct model predictive control for drives with LC filters. In Proceedings of the 2014 IEEE Energy Conversion Congress and Exposition (ECCE), Pittsburgh, PA, USA, 14–18 September 2014; pp. 3520–3527. [Google Scholar] [CrossRef]
- Geyer, T.; Quevedo, D.E. Performance of Multistep Finite Control Set Model Predictive Control for Power Electronics. IEEE Trans. Power Electron. 2015, 30, 1633–1644. [Google Scholar] [CrossRef]
- Tregubov, A.; Karamanakos, P.; Ortombina, L. Long-Horizon Robust Direct Model Predictive Control for Medium-Voltage Induction Motor Drives with Reduced Computational Complexity. IEEE Trans. Ind. Appl. 2023, 59, 1775–1787. [Google Scholar] [CrossRef]
- Karamanakos, P.; Geyer, T. Guidelines for the Design of Finite Control Set Model Predictive Controllers. IEEE Trans. Power Electron. 2020, 35, 7434–7450. [Google Scholar] [CrossRef]
- Dragičević, T. Model Predictive Control of Power Converters for Robust and Fast Operation of AC Microgrids. IEEE Trans. Power Electron. 2018, 33, 6304–6317. [Google Scholar] [CrossRef]
- Young, H.A.; Marin, V.A.; Pesce, C.; Rodriguez, J. Simple Finite-Control-Set Model Predictive Control of Grid-Forming Inverters with LCL Filters. IEEE Access 2020, 8, 81246–81256. [Google Scholar] [CrossRef]
- Duan, X.; Kang, L.; Zhou, H.; Liu, Q. Multivector Model Predictive Power Control with Low Computational Burden for Grid-Tied Quasi-Z-Source Inverter without Weighting Factors. IEEE Trans. Power Electron. 2022, 37, 11739–11748. [Google Scholar] [CrossRef]
- Baier, C.R.; Flores, C.; Diaz, M.A.; Torres, M.A.; Pou, J.; Melín, P.; Espinosa, E. Reducing losses in the shoot-through state of a single-phase quasi-z-source inverter. In Proceedings of the 2017 IEEE International Telecommunications Energy Conference (INTELEC), Broadbeach, QLD, Australia, 22–26 October 2017; pp. 444–449. [Google Scholar] [CrossRef]
- Li, Y.; Jiang, S.; Cintron-Rivera, J.G.; Peng, F.Z. Modeling and Control of Quasi-Z-Source Inverter for Distributed Generation Applications. IEEE Trans. Ind. Electron. 2013, 60, 1532–1541. [Google Scholar] [CrossRef]
- Ayad, A.; Hanafiah, S.; Kennel, R. A Comparison of Quasi-Z-Source Inverter and Traditional Two-Stage Inverter for Photovoltaic Application. In Proceedings of the PCIM Europe 2015; International Exhibition and Conference for Power Electronics, Intelligent Motion, Renewable Energy and Energy Management, Nuremberg, Germany, 19–20 May 2015; pp. 1–8. [Google Scholar]
- Hussain, A.; Sher, H.A.; Murtaza, A.F.; Javadi, A.; Al-Haddad, K. Transformerless Three Phase Variable Output Voltage DC/AC Standalone Power Converter Using Modified Restrictive Control Set Model Predictive Control. IEEE J. Emerg. Sel. Top. Power Electron. 2020, 8, 3772–3783. [Google Scholar] [CrossRef]
Disclaimer/Publisher’s Note: The statements, opinions and data contained in all publications are solely those of the individual author(s) and contributor(s) and not of MDPI and/or the editor(s). MDPI and/or the editor(s) disclaim responsibility for any injury to people or property resulting from any ideas, methods, instructions or products referred to in the content. |
© 2023 by the authors. Licensee MDPI, Basel, Switzerland. This article is an open access article distributed under the terms and conditions of the Creative Commons Attribution (CC BY) license (https://creativecommons.org/licenses/by/4.0/).