Abstract
This manuscript presents a new benchmark for assessing the quality of visual summaries without the need for human annotators. It is based on the Signature Transform, specifically focusing on the RMSE and the MAE Signature and Log-Signature metrics, and builds upon the assumption that uniform random sampling can offer accurate summarization capabilities. We provide a new dataset comprising videos from Youtube and their corresponding automatic audio transcriptions. Firstly, we introduce a preliminary baseline for automatic video summarization, which has at its core a Vision Transformer, an image–text model pre-trained with Contrastive Language–Image Pre-training (CLIP), as well as a module of object detection. Following that, we propose an accurate technique grounded in the harmonic components captured by the Signature Transform, which delivers compelling accuracy. The analytical measures are extensively evaluated, and we conclude that they strongly correlate with the notion of a good summary.
1. Introduction and Problem Statement
Video data have become ubiquitous, from content creation to the animation industry. The ability to summarize the information present in large quantities of data is a central problem in many applications, particularly when there is a need to reduce the amount of information transmitted and to swiftly assimilate visual contents. Video summarization [1,2,3,4,5,6,7] has been extensively studied in Computer Vision, using both handcrafted methods [8] and learning techniques [9,10]. These approaches traditionally use feature extraction on keyframes to formulate an adequate summary.
Recent advances in Deep Neural Networks (DNN) [11,12,13] have spurred progress across various scientific fields [14,15,16,17,18,19,20,21]. In the realm of video summarization, two prominent approaches have emerged: LSTM- and RNN-based models [22,23,24]. These models have demonstrated considerable success in developing effective systems for video summarization. Additionally, numerous other learning techniques have been employed to address this challenge [25,26,27,28].
In this study, we introduce a novel concatenation of models for video summarization, capitalizing on advancements in Visual Language Models (VLM) [29,30]. Our approach combines zero-shot text-conditioned object detection with automatic text video annotations, resulting in an initial summarization method that captures the most critical information within the visual sequence.
Metrics to assess the performance of such techniques have usually relied on a human in the loop, using services such as Amazon Mechanical Turk (AMT) to provide annotated summaries for comparison. There have been attempts to introduce quantitative measures to address this problem, the most common being the F1-score, but these measures need human annotators and have shown that many state-of-the-art methodologies perform worse than mere uniform random sampling [31].
However, in this work, we go beyond the current state of the art and introduce a set of metrics based on the Signature Transform [32,33], a rough equivalent to the Fourier Transform that takes order and area into account and that contrasts the spectrum of the original video with the spectrum of the generated summary to provide a measurable score. We then propose an accurate state-of-the-art baseline based on the Signature Transform to accomplish the task. Thorough evaluations are provided, where we can see that the methodologies provide accurate video summaries, and that the technique based on the Signature Transform achieves summarization capabilities superior to the state of the art. Indeed, the temporal content present in a video timeline makes the Signature Transform an ideal candidate to assess the quality of generated summaries where a video stream is treated as a path.
Section 2 gives a primer on the Signature Transform to bring forth in Section 2.1 a set of metrics to assess the quality of visual summaries by considering the harmonic components of the signal. The metrics are then used to put forward an accurate baseline for video summarization in Section 2.2. In the following section, we introduce the concept of Foundation Models, which serves to propose a preliminary technique for the summarization of videos. Thorough experiments are conducted in Section 4, with emphasis on the newly introduced dataset and the set of measures. Section 4.1 gives an assessment of the metrics in comparison to human annotators, whereas Section 4.2 evaluates the performance of the baselines based on the Signature Transform against another technique. Finally, Section 5 delivers conclusions, addresses the limitations of the methodology, and discusses further work.
2. Signature Transform
The Signature Transform [34,35,36,37,38] is roughly equivalent to the Fourier Transform; instead of extracting information concerning frequency, it extracts information about the order and area. However, the Signature Transform differs from the Fourier Transform in that it utilizes the space of functions of paths, a more general case than the basis of the space of paths found in the Fourier Transform.
Following the work in [34], the truncated signature of order N of the path is defined as a collection of coordinate iterated integrals
Here, , where . Let be continuous, such that , and linear in the intervals in between.
2.1. RMSE and MAE Signature and Log-Signature
The F1-score between a summary and the ground truth of annotated data has been the widely accepted measure of choice for the task of video summarization. However, recent approaches highlighted the need to come up with metrics that can capture the underlying nature of the information present in the video [31].
In this work, we leverage tools from harmonic analysis by the use of the Signature Transform to introduce a set of measures, namely, Signature and Log-Signature Root Mean Squared Error (denoted from now on as RMSE Signature and Log-Signature), that can shed light on what a good summary is and serve as powerful tools to analytically quantize the information present in the selected frames.
As introduced in [32] in the context of GAN convergence assessment, the RMSE and MAE Signature and Log-Signature can be defined as follows, particularized for the application under study:
Definition 1.
Given n components of the element-wise mean of the signatures from the target summary to the score, and the same number of components of the element-wise mean of the signatures from the original video subsampled at a given frame rate and uniformly chosen, we define the Root Mean Squared Error (RMSE) and Mean Absolute Error (MAE) as
and
respectively, where .
The case for Log-Signature is analogous.
For the task of video summarization, two approaches are given. In the case where the user has annotated summaries available, is computed between an element-wise mean of the annotated summaries and the target summary to the score. If annotations are not available, a comparison against mean random uniform samples is performed, , and mean score and standard deviation are provided. Given the properties of the Signature Transform, the measure takes into consideration the harmonic components that are intrinsic to the video under study and that should be preserved once the video is shortened to produce a summary. As a matter of fact, both approaches should lead to the same conclusions, as the harmonic components present in the annotated summaries and the ones present in average in the random uniform samples should also agree. A confidence interval of the scores can be provided for a given measure by analyzing the distances in the RMSEs of annotated summaries or random uniform samples, .
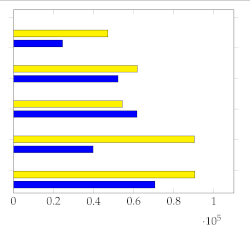
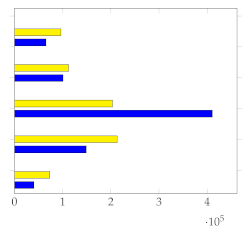
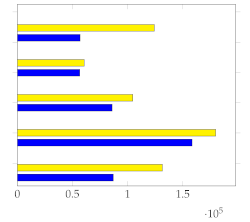
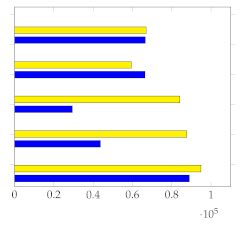
When comparing against random uniform samples, the underlying assumption is as follows: we assume that good visual summaries capturing all or most of the harmonic components present in the visual cues will achieve a lower standard deviation. In contrast, summaries that lack support for the most important components will yield higher values. For a qualitative example, see Figure 1. With these ideas in mind, we can discern techniques that likely generate consistent summaries from those that fail to convey the most critical information. Moreover, the study of random sample intervals provides a set of tolerances for considering a given summary adequate for the task, meaning it is comparable to or better than uniform sampling of the interval at capturing harmonic components. Consequently, the proposed measures allow for a percentage score representing the number of times a given methodology outperforms random sampling by containing the same or more harmonic components present in the spectrum.
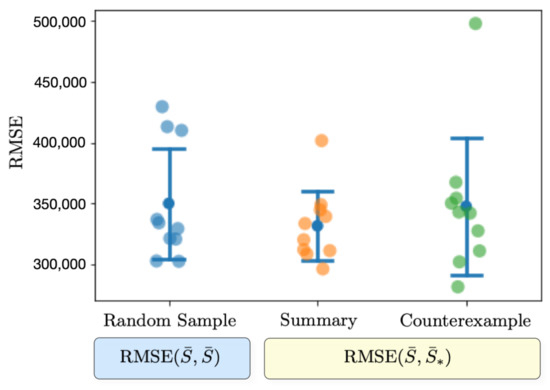
Figure 1.
Conceptual plot with and standard deviation and mean for two given summaries (our method and a counterexample) of 12 frames using a randomly picked video from Youtube to illustrate how to select a proper summary according to the proposed metric.
2.2. Summarization of Videos with RMSE Signature
Proposing a methodology based on the Signature Transform to select proper frames for a visual summary can be effectuated as follows: Given a uniform random sample of the video to summarize, we can compare it against subsequent random summaries using . We can repeat this procedure n times and choose, as a good candidate, the minimum according to the standard deviation. Using this methodology, we can also repeat the procedure for a range of selected summary lengths, which will give us a set of good candidates, among which we will choose the candidate with the minimum standard deviation. This will provide us with an estimate of the most suitable length. It is important to note that this baseline is completely unsupervised in the sense that no annotations are used, only the metrics based on the Signature Transform. We rely on the fact that, in general, uniform random samples provide relatively accurate summaries, and among those, we choose the ones that are best according to std(), which we denote as . This will grant us competitive uniform random summaries according to the given measures to use as a baseline for comparison against other methodologies, and with which we can estimate an appropriate summary length to use in those cases.
Below, we provide a description of the entities involved in the computation of the metrics and the proposed baselines based on the Signature Transform:
- : Element-wise mean Signature Transform of the target summary to the score of the corresponding video;
- : Element-wise mean Signature Transform of a uniform random sample of the corresponding video;
- : Root mean squared error between the spectra of and with the same summary length. For the computation of standard deviation and mean, this value is calculated ten times, changing ;
- : Root mean squared error between the spectra of and with the same summary length. For computation of standard deviation and mean, this value is calculated ten times, changing both each time;
- : Baseline based on the Signature Transform. It corresponds to , where is, in this case, a fixed uniform random sample denoted as . We repeat this procedure n times and choose the minimum candidate according to standard deviation, , to propose as a summary;
- : Standard deviation.
3. Summarization of Videos via Text-Conditioned Object Detection
Large Language Models (LLM) [39,40,41,42] and VLMs [43] have emerged as indispensable resources for characterizing complex tasks and bestowing intelligent systems with the capacity to interact with humans in unprecedented ways. These models, also called Foundation Models [44,45,46], excel in a wide variety of tasks, such as robotics manipulation [47,48,49], and can be integrated with other modules to perform robustly in highly complex situations such as navigation and guidance [50,51]. One fundamental module is the Vision Transformer [52].
We introduce a simple yet effective technique aimed at generating video summaries that accurately describe the information contained within video streams, while also proposing new measures for the task of the summarization of videos. These measures will prove useful not only when text transcriptions are available, but also in more general cases in which we seek to describe the quality of a video summary.
Building on the text-conditioned object detection using Vision Transformers, as recently proposed in [53], we enhance the summarization task by leveraging the automated text transcriptions found in video platforms. We utilize a module of noun extraction employing NLP techniques [54], which is subsequently processed to account for the most frequent nouns. These nouns serve as input queries for text-conditioned object searches in frames. Frames containing the queries are selected for the video summary; see Figure 2 for a detailed depiction of the methodology.
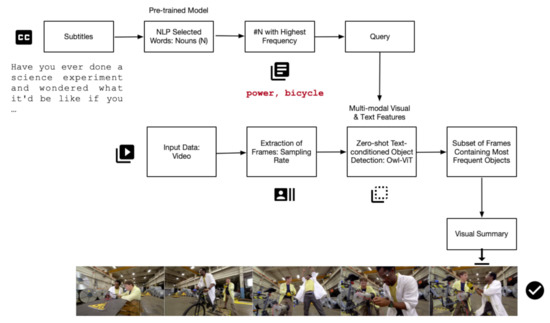
Figure 2.
Video Summarization via Zero-shot Text-conditioned Object Detection.
In this manuscript, we initially present a baseline leveraging text-conditioned object detection, specifically Contrastive Language–Image Pre-training (CLIP) [43]. To assess this approach, we employ a recently introduced metric based on the Signature Transform, which accurately gauges summary quality compared to a uniform random sample. Our preliminary baseline effectively demonstrates the competitiveness of uniform random sampling [31]. Consequently, we introduce a technique utilizing prior knowledge of the Signature, specifically the element-wise mean comparison of the spectrum, to generate highly accurate random uniform samples for summarization. The Signature Transform allows for a design featuring an inherent link between the methodology, metric, and baseline. We first present a method for evaluation, followed by a set of metrics for assessment, and ultimately, we propose a state-of-the-art baseline that can function as an independent technique.
4. Experiments: Dataset and Metrics
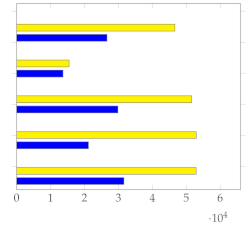
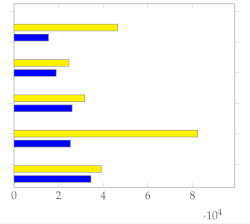
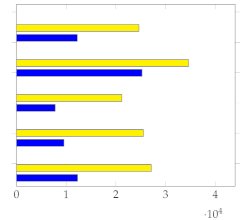
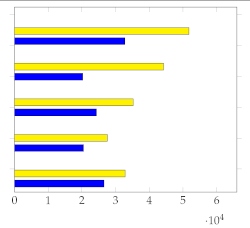
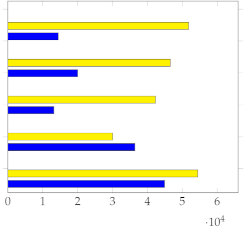
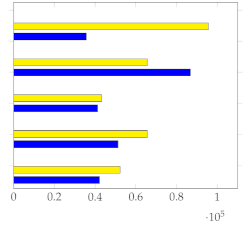
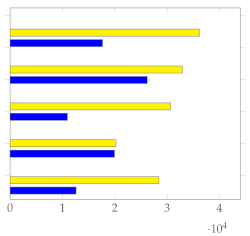
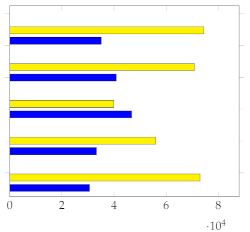
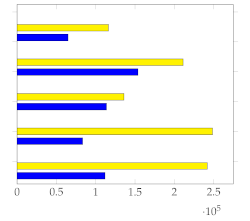
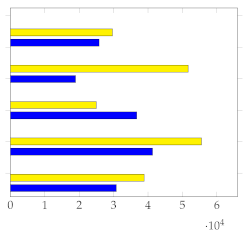
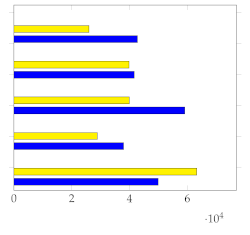
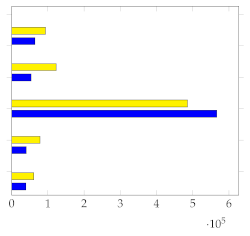
A dataset consisting of 28 videos about science experiments was sourced from Youtube, along with their automatic audio transcriptions, to evaluate the methodology and the proposed metrics. Table 1 provides a detailed description of the collected data and computed metrics, Figure 3 shows the distribution of selected frames using text-conditioned object detection over a subset of videos and the baselines based on the Signature Transform, Figure 4 depicts a visual comparison between methodologies, and Figure 5 and Figure 6 visually elucidate the RMSE distribution for each video with mean and standard deviation.

Table 1.
Descriptive statistics with (target summary against random uniform sample) and (random uniform sample against random uniform sample). and correspond to the baselines based on the Signature Transform using 10 and 20 random samples, respectively. Highlighted results in blue/brown correspond to values better than std (). Yellow values indicate when std () is lower than std ().
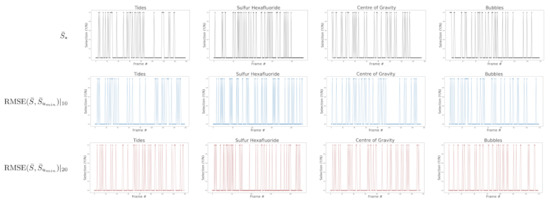
Figure 3.
Comparison of distribution of selected frames for a subset of videos (Tides, Sulfur Hexafluoride, Centre of Gravity and Bubbles) using the method based on text-conditioned object detection and the baselines using the Signature Transform.

Figure 4.
Summarization of videos using the baseline based on the Signature Transform in comparison to the summarization using text-conditioned object detection. , and summaries for two videos of the introduced dataset. The best summary among the three, according to the metric, is highlighted.
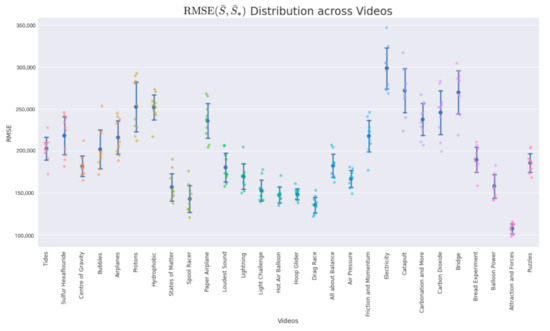
Figure 5.
Plot with standard deviation and mean.
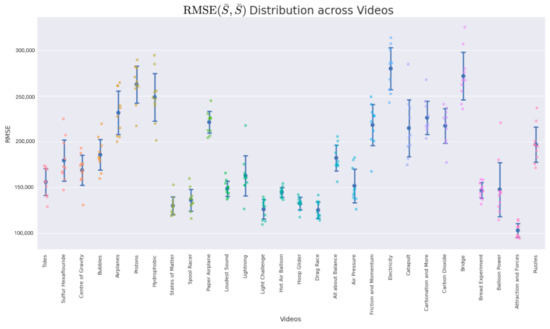
Figure 6.
Plot with standard deviation and mean.
The dataset consists of science videos covering a wide range of experiments on several topics of interest; it has an average number of 264 frames per video (sampling rate s) and an average duration of 17 min 30 s.
Figure 3 depicts the selected frames when using our methodology for a subset of videos in the dataset. The selection coincides with the trigger of the zero-shot text-conditioned object detector by the 20 most frequent word code-phrase queries, which chooses a subset of the methodology that best explains the main factors of the argument. A comparison with the baselines based on the Signature Transform with 10 and 20 points is delivered.
In all experiments that involve the computation of the Signature Transform, we use the parameters proposed in [32] that were originally used to assess synthetic distributions generated with GANs; specifically, we employ truncated signatures of order 3 with a resized image size of in grayscale.
computes the element-wise mean of the signatures of both the target summary to the score and a random uniform sample with the same number of frames, comparing their spectra with the use of the RMSE. Likewise, computes the same measure between two random uniform samples with the same number of frames. The standard deviation of both results is compared to assess the quality of the summarized video concerning the present harmonic components. The preliminary technique based on text-conditioned object detection (see Table 1) achieves a zero-shot of positive cases when compared against std (). The number of frames selected by the methodology is consistent, and it automatically selects on average of the total number of frames.
In this paragraph, we discuss the baseline based on the Signature Transform (see Table 1) in terms of the and . These techniques select a uniform random sample with minimum standard deviation in a set of 10 points and 20 points, respectively, and achieve positive cases when compared to . Under the assumption that the summary can be approximated well by a random uniform sample, which holds true in many cases, the methodology finds a set of frames that maximizes the harmonic components relative to those present in the original video.
Figure 4 displays examples of summaries using the baseline based on the Signature Transform compared to the summaries using text-conditioned object detection. The figure allows for a visual comparison of the results obtained using , and . The best summary among the three baselines according to the metric is highlighted (Table 1).
The selected frames are consistent and provide a good overall description of the original videos. Moreover, the metric based on the Signature Transform aligns well with our expectations of a high-quality summary, with better scores being assigned to summaries that effectively convey the content present in the original video.
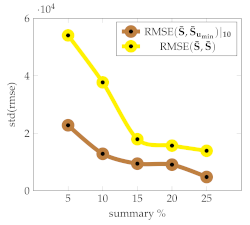
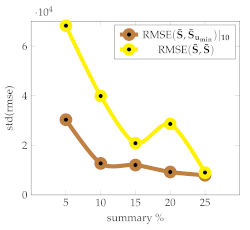
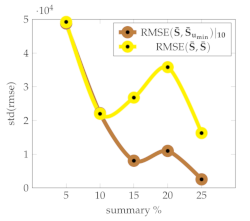
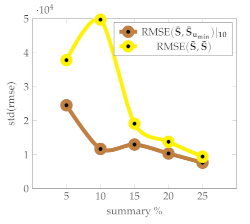
Table 2 presents a qualitative analysis of the baseline based on the Signature Transform using 10 points, and with a varying number of frames per summary. We observe that reflects the variability of the harmonic components present; that is, it is preferable to work with lengths for which the variability among summaries is low, according to the standard deviation. indicates the minimum standard deviation achieved in a set of 10 points, meaning that given a computational budget allowing us to select up to a specific number of frames, a good choice is to pick the length that yields the minimum with low variability, as per .

Table 2.
Descriptive statistics for a set of videos with varying numbers of frames per summary with (brown) and (yellow).
(Figure 5) and (Figure 6) show the respective distribution of RMSE values (10 points) with the mean and standard deviation. Low standard deviations, in comparison with the random uniform sample counterparts, indicate good summarization capabilities.
4.1. Assessment of the Metrics
The metrics have been rigorously evaluated using the dataset in [1], which consists of short videos sourced from Youtube, and includes 5 annotated summaries per video for a total of 20. Table 3 and Table 4 report the results, using a one-frame-per-second sampling rate. In this case, the average number of times that the human annotator outperforms uniform random sampling according to the proposed metric, std (), is . Several observations emerge from these findings:

Table 3.
Descriptive statistics with (target summary against random uniform sample) and (random uniform sample against random uniform sample). Lower is better. Sampling rate: 1 frame per second. Dataset in [1], videos from V11 to V20. Highlighted results in blue/yellow correspond to the lowest values, either std () or std (), respectively.

Table 4.
Descriptive statistics with (target summary against random uniform sample) and (random uniform sample against random uniform sample). Lower is better. Sampling rate: 1 frame per second. Dataset in [1], videos from V71 to V80. Highlighted values correspond to the lowest standard deviation.
- The proposed metrics demonstrate that human evaluators can perform above average during the task, effectively capturing the dominant harmonic frequencies present in the video.
- Another crucial aspect to emphasize is that the metrics are able to evaluate human annotators with fair criteria and identify which subjects are creating competitive summaries.
- Moreover, the observations from this study indicate that the metrics serve as a reliable proxy for evaluating summaries without the need for annotated data, as they correlate strongly with human annotations.
Figure 7 shows the mean and standard deviation for each human-annotated summary (user 1 to user 5) for the subset of 20 videos from [1], using a sampling rate of 1 frame per second. For each video, a visual inspection of the error plot bar for each annotated summary provides an accurate estimate of the quality of the annotation compared to other users. Specifically:
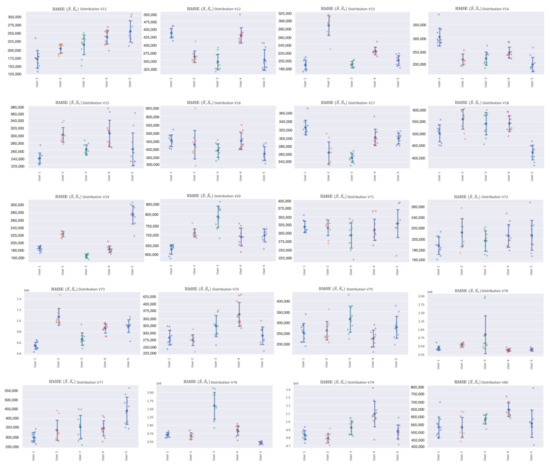
Figure 7.
Error bar plot with mean and standard deviation for each human-annotated summary of the subset of 20 videos from [1]. Sampling rate: 1 frame per second.
- Annotations with lower standard deviations offer a better harmonic representation of the overall video;
- Annotations with higher standard deviations suggest that important harmonic components are missing from the given summary;
- The metrics make it simple to identify annotated summaries that may need to be relabeled for improved accuracy.
Furthermore, these metrics remain consistent when applied to various sampling rates.
That being said, there are several standard measures that are commonly used for video summarization, such as F1 score, precision, recall, and Mean Opinion Score (MOS). Each of these measures has its own strengths and weaknesses. Compared to these standard measures, the proposed benchmark based on the Signature Transform has several potential advantages. Here are a few reasons for this:
- Content based: the Signature Transform is a content-based approach that captures the salient features of the video data. This means that the proposed measure is not reliant on manual annotations or subjective human ratings, which can be time consuming and prone to biases.
- Robustness: the Signature Transform is a robust feature extraction technique that can handle different types of data, including videos with varying frame rates, resolutions, and durations. This means that the proposed measure can be applied to a wide range of video datasets without the need for pre-processing or normalization.
- Efficiency: the Signature Transform is a computationally efficient approach that can be applied to large-scale datasets. This means that the proposed measure can be used to evaluate the effectiveness of visual summaries quickly and accurately.
- Flexibility: the Signature Transform can be applied to different types of visual summaries, including keyframe-based and shot-based summaries. This means that the proposed measure can be used to evaluate different types of visual summaries and compare their effectiveness.
Overall, the proposed measure based on the Signature Transform has the potential to provide a more accurate and comprehensive assessment of the standard of visual summaries compared to the preceding measures used in video summarization.
Figure 8 shows a summary that is well annotated by all users, demonstrating that the metrics can accurately indicate when human annotators have effectively summarized the information present in the video.
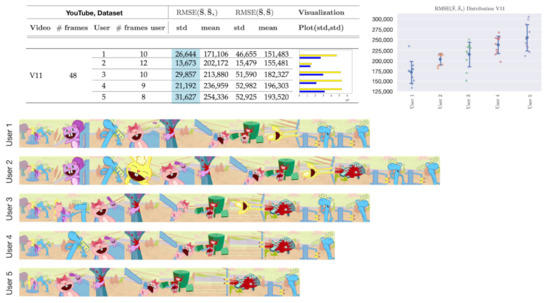
Figure 8.
Visual depiction of human annotated summaries together with and of video V11, Table 3. Sampling rate: 1 frame per second. Highlighted values on the table correspond to the lowest standard deviation.
To illustrate how these metrics can help improve annotations, Figure 9 displays the metrics along with the annotated summaries of users 1 to 5. We observe that selecting the frames highlighted by users 1–4 can increase the performance if user 5 is asked to relabel its summary.
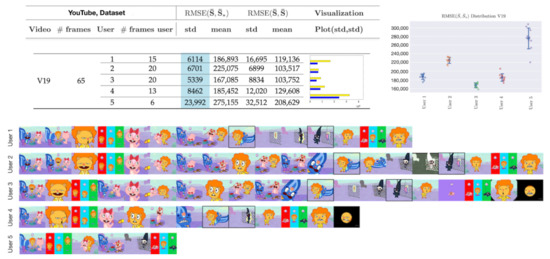
Figure 9.
Visual depiction of human annotated summaries together with and of video V19, Table 3. Sampling rate: 1 frame per second. Highlighted frames can increase the accuracy of the annotated summary by user 5. Highlighted values on the table correspond to the lowest standard deviation.
Figure 10 showcases an example in which random uniform sampling outperforms the majority of human annotators. This occurs because the visual information is uniformly distributed throughout the video. In this case, user 5 performs the best, scoring slightly higher than std (. Highlighted values on the table correspond to the lowest standard deviation.).
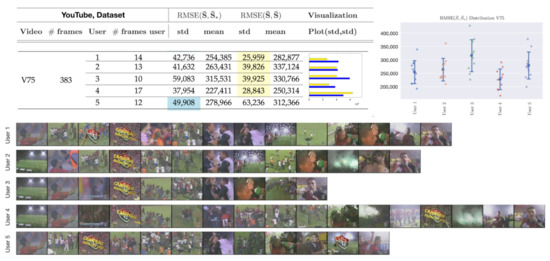
Figure 10.
Visual depiction of human annotated summaries, together with and of video V75, Table 4. Sampling rate: 1 frame per second. Highlighted values on the table correspond to the lowest standard deviation.
Similarly, Figure 11 presents an example in which incorporating the highlighted frames improves the accuracy of the annotated summary by user 3, which is currently performing worse than uniform random sampling, according to the metrics.
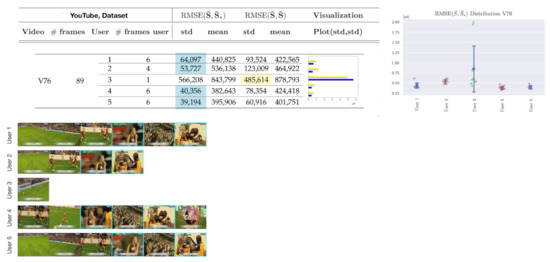
Figure 11.
Visual depiction of human annotated summaries together with and of video V76, Table 4. Sampling rate: 1 frame per second. Highlighted frames can increase the accuracy of the annotated summary by user 3. Highlighted values on the table correspond to the lowest standard deviation.
4.2. Evaluation
In this section, we evaluate the baselines and metrics compared to VSUMM [1], a methodology based on handcrafted techniques that performs particularly well on this dataset. Table 5 displays the comparison between the standard deviation of and , as well as against the baselines based on the Signature Transform, and , with 10 and 20 points, respectively.

Table 5.
VSUMM [1] comparison against baseline based on the Signature Transform for the first 20 videos of the dataset crawled from Youtube. Descriptive statistics with (target summary against random uniform sample) and (random uniform sample against random uniform sample). and correspond to the baselines based on the Signature Transform using 10 and 20 random samples, respectively. Highlighted results are better than std (). Sampling rate: 1 frame per second. Highlighted results correspond to lowest standard deviation as described in Table 1.
We can observe how the metrics effectively capture the quality of the visual summaries and how the introduced methodology based on the Signature Transform achieves state-of-the-art results with both 10 and 20 points. The advantages of using a technique that operates on the spectrum of the signal, compared to other state-of-the-art systems, is that it can generate visual summaries without fine-tuning the methodology. In other words, there is no need to train on a subset of the target distribution of videos, but rather, compelling summaries can be generated at once for any dataset. Moreover, this approach is highly efficient, as computation is performed on the CPU and consists only of calculating the Signature Transform, element-wise mean, and RMSE. These operations can be further optimized for rapid on-device processing or for deploying in parallel at the tera-scale level.
5. Conclusions and Future Work
In this manuscript, we propose a benchmark based on the Signature Transform to evaluate visual summaries. For this purpose, we introduce a dataset consisting of videos obtained from Youtube related to science experiments with automatic audio transcriptions. A baseline, based on zero-shot text-conditioned object detection, is used as a preliminary technique in the study to evaluate the metrics. Subsequently, we present an accurate baseline built on the prior knowledge that the Signature provides. Furthermore, we conduct rigorous comparison against human-annotated summaries to demonstrate the high correlation between the measures and the human notion of a good summary.
One of the main contributions of this work is that techniques based on the Signature Transform can be integrated with any state-of-the-art method in the form of a gate that activates when the method performs worse than the metric, .
The experiments conducted in this work lead to the following conclusion: if a method for delivering a summarization technique is proposed that involves complex computation (e.g., DNN techniques or Foundation Models), it must provide better summarization capabilities than the baselines based on the Signature Transform, which serve as lower bounds for uniform random samples. If not, there is no need to use a more sophisticated technique that would involve greater computational and memory overhead and possibly require training data. The only exception to this would be when additional constraints are present in the problem, such as when summarization must be performed by leveraging audio transcriptions (as in the technique based on text-conditioned object detection) or any other type of multimodal data.
That being said, the methodology proposed based on the Signature Transform, although accurate and effective, is built on the overall representation of harmonic components of the signal. Videlicet, under certain circumstances, can provide summaries in which frames are selected due to low-level representations of the signal, such as color and image intensity, rather than the storyline. Moreover, it assumes that, in general, uniform random sampling can provide good summarization capabilities, which is supported by the literature. However, this assumption is not fulfilled in all circumstances. Therefore, in subsequent works, it would be desirable to develop techniques that perform exceptionally well according to the metrics while simultaneously bestowing a level of intelligence similar to the methodology based on Foundation Models. This would take into account factors such as the human concept of detected objects, leading to more context-aware and meaningful summarization.
Author Contributions
Conceptualization, J.d.C. and I.d.Z.; funding acquisition, C.T.C. and G.R.; investigation, J.d.C. and I.d.Z.; methodology, J.d.C. and I.d.Z.; software, J.d.C. and I.d.Z.; supervision, G.R. and C.T.C.; writing—original draft, J.d.C.; writing—review and editing, C.T.C., G.R., J.d.C. and I.d.Z. All authors have read and agreed to the published version of the manuscript.
Funding
This work was supported by the HK Innovation and Technology Commission (InnoHK Project CIMDA). We acknowledge the support of Universitat Politècnica de València; R&D project PID2021-122580NB-I00, funded by MCIN/AEI/10.13039/501100011033 and ERDF. We thank the following funding sources from GOETHE-University Frankfurt am Main; ‘DePP—Dezentrale Plannung von Platoons im Straßengüterverkehr mit Hilfe einer KI auf Basis einzelner LKW’ and ‘Center for Data Science & AI’.
Data Availability Statement
https://doi.org/10.24433/CO.7648856.v2 (accessed on 1 March 2023).
Conflicts of Interest
The authors declare that they have no conflicts of interest. The funders had no role in the design of the study, in the collection, analyses, or interpretation of data, in the writing of the manuscript, or in the decision to publish the results.
Abbreviations
The following abbreviations are used in this manuscript:
| DNN | Deep Neural Networks |
| AMT | Amazon Mechanical Turk |
| RMSE | Root Mean Squared Error |
| MAE | Mean Absolute Error |
| VLM | Visual Language Models |
| LLM | Large Language Models |
| GAN | Generative Adversarial Networks |
| CLIP | Contrastive Language–Image Pre-training |
| LSTM | Long Short-Term Memory |
| RNN | Recurrent Neural Network |
| NLP | Natural Language Processing |
| CPU | Central Processing Unit |
| MOS | Mean Opinion Score |
References
- de Avila, S.E.F.; Lopes, A.; da Luz, A., Jr.; de Albuquerque Araújo, A. VSUMM: A mechanism designed to produce static video summaries and a novel evaluation method. Pattern Recognit. Lett. 2011, 32, 56–68. [Google Scholar] [CrossRef]
- Gygli, M.; Grabner, H.; Gool, L.V. Video summarization by learning submodular mixtures of objectives. In Proceedings of the 2015 IEEE Conference on Computer Vision and Pattern Recognition (CVPR), Boston, MA, USA, 7–12 June 2015. [Google Scholar]
- Gygli, M.; Grabner, H.; Riemenschneider, H.; Van Gool, L. Creating summaries from user videos. In Proceedings of the Computer Vision–ECCV 2014: 13th European Conference, Zurich, Switzerland, 6–12 September; Springer: Berlin/Heidelberg, Germany, 2014. [Google Scholar]
- Kanehira, A.; Gool, L.V.; Ushiku, Y.; Harada, T. Viewpoint-aware video summarization. In Proceedings of the 2018 IEEE Conference on Computer Vision and Pattern Recognition (CVPR), Salt Lake City, UT, USA, 18–23 June 2018. [Google Scholar]
- Liang, G.; Lv, Y.; Li, S.; Zhang, S.; Zhang, Y. Video summarization with a convolutional attentive adversarial network. Pattern Recognit. 2022, 131, 108840. [Google Scholar] [CrossRef]
- Song, Y.; Vallmitjana, J.; Stent, A.; Jaimes, A. TVSum: Summarizing web videos using titles. In Proceedings of the 2015 IEEE Conference on Computer Vision and Pattern Recognition (CVPR), Boston, MA, USA, 7–12 June 2015; pp. 5179–5187. [Google Scholar]
- Zhu, W.; Lu, J.; Han, Y.; Zhou, J. Learning multiscale hierarchical attention for video summarization. Pattern Recognit. 2022, 122, 108312. [Google Scholar] [CrossRef]
- Ngo, C.-W.; Ma, Y.-F.; Zhang, H.-J. Automatic video summarization by graph modeling. In Proceedings of the Ninth IEEE International Conference on Computer Vision, Nice, France, 13–16 October 2003. [Google Scholar]
- Fajtl, J.; Sokeh, H.S.; Argyriou, V.; Monekosso, D.; Remagnino, P. Summarizing videos with attention. In Proceedings of the Computer Vision—ACCV 2018 Workshops: 14th Asian Conference on Computer Vision, Perth, Australia, 2–6 December; Springer: Berlin/Heidelberg, Germany, 2018. [Google Scholar]
- Zhu, W.; Lu, J.; Li, J.; Zhou, J. DSNet: A flexible detect-to-summarize network for video summarization. IEEE Trans. Image Process. 2020, 30, 948–962. [Google Scholar] [CrossRef] [PubMed]
- He, K.; Zhang, X.; Ren, S.; Sun, J. Deep residual learning for image recognition. In Proceedings of the IEEE Conference on Computer Vision and Pattern Recognition (CVPR), Las Vegas, NV, USA, 27–30 June 2016. [Google Scholar]
- Hochreiter, S.; Schmidhuber, J. Long short-term memory. Neural Comput. 1997, 9, 1735–1780. [Google Scholar] [CrossRef] [PubMed]
- Tran, D.; Bourdev, L.; Fergus, R.; Torresani, L.; Paluri, M. Learning spatiotemporal features with 3d convolutional networks. In Proceedings of the IEEE International Conference on Computer Vision (ICCV), Santiago, Chile, 7–13 December 2015. [Google Scholar]
- de Curtò, J.; de Zarzà, I.; Yan, H.; Calafate, C.T. On the applicability of the hadamard as an input modulator for problems of classification. Softw. Impacts 2022, 13, 100325. [Google Scholar] [CrossRef]
- de Zarzà, I.; de Curtò, J.; Calafate, C.T. Detection of glaucoma using three-stage training with efficientnet. Intell. Syst. Appl. 2022, 16, 200140. [Google Scholar] [CrossRef]
- Dwivedi, K.; Bonner, M.F.; Cichy, R.M.; Roig, G. Unveiling functions of the visual cortex using task-specific deep neural networks. PLoS Comput. Biol. 2021, 17, e100926. [Google Scholar] [CrossRef]
- Dwivedi, K.; Roig, G.; Kembhavi, A.; Mottaghi, R. What do navigation agents learn about their environment? In Proceedings of the IEEE/CVF Conference on Computer Vision and Pattern Recognition (CVPR), New Orleans, LA, USA, 18–24 June 2022; pp. 10276–10285. [Google Scholar]
- Rakshit, S.; Tamboli, D.; Meshram, P.S.; Banerjee, B.; Roig, G.; Chaudhuri, S. Multi-source open-set deep adversarial domain adaptation. In Proceedings of the Computer Vision—ECCV: 16th European Conference, Glasgow, UK, 23–28 August 2020; Springer: Berlin/Heidelberg, Germany, 2020; pp. 735–750. [Google Scholar]
- Ronneberger, O.; Fischer, P.; Brox, T. U-Net: Convolutional networks for biomedical image segmentation. In Medical Image Computing and Computer-Assisted Intervention—MICCAI; Springer: Cham, Switzerland, 2015. [Google Scholar]
- Tan, M.; Chen, B.; Pang, R.; Vasudevan, V.; Le, Q.V. Mnasnet: Platform-aware neural architecture search for mobile. In Proceedings of the IEEE/CVF Conference on Computer Vision and Pattern Recognition (CVPR), Long Beach, CA, USA, 15–20 June 2019. [Google Scholar]
- Thao, H.; Balamurali, B.; Herremans, D.; Roig, G. Attendaffectnet: Self-attention based networks for predicting affective responses from movies. In Proceedings of the 2020 25th International Conference on Pattern Recognition (ICPR), Milan, Italy, 10–15 January 2021; pp. 8719–8726. [Google Scholar]
- Mahasseni, B.; Lam, M.; Todorovic, S. Unsupervised video summarization with adversarial lstm networks. In Proceedings of the IEEE Conference on Computer Vision and Pattern Recognition (CVPR), Honolulu, HI, USA, 21–26 July 2017. [Google Scholar]
- Zhang, K.; Chao, W.-L.; Sha, F.; Grauman, K. Video summarization with long short-term memory. In Proceedings of the Computer Vision–ECCV: 14th European Conference, Amsterdam, The Netherlands, 11–14 October 2016; Springer: Cham, Switzerland, 2016. [Google Scholar]
- Zhao, B.; Li, X.; Lu, X. Hierarchical recurrent neural network for video summarization. In Proceedings of the 25th ACM International Conference on Multimedia, Mountain View, CA, USA, 23–27 October 2017. [Google Scholar]
- Rochan, M.; Ye, L.; Wang, Y. Video summarization using fully convolutional sequence networks. In Proceedings of the Computer Vision–ECCV: 15th European Conference, Munich, Germany, 8–14 September 2018; Springer: Cham, Switzerland, 2018. [Google Scholar]
- Yuan, L.; Tay, F.E.; Li, P.; Zhou, L.; Feng, J. Cycle-sum: Cycle-consistent adversarial lstm networks for unsupervised video summarization. In Proceedings of the AAAI Conference on Artificial Intelligence, Honolulu, HI, USA, 27 January–1 February 2019. [Google Scholar]
- Zhang, K.; Grauman, K.; Sha, F. Retrospective encoders for video summarization. In Proceedings of the Computer Vision–ECCV: 15th European Conference, Munich, Germany, 8–14 September 2018; Springer: Cham, Switzerland, 2018. [Google Scholar]
- Zhou, K.; Qiao, Y.; Xiang, T. Deep reinforcement learning for unsupervised video summarization with diversity-representativeness reward. In Proceedings of the Association for the Advancement of Artificial Intelligence Conference (AAAI), New Orleans, LA, USA, 2–7 February 2018. [Google Scholar]
- Narasimhan, M.; Rohrbach, A.; Darrell, T. Clip-it! Language-Guided Video Summarization. Adv. Neural Inf. Process. Syst. 2021, 34, 13988–14000. [Google Scholar]
- Plummer, B.A.; Brown, M.; Lazebnik, S. Enhancing video summarization via vision-language embedding. In Proceedings of the IEEE Conference on Computer Vision and Pattern Recognition (CVPR), Honolulu, HI, USA, 21–26 July 2017. [Google Scholar]
- Otani, M.; Nakashima, Y.; Rahtu, E.; Heikkilä, J. Rethinking the evaluation of video summaries. In Proceedings of the IEEE/CVF Conference on Computer Vision and Pattern Recognition (CVPR), Long Beach, CA, USA, 15–20 June 2019. [Google Scholar]
- de Curtò, J.; de Zarzà, I.; Yan, H.; Calafate, C.T. Signature and Log-signature for the Study of Empirical Distributions Generated with GANs. arXiv 2022, arXiv:2203.03226. [Google Scholar]
- Lyons, T. Rough paths, signatures and the modelling of functions on streams. arXiv 2014, arXiv:1405.4537. [Google Scholar]
- Bonnier, P.; Kidger, P.; Arribas, I.P.; Salvi, C.; Lyons, T. Deep signature transforms. In Proceedings of the Advances in Neural Information Processing Systems, Vancouver, BC, Canada, 8–14 December2019; Volume 32. [Google Scholar]
- Chevyrev, I.; Kormilitzin, A. A primer on the signature method in machine learning. arXiv 2016, arXiv:1603.03788. [Google Scholar]
- Kidger, P.; Lyons, T. Signatory: Differentiable computations of the signature and logsignature transforms, on both CPU and GPU. arXiv 2020, arXiv:2001.00706. [Google Scholar]
- Liao, S.; Lyons, T.J.; Yang, W.; Ni, H. Learning stochastic differential equations using RNN with log signature features. arXiv 2019, arXiv:1908.0828. [Google Scholar]
- Morrill, J.; Kidger, P.; Salvi, C.; Foster, J.; Lyons, T.J. Neural CDEs for long time series via the log-ode method. arXiv 2021, arXiv:2009.08295. [Google Scholar]
- Alayrac, J.-B.; Donahue, J.; Luc, P.; Miech, A.; Barr, I.; Hasson, Y.; Lenc, K.; Mensch, A.; Millican, K.; Reynolds, M.; et al. Flamingo: A visual language model for few-shot learning. arXiv 2022, arXiv:2204.14198. [Google Scholar]
- Gu, X.; Lin, T.-Y.; Kuo, W.; Cui, Y. Open-vocabulary object detection via vision and language knowledge distillation. arXiv 2022, arXiv:2104.13921. [Google Scholar]
- Wei, J.; Tay, Y.; Bommasani, R.; Raffel, C.; Zoph, B.; Borgeaud, S.; Yogatama, D.; Bosma, M.; Zhou, D.; Metzler, D.; et al. Emergent abilities of large language models. arXiv 2022, arXiv:2206.07682. [Google Scholar]
- de Curtò, J.; de Zarzà, I.; Calafate, C.T. Semantic scene understanding with large language models on unmanned aerial vehicles. Drones 2023, 7, 114. [Google Scholar] [CrossRef]
- Radford, A.; Kim, J.W.; Hallacy, C.; Ramesh, A.; Goh, G.; Agarwal, S.; Sastry, G.; Askell, A.; Mishkin, P.; Clark, J. et al. Learning transferable visual models from natural language supervision. arXiv 2021, arXiv:2103.00020. [Google Scholar]
- Ramesh, A.; Pavlov, M.; Goh, G.; Gray, S.; Voss, C.; Radford, A.; Chen, M.; Sutskever, I. Zero-shot text-to-image generation. In Proceedings of the 38th International Conference on Machine Learning, Online, 18–24 July 2021; pp. 8821–8831. [Google Scholar]
- Rombach, R.; Blattmann, A.; Lorenz, D.; Esser, P.; Ommer, B. High-resolution image synthesis with latent diffusion models. In Proceedings of the 2022 IEEE/CVF Conference on Computer Vision and Pattern Recognition (CVPR), New Orleans, LA, USA, 18–24 June 2022. [Google Scholar]
- Saharia, C.; Chan, W.; Saxena, S.; Li, L.; Whang, J.; Denton, E.; Ghasemipour, S.K.S.; Ayan, B.K.; Mahdavi, S.S.; Lopes, R.G.; et al. Photorealistic text-to-image diffusion models with deep language understanding. arXiv 2022, arXiv:2205.11487. [Google Scholar]
- Cui, Y.; Niekum, S.; Gupta, A.; Kumar, V.; Rajeswaran, A. Can foundation models perform zero-shot task specification for robot manipulation? In Proceedings of the Learning for Dynamics and Control Conference, Palo Alto, CA, USA, 23–24 June 2022. [Google Scholar]
- Nair, S.; Rajeswaran, A.; Kumar, V.; Finn, C.; Gupta, A. R3M: A universal visual representation for robot manipulation. arXiv 2022, arXiv:2203.12601. [Google Scholar]
- Zeng, A.; Florence, P.; Tompson, J.; Welker, S.; Chien, J.; Attarian, M.; Armstrong, T.; Krasin, I.; Duong, D.; Wahid, A.; et al. Transporter networks: Rearranging the visual world for robotic manipulation. In Proceedings of the Conference on Robot Learning, Online, 15–18 November 2020. [Google Scholar]
- Huang, W.; Abbeel, P.; Pathak, D.; Mordatch, I. Language models as zero-shot planners: Extracting actionable knowledge for embodied agents. arXiv 2022, arXiv:2201.07207. [Google Scholar]
- Zeng, A.; Attarian, M.; Ichter, B.; Choromanski, K.; Wong, A.; Welker, S.; Tombari, F.; Purohit, A.; Ryoo, M.; Sindhwani, V.; et al. Socratic models: Composing zero-shot multimodal reasoning with language. arXiv 2022, arXiv:2204.00598. [Google Scholar]
- Dosovitskiy, A.; Beyer, L.; Kolesnikov, A.; Weissenborn, D.; Zhai, X.; Unterthiner, T.; Dehghani, M.; Minderer, M.; Heigold, G.; Gelly, S.; et al. An image is worth 16 ×16 words: Transformers for image recognition at scale. arXiv 2021, arXiv:2010.11929. [Google Scholar]
- Minderer, M.; Gritsenko, A.; Stone, A.; Neumann, M.; Weissenborn, D.; Dosovitskiy, A.; Mahendran, A.; Arnab, A.; Dehghani, M.; Shen, Z.; et al. Simple open-vocabulary object detection with vision transformers. arXiv 2022, arXiv:2205.06230. [Google Scholar]
- Bird, S.; Klein, E.; Loper, E. Natural Language Processing with Python, 1st ed.; O’Reilly Media, Inc.: Sebastopol, CA, USA, 2009. [Google Scholar]
Disclaimer/Publisher’s Note: The statements, opinions and data contained in all publications are solely those of the individual author(s) and contributor(s) and not of MDPI and/or the editor(s). MDPI and/or the editor(s) disclaim responsibility for any injury to people or property resulting from any ideas, methods, instructions or products referred to in the content. |
© 2023 by the authors. Licensee MDPI, Basel, Switzerland. This article is an open access article distributed under the terms and conditions of the Creative Commons Attribution (CC BY) license (https://creativecommons.org/licenses/by/4.0/).
