
Fault Segment Location for MV Distribution System Based on the Characteristic Voltage of LV Side


Abstract
1. Introduction
- The fault distribution characteristics of the LV side are analyzed and used for fault location.
- The transmission characteristics of the distribution transformer to the voltage on both sides of the MV and LV are analyzed, which is the basis of reflecting the fault location of the medium voltage line from the characteristic quantity on the low voltage side.
- The sensitivity of different voltages to different faults is analyzed and the characteristic voltages of each fault type are determined accordingly.
- A method is proposed to determine the fault path and fault section by using the characteristic voltage distribution characteristics of the LV side, which does not require additional measurement equipment, greatly reduces the positioning cost, and is simple to calculate.
- This method can be combined with existing MV side-based location methods to achieve more economical and accurate fault location.
2. Fault Voltage Distribution Characteristics Analysis
2.1. Study of Fault Voltage Distribution Law on MV Side
2.2. Effect of the Distribution Transformer on Voltage LV Side Characteristics
3. Fault Segment Location Method Based on LV Side Characteristic Voltage
3.1. Principle of Fault Segment Location
3.2. Determination of the Characteristic Voltage
3.3. Suspicious Fault Path Determination and Segmentation
3.4. Fault Segment Search Algorithm
3.5. Measuring Point Configuration
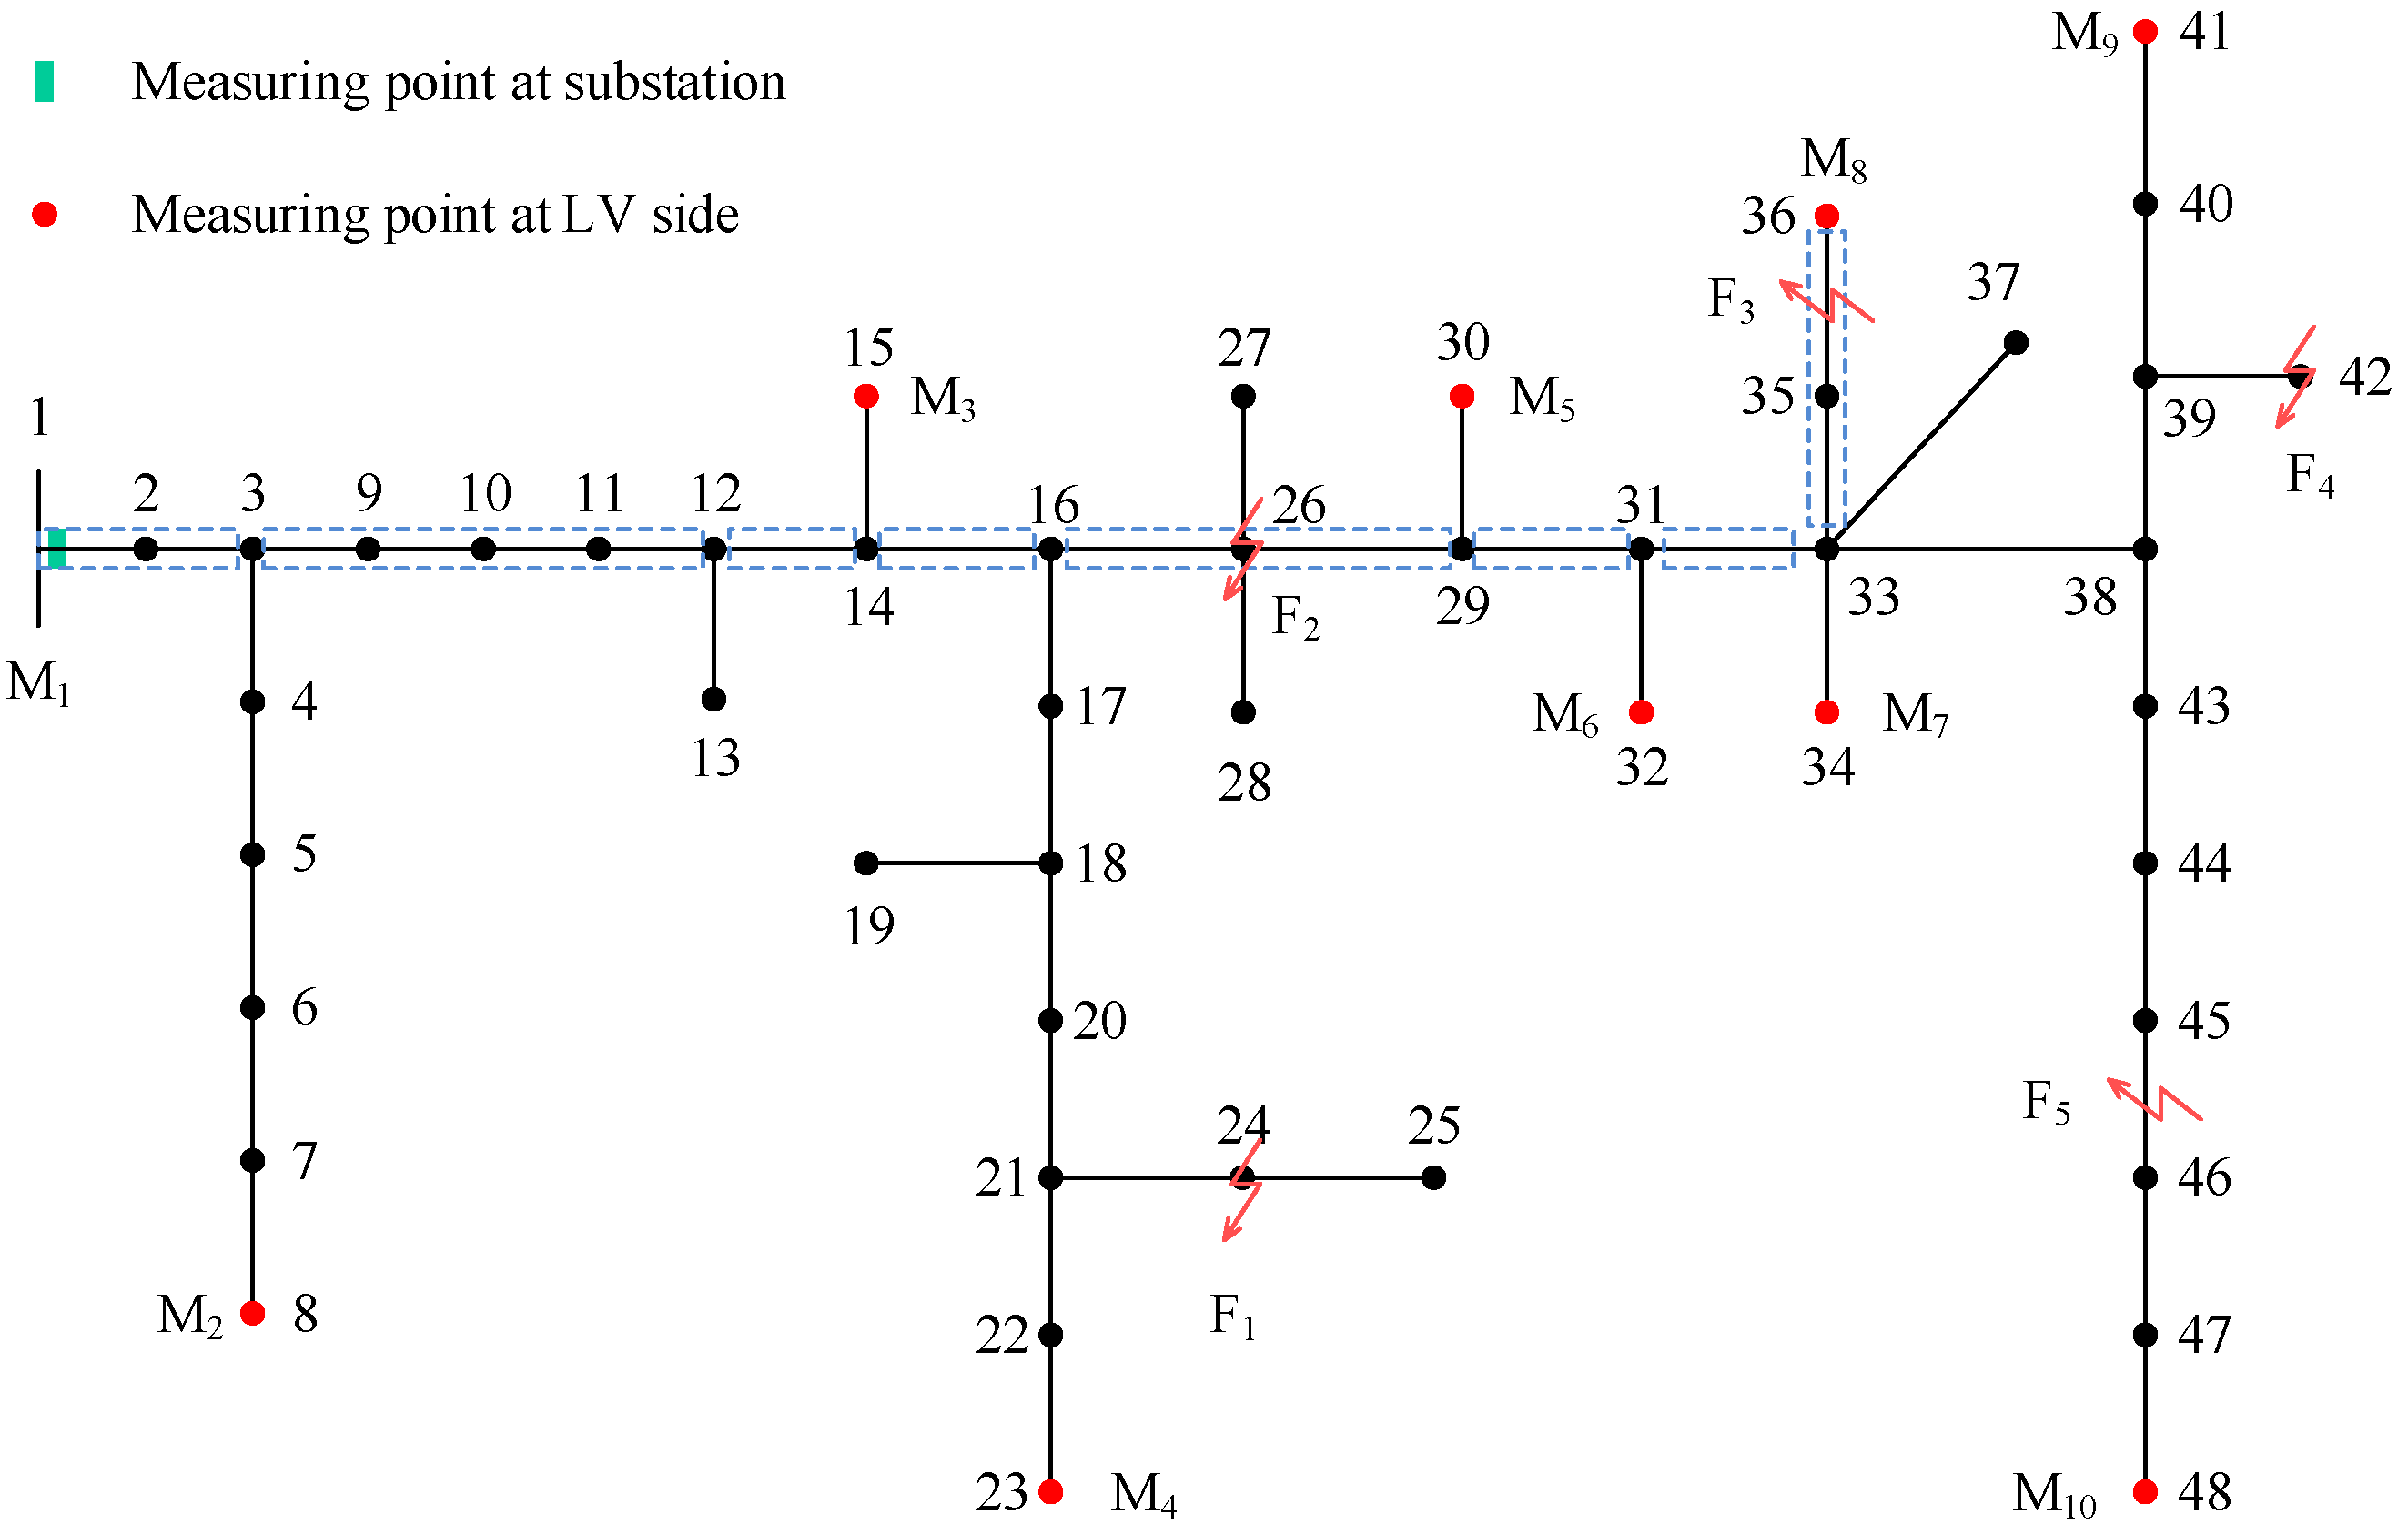
- The secondary side of the distribution transformer at the end of the long branch needs to be configured with measuring points. There is no need to allocate measuring points for the short branch under the condition of meeting the positioning accuracy. As shown in Figure 2, nodes 5, 9, 11, and 14 are at the end of the long branch. However, the branch at the end of node 12 is too short to install measuring points.
- For a feeder without branches in a larger area, the measuring point should be appropriately configured on the secondary side of the distribution transformer directly connected to the main line to meet the location accuracy. For example, the line between nodes 2 and 9 in Figure 2 does not have any branch, and the secondary side of the transformer that is directly connected to node 7 can be configured with measuring points to improve the location accuracy.
3.6. Flowchart of the Proposed Location Method
- Determination of the suspected fault path. Calculate the characteristic voltage value of each measuring point and determine the measuring point where the most characteristic voltage is located. The suspicious fault path is the shortest path between the source end and this measuring point, or the shortest path between the source end and the common nodes of multiple measuring points.
- Executing the fault segment search algorithm to determine the fault segment. The suspicious fault path is divided into segments by its branch measuring points, which should be numbered from the source side of the system. The characteristic voltage phasor difference between the two ends of the segments is used to calculate the fault determination index C of each segment. The fault segment was determined by comparing the corresponding C values of each segment.
4. Simulation Results
4.1. Case 1
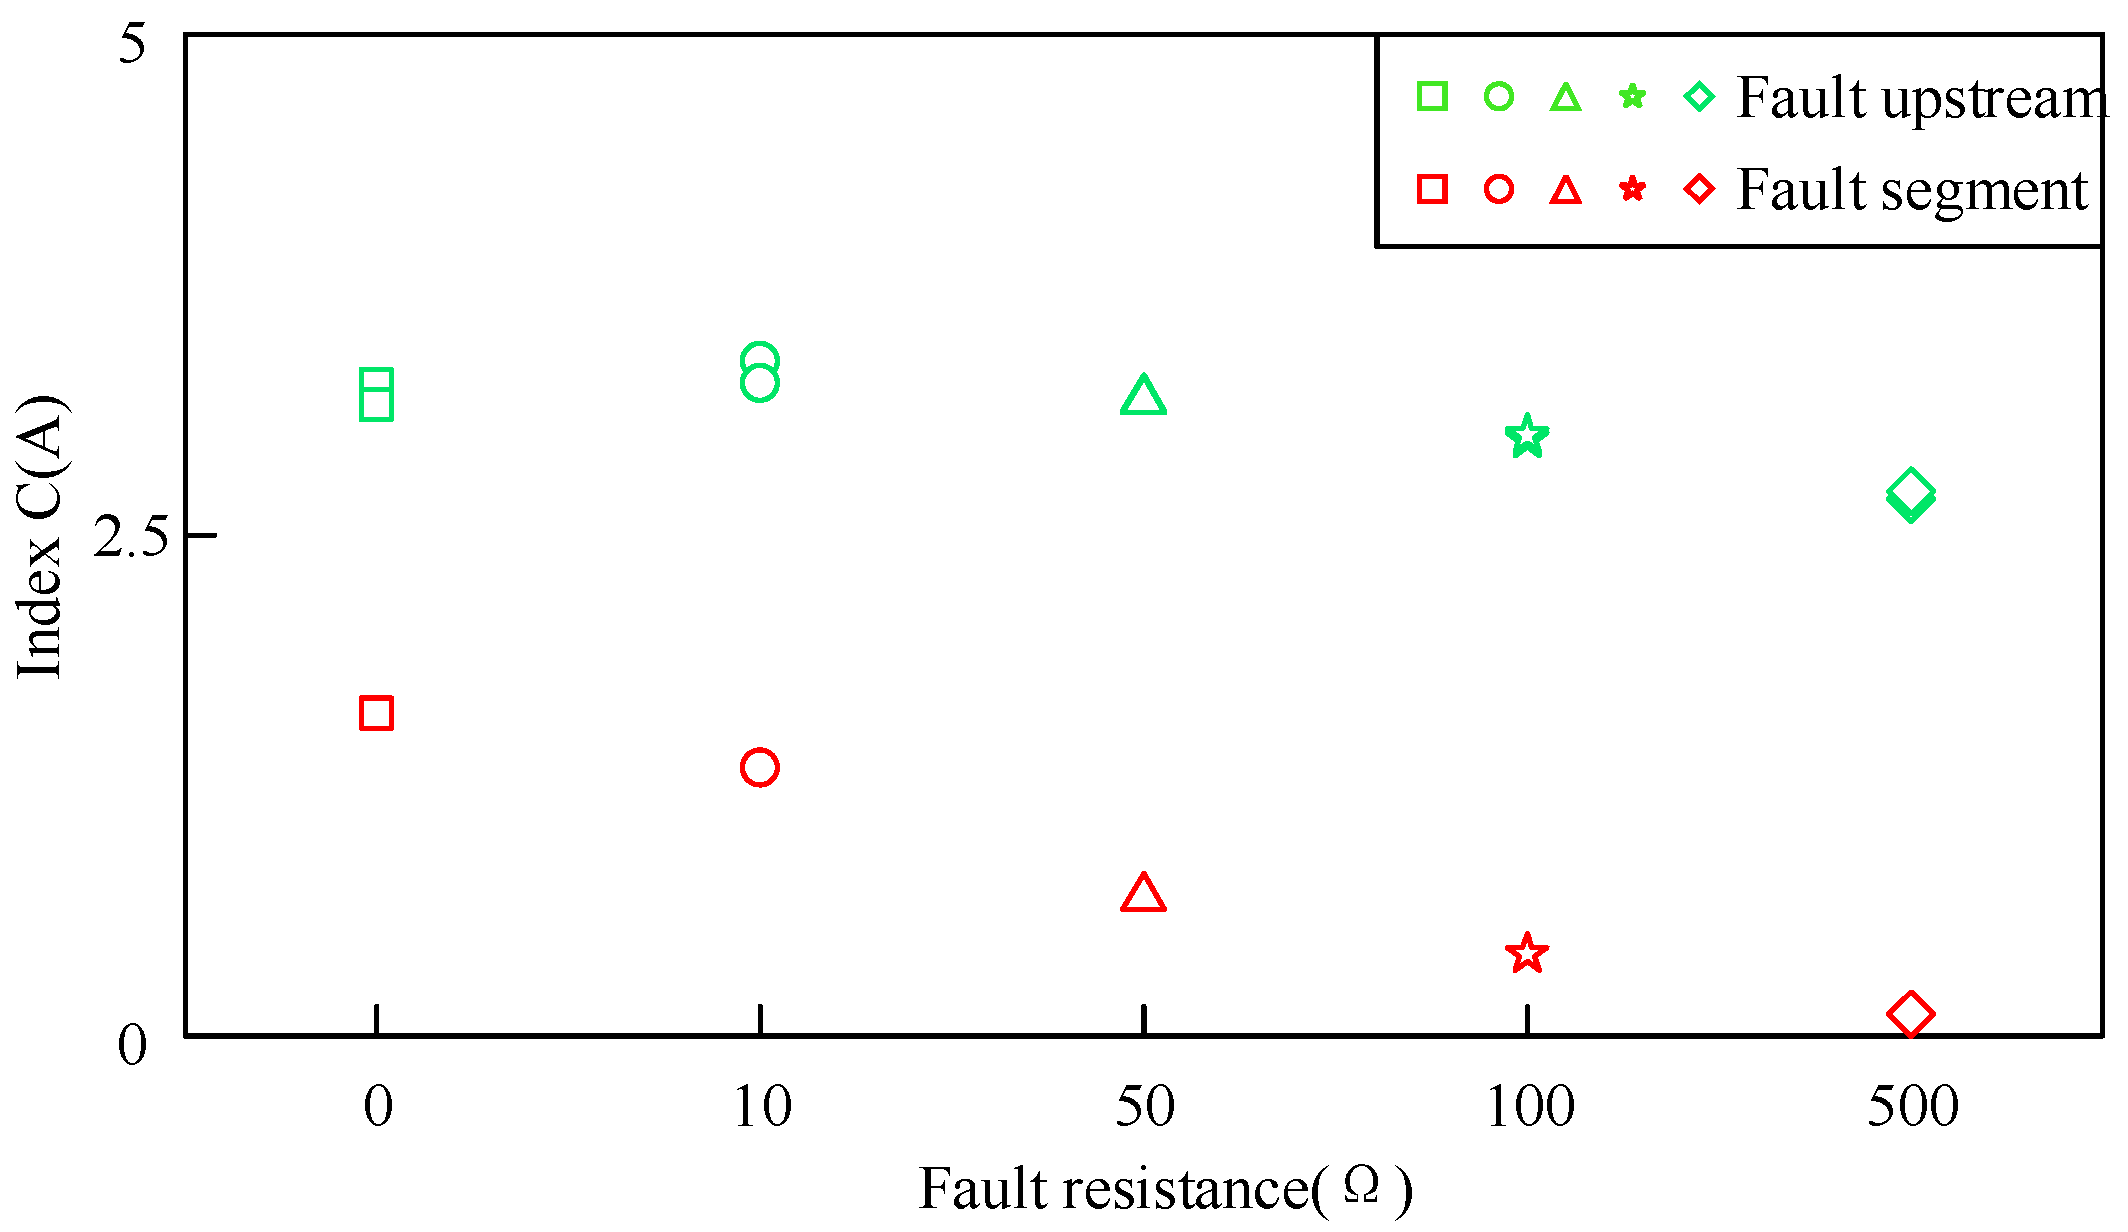
4.1.1. Effect of Fault Resistance
4.1.2. Effect of Fault Position
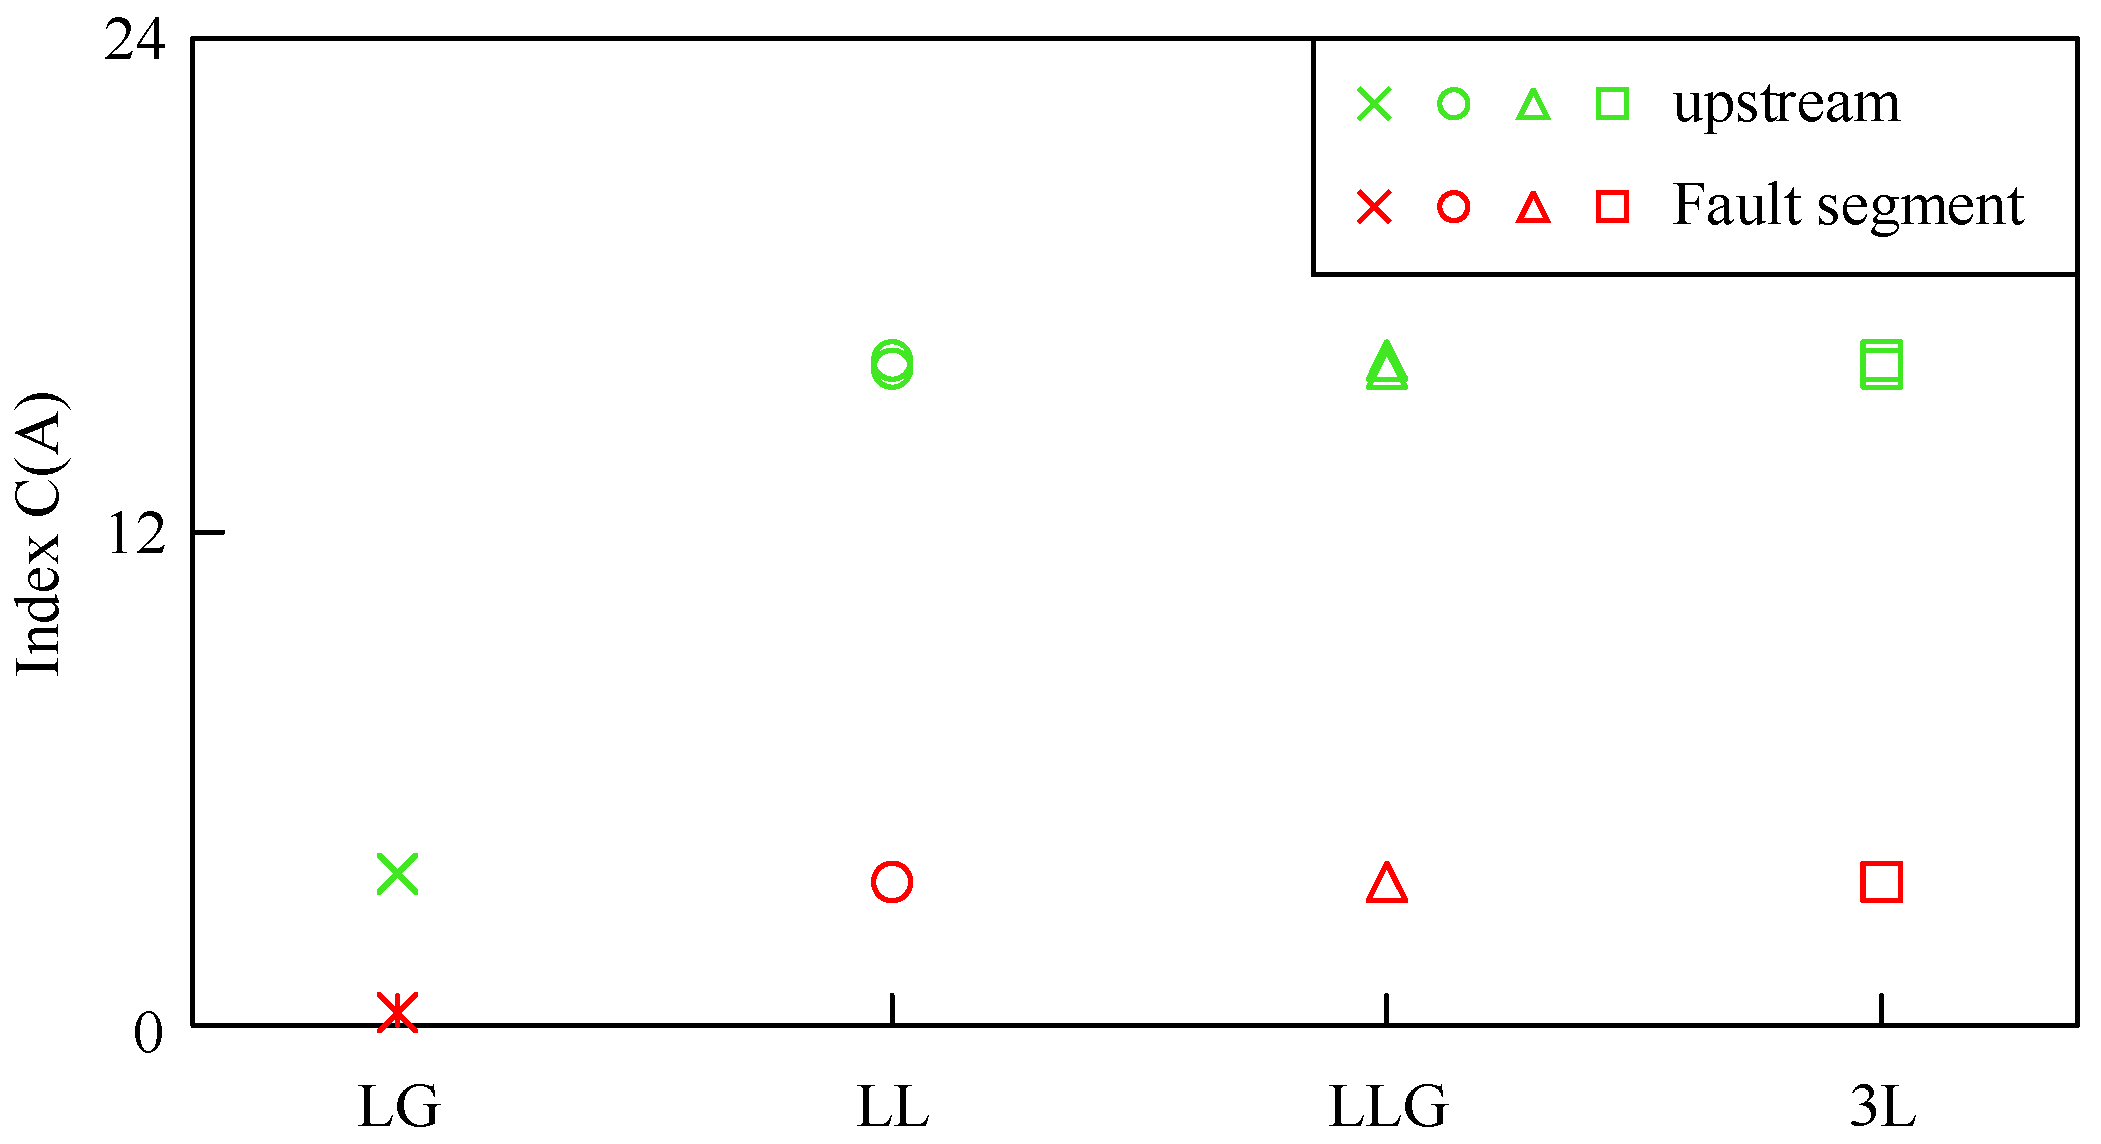
4.1.3. Effect of Fault Type
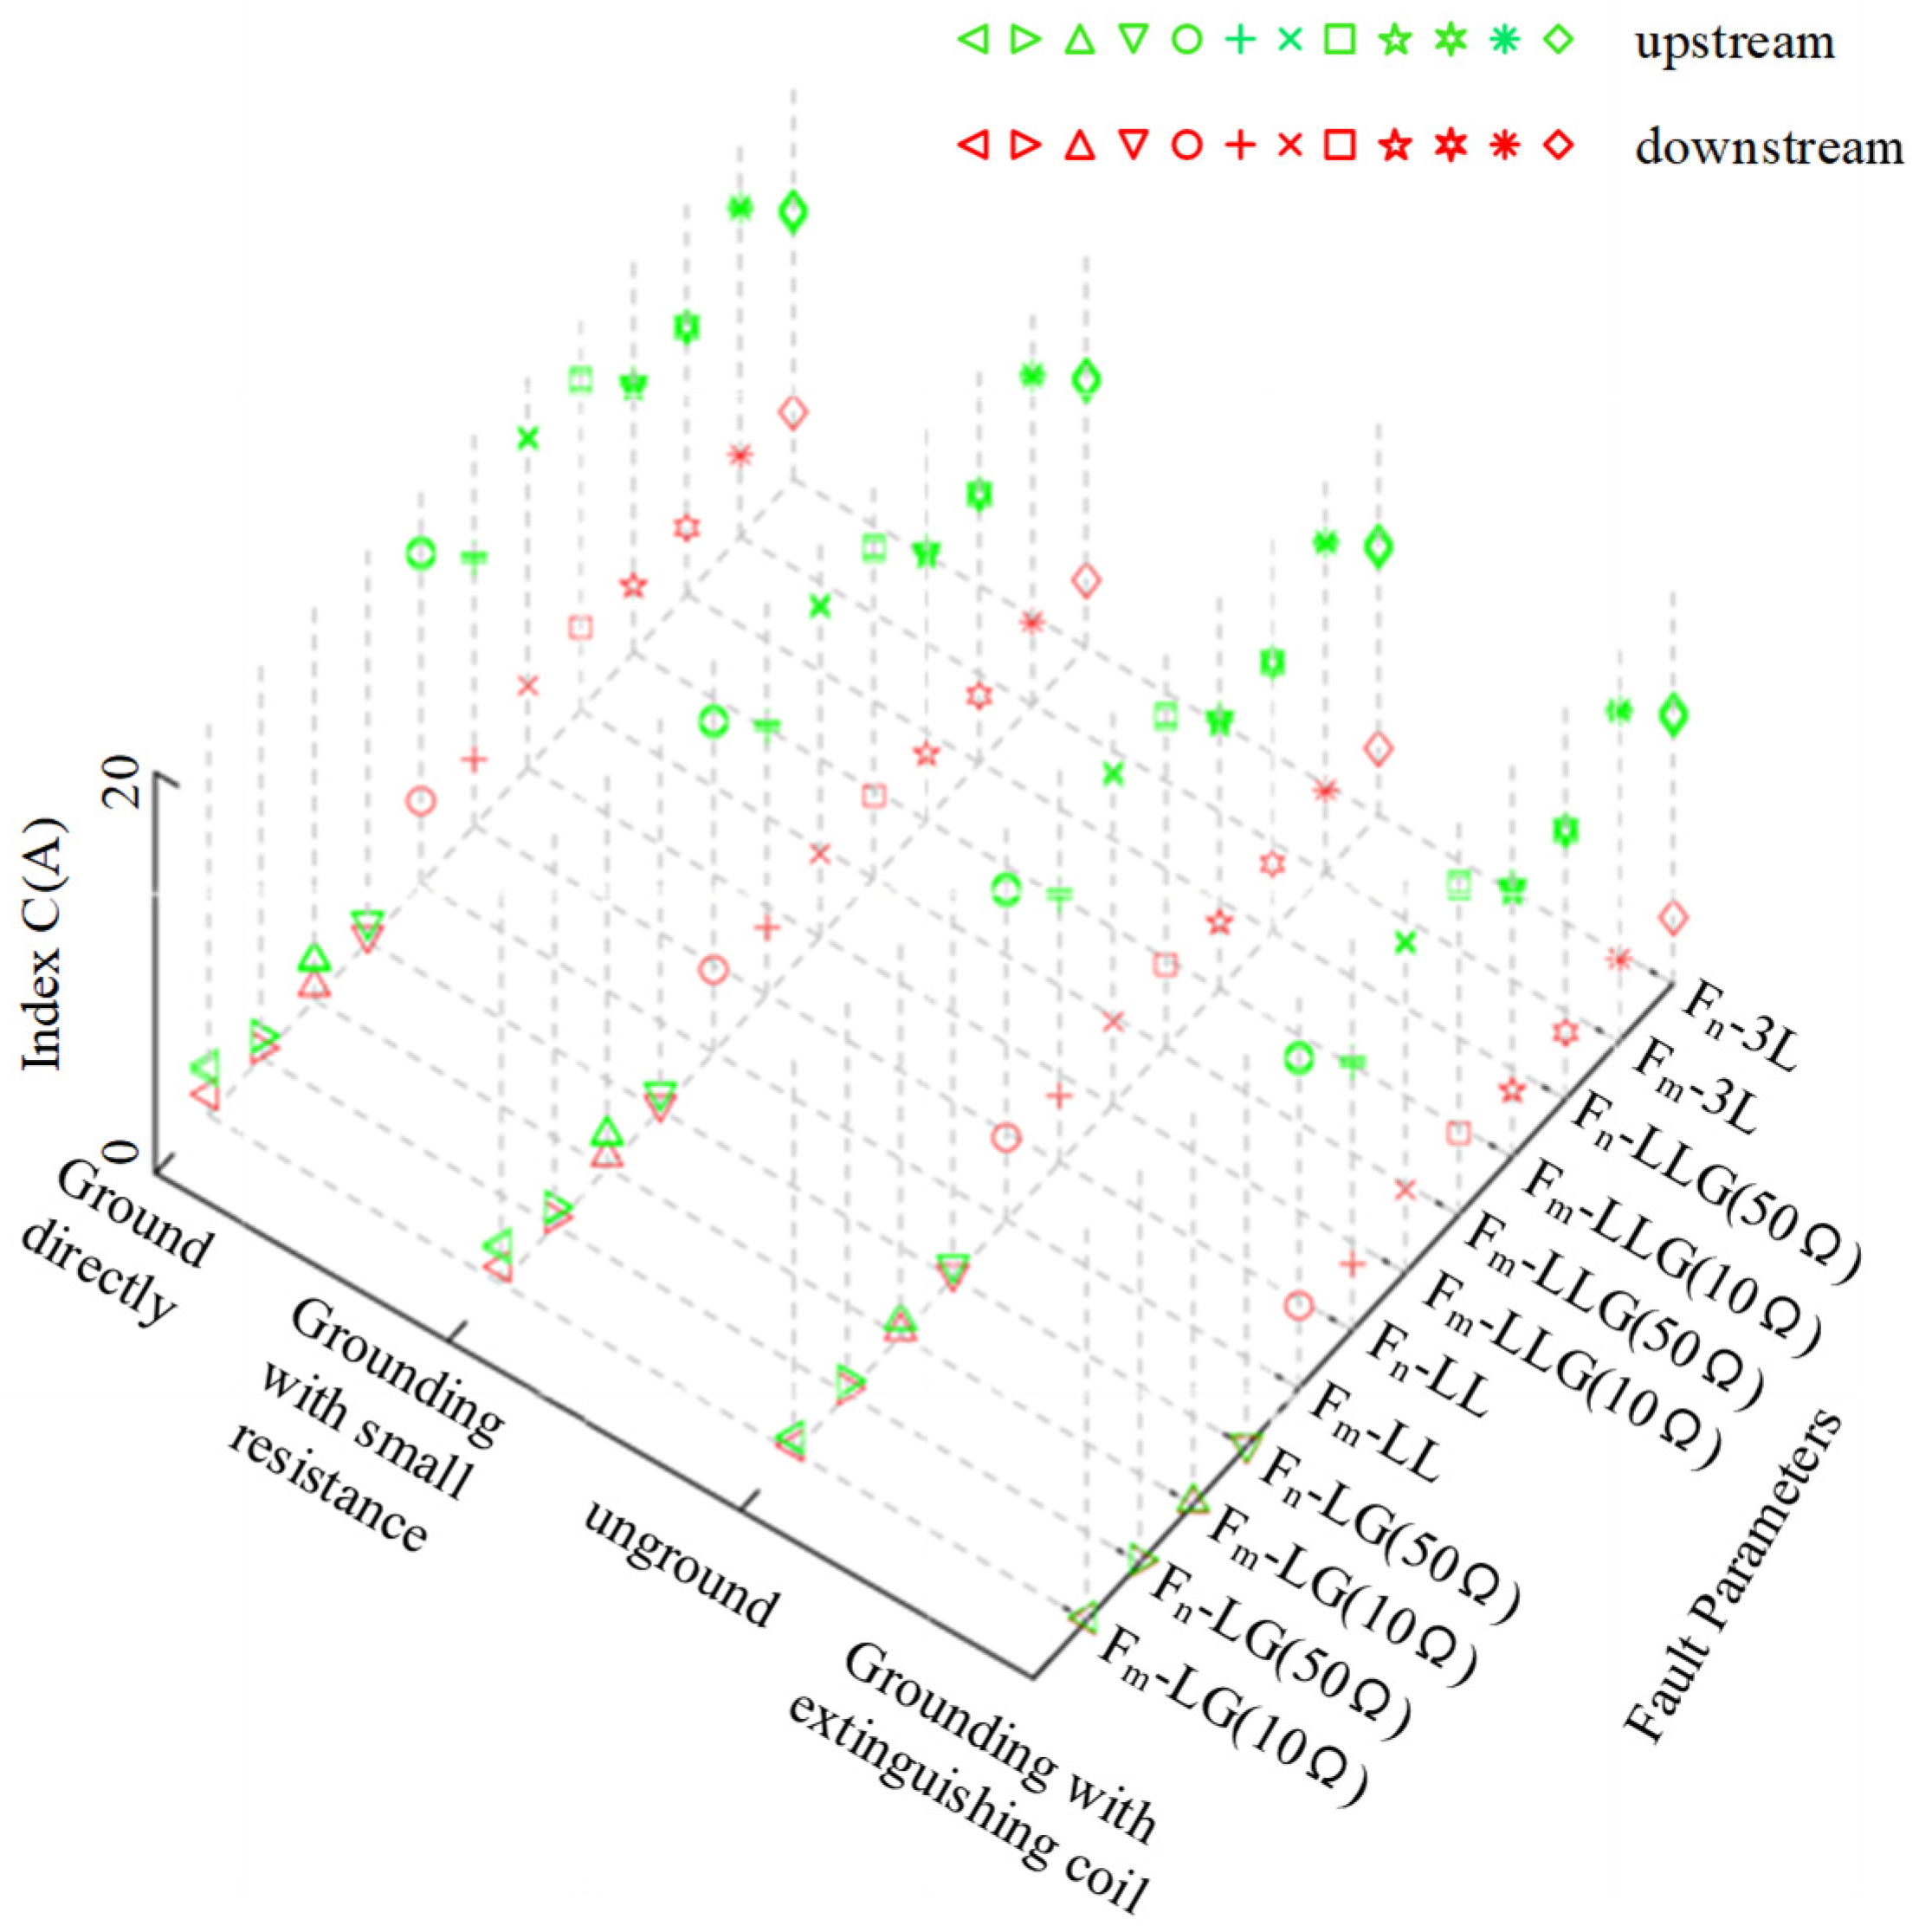
4.1.4. Effect of System Grounding Mode
4.1.5. Effect of Equipment Measurement Error
4.1.6. Sensitivity Analysis
4.1.7. Comparison with Existing MV Side Methods
4.2. Case 2
5. Conclusions
- The variation characteristics of different LV side voltages vary for different types of MV side faults. The variations in the phase, sequence, and line voltages are small in single phase to ground faults. For the remaining short-circuit faults, the variations of phase voltage, sequence voltage, and line voltage are considerable.
- The characteristic voltage of single-phase to ground fault reaches the maximum value at the fault point while that of the remaining types of faults reaches the minimum value at the fault point. Downstream of the fault, the characteristic voltage changes little along the line and remains almost the same as the fault point. Moreover, a method for determining the suspected fault path based on the characteristic voltage of the LV side is proposed.
- The characteristic voltage drops per unit distance upstream, and the fault section and the downstream fault are different, which can be used to search for the fault section in the suspected fault path. The correctness of the method proposed in this study is verified by numbers of simulation cases of the IEEE34 network and the actual distribution network in a region.
- The fault segment location scheme based on the characteristic voltage on the LV side can realize the location of the fault segment of the MV line without the measurement information on the MV side of the distribution network. The method is based on the distributed voltage measurement for the fault location, and the existing LV measurement terminals in the distribution network, such as the power information collection system and the intelligent fusion terminal, can realize the collection of the voltage and power information. In terms of technology, the method can determine the fault path by using only the distribution characteristics of the characteristic voltage on the low-voltage side and it can identify the fault section by using the characteristic voltage drop per unit of the line without particularly complicated mathematical calculations, and the steps are simple. In terms of location cost, the fault location can be performed based on the voltage data collected by the existing LV measurement terminals in the distribution network without the need for additional measurement terminals, which greatly reduces the hardware cost for the location. This method is of great value for distribution networks lacking medium voltage measurement terminals, especially in rural areas.
- In future work, we will focus on how to improve the accuracy of the single-phase ground fault location in low-current grounding systems, and the effect of single-phase lines on the proposed method will be further discussed.
Author Contributions
Funding
Data Availability Statement
Conflicts of Interest
References
- Qu, K.; Zhang, W.; Zhang, S.; Xiao, X.; Xi, Y.; Zhang, H. Model-Free Underground Cable Incipient Fault Location Using Two-Terminal Zero-Sequence Measurements. Int. J. Elect. Power Energy Syst. 2022, 140, 108057. [Google Scholar] [CrossRef]
- Tavoosi, J.; Shirkhani, M.; Azizi, A.; Din, S.; Mohammadzadeh, A.; Mobayen, S. A hybrid approach for fault location in power distributed networks: Impedance-based and machine learning technique. Electr. Power Syst. Res. 2022, 210, 108073. [Google Scholar] [CrossRef]
- Apostolopoulos, C.; Arsoniadis, C.; Georgilakis, P.; Nikolaidis, V. Fault location algorithms for active distribution systems utilizing two-point synchronized or unsynchronized measurements. Sustain. Energy Grids Netw. 2022, 32, 100798. [Google Scholar] [CrossRef]
- Apostolopoulos, C.; Arsoniadis, C.; Georgilakis, P.; Nikolaidis, V. Unsynchronized Measurements Based Fault Location Algorithm for Active Distribution Systems Without Requiring Source Impedances. IEEE Trans. Power Del. 2022, 37, 2071–2082. [Google Scholar] [CrossRef]
- Sheta, A.; Gabr, M.; Abdelfattah, A. Online tracking of fault location in distribution systems based on PMUs data and iterative support detection. Int. J. Elect. Power Energy Syst. 2021, 128, 106793. [Google Scholar] [CrossRef]
- Liang, R.; Wang, F.; Fu, G.; Xue, X.; Zhou, R. A general fault location method in complex power grid based on wide-area traveling wave data acquisition. Int. J. Elect. Power Energy Syst. 2016, 83, 213–218. [Google Scholar] [CrossRef]
- Reis, R.; Lopes, F.; Neves, W.; Fernandes, D.; Ribeiro, C.; Cunha, G. An improved single-ended correlation-based fault location technique using traveling waves. Int. J. Elect. Power Energy Syst. 2021, 132, 107167. [Google Scholar] [CrossRef]
- Tian, X.; Shu, H. A new method of single terminal traveling wave location based on characteristic of superposition of forward traveling wave and backward traveling wave. Int. J. Elect. Power Energy Syst. 2021, 133, 107072. [Google Scholar] [CrossRef]
- Qiao, J.; Yin, X.; Wang, Y.; Xu, W.; Tan, L. A Multi-Terminal Traveling Wave Fault Location Method for Active Distribution Network Based on Residual Clustering. Int. J. Elect. Power Energy Syst. 2021, 131, 107070. [Google Scholar] [CrossRef]
- Conte, F.; D’Agostino, F.; Gabriele, B.; Schiapparelli, G.-P.; Silvestro, F. Fault Detection and Localization in Active Distribution Networks Using Optimally Placed Phasor Measurements Units. IEEE Trans. Power Syst. 2023, 38, 714–727. [Google Scholar] [CrossRef]
- Galvez, C.; Abur, A. Fault Location in Power Networks Using a Sparse Set of Digital Fault Recorders. IEEE Trans. Smart Grid 2022, 13, 3468–3480. [Google Scholar] [CrossRef]
- Jia, K.; Yang, B.; Bi, T.; Zheng, L. An Improved Sparse-Measurement-Based Fault Location Technology for Distribution Networks. IEEE Trans. Ind. Inform. 2021, 17, 1712–1720. [Google Scholar] [CrossRef]
- Tashakkori, A.; Abu-Siada, A.; Wolfs, P.; Islam, S. Optimal Placement of Synchronized Voltage Traveling Wave Sensors in a Radial Distribution Network. IEEE Access. 2021, 9, 65380–65387. [Google Scholar] [CrossRef]
- Arsoniadis, C.; Apostolopoulos, C.; Georgilakis, P.; Nikolaidis, V. A voltage-based fault location algorithm for medium voltage active distribution systems. Electr. Power Syst. Res. 2021, 196, 107236. [Google Scholar] [CrossRef]
- Yang, B.; Jia, K.; Liu, Q.; Zheng, L.; Bi, T. Faulted Line-Section Location in Distribution System With Inverter-Interfaced DGs Using Sparse Meters. IEEE Trans. Smart Grid 2023, 14, 413–423. [Google Scholar] [CrossRef]
- Yun, Z.; Wen, T.; Wang, C. Fault Location Method for Three-Terminal Lines in Distribution Network Based on Line Voltage Measured by μMPMU. IEEE Trans. Smart Grid 2021, 12, 5095–5112. [Google Scholar] [CrossRef]
- Dashtdar, M.; Hussain, A.; Garni, H.; Mas’ud, A.; Haider, W.; AboRas, K.; Kotb, H. Fault Location in Distribution Network by Solving the Optimization Problem Based on Power System Status Estimation Using the PMU. Machines 2023, 11, 109. [Google Scholar] [CrossRef]
- Li, J.; Gao, M.; Liu, B.; Gao, F.; Chen, J.K. Fault Location Algorithm in Distribution Networks Considering Distributed Capacitive Current. IEEE Trans. Power Del. 2021, 36, 2785–2793. [Google Scholar] [CrossRef]
- Crespo, D.L.C.; Moreto, M. New Technique for Fault Location in Distribution Systems Using Sincrophasor Voltages. Elect. Power Syst. Res. 2022, 212, 108485. [Google Scholar] [CrossRef]
- Dobakhshari, A.S. Wide-Area Fault Location of Transmission Lines by Hybrid Synchronized/Unsynchronized Voltage Measurements. IEEE Trans. Smart Grid 2018, 9, 1869–1877. [Google Scholar] [CrossRef]
- Jia, Y.; Liu, Y.; Wang, B.; Lu, D.; Lin, Y. Power Network Fault Location with Exact Distributed Parameter Line Model and Sparse Estimation. Elect. Power Syst. Res. 2022, 212, 108137. [Google Scholar] [CrossRef]
- Sun, H.T.; Yi, H.; Zhuo, F.; Du, X.T.; Yang, G.Y. Precise Fault Location in Distribution Networks Based on Optimal Monitor Allocation. IEEE Trans. Power Del. 2020, 35, 1788–1799. [Google Scholar] [CrossRef]
- Jiang, K.; Wang, H.; Shahidehpour, M.; He, B. Block-Sparse Bayesian Learning Method for Fault Location in Active Distribution Networks With Limited Synchronized Measurements. IEEE Trans. Power Syst. 2021, 36, 3189–3203. [Google Scholar] [CrossRef]
- Trindade, F.C.L.; Freitas, W. Low Voltage Zones to Support Fault Location in Distribution Systems with Smart Meters. IEEE Trans. Smart Grid 2017, 8, 2765–2774. [Google Scholar] [CrossRef]
- Yan, V.T.; Fernandes, R.; Coury, D.V. Reducing Multiple Estimation for Fault Location in Medium Voltage Distribution Networks. Elect. Power Syst. Res. 2021, 199, 107424. [Google Scholar] [CrossRef]
- Buzo, R.F.; Barradas, H.M.; Leao, F.B. A New Method for Fault Location in Distribution Networks Based on Voltage Sag Measurements. IEEE Trans. Power Del. 2021, 36, 651–662. [Google Scholar] [CrossRef]
- Lotfifard, S.; Kezunovic, M.; Mousavi, M.J. Voltage Sag Data Utilization for Distribution Fault Location. IEEE Trans. Power Del. 2011, 26, 1239–1246. [Google Scholar] [CrossRef]
- Alwash, S.F.; Ramachandaramurthy, V.K.; Mithulananthan, N. Fault-Location Scheme for Power Distribution System with Distributed Generation. IEEE Trans. Power Del. 2015, 30, 1187–1195. [Google Scholar] [CrossRef]
- Trindade, F.C.L.; Freitas, W.; Vieira, J.C.M. Fault Location in Distribution Systems Based on Smart Feeder Meters. IEEE Trans. Power Del. 2014, 29, 251–260. [Google Scholar] [CrossRef]
- Jia, K.; Ren, Z.; Bi, T.; Yang, Q.X. Ground Fault Location Using the Low-Voltage-Side Recorded Data in Distribution Systems. IEEE Trans. Ind. Appl. 2015, 51, 4994–5001. [Google Scholar] [CrossRef]
- Topolanek, D.; Lehtonen, M.; Toman, P.; Orsagova, J.; Drapela, J. An Earth Fault Location Method Based on Negative Sequence Voltage Changes at Low Voltage Side of Distribution Transformers. Int. J. Elect. Power Energy Syst. 2020, 118, 105768. [Google Scholar] [CrossRef]
- Topolanek, D.; Lehtonen, M.; Adzman, M.R.; Toman, P. Earth Fault Location Based on Evaluation of Voltage Sag at Secondary Side of Medium Voltage/Low Voltage Transformers. IET Gener. Transm. Distrib. 2015, 9, 2069–2077. [Google Scholar] [CrossRef]
- Bountouris, P.; Guo, H.; Tzelepis, D.; Abdulhadi, I.; Coffele, F.; Booth, C. MV Faulted Section Location in Distribution Systems Based on Unsynchronized LV Measurements. Int. J. Elect. Power Energy Syst. 2020, 119, 105882. [Google Scholar] [CrossRef]
- Jia, K.; Thomas, D.W.P.; Sumner, M. A New Double-Ended Fault-Location Scheme for Utilization in Integrated Power Systems. IEEE Trans. Power Del. 2013, 28, 594–603. [Google Scholar] [CrossRef]
- Wijekoon, J.; Rajapakse, A.D.; Haleem, N.M. Fast and Reliable Method for Identifying Fault Type and Faulted Phases Using Band Limited Transient Currents. IEEE Trans. Power Deli. 2021, 36, 2839–2850. [Google Scholar] [CrossRef]
- Mirshekali, H.; Dashti, R.; Keshavarz, A.; Torabi, A.J.; Shaker, H.R. A Novel Fault Location Methodology for Smart Distribution Networks. IEEE Trans. Smart Grid 2021, 12, 1277–1288. [Google Scholar] [CrossRef]
- Penido, D.R.R.; de Araujo, L.R.; Rodrigues, V.T.S.; do Nascimento, K.B. An Analytical Zero Sequence Method to Locate Fault in Distribution Systems Rich in DG. IEEE Trans. Smart Grid 2022, 13, 1849–1859. [Google Scholar] [CrossRef]


| Fault Type | Voltage | Voltage Variation (p.u.) | ||
|---|---|---|---|---|
| Directly Grounded | Grounded by Low Resistance | Grounded by Arc Supression Coil and Ungrounded | ||
| LG | V1 | 0.2 | 0~0.2 | 0 |
| V2 | 0.2 | 0~0.2 | 0 | |
| V0 | 0.6 | 0~0.6 | 1 | |
| VP | 1 | 1 | 1 | |
| VL | 0.28 | 0~0.28 | 0 | |
| LL | V1 | 0.5 | 0.5 | 0.5 |
| V2 | 0.5 | 0.5 | 0.5 | |
| V0 | 0 | 0 | 0 | |
| VP | 0.5 | 0.5 | 0.5 | |
| VL | 1 | 1 | 1 | |
| LLG | V1 | 0.57 | 0.5~0.57 | 0.5 |
| V2 | 0.43 | 0.43~0.5 | 0.5 | |
| V0 | 0.43 | 0.43~0.5 | 0.5 | |
| VP | 1 | 1 | 1 | |
| VL | 1 | 1 | 1 | |
| 3L | V1 | 1 | 1 | 1 |
| V2 | 0 | 0 | 0 | |
| V0 | 0 | 0 | 0 | |
| VP | 1 | 1 | 1 | |
| VL | 1 | 1 | 1 | |
| Fault Type | Voltage | Voltage Variation (p.u.) | ||
|---|---|---|---|---|
| Directly Grounded | Grounded by Low Resistance | Grounded by Arc Supression Coil and Ungrounded | ||
| LG | V1 | 0.2 | 0~0.2 | 0 |
| V2 | 0.2 | 0~0.2 | 0 | |
| V0 | 0 | 0 | 0 | |
| VP | 0.28 | 0~0.28 | 0 | |
| VL | 0.08 | 0~0.08 | 0 | |
| LL | V1 | 0.5 | 0.5 | 0.5 |
| V2 | 0.5 | 0.5 | 0.5 | |
| V0 | 0 | 0 | 0 | |
| VP | 1 | 1 | 1 | |
| VL | 0.5 | 0.5 | 0.5 | |
| LLG | V1 | 0.57 | 0.5~0.57 | 0.5 |
| V2 | 0.43 | 0.43~0.5 | 0.5 | |
| V0 | 0.43 | 0~0.43 | 0 | |
| VP | 1 | 1 | 1 | |
| VL | 0.57 | 0.5~0.57 | 0.5 | |
| 3L | V1 | 1 | 1 | 1 |
| V2 | 0 | 0 | 0 | |
| V0 | 0 | 0 | 0 | |
| VP | 1 | 1 | 1 | |
| VL | 1 | 1 | 1 | |
| Type of Distribution Transformer | LG | LL, LLG | 3L |
|---|---|---|---|
| Dyn11 | Negative voltage | Phase voltage | Phase voltage |
| Yyn0 | Negative voltage | Phase voltage | Phase voltage |
| Measuring Point | Characteristic Voltage (V) | Measuring Point | Characteristic Voltage (V) |
|---|---|---|---|
| M1 | 0.15 | M6 | 27.76 |
| M2 | 9.86 | M7 | 27.74 |
| M3 | 40.43 | M8 | 27.73 |
| M4 | 27.69 | M9 | 27.73 |
| M5 | 27.78 | M10 | 27.73 |
| Measuring Point | Characteristic Voltage (V) | ||||
|---|---|---|---|---|---|
| Rf = 0 Ω | Rf = 10 Ω | Rf = 50 Ω | Rf = 100 Ω | Rf = 500 Ω | |
| M1 | 0.15 | 0.12 | 0.07 | 0.04 | 0.01 |
| M2 | 9.86 | 8.28 | 4.53 | 2.78 | 0.66 |
| M3 | 40.43 | 33.97 | 18.6 | 11.41 | 2.71 |
| M4 | 27.69 | 23.27 | 12.74 | 7.81 | 1.85 |
| M5 | 27.78 | 23.34 | 12.78 | 7.84 | 1.86 |
| M6 | 27.76 | 23.32 | 12.77 | 7.83 | 1.86 |
| M7 | 27.74 | 23.31 | 12.76 | 7.83 | 1.86 |
| M8 | 27.73 | 23.3 | 12.75 | 7.82 | 1.86 |
| M9 | 27.73 | 23.3 | 12.76 | 7.82 | 1.86 |
| M10 | 27.73 | 23.3 | 12.76 | 7.82 | 1.86 |
| Measuring Point | Characteristic Voltage (V) | ||||
|---|---|---|---|---|---|
| F1 | F2 | F3 | F4 | F5 | |
| M1 | 218.4 | 218.49 | 218.79 | 218.8 | 218.78 |
| M2 | 151.04 | 157.44 | 178.1 | 178.03 | 176.67 |
| M3 | 24.88 | 42.95 | 98.49 | 101.03 | 97.21 |
| M4 | 0 | 25.22 | 86.03 | 88.49 | 84.32 |
| M5 | 5.57 | 0 | 59.90 | 62.82 | 57.89 |
| M6 | 5.57 | 0 | 15.4 | 19.02 | 12.82 |
| M7 | 5.56 | 0 | 9.48 | 13.2 | 6.82 |
| M8 | 5.56 | 0 | 2.44 | 0 | 0 |
| M9 | 5.56 | 0 | 0 | 6.26 | 0 |
| M10 | 5.56 | 0 | 0 | 6.26 | 0 |
| Reference | Measured Voltage | Fault Types | Synchronizition | Resistance |
|---|---|---|---|---|
| This paper | 0.4 kV | all | No | <500 Ω |
| [26] | 13.8 kV | all | Yes | <100 Ω |
| [29] | 13.8 kV | LG, 3L | Yes | <10 Ω |
| [34] | 13.8 kV | all | Yes | <100 Ω |
| [35] | 20 kV | LLG, 3L | Yes | <100 Ω |
| [36] | 20kV | LG, LLG, 3L | Yes | <100 Ω |
| [37] | 24.9kV | LG | Yes | <500 Ω |
| Measuring Point | Characteristic Voltage (V) (Rf = 0 Ω) | Characteristic Voltage (V) (Rf = 10 Ω) | Characteristic Voltage (V) (Rf = 50 Ω) | ||||||||||||
|---|---|---|---|---|---|---|---|---|---|---|---|---|---|---|---|
| F1 | F2 | F3 | F4 | F5 | F1 | F2 | F3 | F4 | F5 | F1 | F2 | F3 | F4 | F5 | |
| M1 | 0.06 | 0.06 | 0.06 | 0.06 | 0.06 | 0.03 | 0.03 | 0.03 | 0.03 | 0.03 | 0.01 | 0.01 | 0.01 | 0.01 | 0.01 |
| M2 | 1.12 | 1.13 | 1.06 | 1.06 | 1.06 | 0.59 | 0.59 | 0.57 | 0.57 | 0.57 | 0.2 | 0.2 | 0.2 | 0.2 | 0.2 |
| M3 | 3.04 | 3.06 | 2.88 | 2.89 | 2.89 | 1.6 | 1.61 | 1.56 | 1.56 | 1.55 | 0.55 | 0.55 | 0.54 | 0.54 | 0.54 |
| M4 | 10.17 | 9.45 | 8.89 | 8.93 | 8.9 | 5.36 | 4.96 | 4.81 | 4.8 | 4.79 | 1.84 | 1.7 | 1.67 | 1.67 | 1.66 |
| M5 | 9.38 | 9.76 | 9.62 | 9.65 | 9.63 | 4.94 | 5.12 | 5.2 | 5.19 | 5.18 | 1.7 | 1.75 | 1.81 | 1.8 | 1.8 |
| M6 | 9.36 | 9.73 | 10.59 | 10.62 | 10.6 | 4.93 | 5.11 | 5.72 | 5.71 | 5.71 | 1.69 | 1.75 | 1.99 | 1.98 | 1.98 |
| M7 | 9.35 | 9.73 | 10.92 | 10.96 | 10.94 | 4.92 | 5.1 | 5.91 | 5.9 | 5.89 | 1.69 | 1.75 | 2.05 | 2.05 | 2.04 |
| M8 | 9.35 | 9.72 | 13.51 | 10.96 | 10.94 | 4.92 | 5.1 | 7.3 | 5.9 | 5.89 | 1.69 | 1.75 | 2.54 | 2.05 | 2.04 |
| M9 | 9.32 | 9.7 | 10.9 | 12.77 | 12.3 | 4.91 | 5.09 | 5.89 | 6.87 | 6.62 | 1.69 | 1.74 | 2.05 | 2.38 | 2.3 |
| M10 | 9.31 | 9.69 | 10.88 | 12.32 | 12.87 | 4.91 | 5.09 | 5.88 | 6.63 | 6.93 | 1.68 | 1.74 | 2.05 | 2.3 | 2.41 |
| Measuring Point | Characteristic Voltage (V) | ||||
|---|---|---|---|---|---|
| F1 | F2 | F3 | F4 | F5 | |
| M1 | 221.25 | 220.25 | 222.16 | 221.88 | 221.83 |
| M2 | 182.27 | 166.28 | 199.09 | 194.71 | 194.07 |
| M3 | 116.65 | 69.03 | 159.72 | 146.81 | 144.82 |
| M4 | 15.69 | 17.14 | 139.76 | 121.50 | 118.52 |
| M5 | 87.30 | 0 | 123.44 | 101.30 | 97.81 |
| M6 | 87.08 | 0 | 102.12 | 73.90 | 69.50 |
| M7 | 87.04 | 0 | 95.18 | 64.51 | 59.66 |
| M8 | 86.82 | 0 | 0 | 64.35 | 59.52 |
| M9 | 86.76 | 0 | 94.88 | 1.49 | 20.61 |
| M10 | 86.66 | 0 | 94.78 | 29.24 | 0 |
Disclaimer/Publisher’s Note: The statements, opinions and data contained in all publications are solely those of the individual author(s) and contributor(s) and not of MDPI and/or the editor(s). MDPI and/or the editor(s) disclaim responsibility for any injury to people or property resulting from any ideas, methods, instructions or products referred to in the content. |
© 2023 by the authors. Licensee MDPI, Basel, Switzerland. This article is an open access article distributed under the terms and conditions of the Creative Commons Attribution (CC BY) license (https://creativecommons.org/licenses/by/4.0/).
Share and Cite
Zhang, D.; Zhang, W.; Wang, C.; Xiao, X. Fault Segment Location for MV Distribution System Based on the Characteristic Voltage of LV Side. Electronics 2023, 12, 1734. https://doi.org/10.3390/electronics12071734
Zhang D, Zhang W, Wang C, Xiao X. Fault Segment Location for MV Distribution System Based on the Characteristic Voltage of LV Side. Electronics. 2023; 12(7):1734. https://doi.org/10.3390/electronics12071734
Chicago/Turabian StyleZhang, Dehai, Wenhai Zhang, Changzhi Wang, and Xianyong Xiao. 2023. "Fault Segment Location for MV Distribution System Based on the Characteristic Voltage of LV Side" Electronics 12, no. 7: 1734. https://doi.org/10.3390/electronics12071734
APA StyleZhang, D., Zhang, W., Wang, C., & Xiao, X. (2023). Fault Segment Location for MV Distribution System Based on the Characteristic Voltage of LV Side. Electronics, 12(7), 1734. https://doi.org/10.3390/electronics12071734