1. Introduction
The continuous increase in global warming and the decrease in fossil energy sources has led to a sharp inclination towards renewable sources as a substitute source of energy. Among these renewable sources, the solar system has been extensively used for power generation in a variety of applications due to its multiple benefits, such as uninterrupted power, no noise, no pollution, and easy maintenance. This increasing demand for power generation using photovoltaic (PV) systems for both residential and industrial areas requires an appropriate and efficient optimization of energy production systems. To draw maximum PV energy, many methods have been developed in the past, such as incremental conductance, perturb and observe, constant voltage, parasitic capacitance, and constant current. This allows the controller to harvest the maximum available power from the PV system under varying solar irradiance and temperature scenarios; these controllers are usually known as maximum power point tracking (MPPT) controllers. However, most MPPT methods suffer from a lack of strict convergence analysis and are not capable of handling partial shading conditions (PSCs) [
1,
2].
1.1. Literature Review
This research aims to find a more effective solution for PV systems that are partially shaded by analyzing and modeling their performance. By simulating the relationship between environmental conditions and the PV array’s output characteristics, we can gain a deeper understanding of the special effects of PS. This knowledge is crucial for developing an MPPT algorithm. Power generation in solar systems is influenced by the intermittence of both temperature and irradiance. The output power can also fluctuate because of the non-linear relationship between current and voltage in conventional PV cells. Therefore, incorporating an MPPT algorithm can help to maximize power output under varying meteorological conditions. However, when PV systems are partially shaded, they exhibit distinct characteristics, and multiple peaks may appear on the P-V characteristic curve. The impact of shading depends on the pattern and placement of the PV arrays, which can decrease the efficiency of the tracking algorithm as the PV array tends to operate at a local MPP [
3,
4,
5].
MPPT calculations are an essential part of the operation of PV systems. These calculations are designed to optimize the output power of PV panels by determining the point on the P-V curve where maximum power can be obtained. Under ideal conditions where all PV cells receive the same amount of sunlight, the MPPT algorithm can quickly and easily locate a single peak on the P-V curve and adjust the system accordingly. However, there are scenarios where the P-V curve of the panel has multiple local peaks. One of the prevalent reasons is PS, which happens when the cells in a panel are exposed to varying levels of sunlight. This can occur when the panel is partially blocked by an object such as a tree or building, or when the panel is installed in a location with uneven sunlight. In such scenarios, the standard MPPT calculations may only identify the local maximum power point (LMPP) in the previous working point region, as the global maximum power point (GMPP) could be located much farther away on the P-V curve [
6]. Therefore, it is crucial to utilize sophisticated MPPT methods and techniques to trace the global peak power point during PS scenarios and augment the general effectiveness and operation of the PV system. This will immensely reduce the competitiveness of the PV panel, in particular during PS. To solve PS, numerous approaches have been proposed to alleviate the effect of PSCs in such PV panels and a lot of research has been carried out, focusing on finding the GMPP by reducing the search area.
Hu et.al presented an idea that states the current of faulted cells or modules increases under the PSC, causing the temperature rise of a few faulted modules or cells [
7]. Therefore, there are a lot of LMPPs. The usage of a thermal camera to identify PSCs is also proposed. The proposed approach can detect the cell or module faults and can make use of the thermo-graphical data gathered from panels to split the PV array into healthy and unhealthy segments and also efficiently determine PS. However, this method consumes a lot of computational time for global maximum power point tracking (GMPPT) [
8].
Tamir Shaqarin suggested an approach that works well for tracking precision and steady-state error to track the GMPP under any climate condition. The proposed approach is using “particle swarm optimization (PSO) through targeted position-mutated elitism” (PSO-TPME) with a reinitialization mechanism on a PV system under partial shading conditions. The fast-converging and global exploration capabilities of PSO-TPME make it appealing for online optimization. But a significant implementation complexity is associated with PSO-TPME based MPPT [
9].
A MPPT approach with minimal complexity is suggested by A. Safari which is founded on an adjustable step size incremental conductance method and a straightforward linear equation [
10,
11]. The aim of this approach is to relocate the operating point near the GMPP. This technique is based on a variable step size incremental conductance, which automatically adjusts the step size to track the GMPP and minimize energy loss. However, this method has a significant drawback, as the linear function may not be effective when the PV array has multiple LMPPs. Furthermore, this approach may struggle to adapt to system parameters that change over time.
Different “perturb & observe” (P&O) and incremental conductance (InC) MPP techniques have been used in the PV system by the researcher for detecting the GM using P-V & I-V curves. The techniques used in [
12] are evaluated based on speed, accuracy, and complexity. Fractional short circuit current (FSCC), P&O, fractional open circuit voltage (FOCV), and InC techniques are conventional and the most commonly employed techniques in PV energy systems. However, the major drawback of these techniques is lack of robustness and frequent oscillations around local optima [
13].
An adaptive neuro-fuzzy (NF) interference system strategy is proposed in [
14,
15] which is applied to extract MMPT for the PV system under intermittent environmental circumstances; however, this technique based on machine learning requires a huge database. Additionally, this technique suffers from the chattering effect, steady-state error, and oscillations in the desired output.
Other researchers have also employed population-based global optimization methods which have been combined with deep neural networks to enhance their global exploration capabilities and reduce their computational complexity [
16,
17,
18] such as the firefly algorithm (FA) [
19], the artificial bee colony algorithm (ABC) [
20], and the genetic algorithm (GA) [
21] to achieve maximum power, but these algorithms suffer from convergence speed, require lot of tuning parameters (population size, crossover probability, and mutation rate), and are sentinel to noise. Moreover, all these PSO, GA, FA, and ABC population-based algorithms are not efficient when it comes to the control problem, because of their inability to handle uncertainty and nonlinear systems efficiently and are less flexible to changing environment conditions.
In conclusion, it is obvious that there are multiple MPPT techniques available with distinct features, including the type of sensing material, rate of convergence, level of intricacy, efficiency, expense, and suitability, all targeting to locate the GMPP under PSCs. Each method is associated with its advantages and disadvantages but a general drawback that is being observed in all traditional techniques is the challenge of chattering and slow convergence. Focusing on this research problem, a hybrid MPPT technique is proposed that can perform under varying climate conditions and shading patterns with slight chattering, and can assure fast and finite convergence to GMMP.
1.2. Original Contribution
The following are in-depth descriptions of the key innovations and significant contributions made through this research.
This research presents a strong and sophisticated controller known as the nonlinear terminal sliding mode controller (TSMC) that is specifically designed to track the MPPT of PV arrays’ PSCs by utilizing a non-inverting buck-boost converter.
To achieve this, the proposed controller utilizes a neuro-fuzzy network (NFN) for reference generation, which is trained using over 22,000 distinct PS scenarios.
The proposed controller is designed to ensure fast and finite-time convergence, providing a reliable and efficient solution for MPPT under PSCs.
The robustness and chattering minimization around the GMPP are tested by introducing uncertainties in the system, demonstrating the success of the proposed controller in challenging operating conditions.
To demonstrate the efficacy of the proposed controller, an experimental setup is established, which allows for a comprehensive evaluation of the controller’s performance.
To evaluate its performance, a comparison of the proposed controller with other algorithms is already available. The results are presented in
Table 1, which illustrates the superiority of the proposed controller in terms of its performance characteristics. The comparison highlights the effectiveness of the proposed controller and its ability to perform better than other existing algorithms.
The present study is organized in a systematic manner to comprehensively address the proposed PV system with a MPPT controller. The following sections outline the methodology and results of the study.
Section 2 delves into the statistical and mathematical modeling of the given PV system, providing a thorough understanding of the system’s behavior. The shading effect, a crucial aspect of PV systems, is described in
Section 3. In
Section 4, the use of a machine learning-based neuro-fuzzy network (MLNFN) is presented for the generation and training of reference voltage. This methodology is applied to improve the performance of the MPPT controller. The average state-space model of the DC—DC buck-boost convertor is explained in
Section 5, while
Section 6 presents the robust nonlinear TSMC. To evaluate the proposed controller’s performance under varying environmental conditions, simulation results are analyzed using MATLAB/Simulink in
Section 7 and
Section 8. The hardware validation of the proposed system and a comprehensive performance analysis are presented in
Section 9 and
Section 10, respectively. Finally, the study concludes in
Section 10, summarizing the key findings and highlighting the contributions made to the field of PV systems and MPPT controllers.
2. PV System Mathematical Modeling
The PV cell has a p-n junction and produces electric power due to the photons. It consists of a current source
Iph, a series resistance
Rs, a shunt resistance
Rp, and a diode, as shown in
Figure 1.
To evaluate the parameters of the photovoltaic (PV) system it is necessary to have knowledge of the PV power-voltage or current-voltage curve under standard conditions of measurement (SCM). This information can be obtained through the testing and characterization of the PV module under SCM, which typically includes a specific irradiance level and cell temperature. This information can then be used to model the PV system and determine the performance and efficiency of the system under different operating conditions.
As
Rp and
Rs have low values, they can be neglected in some cases. This means that the total current is mainly determined by the photocurrent and the resistance losses are considered to be negligible. However, this will depend on the specific PV system and the operating conditions, and it is always important to consider the actual values of
Rp and
Rs to make sure they can be neglected. The current of a PV array arranged in a combination of series and/or parallel can be described by [
26,
27].
where
: PV array current
: Diode saturation current
a: Ideal factor
: Resistance in series
: Resistance in parallel
: Number of series cell
: Number of parallel cell
: Thermal voltage
PV array thermal voltage is given by,
where
The PV current
is given by,
where
: Nominal condition PV current
: Irradiance at the surface of panel
: Nominal condition irradiance
: Temperature coefficient of short circuit current
: Difference of nominal and actual temperature
Saturation current of the diode is represented by,
where
MATLAB/Simulink is used to model and simulate the above-mentioned equations and corresponding results are presented in
Figure 2,
Figure 3, Figure 9 and Figure 10.
These figures illustrate the I-V and P-V attributes of the PV system, which are used in the current work and subject to different levels of irradiances and temperatures. Four PV arrays are linked in a series such that each array comprises of fifteen series modules and a total output of 24 KW power of the other two parallel strings.
The P-V curve of the system is presented in
Figure 2 with a constant temperature that is directly proportional to power. While
Figure 3 shows the P-V curve of the system at different temperatures by keeping irradiance constant, which is inversely proportional to power.
3. Influence of Shading Effect on PV Array
It is a common practice to connect multiple solar panels in a series or parallel configuration to meet power requirements. However, when certain panels are blocked from sunlight by passing clouds, nearby trees or buildings, the shaded cells absorb some of the power generated by unshaded cells, resulting in the generation of heat which can cause damage to the shaded cells [
28].
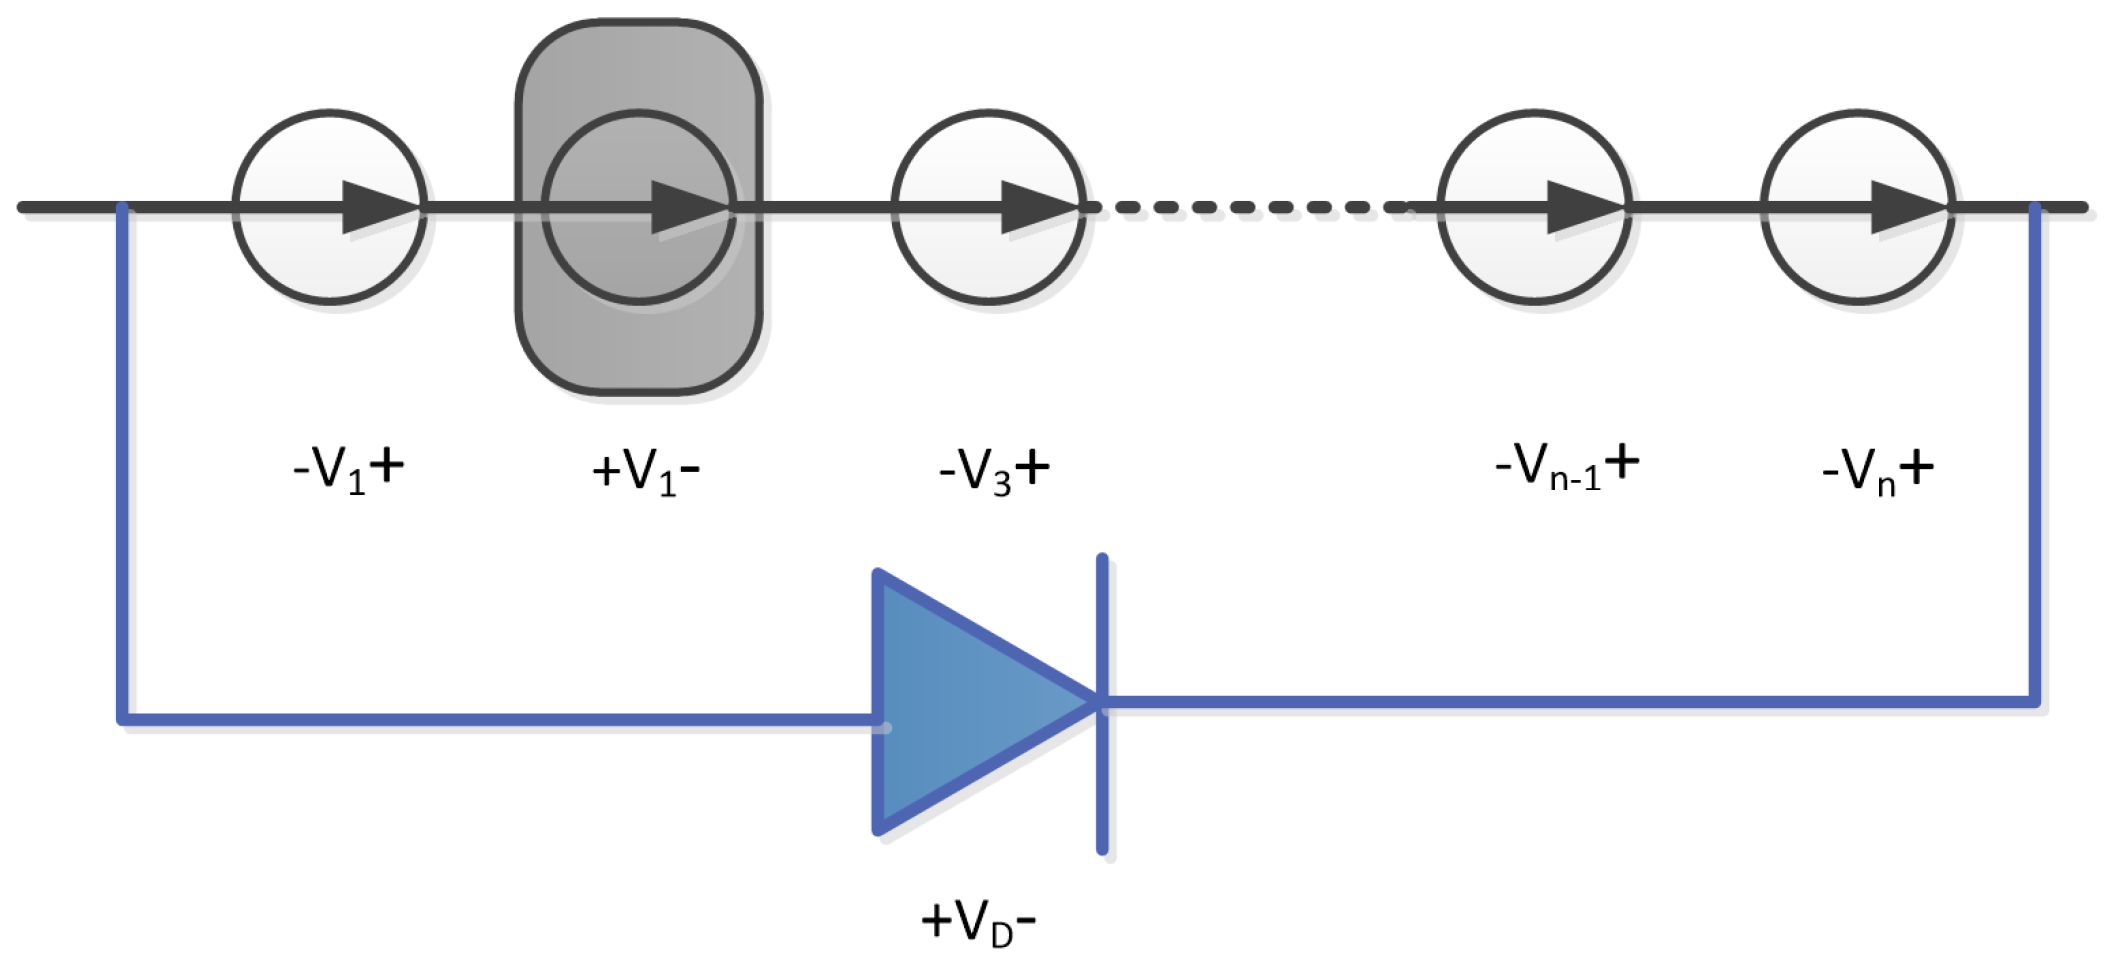
To prevent this, bypass diodes can be employed as depicted in
Figure 4, which help to prevent a negative voltage across the shaded cells. From
Figure 4, the bypass diode begins to conduct when the condition
is satisfied where
i ≠ 2 and
is the forward voltage drop of the diode [
29,
30].
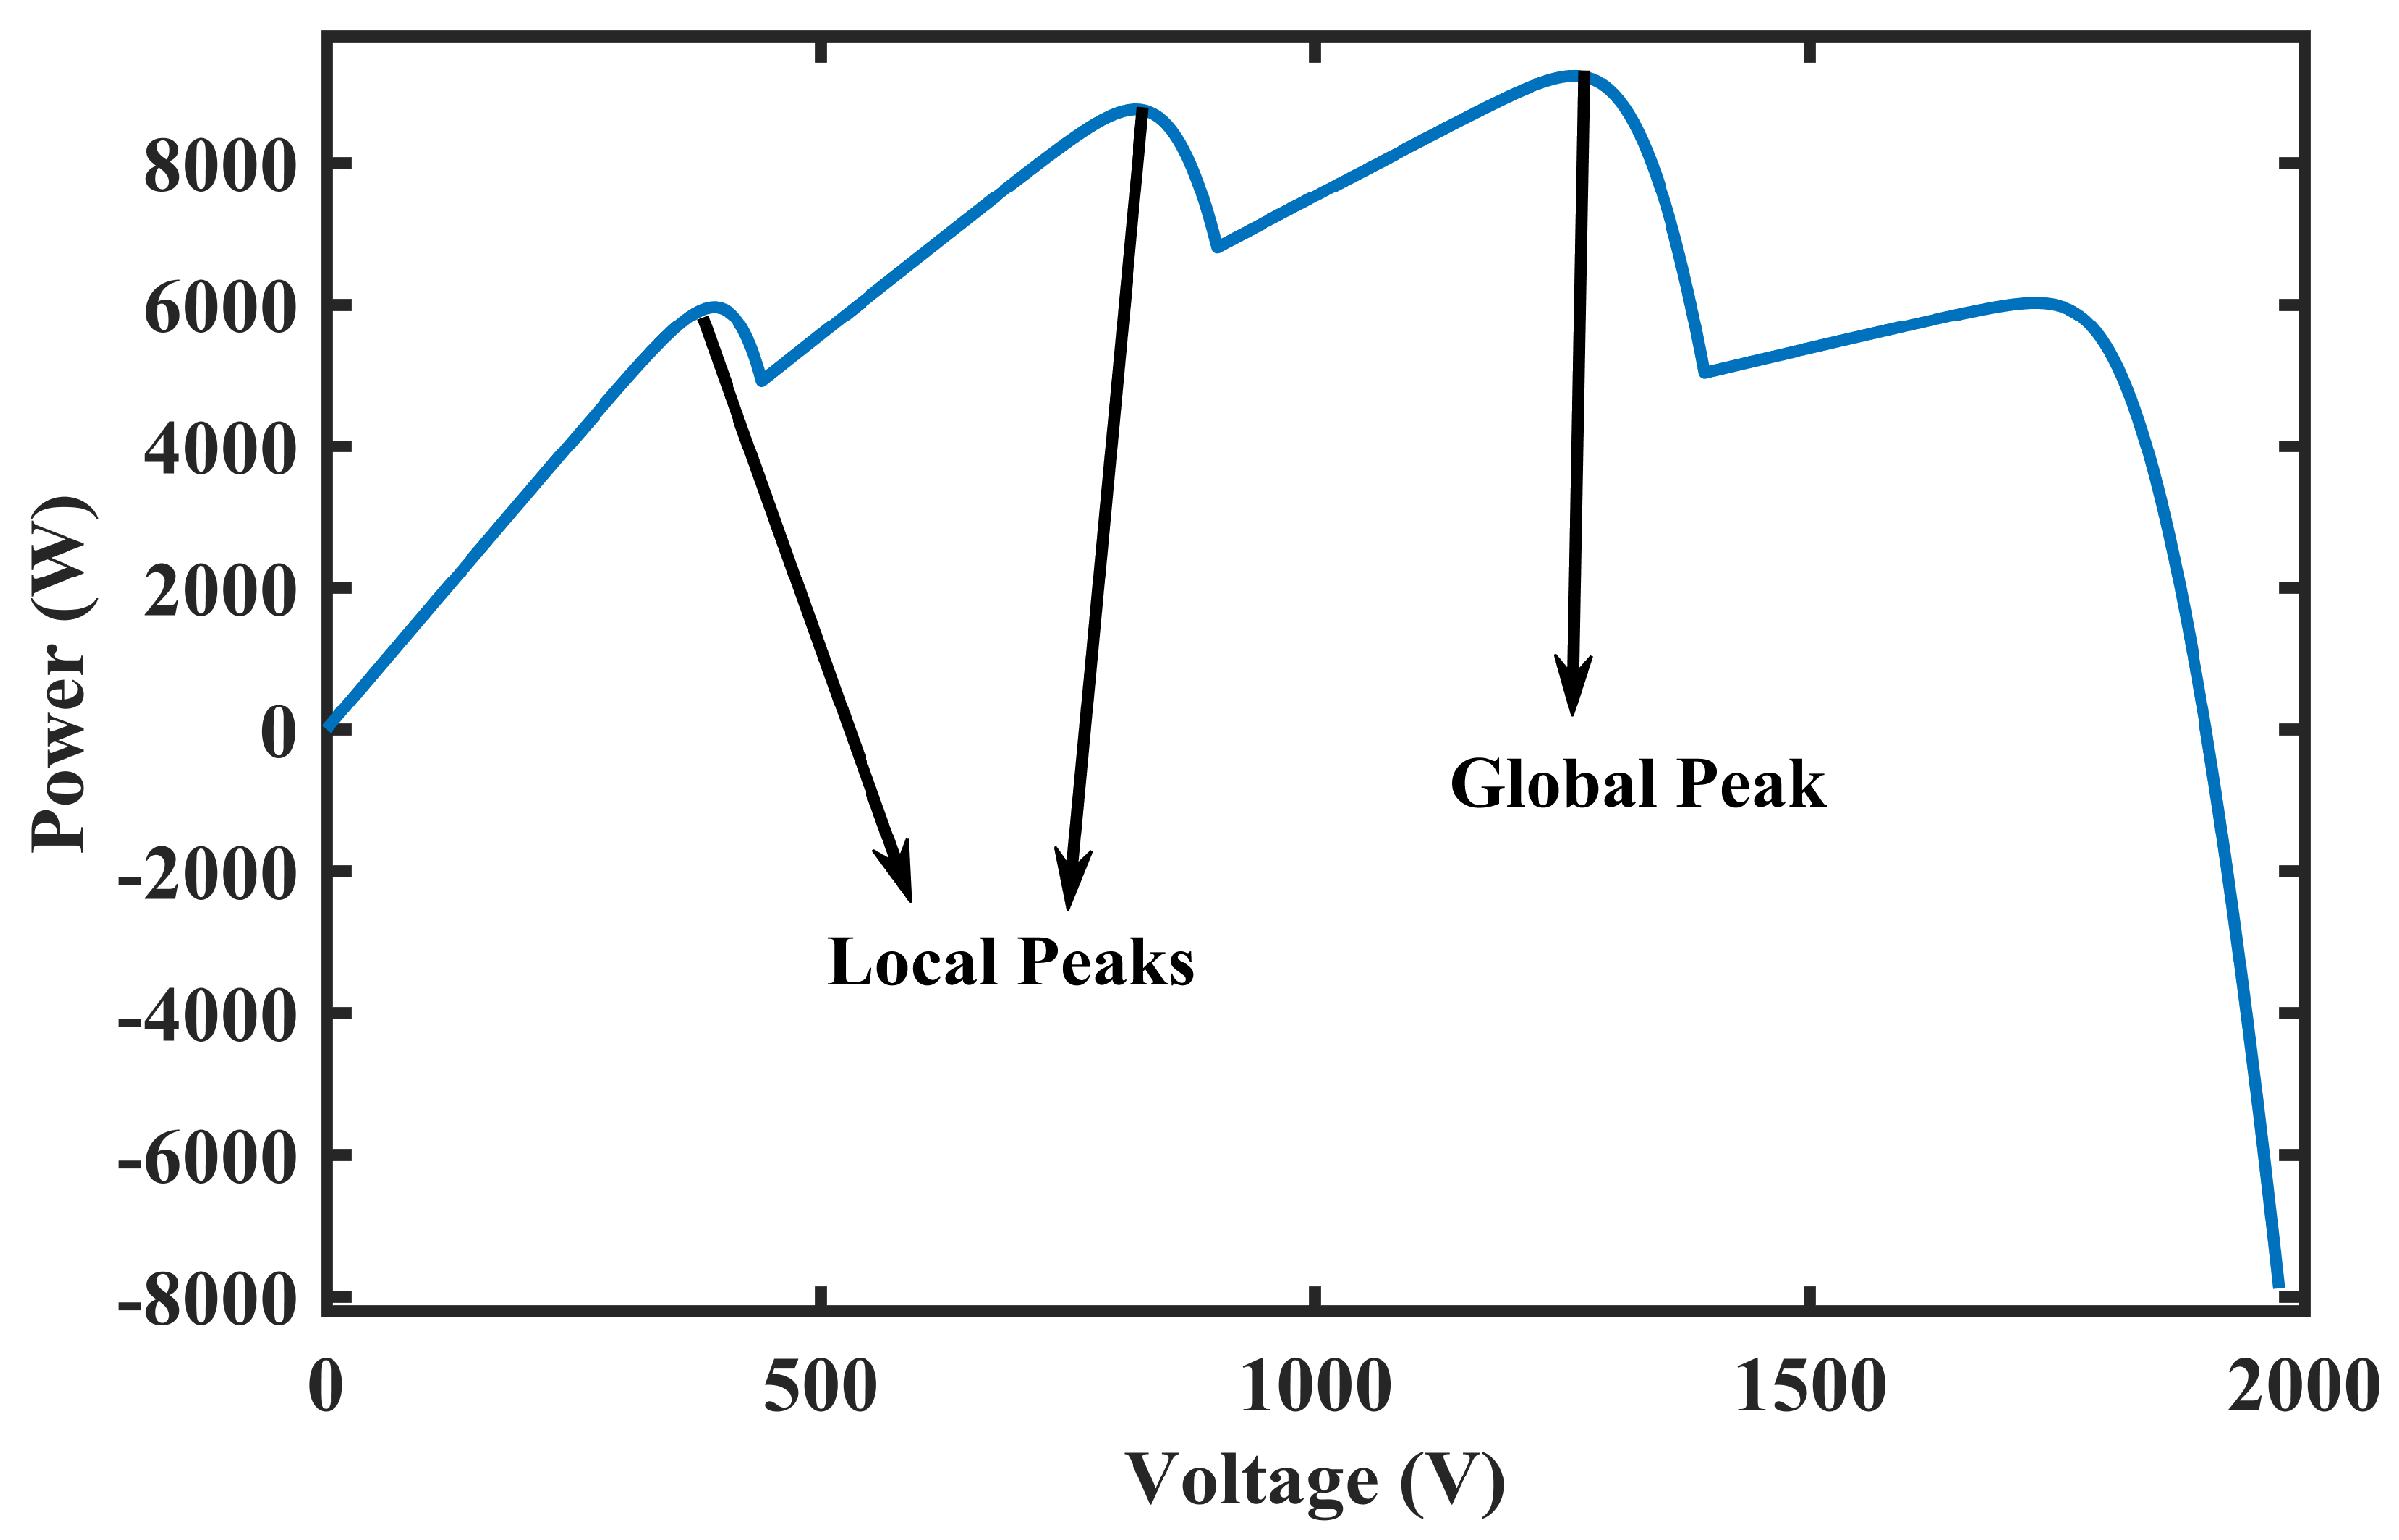
However, activating diodes at different voltage levels alters the characteristics of the PV system and results in multiple peaks, as shown in
Figure 5. This trait can cause the system to operate at a local peak instead of the optimal global peak, resulting in a decrease in PV efficiency.
4. Machine Learning Based Proposed System Framework
Figure 6 illustrates the MLNF technique used in this research, which is based on the Takagi-Sugeno (TS) fuzzy inference system. TS and Mamdani are two popular types of fuzzy inference systems used in the field of fuzzy logic. The main difference between the two is the way they handle fuzzy rules and fuzzy outputs. In Mamdani-type systems, the output of each rule is a fuzzy set, which is then combined to form the final output using fuzzy logic operations such as union or centroid defuzzification. In contrast, TS-type systems use a linear combination of the inputs to generate a crisp output. There are several advantages of using TS-type systems as they are computationally efficient, accurate, provide better interpolation, and are easy to tune compared to Mamdani-type systems [
31].
The proposed framework has five inputs, including four different irradiance values (G1, G2, G3, and G4) and one temperature (T) parameter. The fuzzification layer, which is the input layer, consists of three triangular membership functions for each parameter. The output layer comprises a linear equation for each rule. The MLNFN generates a reference voltage for the peak power from the PV arrays under PS and varying environmental conditions.
Large datasets are essential for training the MLNFN. These datasets are generated by modeling the PV array system in MATLAB/Simulink under different (PSCs). To train the NFN, around 22,000 scenarios of PSCs are randomly generated for MPP voltages to be used as reference voltages for the controller.
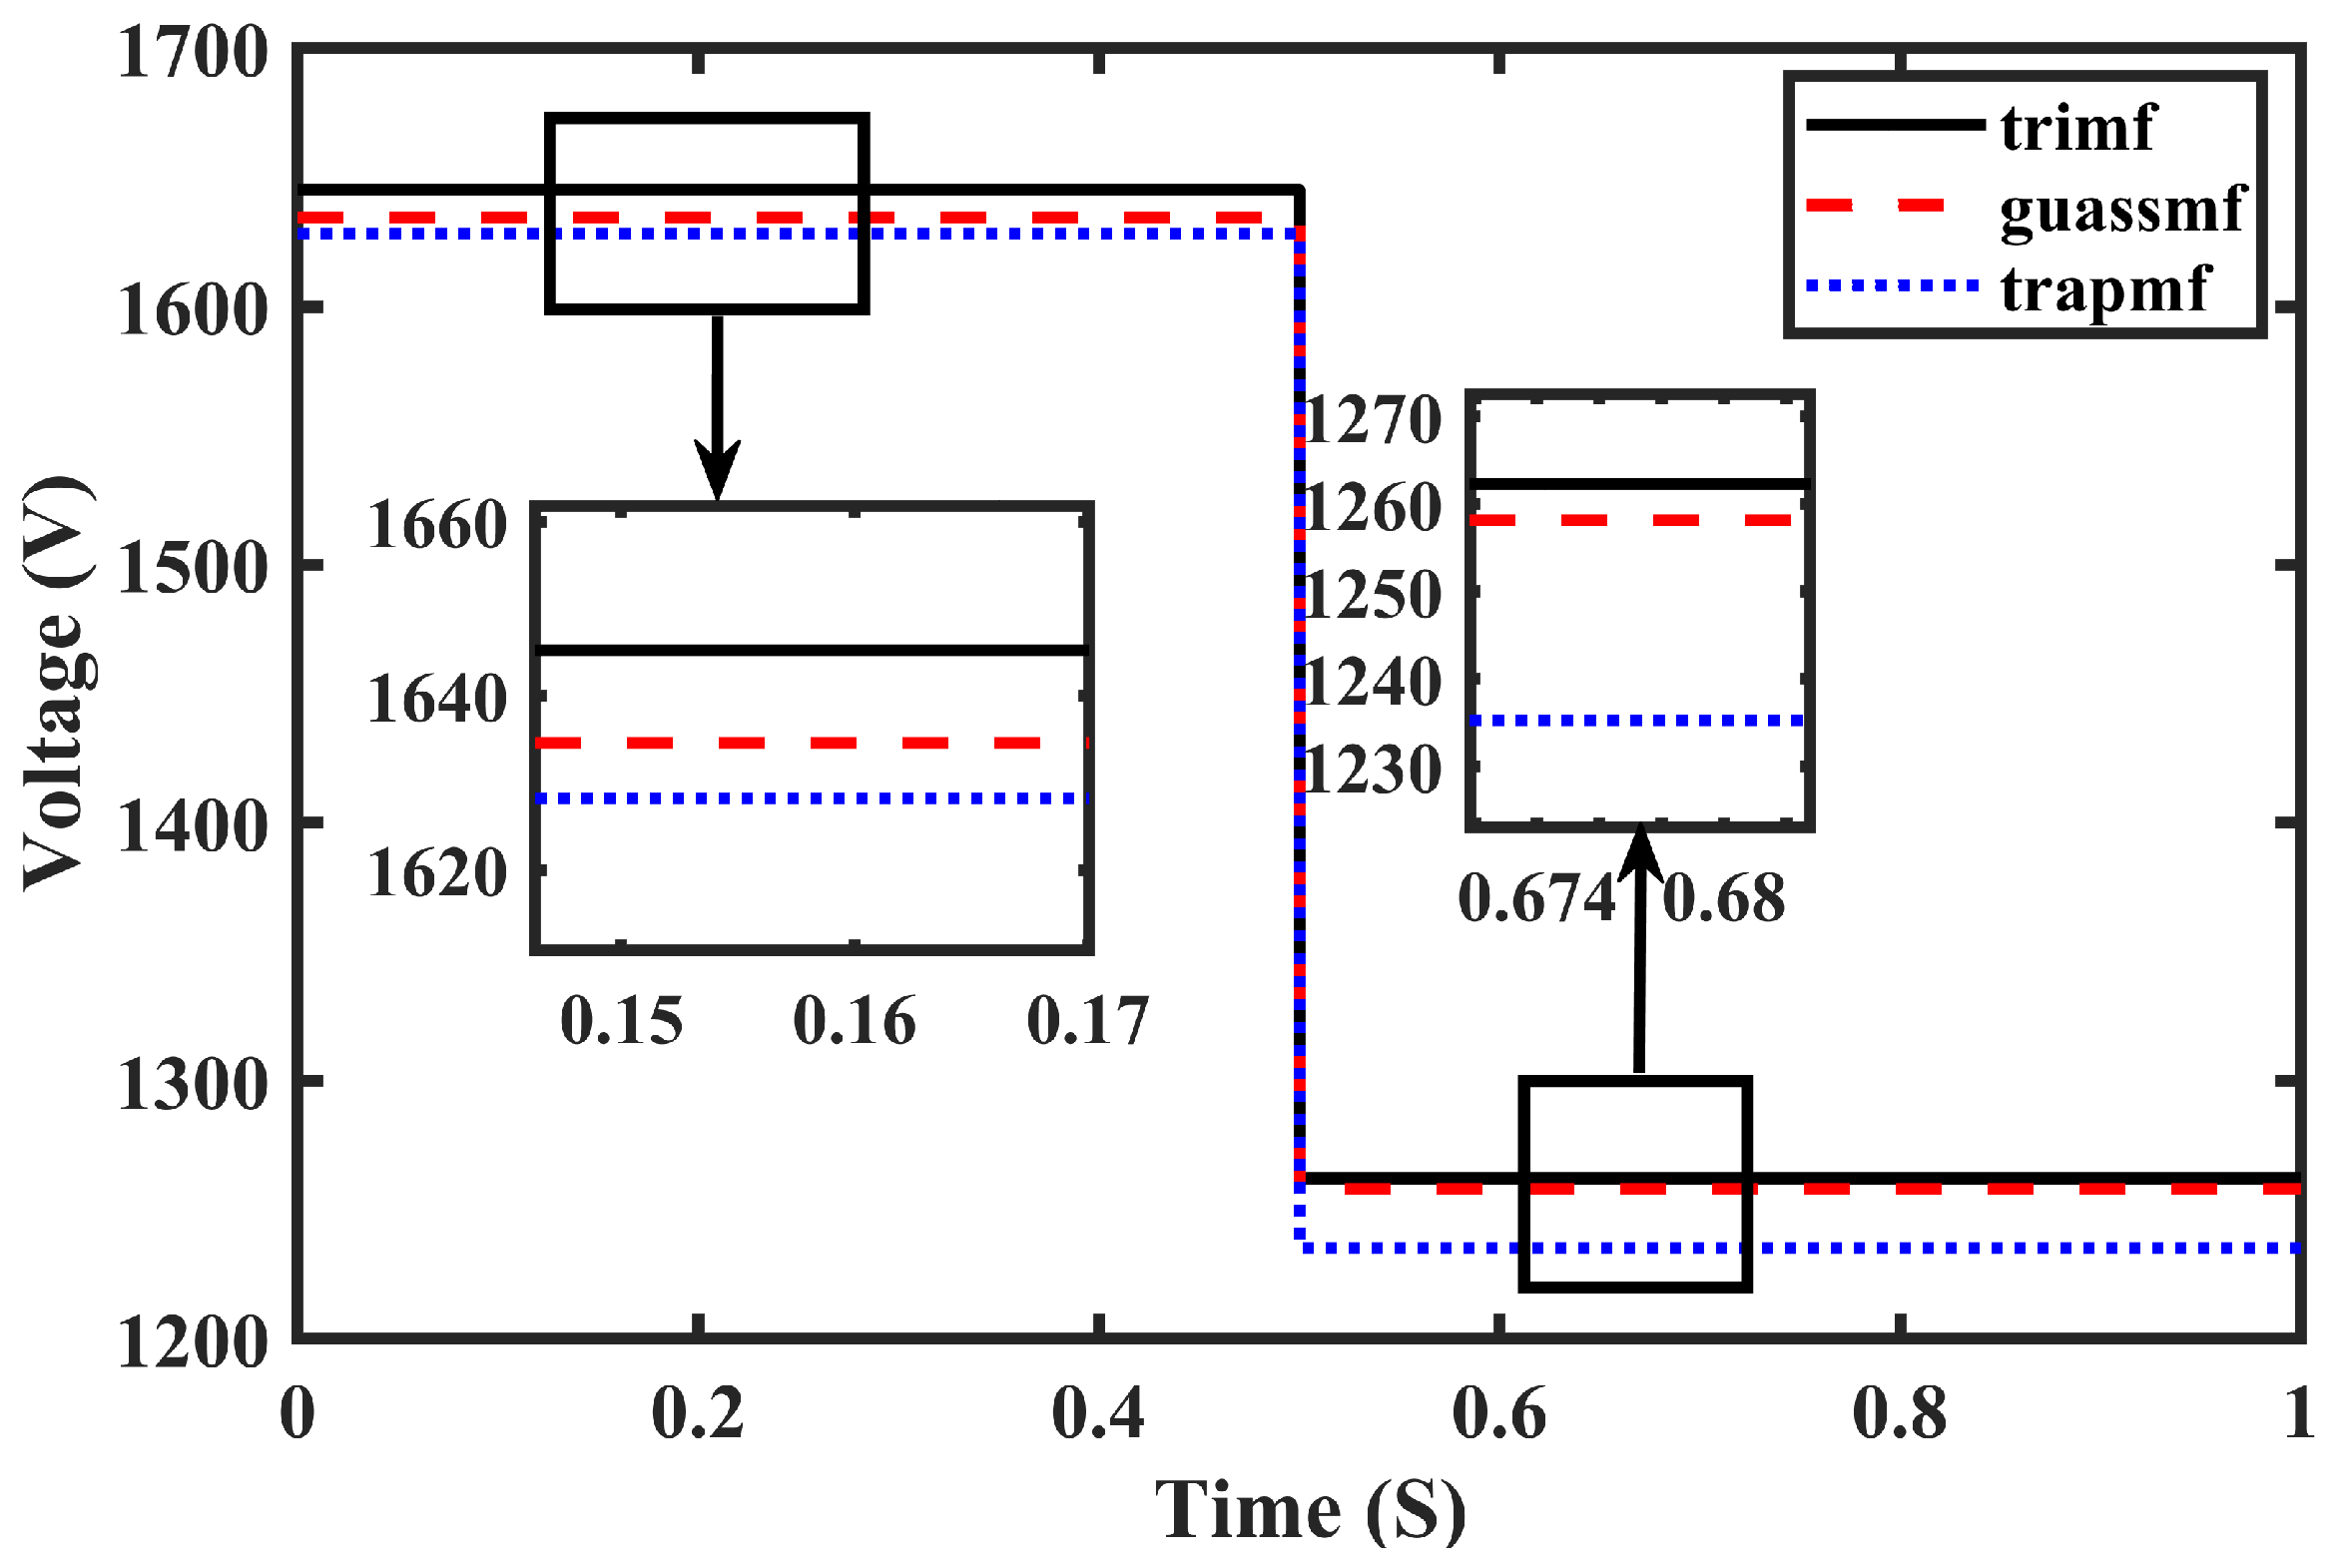
Figure 7 illustrates the reference voltages generated using the MLNFN against three different membership functions at shading pattern SP1, which lasts from 0 to 0.5 s, and SP2, which lasts from 0.5 to 1 s. The voltage changes abruptly from 1645 V to 1265 V when irradiances change from SP1 to SP2 in the case of triangular membership functions.
Table 2 provides a comparative analysis of reference voltages generated using different NF techniques. The table helps in understanding the effectiveness of the proposed technique over the existing ones.
5. Non-Inverting Average State-Space Model of Buck-Boost Converter
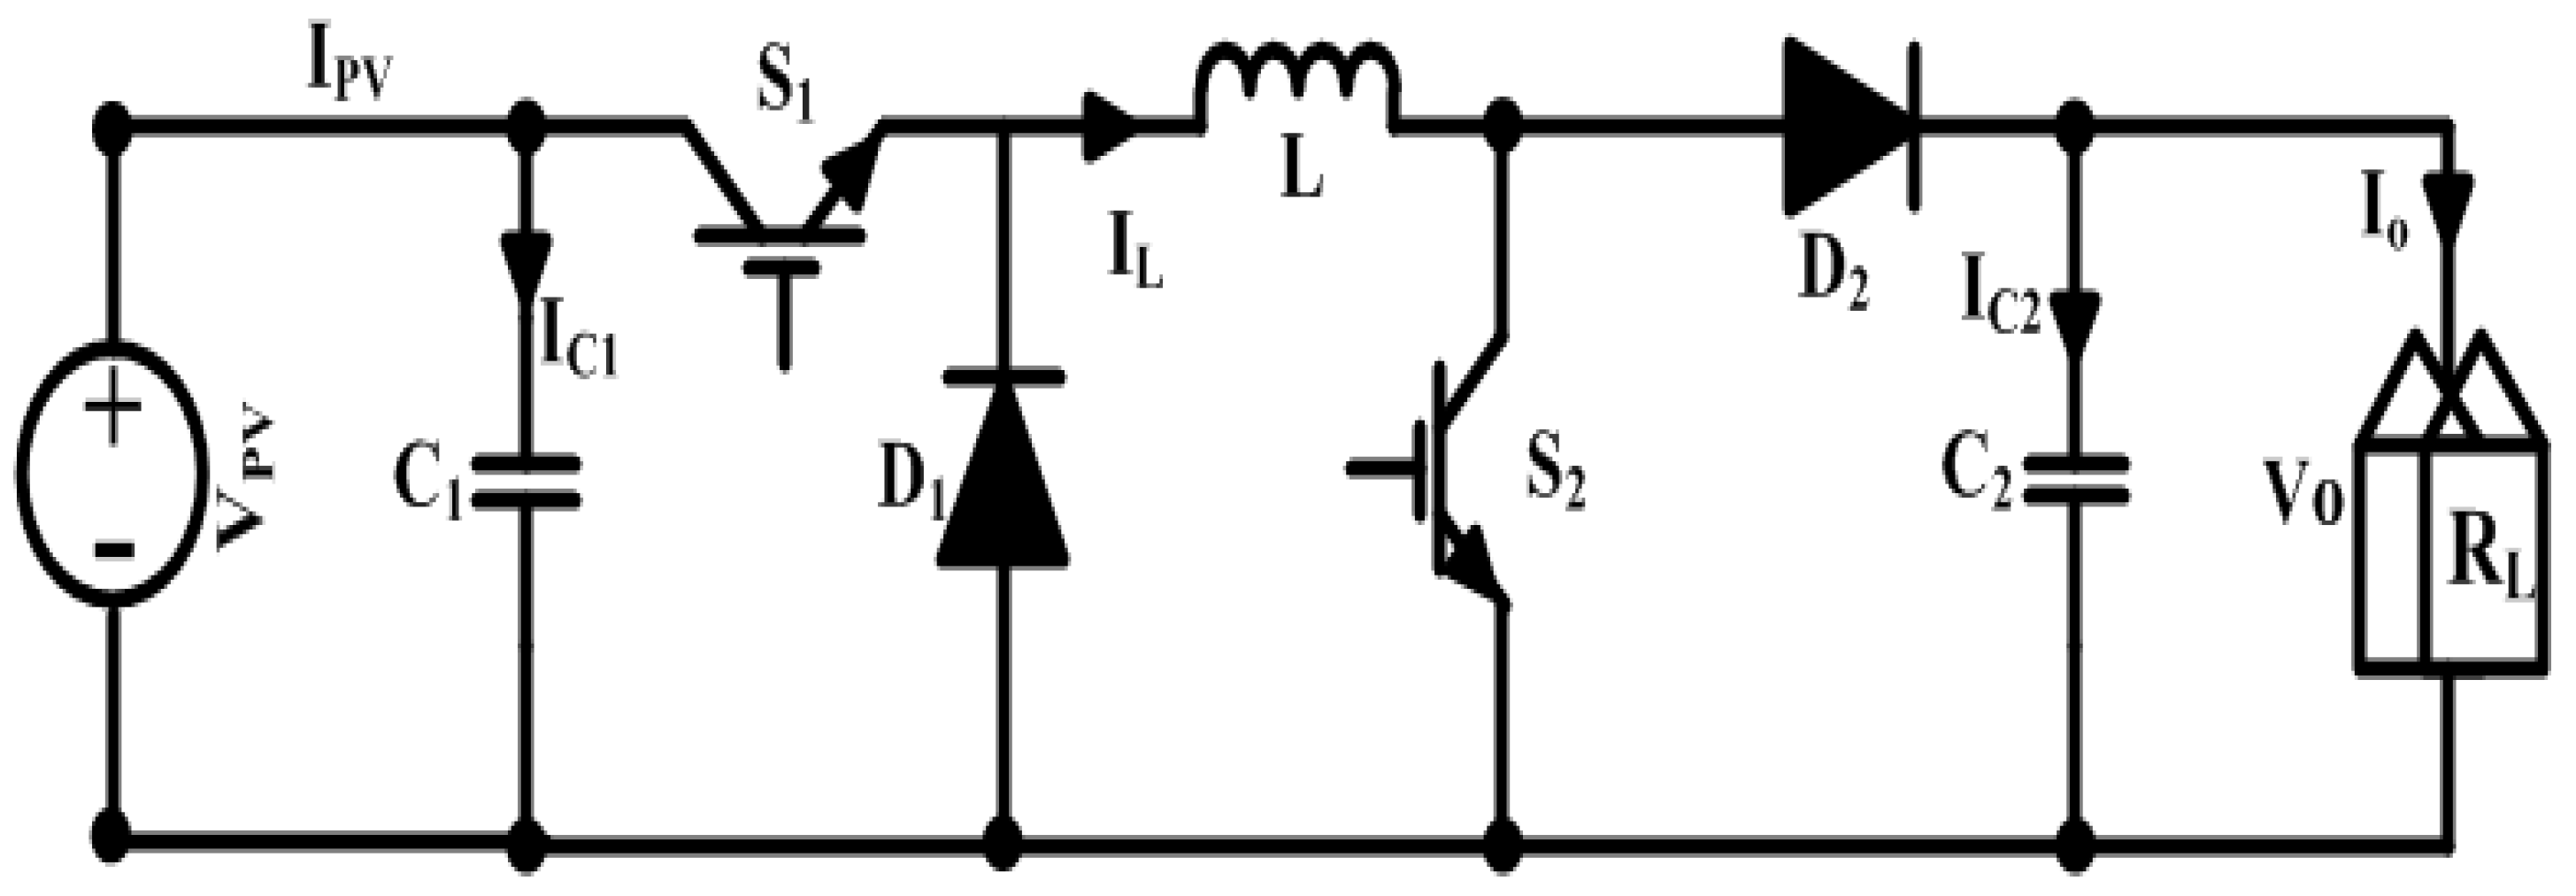
The DC—DC buck-boost converter in non-inverting configuration moves up or down the voltages to force the PV array to operate at the MPP, from input (PV array) to output (load). With the help of the switching period T, the converter is periodically controlled where: T = Ton + Toff, Ton is the ON time and Toff is the OFF time. The converter’s duty ratio is defined by u = Ton/T.
To reduce the waves in the converter, input voltage capacitor C1 is used; while for limiting the output voltage capacitor, C2 is used. In this work, it is assumed that the converter is operating in continuous conduction mode (CCM).
Figure 8 shows the approximate circuit of the non-inverting buck-boost converter with two switching intervals. The first switching interval has both switches,
and
active while the diodes
and
are inactive. In the second switching interval, both the diodes
and
are active while the switches;
and
are inactive [
32,
33]. In the first interval, according to Kirchhoff’s current and voltage law, we have:
Whereas in the second interval
and
are inactive and
and
are forward-biased. Using Kirchhoff’s current and voltage law, we have:
In light of the volt second balance of the inductor and charge balance of the capacitor, we can express:
Averaging the model for one switching duration and considering , and to be the average value of , and , we can write, , , .
Hence Equations (11)–(13) can be rearranged as,
The final Equations (14)–(16) are utilized in the designing of PV system control law.
6. Design of Terminal Sliding Model Control
A controller design based on the nonlinear robust terminal sliding mode (TSM) is proposed for tracking the MPPT of PV arrays under PSCs using a non-inverting buck-boost converter. In this controller, the error,
e1, is defined as the discrepancy between the desired output voltage of the PV array and the actual one and is given in Equation (17). The controller uses this error to adjust the reference voltage generated by the MLNFN algorithm and to extract the maximum power from the PV array,
where
is
and
refers to
. The derivative of Equation (17) with its dynamics reported in (15) becomes,
The first stage is to design a sliding surface and the next stage is the selection of a control law for holding the system trajectory on the sliding surface making the tracking error zero. The equation of TSMC is given by,
where
,
n represents the relative system degree,
is the error among the
, desired reference voltage, a positive parameter chosen randomly or by some approach whichever is more suitable choice and the output voltage,
is rational power equal to
p/
q.
By taking the derivative of sliding surface we have,
Control law is given by Equation (22),
where
is the equivalent control vector while
is the discontinuous control (the correction factor) vector which is given by
where k is a controlled gain. To obtain
, Equation (22) will be simplified, the parameters used in the equation are given as,
Taking derivative of
yields,
By substituting the parameters in Equation (22) we obtain,
By taking
we obtain,
as,
Finally, by adding Equations (23) and (29) we obtain the control law
7. Proposed Control System Performance Validation
This section explains the validation of the proposed system for MPPT under various PSCs using MATLAB/Simulink.
7.1. Simulation Setttings
MATLAB 2017Ra is used to perform the simulations where powergui and a constant time solvent are opted for to run the simulation. The information about the PV array being used in this research is given in
Table 3. The parameter values used in converter and controller designing are given in
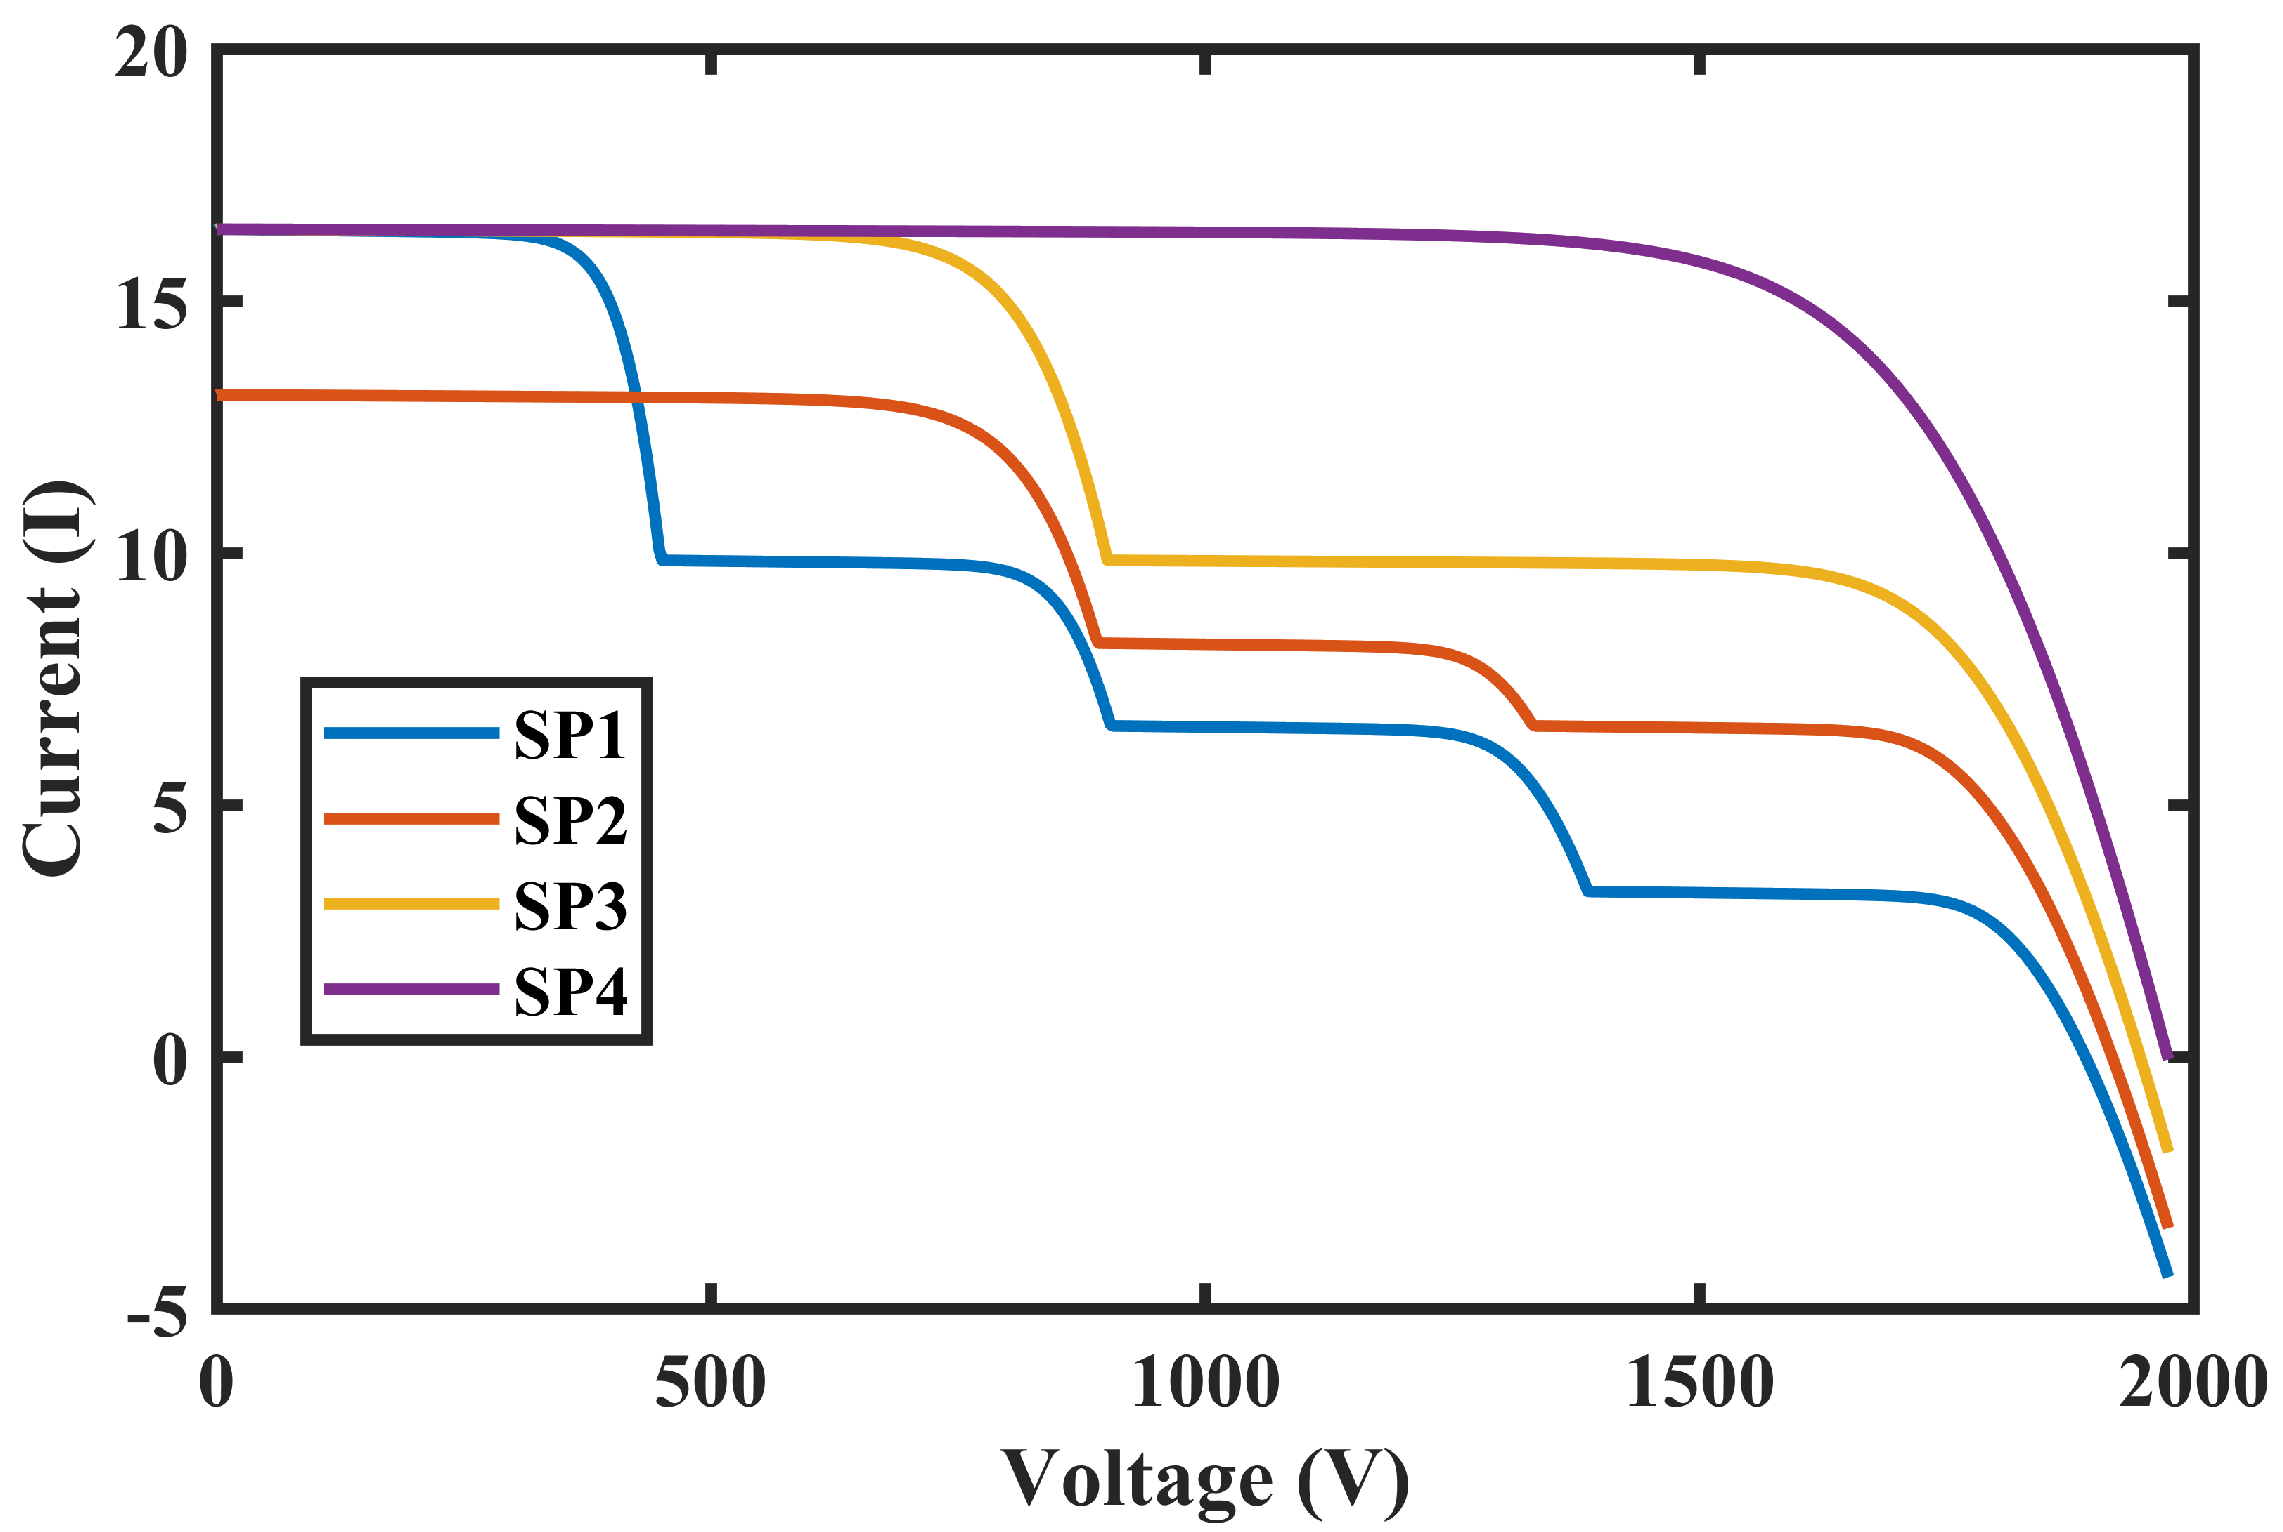
Table 4. Three distinct shading patterns (SPs) namely SP1, SP2, and SP3 are subjected to varying irradiance, while SP4 exhibits uniform irradiance, as mentioned in
Table 5. For the SP4 case with regular irradiance, only a single PV curve is produced, which in turn keeps a simpler detection for the MPP through any traditional methods. However, in the remaining three cases of PS, it is difficult to identify the global peak, as the PV characteristic curve now exhibits multiple local maxima points instead of just one GMPP. These local maxima points appear due to the shading of certain portions of the PV array, which can cause the power output of the shaded portions to decrease, creating multiple peaks in the PV curve, making it challenging to pinpoint the GMPP accurately.
The proposed MLNFN TSMC strategy is evaluated from three distinct characteristics i.e., (1) robustness to environmental changes (2) PSCs, and (3) controller uncertainties.
Initially, the simulations were carried out to achieve the P-V and I-V attribute curves of the four SPs mentioned above in
Table 5.
Figure 9 shows the P-V curve attributes under SP1 to SP4 while
Figure 10 shows I-V curve under SP1 to SP4.
It can be noted from the results that irradiances are directly proportional to the current/voltage; however, when SPs are different then various local peaks have happened.
7.2. Test Case Senarios
Two different sets of SPs with different temperatures taken for the comparative performance analysis of the proposed technique are shown in
Table 6.
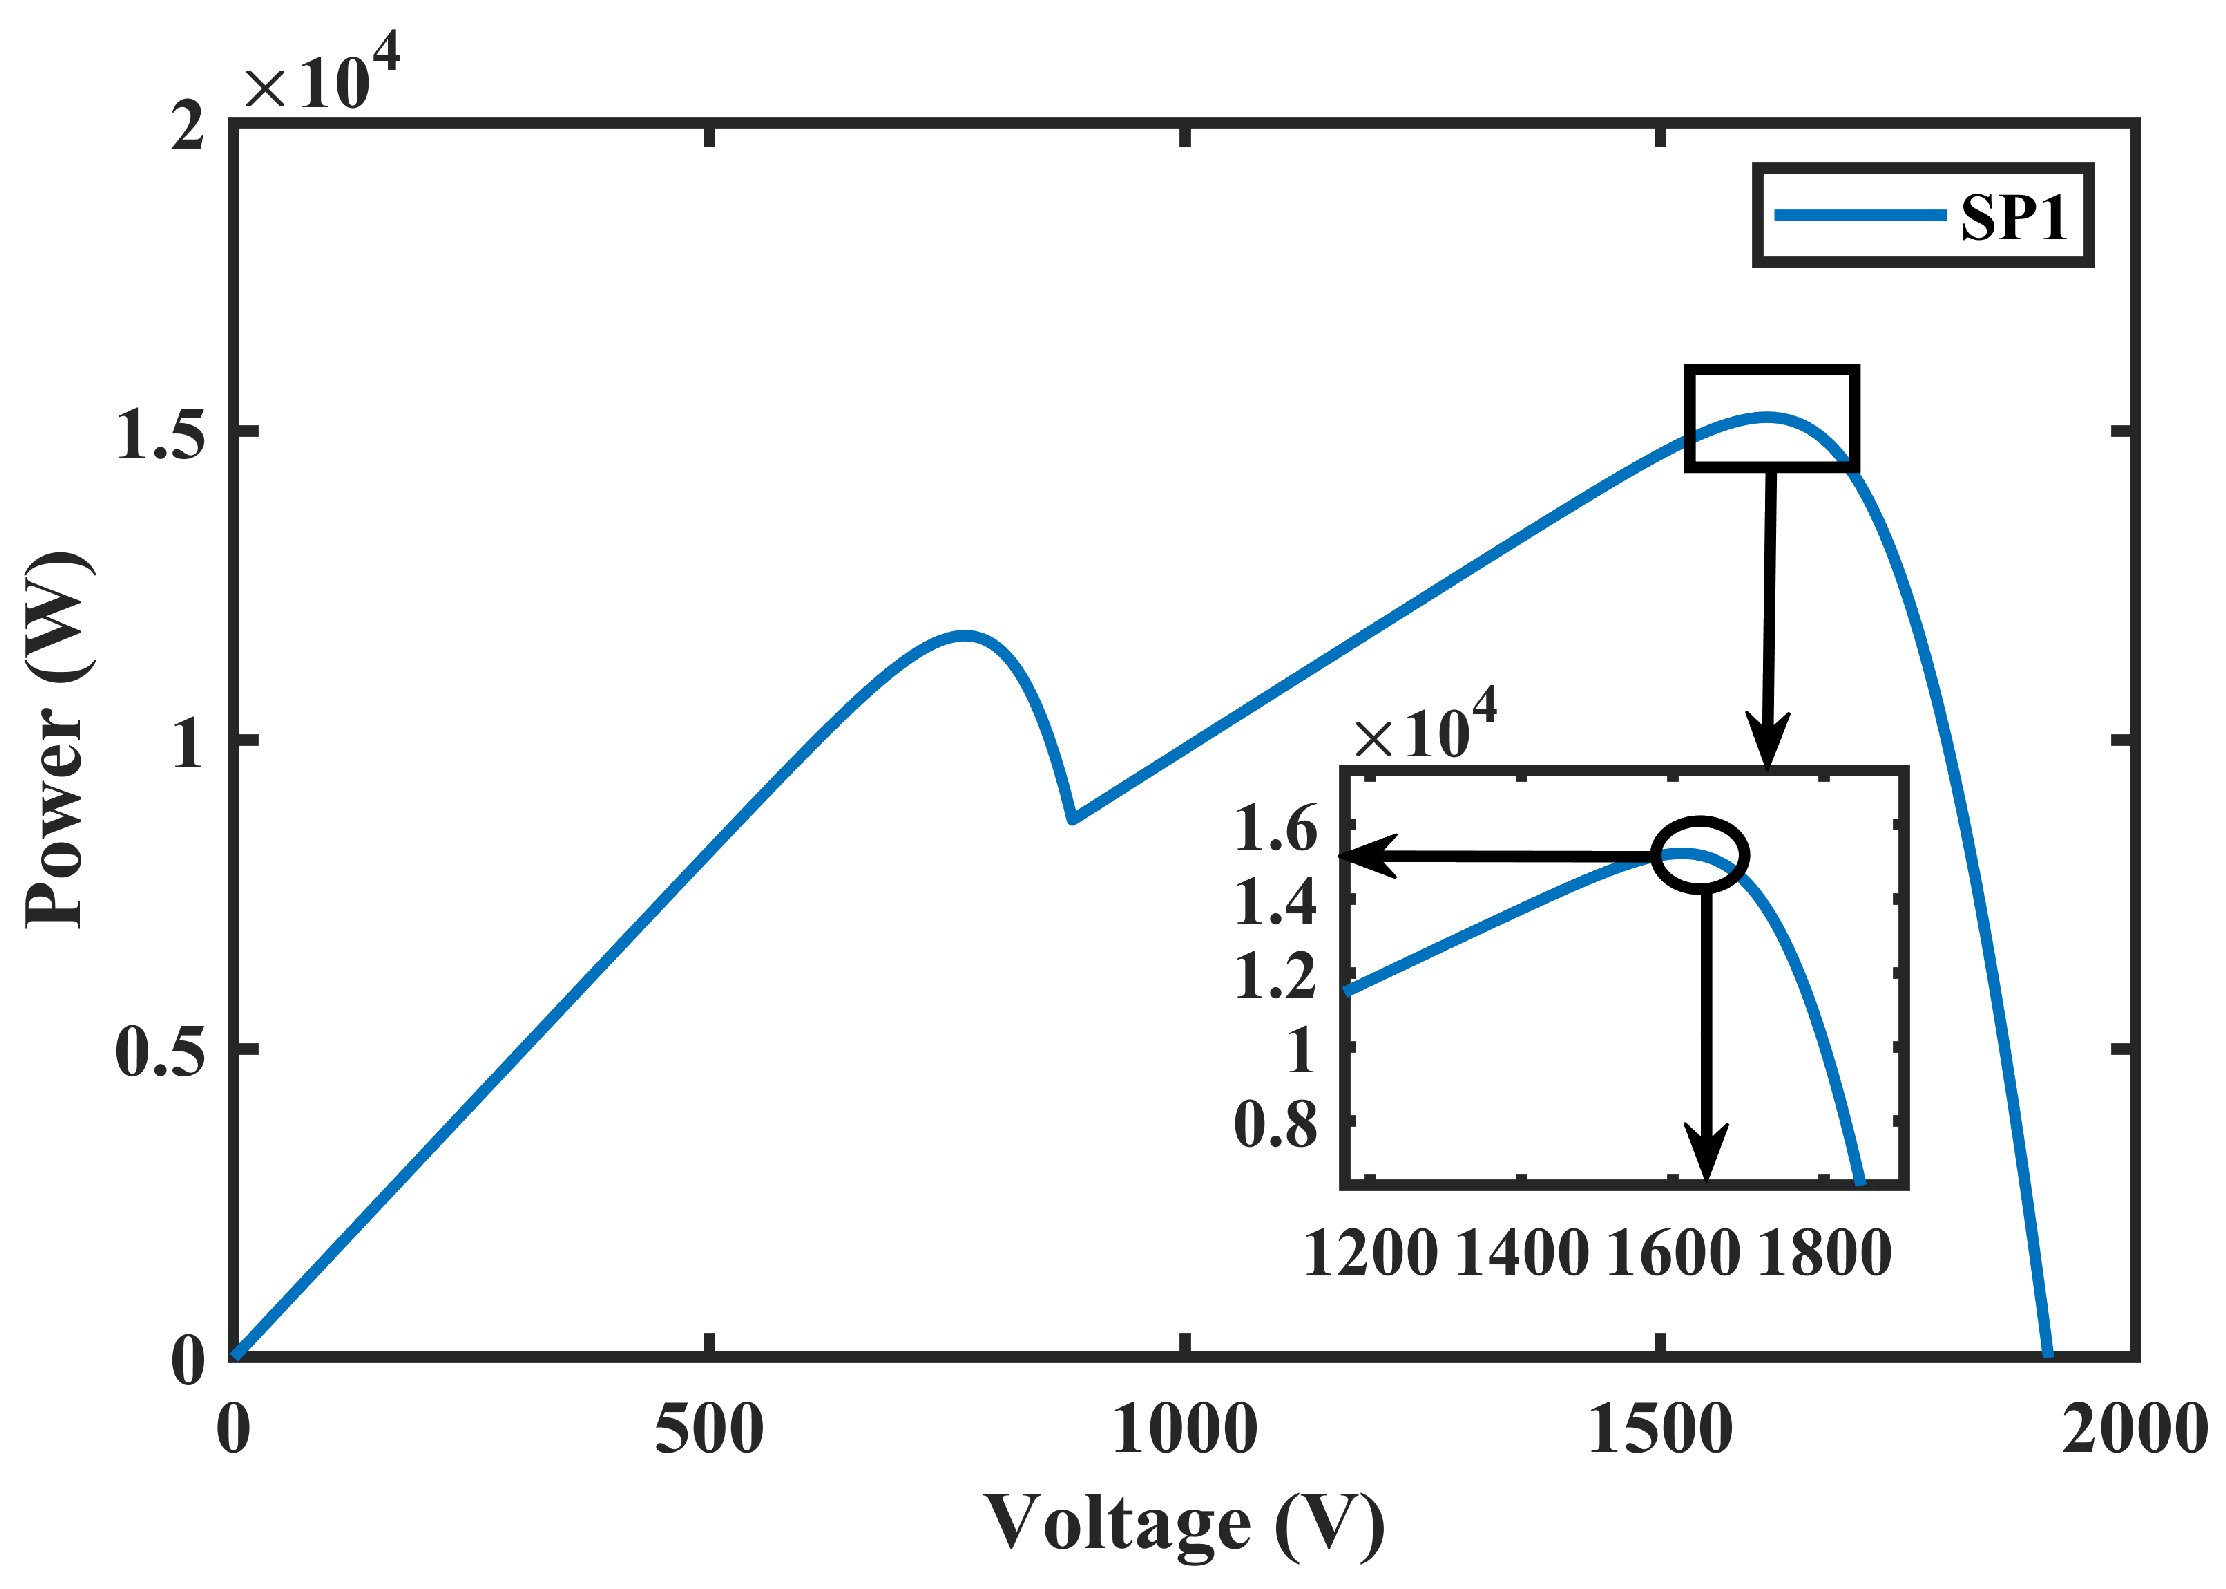
It was observed in the case of the SP1 scenario that the GMPP was situated at 1645 V and the associated output power was 15,000 W, as shown in
Figure 11. While for the case of SP2,
Figure 12 shows that MPP was at 1250 V and the associated output power was 8000 W. These results clearly show that the proposed MLNFN TSMC efficiently tracks the GMPP in the existence of local peaks.
8. Comparative Analysis of Proposed Technique
For detailed analysis regarding the performance improvement achieved with the proposed strategy, a comparative study with existing conventional techniques was carried out and can be found in the subsequent sections.
8.1. Performance Analysis without Uncertainities
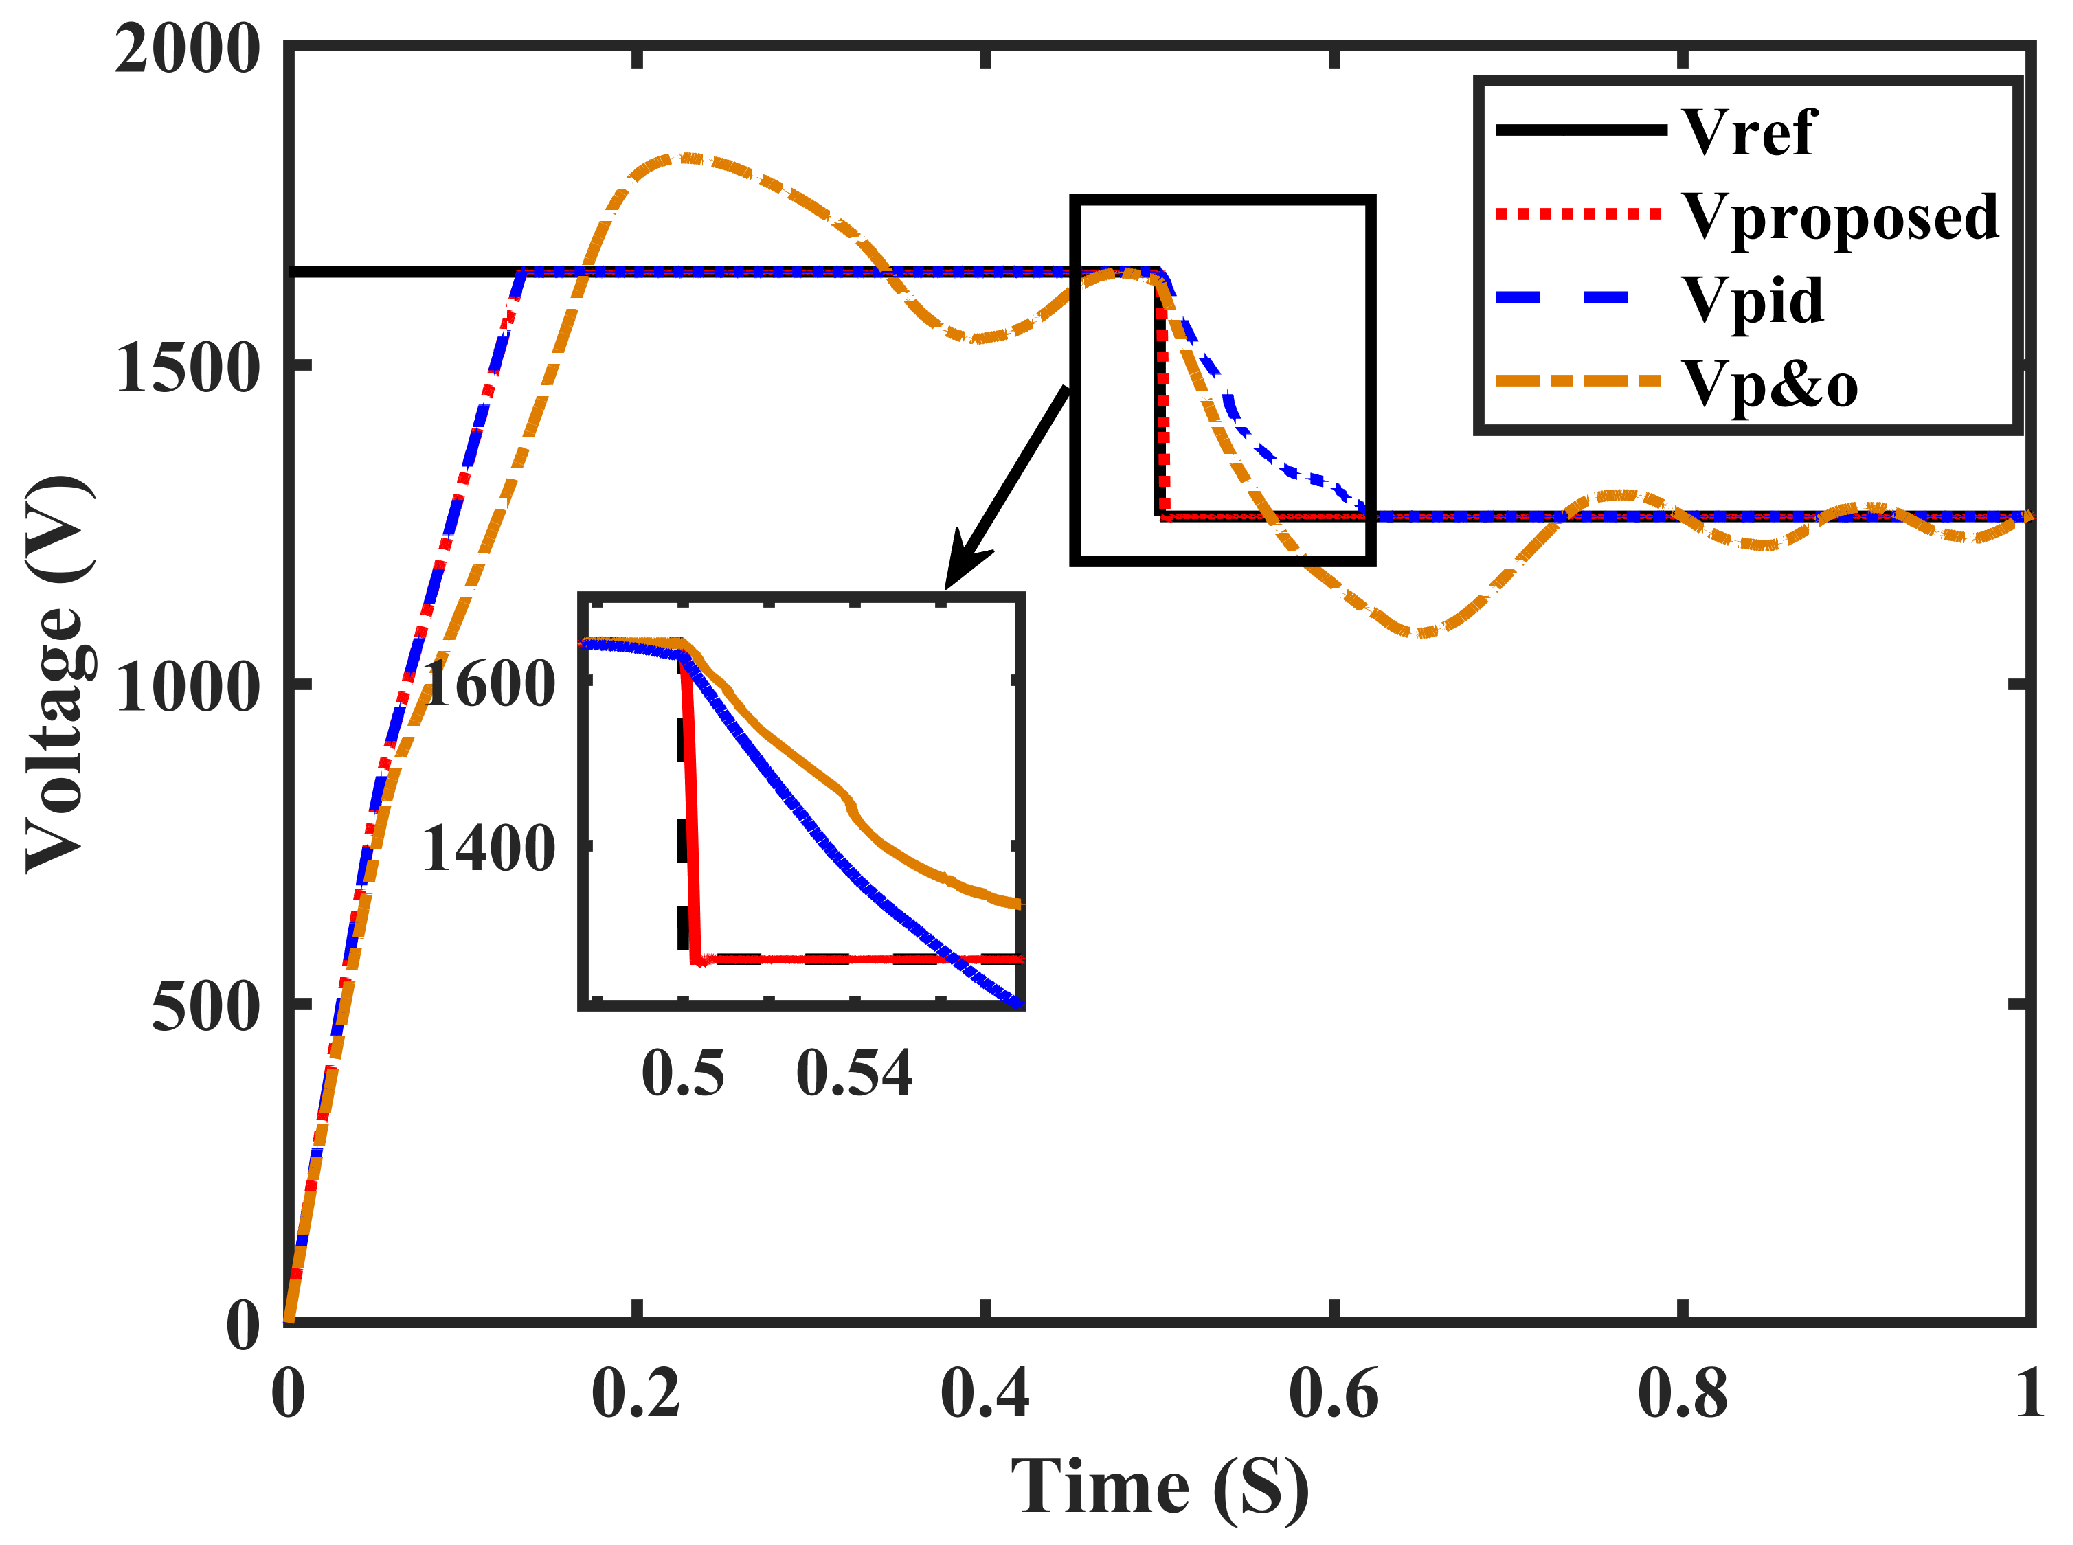
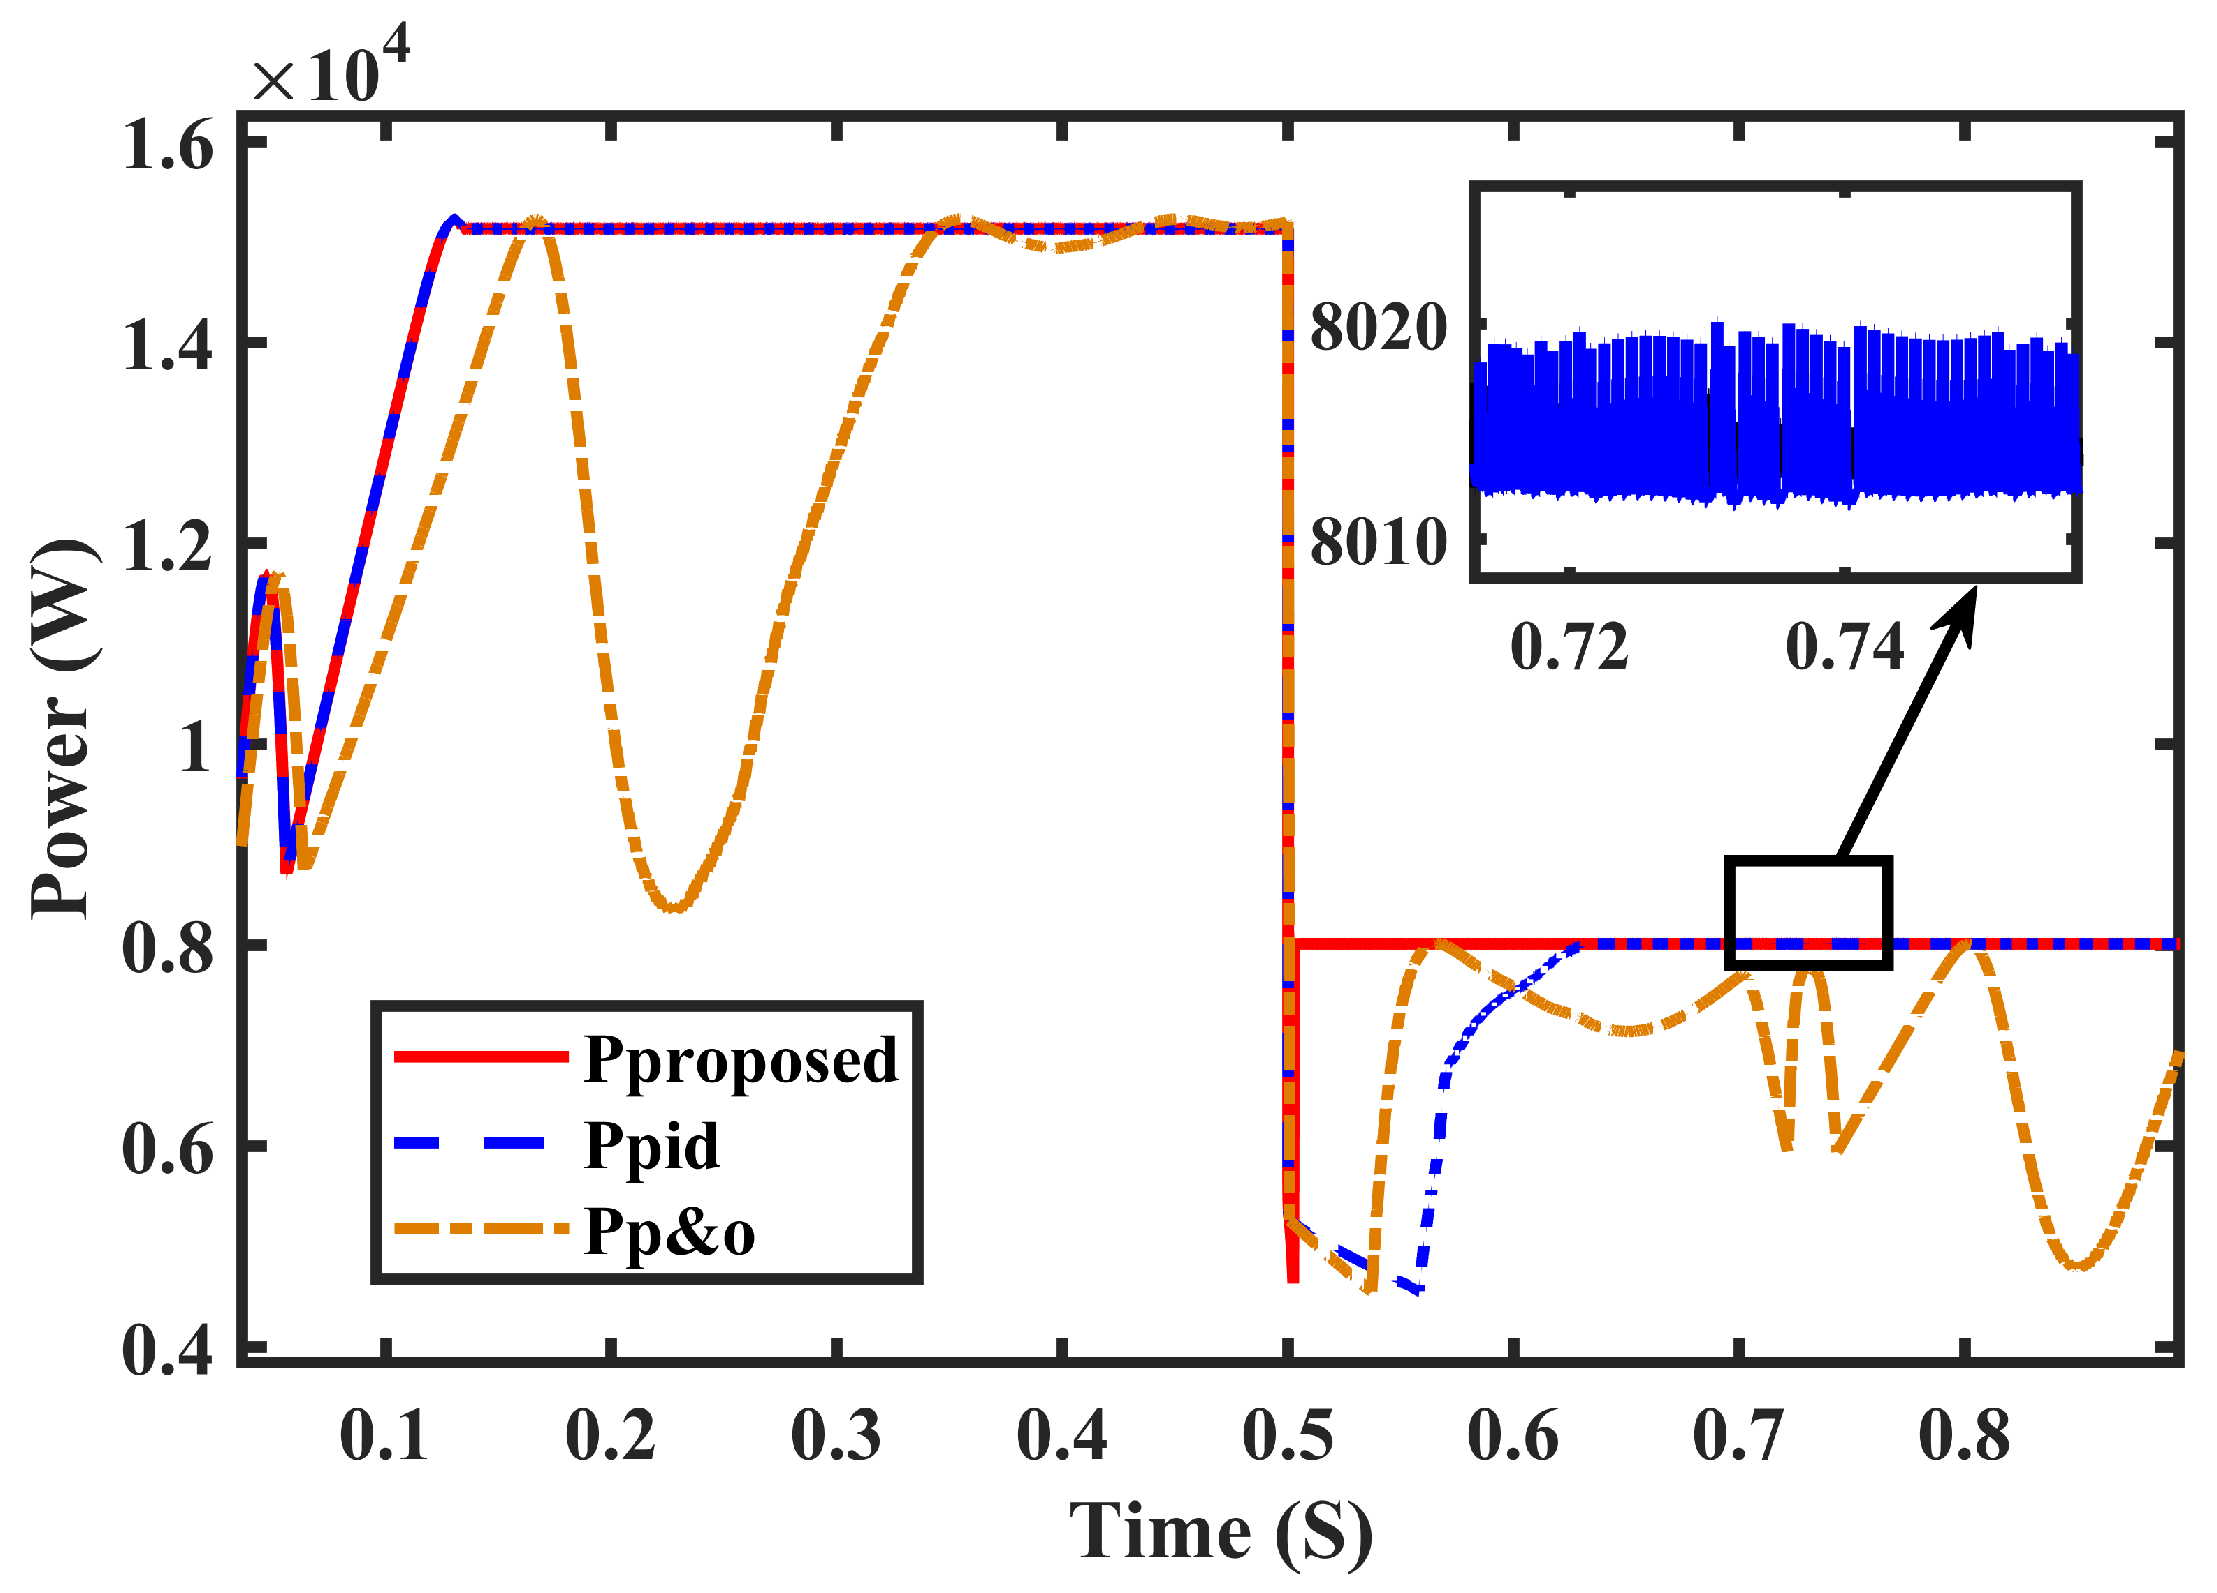
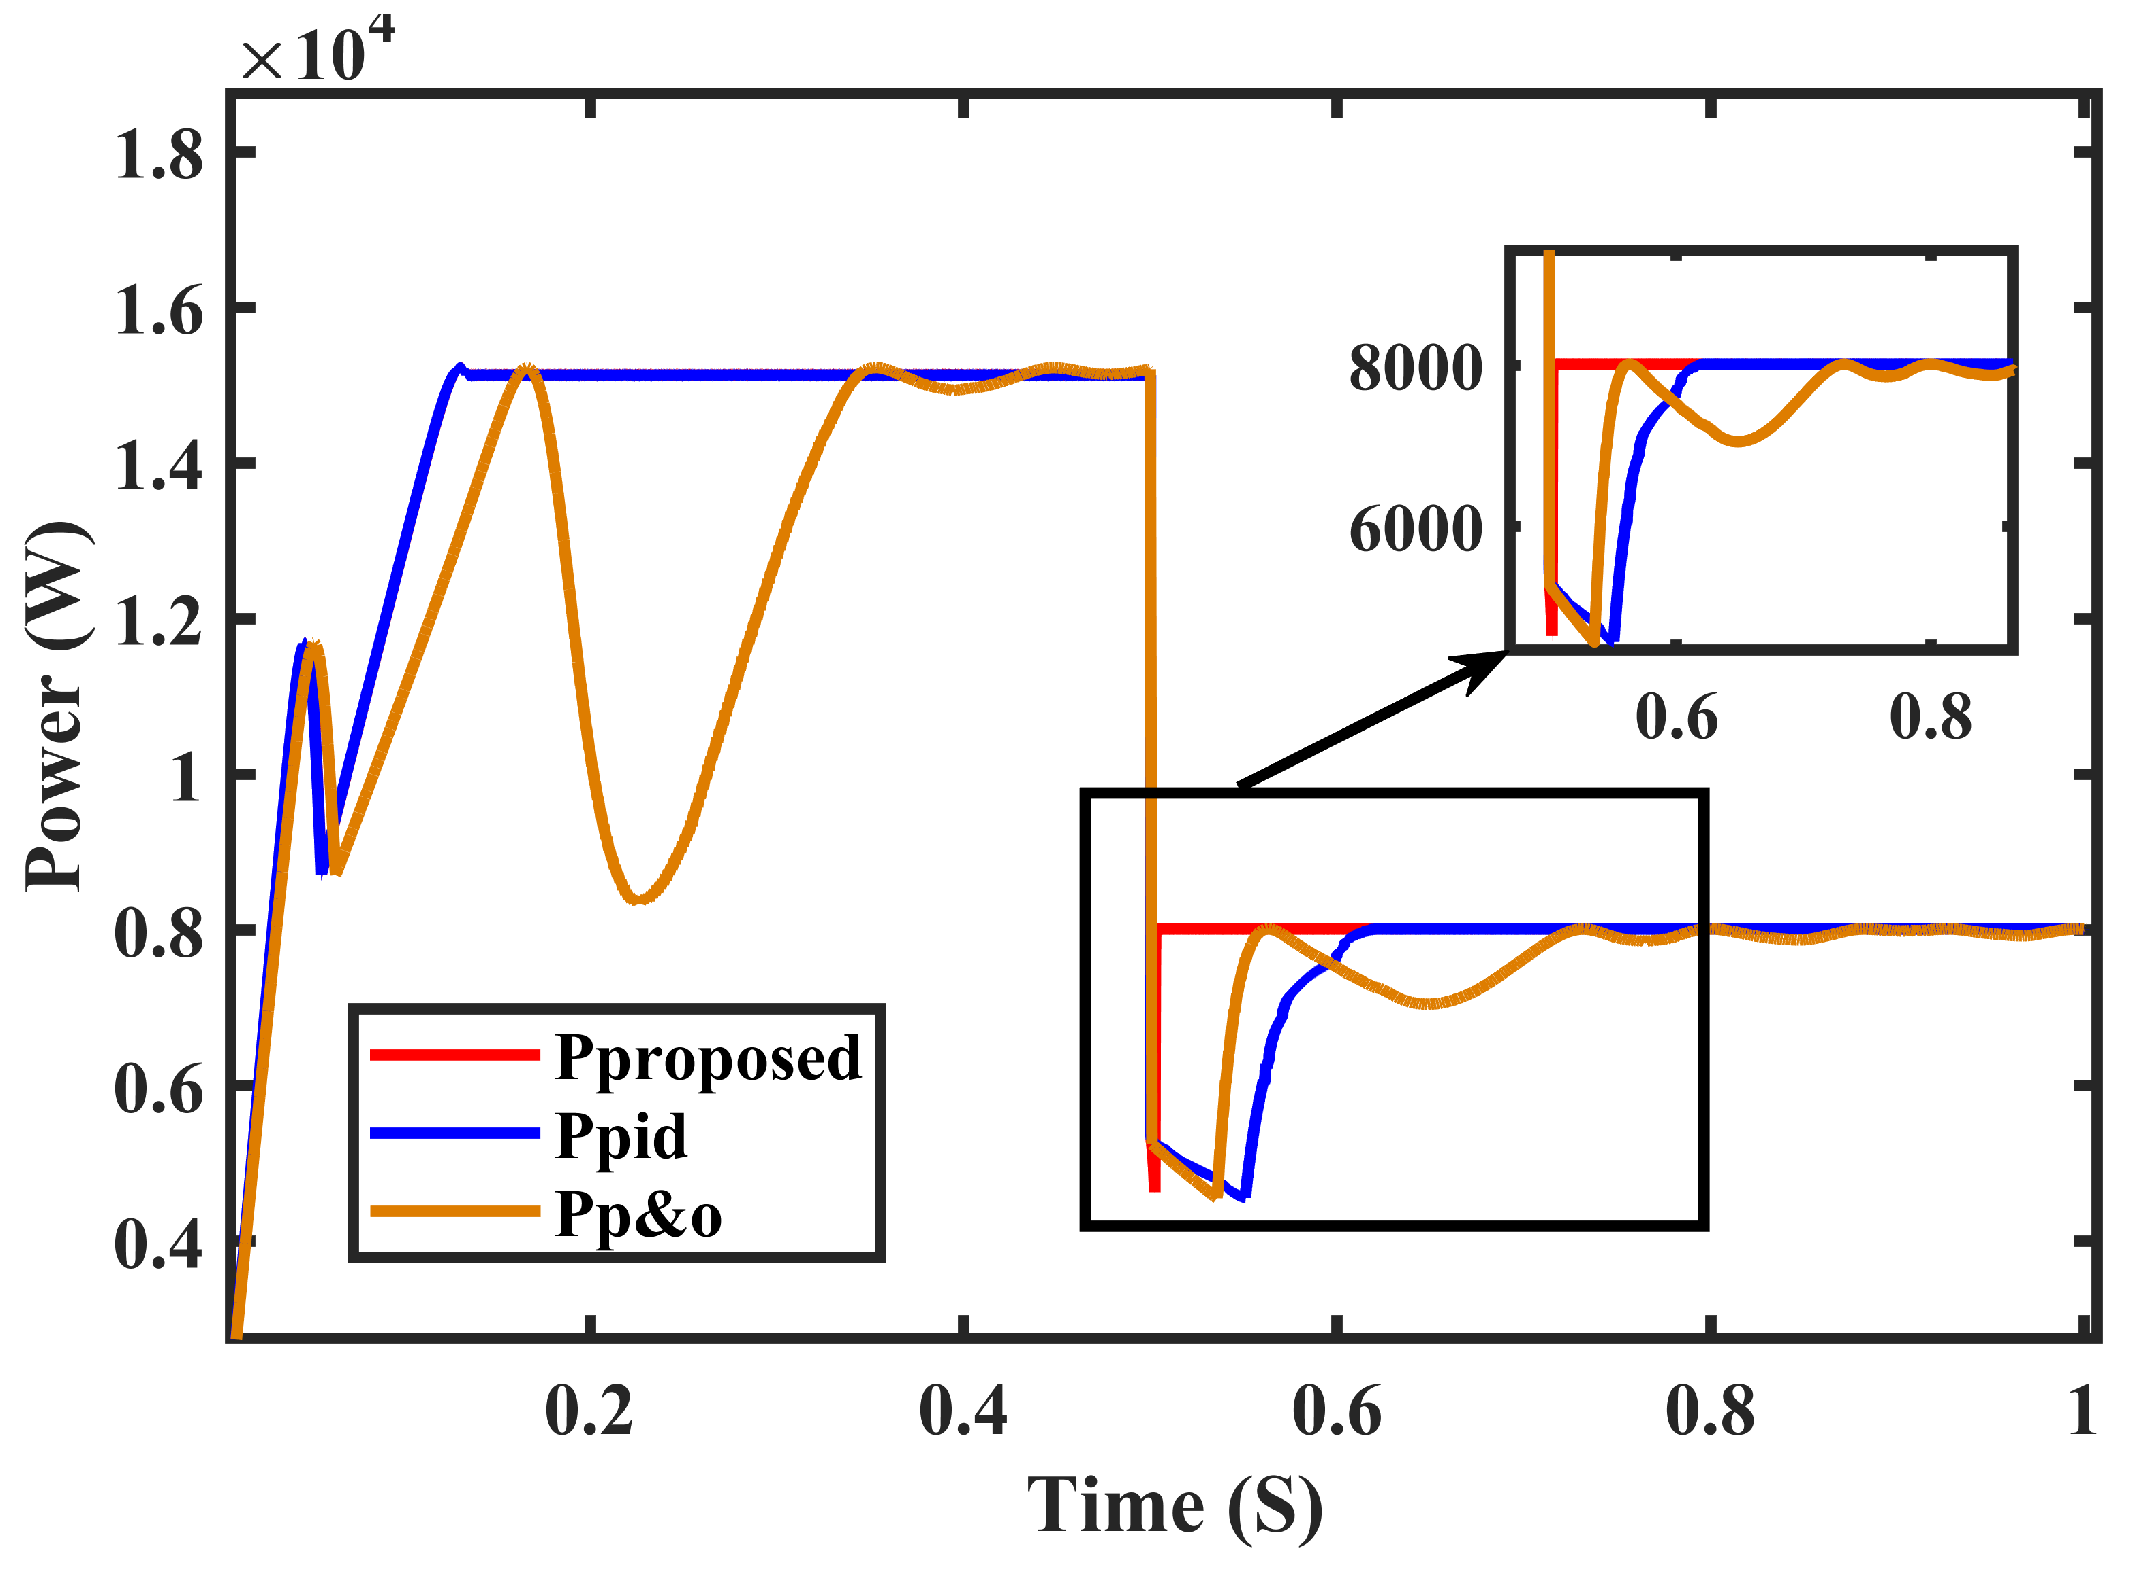
Initially, the proposed MPPT technique’s efficiency was evaluated under both steady-state and dynamic conditions. The dynamic response of the technique is depicted in
Figure 13, which shows the tracking of voltage when there was a sudden change in the set point from SP1 to SP2. The PV terminal voltage at 1645 V was regulated by the proposed MPPT technique, and at SP1, the output power reached 15,000 W, which was the MPP. In the proposed MPPT technique, at
t = 0.5 s, the SP suddenly changed from SP1 to SP2. This resulted in locating the new MPP at 1265 V, where the array power output changed to 8000 W, as shown in
Figure 13 successfully. Furthermore, the planned MPPT technique instantly controlled the duty ratio of the buck-boost converter.
Moreover, at the same time for the same system, the simulations run for conventional techniques (P&O and PID). As shown in
Figure 13, the conventional techniques failed to track instantly the voltage at the time of dynamic change in the shading pattern; that was at 0.5 s when SP changed from SP1 to SP2. It can be noted that in this scenario the simulations were carried out without adding uncertainties in the system and it is clear from the results that the proposed method obtained success in tracking the MPP with a rapid response under different shading patterns.
8.2. Performance Analysis with Uncertainities
The Simulink model which is described already is used by adding some uncertainties into the system to check the robustness and to make a comparison of it with other existing techniques shown in
Figure 14. Uncertainties in the shape of capacitance and inductance were added to the parameters of the buck-boost converter. A capacitance of 58 𝑢F was added in parallel with
C2 and an inductance of 30 mH was added in series with an inductor which was conducted for 0.7 to 0.8 s by mean of signal builder and switches.
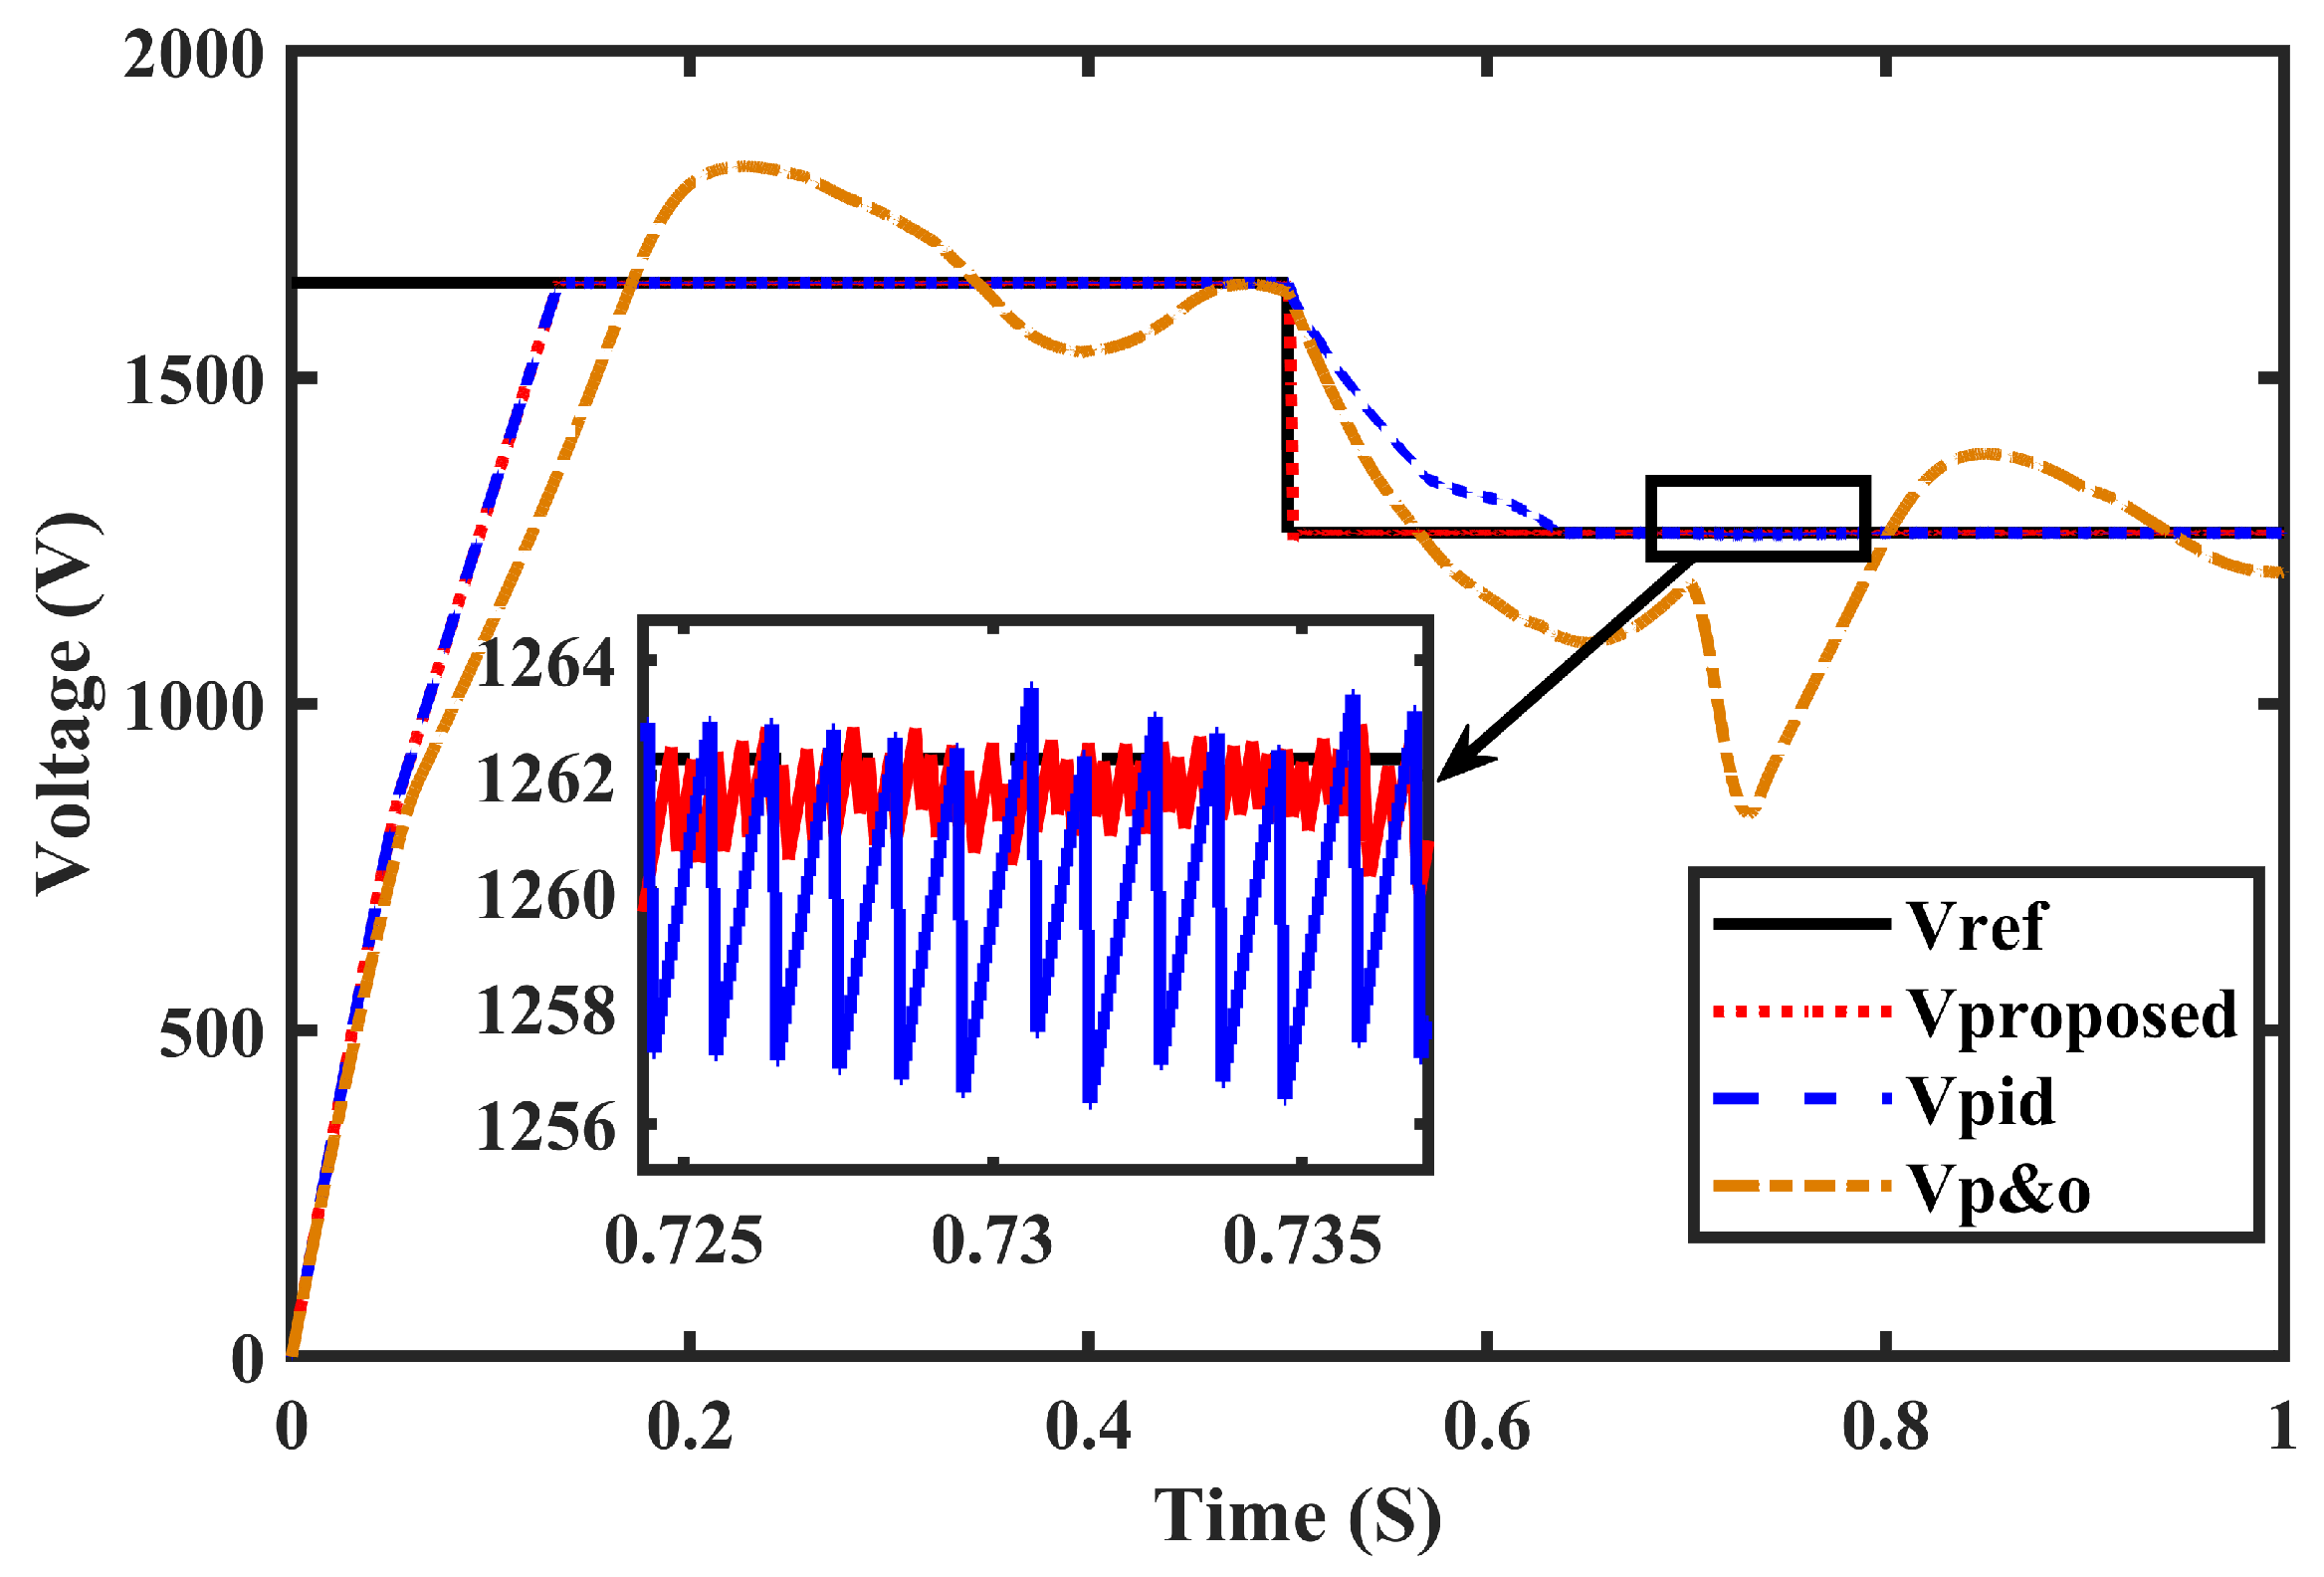
The voltage tracking and the changing shading pattern from SP1 to SP2 for the proposed technique and other existing methods (P&O and PID) are displayed in
Figure 15 and
Figure 16. Initially, SP1 was applied where the MPP was located at 1645 V and its subsequent output power was 15,000 W. This proposed methodology successfully operated at this point. The P&O worked at 1630 V and the calculated value of the output was 14,500 W. The proposed technique was able to accurately locate the new MPP at 1265 V and 8000 W despite the uncertainties caused by changes in the shading patterns from SP1 to SP2. However, it is important to note that traditional methods failed to perform well under these conditions, often oscillating around local peaks and experiencing significant chattering, as seen in
Figure 16. The proposed technique, however, was able to precisely identify the optimal operating voltage, resulting in a significant enhancement in system efficiency. Both the proposed and traditional methods are illustrated in
Figure 15 and
Figure 16, respectively, showing the variations in PV terminal voltage, output power, and the duty cycle during the transition from SP1 to SP2.
The results indicate clearly that the proposed technique showed minimum chattering as compared to P&O and PID for 0.7 to 0.8 s when uncertainties were added; it could bear abrupt changes which demonstrated control robustness.
8.3. Duty Cycle and Fault Analysis
Figure 17 demonstrates that the proposed technique was successful in the instantaneous control of the duty cycle. When the shading pattern changes from SP1 to SP2 at 0.5 s then the duty cycle changes from 0.21 to 0.35. On the other hand, the error convergence was tested when the shading patterns changed from SP1 to SP2, which is shown in
Figure 18.
9. Comparative Analysis of Proposed Technique
The proposed system has been validated through a practical experimental setup. The PV emulator used in this study is based on the single diode model, where the PV system acts as a current source with an antiparallel diode and intrinsic resistances. Literature shows that a PV cell is essentially a voltage source dependent on current, and its output current and open-circuit voltage (
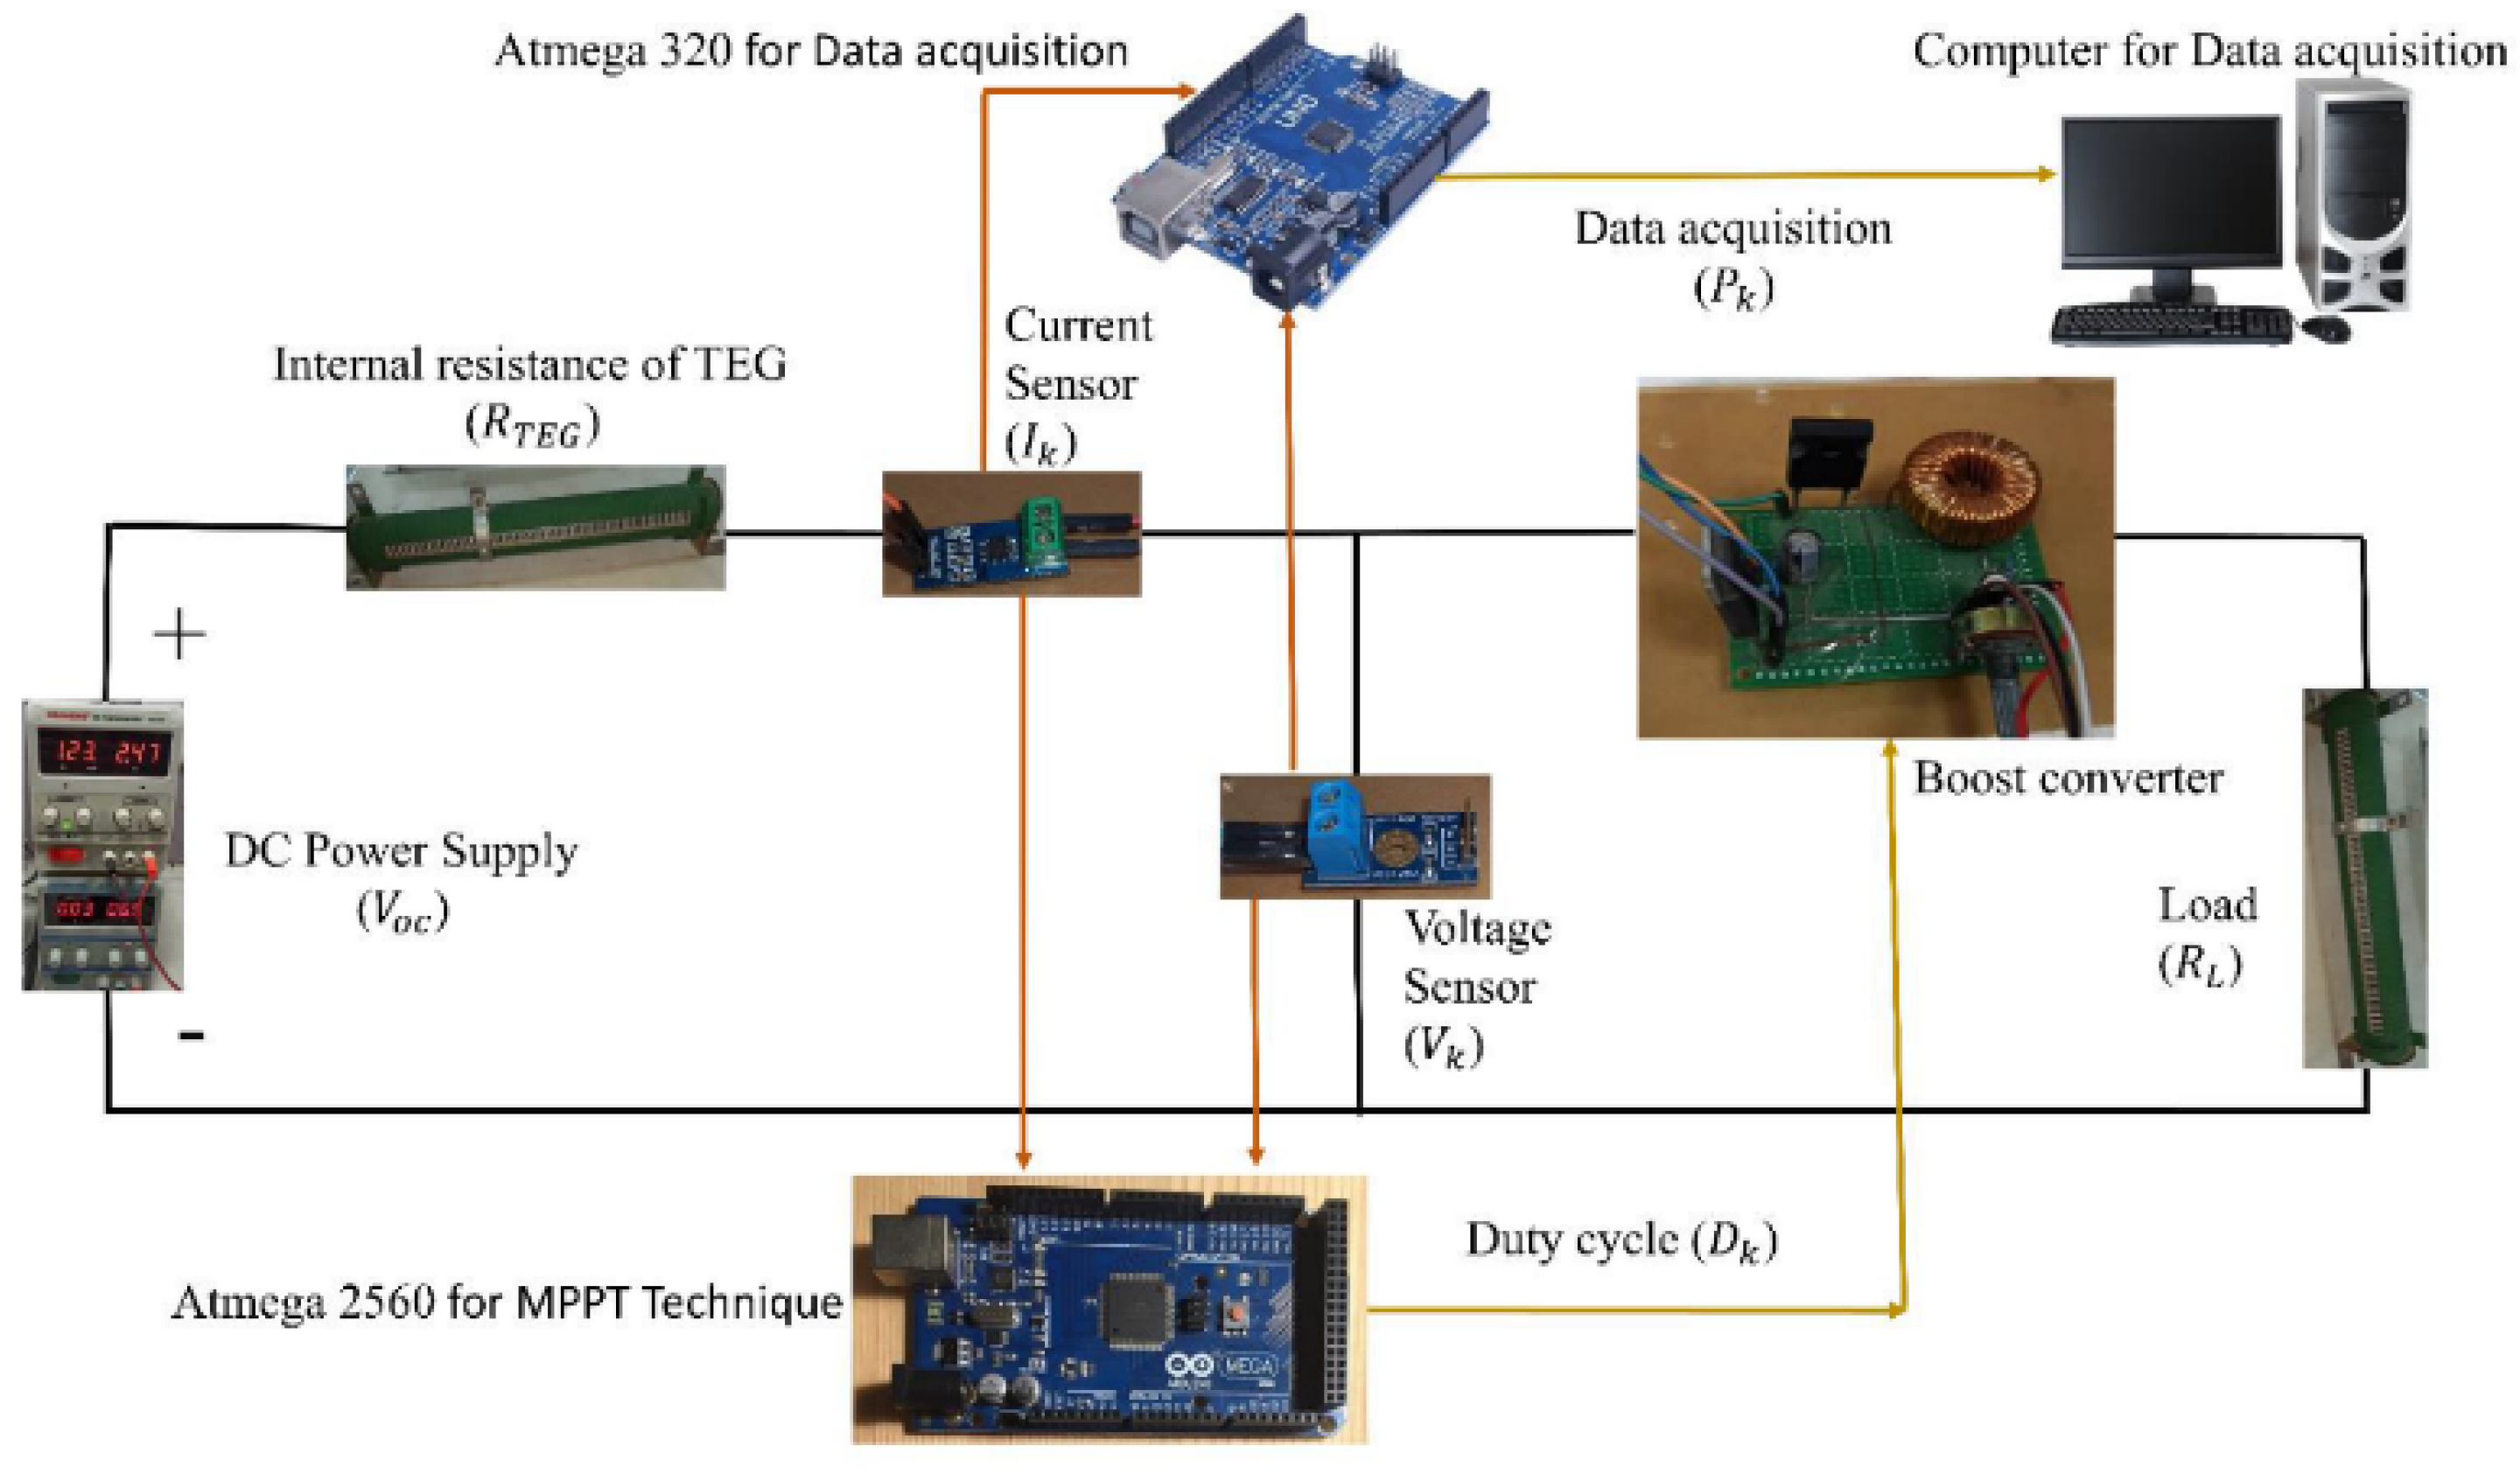
VOC) vary with changes in irradiance and temperature. Therefore, a DC power source with high current and low sensitivity can emulate the electrical characteristics of a PV system. The superposition of constant current, constant voltage, and diode activation effectively mimics the electrical behavior of a PV cell. The load was changed using a 500 W variable resistor, which in practical terms alters the maximum power delivery to the load and forces the algorithm to maximize the power at a changing load following the maximum power delivery theorem. The impact of irradiance was evaluated by suddenly changing the voltage of the DC current source.
Figure 19 illustrates the physical connections among the PV system components such as the DC—DC buck-boost converter, sensors, microcontrollers for MPPT control, data acquisition, and load. The performance of the proposed MLNFN TSMC was compared to that of a ZN-tuned PID controller. The emulation function was limited by the variable current generation for the PV module.
Table 7 lists the values of the components used for the practical application of control.
Figure 20 shows the layout of the experimental setup.
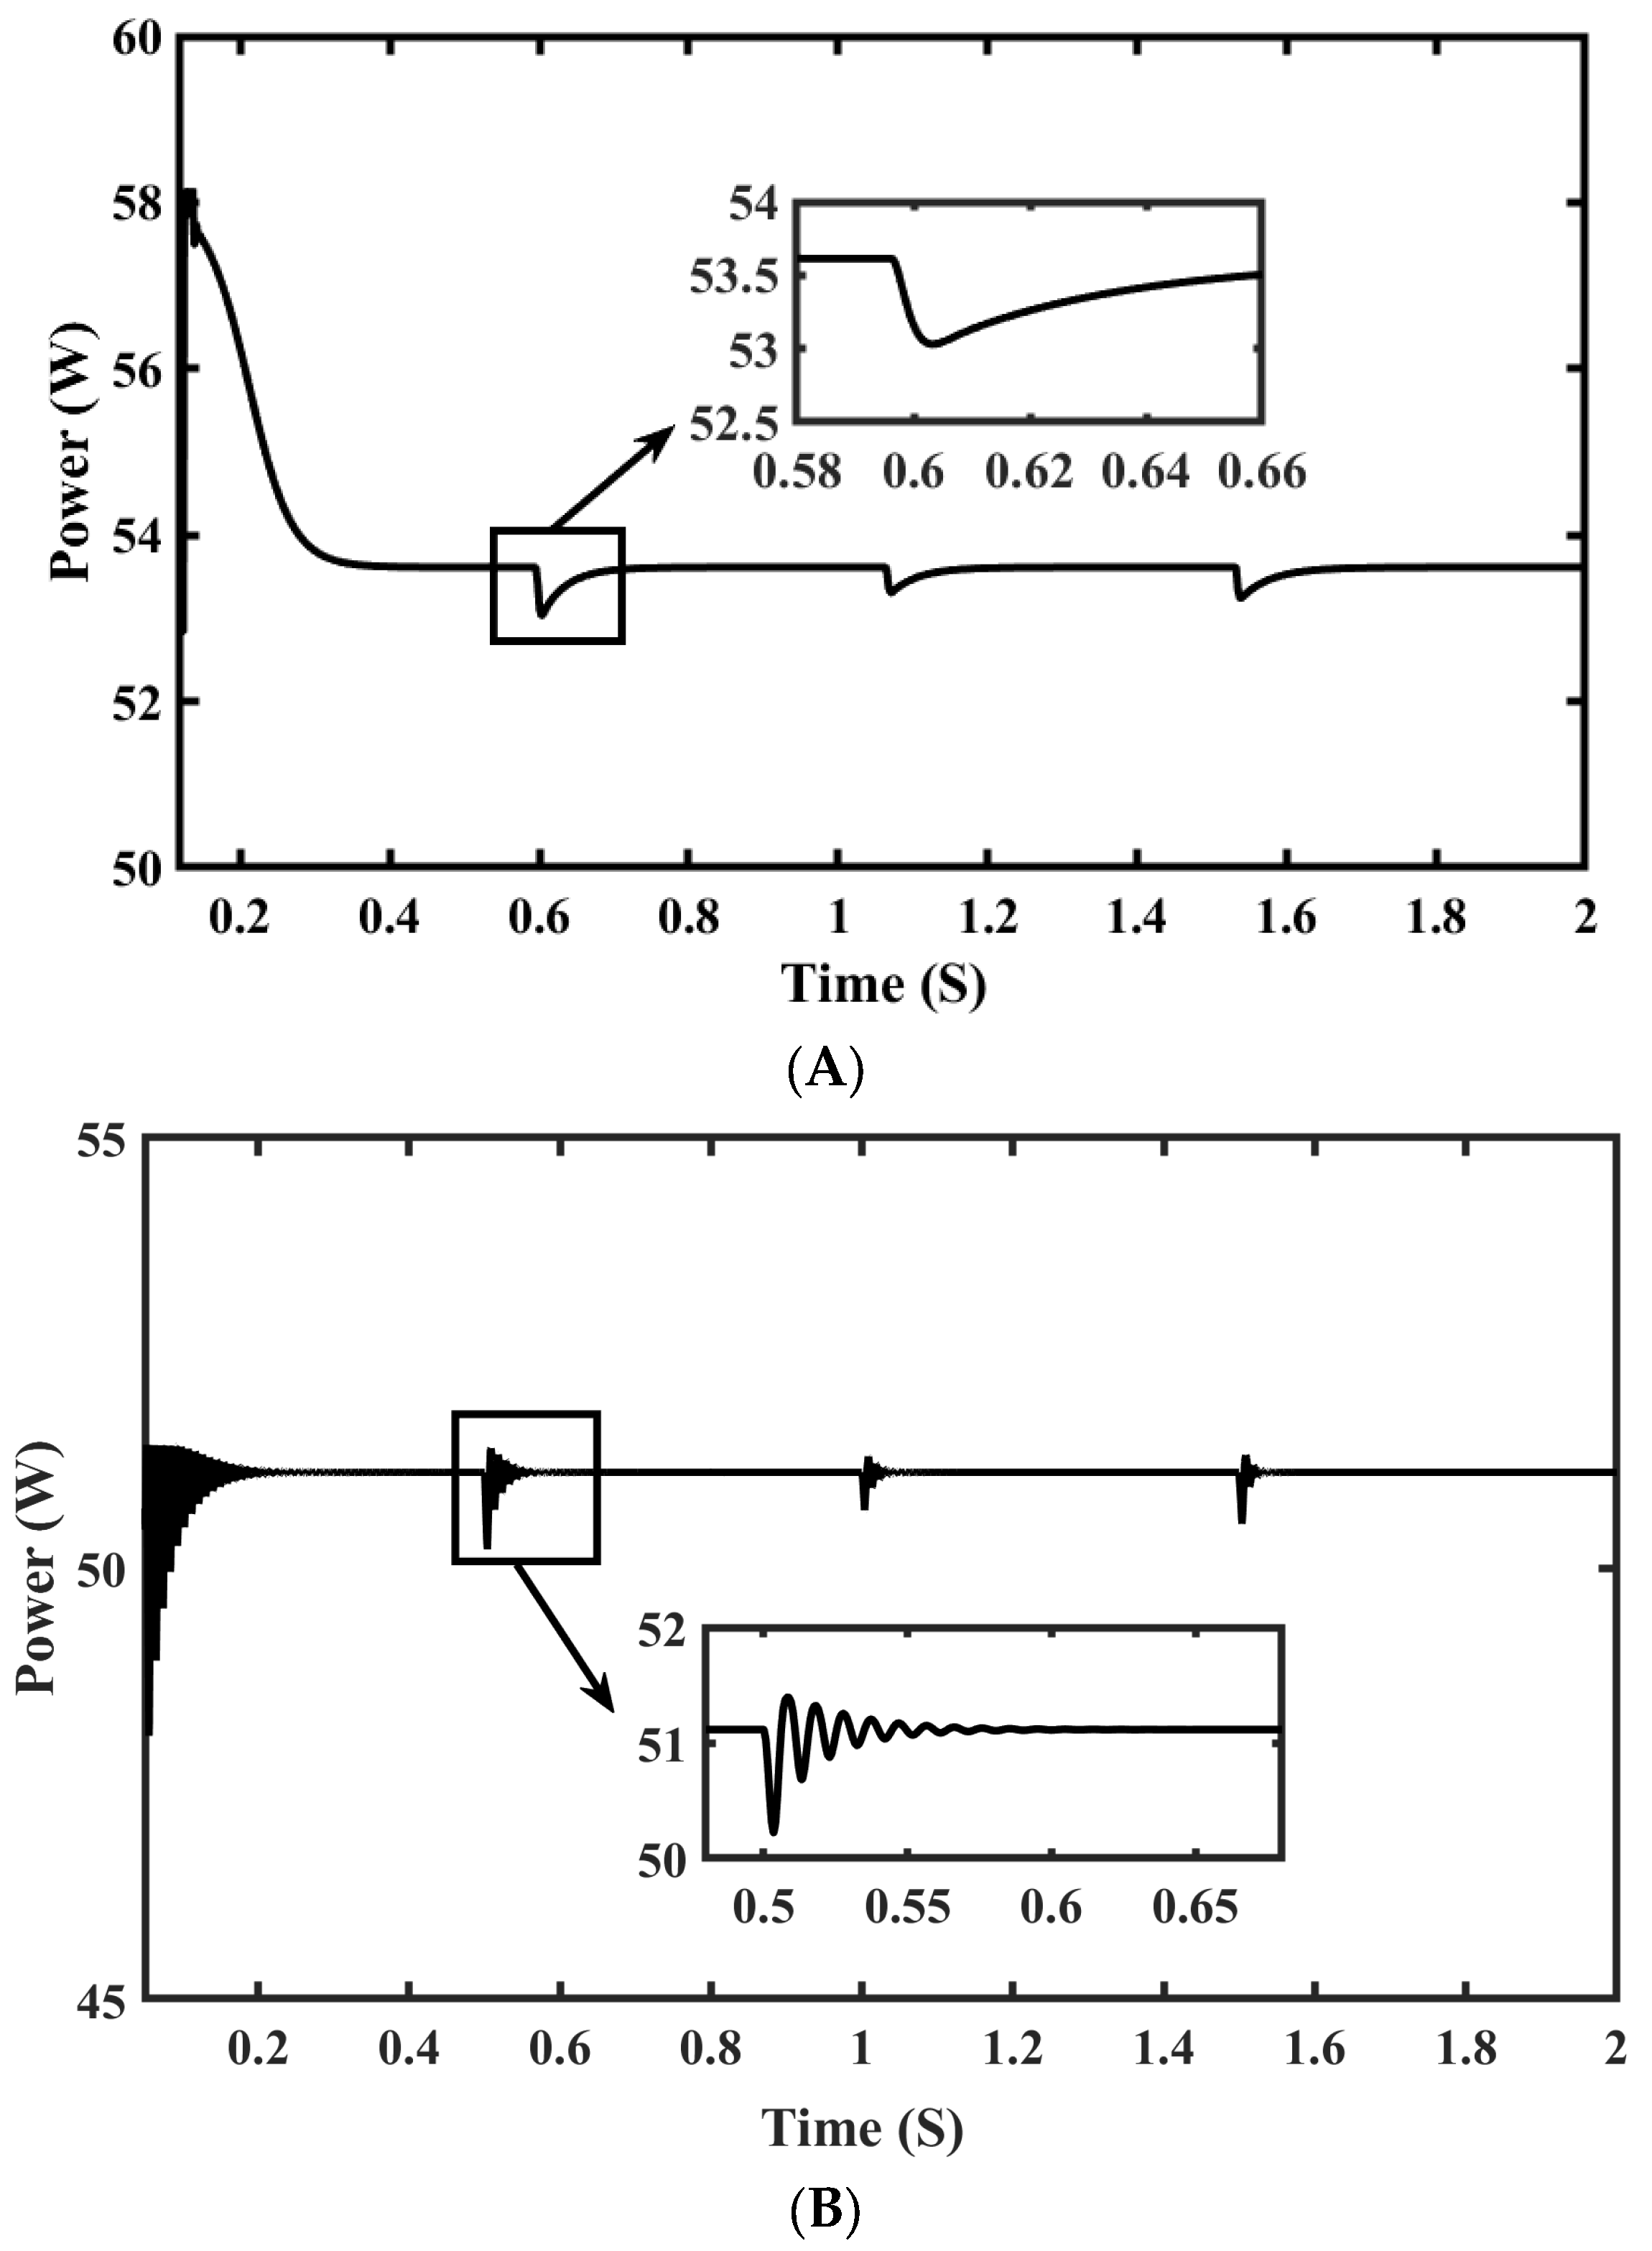
Figure 21 shows tracked power with dynamic load conditions by MLNFN TSMC and PID controllers. PID takes up to 250 ms for final GMPP settling as shown in
Figure 21B. Oscillations which were unavoidable were noticed after 250 ms represented in magnification window, in addition to this less maximum power was achieved with PID. It added to power loss and decreased inefficiency. MLNFN TSMC tracks GM faster as compared to PID and settles at GMPP in 100–120 ms as shown in
Figure 21A. MLNFN TSMC showed minimum oscillations after GMPP detection and consequently generated the least power loss in steady and dynamic states showing an 8.2% higher average power and 60% less control time. The performance in transition and final steady states was observed in the experiment, similar to the anticipated behavior in the mathematical model. Negligible fluctuations and the least settling time in experimental results reiterated better performance of MLNFN TSMC.
Figure 22A,B, shows the reference voltages computed by the MLNFN TSMC and PID controller, respectively.
10. Common Performance Analysis and Discussions
This study delves into the shortcomings of conventional PID control-based methods for tracking the MPP in PV systems during PSCs. These techniques are unable to circumvent local maxima (LM) traps and often lead to voltage fluctuations that impede the integration of large-scale PV systems into power grids. To address these challenges, in recent years the researchers have proposed a new technique called the intelligent modified shuffled frog leaping algorithm (IMSFLA) which has been found to be more effective in tracking the GMPP with an efficiency of 99%. IMSFLA also demonstrates minimal oscillations at the GMPP resulting in increased power output to the load. The IMSLFA algorithm operates by dividing the problem into several sub-problems, which are then optimized in parallel. The algorithm uses a combination of local and global search strategies to explore the search space efficiently. The local search strategy helps the algorithm to converge quickly, while the global search strategy helps it to avoid local optima and find the global MPP. Compared with conventional techniques, the reported IMSFLA provides improved accuracy, faster tracking speed, and robustness to noise.
Our proposed method of MLNFN TSMC has been verified as robust in dynamic as well as static operating conditions through hardware experiments. These experiments show that the proposed technique performs well under real-world conditions and load variations, resulting in 56.1% less variability and only a 2–3 W standard deviation at the MPP and found to mimic the IMSFLA performance.
The purposed technique combines the advantages of fuzzy logic control, neural network-based control, and terminal sliding mode control to achieve optimal performance. In real-world partial shading conditions and load variation, the performance of the neuro-fuzzy terminal sliding mode MPPT technique depends on several factors, such as the complexity of the system, the quality of the sensors, and the accuracy of the modeling of the PV system. However, the technique has been shown to be effective in improving the performance of PV systems under partial shading conditions and load variation. The purposed technique improves the efficiency of the PV system under partial shading conditions and load variation, compared to other MPPT techniques. The technique was able to adjust the duty cycle of the DC—DC converter to ensure that the PV system operated at the MPP, even under partial shading conditions. The results also showed that the proposed technique was able to maintain a stable output voltage and current under partial shading conditions and load variation. The neuro-fuzzy logic was able to adjust the controller parameters in real-time based on the input signals, which ensured the stability of the system. Furthermore, the terminal sliding mode control was able to provide fast and accurate tracking of the MPP, even under dynamic partial shading conditions.
11. Conclusions
This study proposes a two-stage MPPT approach for PV systems operating under PSCs. A NFN is employed to enhance the reference voltage generation for MPPT. The proposed strategy guarantees finite-time convergence of MPP voltage tracking and resolves the issue of multiple peaks caused by shading conditions, in contrast to traditional TSMC methods. The method is tested through real-time experiments and numerical simulations and was found to significantly improve MPPT performance, even under rapidly changing irradiance and temperature conditions. The proposed robust TSMC approach is also more resilient, as demonstrated by simulations under varying weather conditions and uncertainties. The results show that the proposed method can quickly and accurately track the MPP, even in the presence of uncertainties, when compared to P&O, PID and incremental conductance conventional controllers.


 ,
, 


