1. Introduction
Pulmonary diseases are among the most common pathological conditions in the world. Therefore, accurate diagnosis and monitoring of lung diseases are in the general interest. Due to the pandemic caused by the SARS-COV-2 virus, there is great motivation to collect clinical data, which also results in an increasing interest in the field of artificial intelligence to create intelligent solutions using machine learning [
1]. Our focus lies in lung ultrasound (LUS), used to support the diagnosis of various lung conditions and to detect post-surgery complications. Standard scanning techniques for diagnosing and monitoring pulmonary pathologies include chest X-rays [
2,
3,
4,
5,
6], computed tomography (CT) [
7,
8], and magnetic resonance imaging (MRI) [
9]. However, these diagnostic approaches use ionizing radiation, posing a risk to the patient’s health, especially if more frequent monitoring is required [
10,
11]. Ultrasound technologies can overcome the limitations of these technologies and provide a safer, portable, and cost-effective alternative [
12]. Ultrasound is an option especially suitable for children and pregnant women who should not be exposed to radiation and for patients undergoing re-examinations. Another advantage is the portability of the ultrasound device since transferring patients to and from the radiology department is associated with additional risks. Finally, it is important to mention the significantly lower cost of ultrasound examination compared to CT or MRI. Ultrasound devices are more accessible, and practitioners can examine more patients, which is essential in sustainable health care related to the aging society and the increased incidence of chronic diseases.
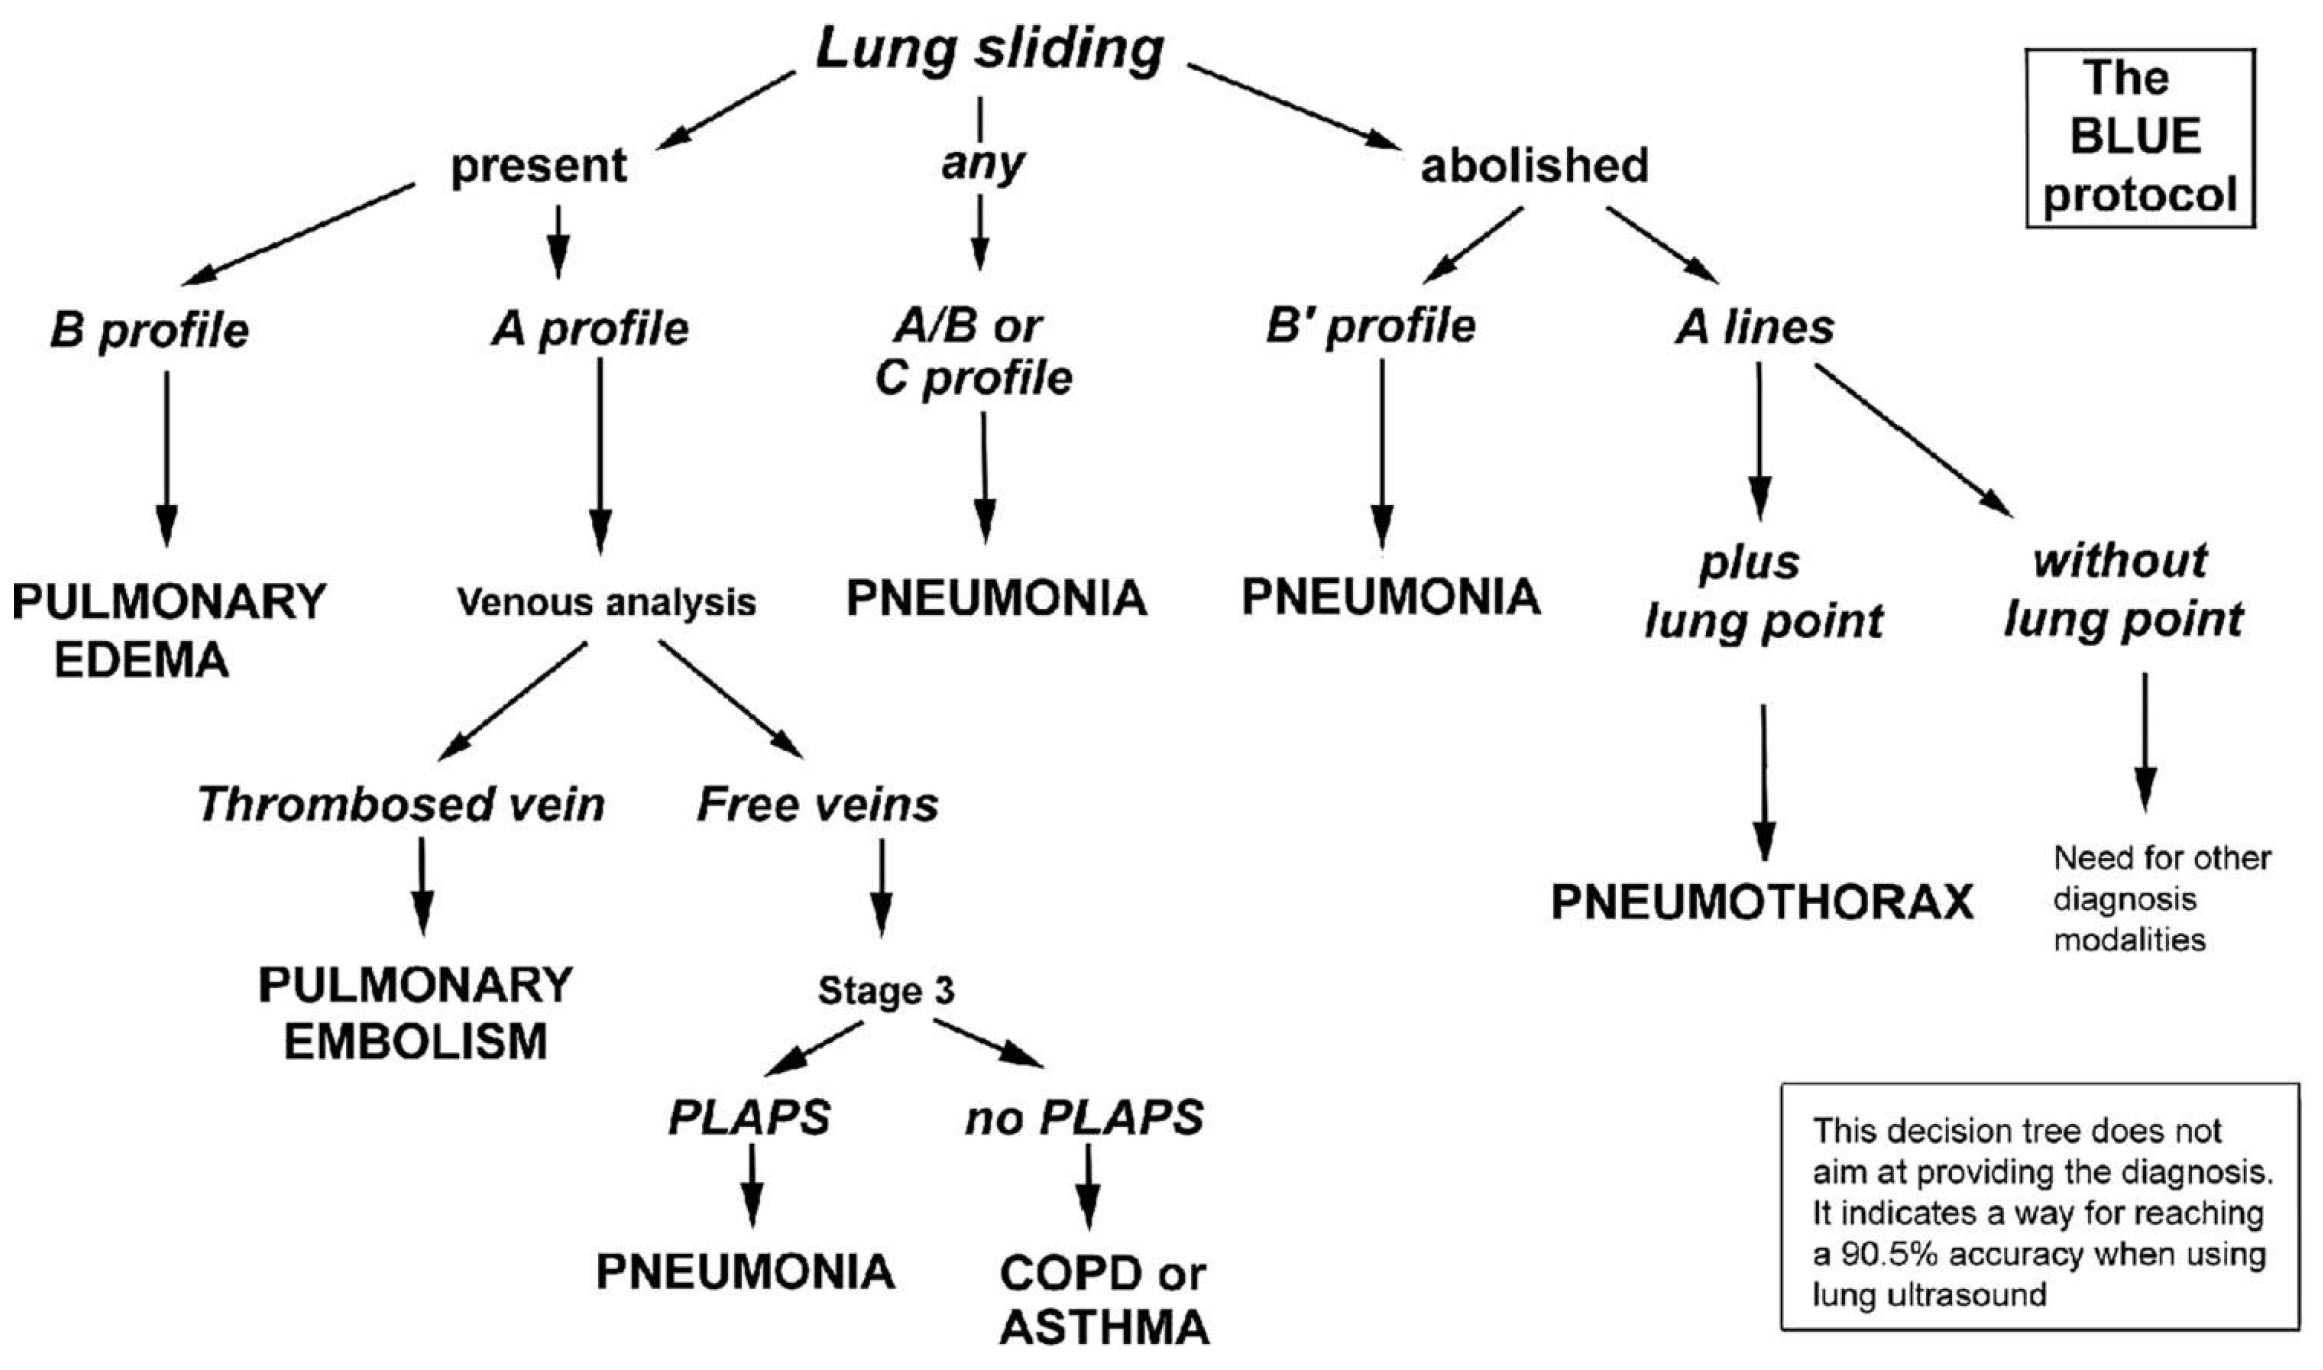
LUS imagery is inspected by a specialist who searches for certain features (artifacts), such as detecting lung sliding, A-lines, and B-lines, to answer a series of questions forming a decision tree supporting the final diagnosis. This approach follows the BLUE-protocol, introduced by Lichtenstein and Mezière [
13] that describes a series of lung ultrasound examinations and a decision tree allowing the rapid etiological diagnosis of acute respiratory failure, as shown in
Figure 1. It combines signs with locations, leading to 8 specific profiles. By building reliable detection models for particular phenomena, we can automate the diagnostic process and make it more accessible.
In particular, the following artifacts are of interest for supporting quick diagnosis:
Lung sliding —in a healthy individual, the parietal and visceral pleura are tightly connected to each other with a minimal amount of fluid in between. This fact allows them to slide on one another while breathing. This back-and-forth movement of the pleura can be observed in B-mode or M-mode images.
A-lines—occur when ultrasonic waves bounce back and forth between the pleura and the transducer. This fact creates an echo that can be viewed on the screen as horizontal lines parallel to the pleural line and at constant distances corresponding to the distance between the skin and the pleura.
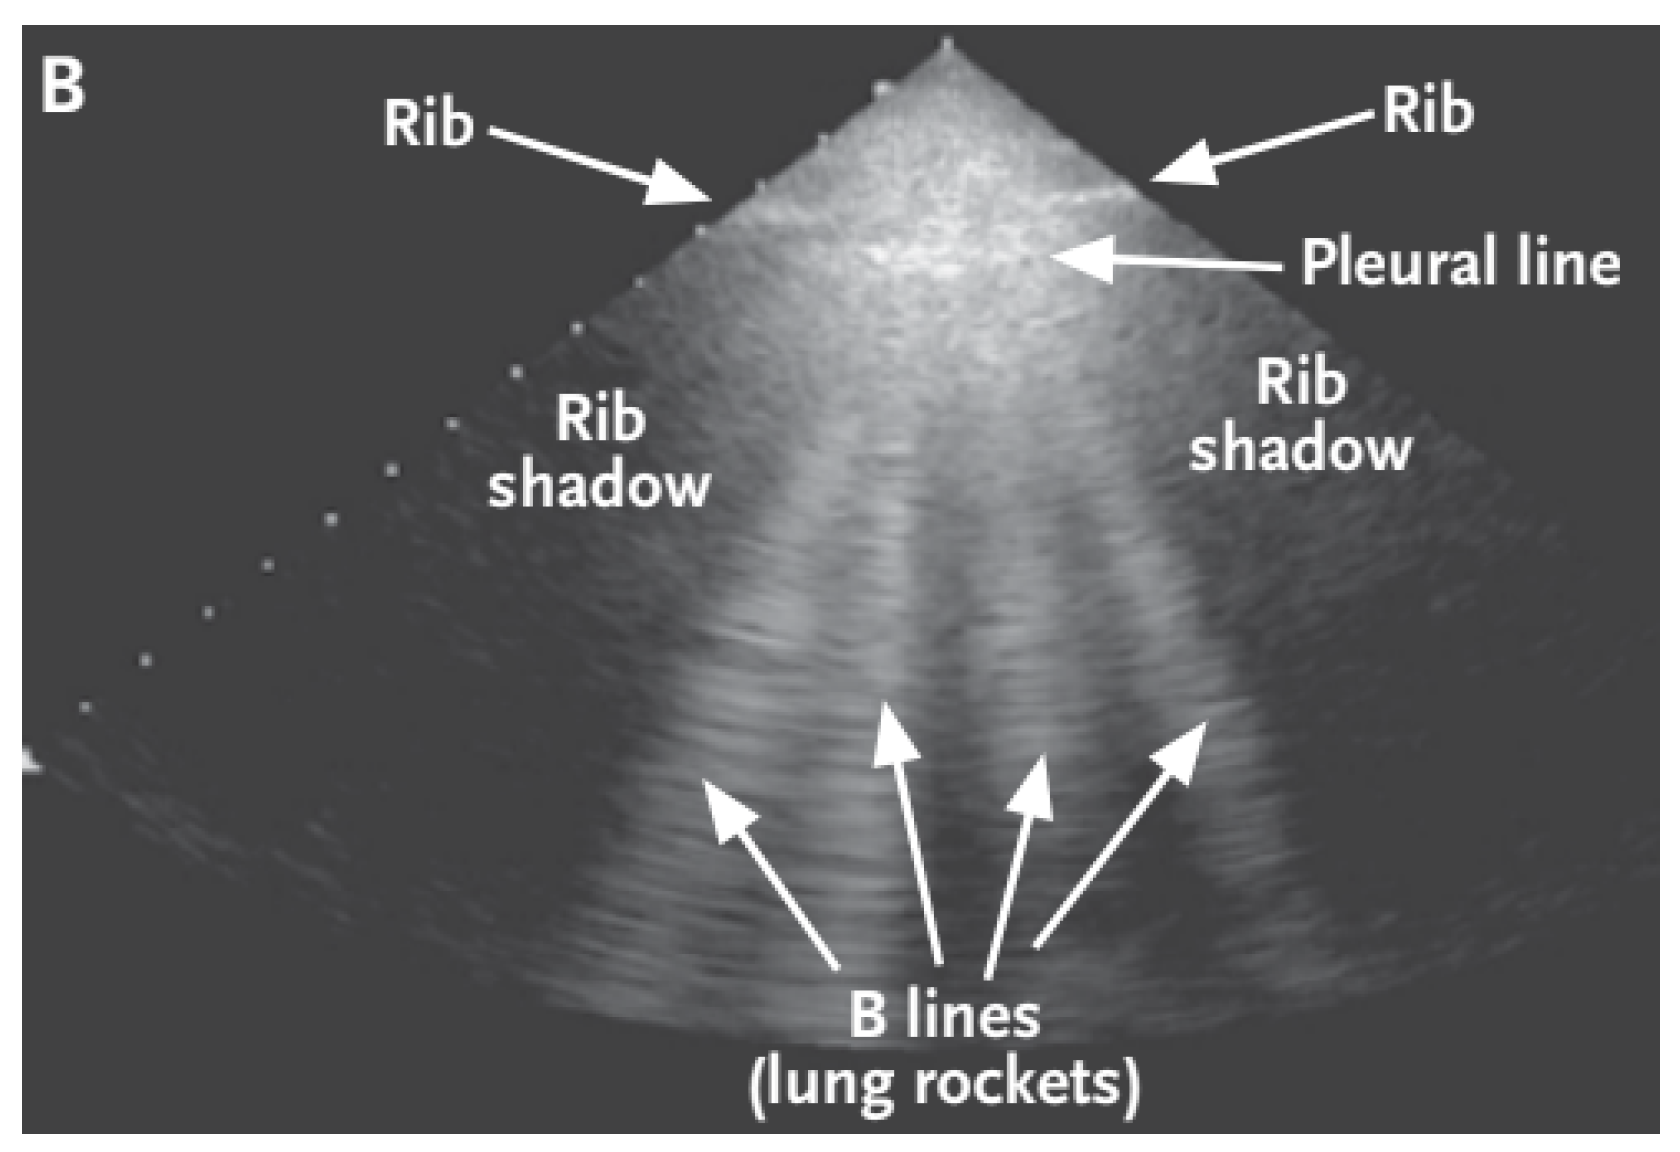
B-lines—depicted in
Figure 2—are clinically defined as vertical artifacts that start from the pleural line, lying perpendicular to it, and extend to the bottom of the screen. These lines arise when sound waves enter the pleural cavity. With this artifact, it can be observed that they move along with the patient’s breathing.
In this paper, we propose an analytical approach for the automatic detection of A- and B-lines. While existing research targets the detection of these artifacts, it usually uses artificial neural networks, which may be too computationally heavy to allow for real-time processing and often requires dedicated hardware with higher computational performance. Furthermore, the use of artificial neural networks requires carefully labeled training data, especially for segmentation, i.e., localization of the artifacts. The training itself must also be run on dedicated hardware. The training data will limit the applicability of the trained neural network, e.g., if the model is trained on data from convex ultrasound probes, it needs to be completely retrained to be used on records from linear probes. On the other hand, the analytical approach requires no training data (for classification or segmentation), and only its parameters must be adjusted to reflect the specifics of any given dataset. It is also more general in that a single algorithm can support both segmentation and classification through the use of statistical analysis of artifacts found, while a neural network trained to classify videos will not be able to localize artifacts.
In the standard setting, the enhancement of artifacts in the LUS images seen by the examiner greatly aids in obtaining the correct diagnosis [
15]. Although the examiners are trained professionals, the LUS imagery lacks the sharpness and the level of detail of other imaging methods, which opens space for subjective interpretation. Our method, which uses Fourier transform to identify artifacts, uses purely analytical methods of computer vision, meaning that it can potentially be used on widely available devices. By showing the results of such identification to the doctor, we can automate some steps of the BLUE protocol while also aiding the examining practitioner in reaching a more precise diagnosis. We evaluate the proposed method on different types of data, presenting preliminary results that test the applicability of our method, and outline future research steps.
The paper is structured as follows:
Section 2 provides an overview of related research and identifies the state of the art in artifact detection from LUS data;
Section 3 describes the data used in our experiments;
Section 4 presents our approach and its parameters;
Section 5 lists the results of our experiments in different tasks, a discussion of which follows in
Section 6 along with limitations and the outline of future work.
2. Related Work
Ultrasound is one of the most widely used imaging methods in medical diagnostics. Its advantages include low cost, its non-invasive nature, and easy operation. However, it has certain disadvantages, such as lower resolution and the presence of noise; the correct diagnosis depends largely on the examiner’s experience. Deep learning support systems are being developed to overcome these shortcomings, aid the decision-making process, and improve the accuracy and effectiveness of diagnostics. The COVID-19 pandemic has increased the pressure to diagnose patients quickly and accurately, and a number of studies are currently being pursued to speed up this process. Some deal directly with the classification of conditions, while others try to find artifacts in LUS videos from which it is possible to specify the disease.
Born et al. [
16] developed a publicly available POCUS (point of care ultrasound) dataset consisting of 202 videos in four classes (COVID-19, bacterial pneumonia, viral pneumonia without COVID-19, and healthy patients). They designed a 2D convolutional neural network (CNN) model that distinguishes these classes. The model’s accuracy was evaluated using 5-fold cross-validation with a sensitivity of 0.90 ± 0.08 and a specificity of 0.96 ± 0.04. In a follow-up study, Sadik et al. [
17] improved LUS image preprocessing. They were the first to use limited contrast histogram alignment for images and contrast-limited adaptive histogram equalization (CLAHE). The authors also used noise filtering using the Fourier transform. These preprocessing methods have been used on the POCUS dataset with different types of CNN architectures (DenseNet-201, VGG19, Xception, Resnet152V2, NasNEtMobile).
The B-line artifact appears as a vertical smudge (comet tail) when using a linear ultrasound probe. If a convex probe is used, then the B-lines extend as if from a point source along the propagation of the sound waves at an angle to the x-axis of the image. This fact was addressed by Hamideh Kerdegari et al. [
18] in their study. The paper investigated the influence of ultrasound representation of polar coordinates on the tasks of B-line detection and localization. They used a CNN model that served as a symptom extractor and an LSTM + attention mechanism to learn which images in the video were essential for classification.
In another work, Ruud J. G. et al. developed a deep neural network for B-line localization through poorly controlled learning. In this work, the CNN only had information on whether there were B-lines in the image or not. From this information, the neural network learned to locate the B-lines in the image. Their network architecture consisted of 5
blocks, and only the last block used
instead of
. Subsequently, a fully connected layer with 256 neurons and two output neurons was used. The gradient-weighted class activation map (grad-CAM) was used to locate the B-lines in the images. When tested on artificially created data, the authors obtained an accuracy and sensitivity of 0.917 and 0.915, respectively. In contrast, when evaluated on real LUS images, the values were lower: the accuracy was 0.892, and the sensitivity was 0.871. This led to the conclusion that artificially created images were not interchangeable with real-world data [
19].
Cristiana Baloescu et al. [
20] sought to develop and test a deep-learning algorithm to quantify the evaluation of B-lines in LUS. They focused on the binary classification of the presence or absence of B-lines. In addition, they attempted to classify the severity of lung consolidation into grades 0 to 4. The dataset used in this study contained 400 recordings taken by convex, linear, and sector probes taken at Yale-New Haven Hospital. Augmentation methods of random image rotation, time reversal of images, change of image ratio, and horizontal flip were used for the data. All recordings had been reduced to
resolution. A custom 3D CSNET model was used to classify the data. The authors compared pre-trained 3D ResNet and 3D DenseNet networks, but these did not perform better than their proposed model.
These studies demonstrate that the use of deep learning has a big potential in this area. The individual applications focused on the classification of the disease itself, the severity of the disease, or the classification of the pathology. In addition, there have been works that focused on localizing a given pathology in an image using poorly controlled learning or semantic segmentation, such as CLAHE contrast enhancement methods, frequency domain noise filtering, or image transformation into a polar representation. The most common augmentation methods were translation, rotation, horizontal inversion, or random contrast change.
Despite the widespread use of deep learning in lung ultrasound, researchers also attempt to use analytical methods. The reasons for that are several, such as the black box nature of the method, which may deter users. In addition, the individual steps of analytical methods are step-by-step explicable. Even if the end users will not completely understand what is being done, the algorithm at hand implements expert knowledge that was verbally formulated. This may improve the confidence of the user in the tool. Another reason for developing analytical methods is the lack of publicly available, representative, labeled datasets for machine learning. Our team is assembling a new, meticulously labeled collection of lung ultrasound videos to address this issue. Additionally, deployed deep learning models tend to be computationally heavier, and special computing hardware needs to be used when real-time processing is required. Although our team is creating deep learning models, we propose a lightweight algorithm that may be used with the devices available at our partner hospital, the Clinic of Thoracic Surgery of the University Hospital in Martin, Slovakia.
An example of a method that does not use deep learning is given by Brusasco et al., [
21], who utilized the k-means algorithm to segment pixels into two groups: those that contained B-lines and those that did not. This approach enabled the automated detection of B-lines within the images analyzed. Moshavegh et al. present a purely analytical method for real-time detection of B-lines in lung ultrasound in [
22]. Interestingly, their algorithm uses sequences of images instead of single images to detect B-lines. It is based on a series of transformations and filtering. The results showed that the algorithm could detect B-lines and separate healthy individuals from patients with pulmonary edema. Anantrasirichai et al. presented an algorithm for simultaneous line detection and deconvolution in [
23]. They evaluated the method in B-line detection and showed that their method outperformed other state-of-the-art methods it was compared to. First, lines were detected using, for example, Hough transform, and then the method filtered out lines of no clinical significance.
Table 1 lists selected articles described above. A thorough examination of recent advancements in LUS image interpretation can be found in [
24].
3. Dataset
In our first experiments, we used the freely available POCUS (point of care ultrasound) dataset, created by Born et al. [
16]. The dataset contains samples from patients with COVID-19, patients with bacterial pneumonia, viral pneumonia without COVID-19, and healthy individuals. Together, they collected 261 recordings, including 202 videos and 59 images recorded by convex and linear probes, from 216 patients. Of these patients, 57% were men, with a mean patient age of 41.3 years. The dataset contains clinical data donated by hospitals or academic ultrasound instructors, as well as LUS recordings published in other scientific literature, community platforms, open medical repositories, and medical technology companies. For our purposes, we only considered recordings labeled based on the presence or absence of A- and B-lines. Based on this information, we defined four classes.
Table 2 presents the number of examples for each. From these data, we only selected videos to reflect the dynamic nature of data encountered during an examination. We also focused on the possibility of using analytical methods for the real-time assessment of image data.
In addition to freely available data, we used footage recorded and labeled by doctors at the Department of Thoracic Surgery at the University Hospital in Martin, Slovakia. The data is not currently freely available. It contains footage from examination with linear ultrasound probes with the pleura, A-lines, and B-lines marked on relevant frames at periodic intervals by expert practitioners.
4. Research Contributions
We aimed to propose an analytical image analysis method that was able to detect artifacts in lung ultrasound frames and would support classification based on these results. We first prepared the data by preprocessing and augmenting them; we then implemented an analytical method using Fourier transform to detect lines, which we then used to classify videos.
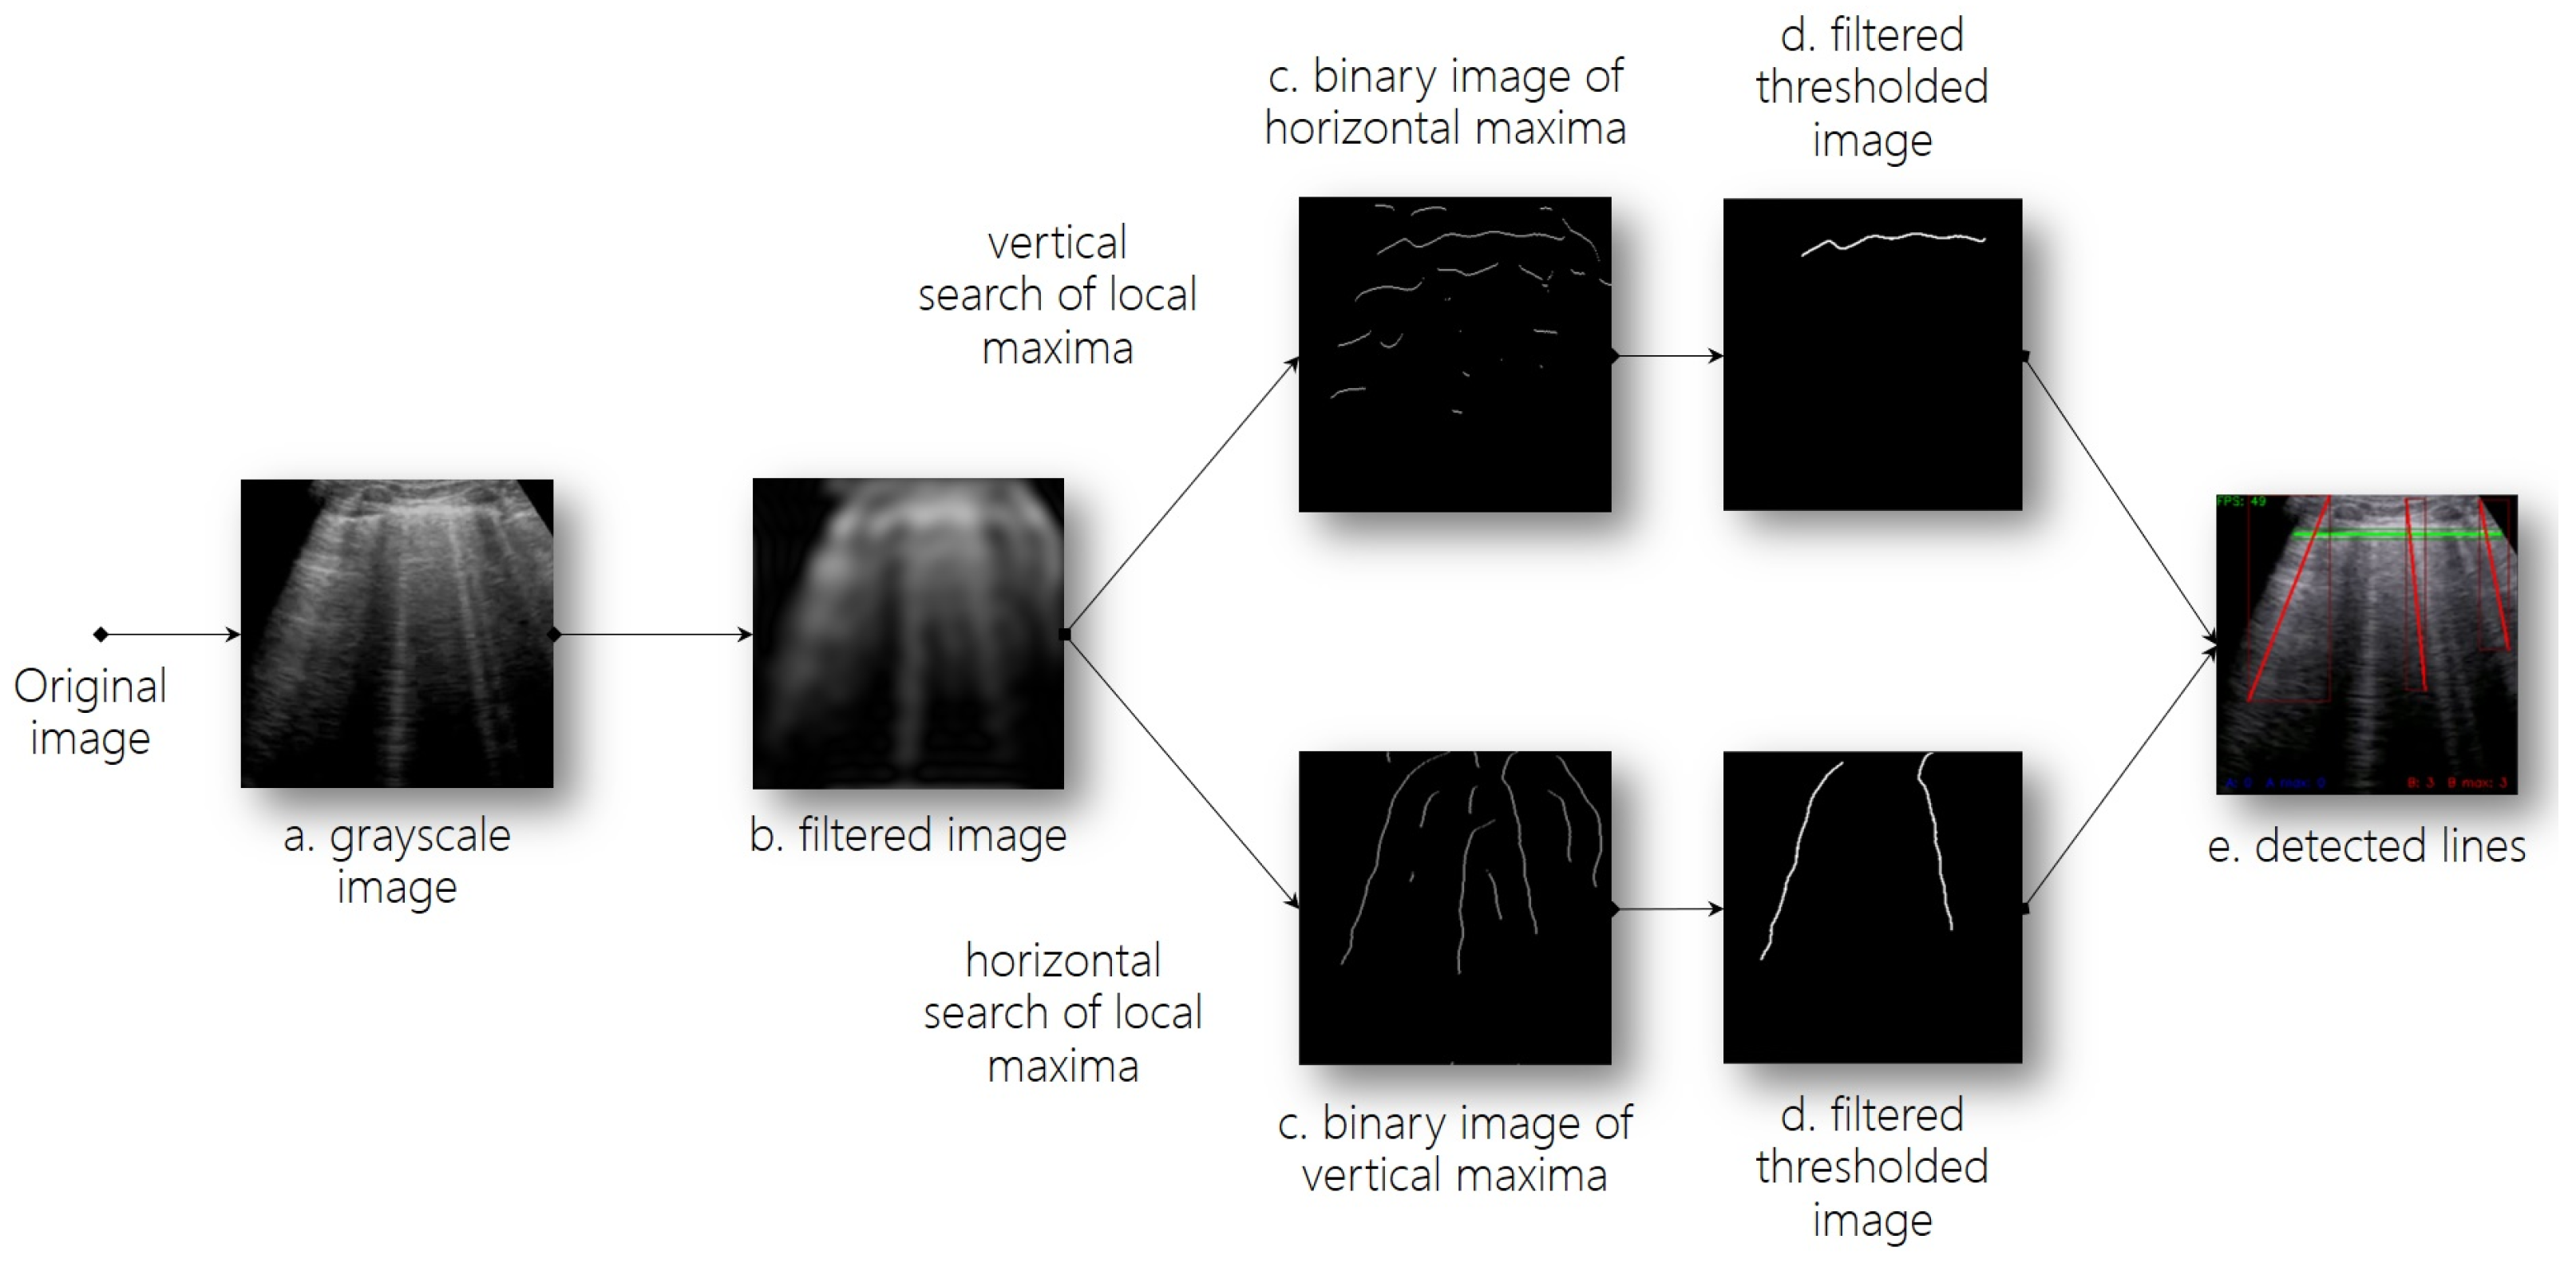
Figure 3 visualizes the entire line detection process.
4.1. Data Preprocessing
In order to transform images into a format that would better support A- and B-line detection, we carried out multiple steps of preprocessing, namely size reduction, information reduction, additive and impulsive noise suppression, and eliminating sudden changes in the signal. The steps were also used to ensure the algorithms’ ability to better deal with distorted images and noisy data, often present in LUS imaging. The video frames were reshaped into size
using bicubic interpolation, and we also mapped the original three-channel RGB image into a single grayscale channel, which resulted in information reduction (step
a in
Figure 3).
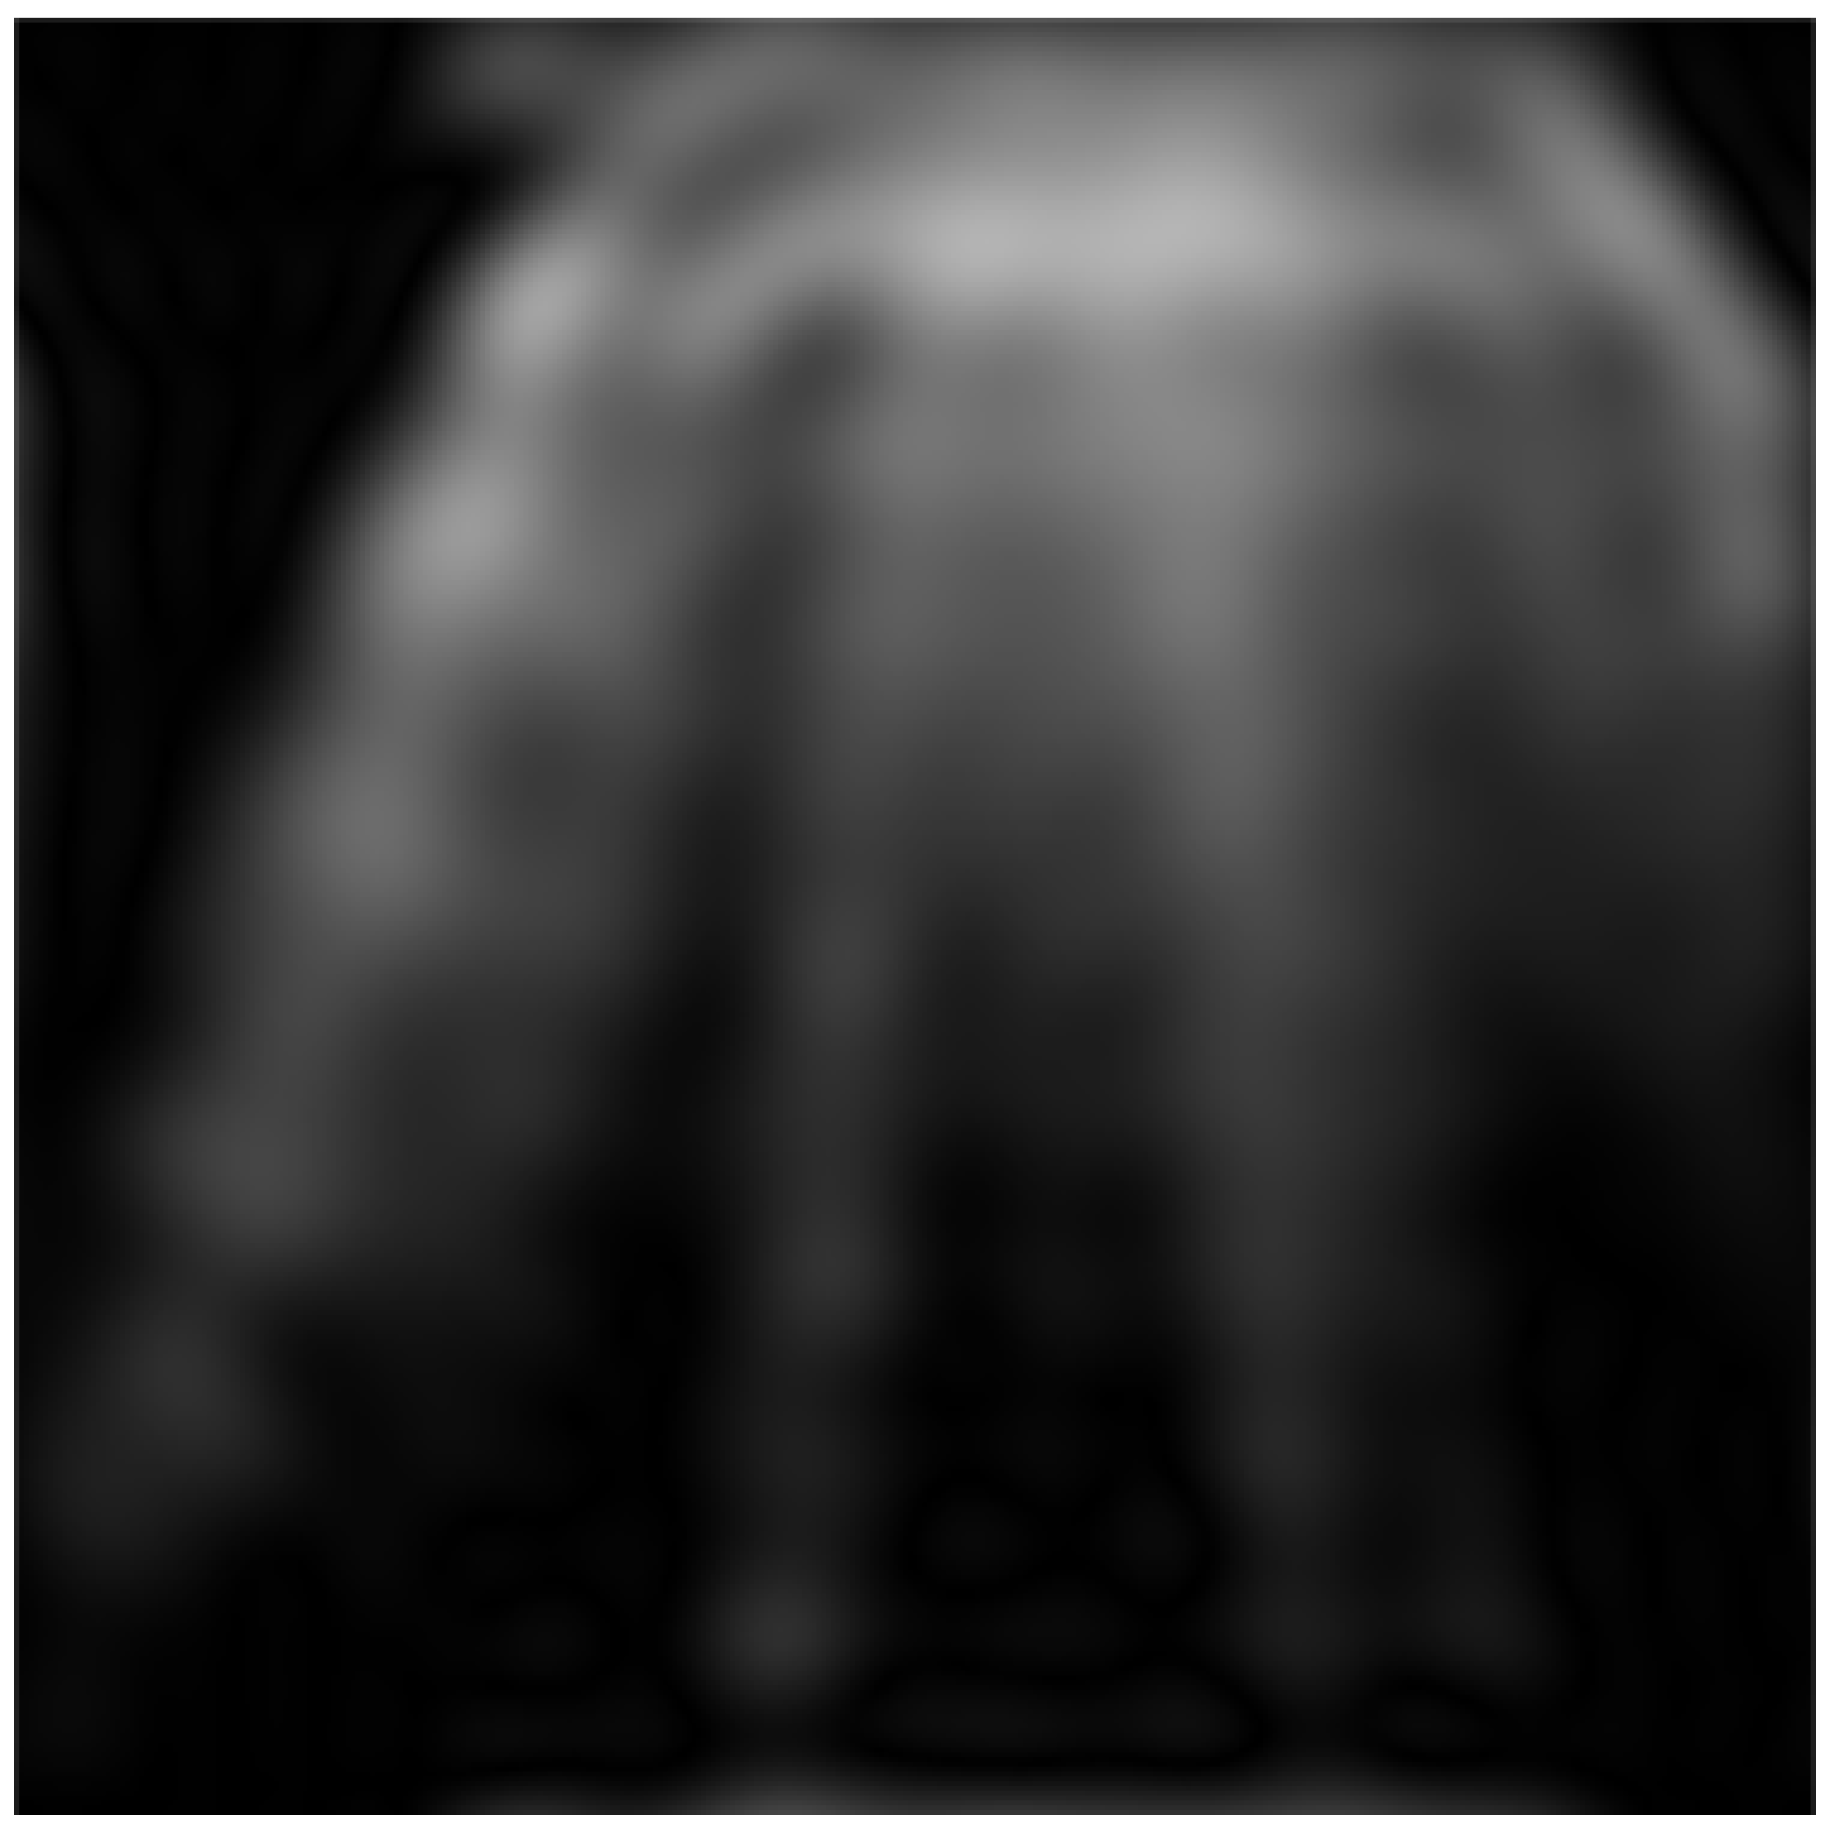
Two main methods for noise reduction were used, namely convolution with a Gaussian kernel and Fourier transform. There was no major difference in their outputs. However, Fourier transform is more efficient from a computational point of view; therefore, in order to support real-time processing, we opted for this alternative (step
b in
Figure 3)—using Fast Fourier Transform. It was used to monitor dominant frequencies and locate periodically recurring symptoms, which might potentially be artifacts relevant to making a diagnosis. The entire process of Fourier transform consisted of multiple steps:
transforming the grayscale image into the Fourier spectrum with direct Fourier transform;
shifting the middle of the Fourier spectrum into the middle of the image;
applying a rectangular low-pass filter of the selected size, which retains low frequencies and erases high frequencies since they also contain additive noise;
inverse shifting of the middle of the Fourier spectrum;
inverse Fourier transform of the spectrum onto the grayscale image.
Figure 4 shows an example of the preprocessed image.
4.2. Line Detection
A- and B-line detection in LUS image data is essentially about line detection, for which multiple methods are available. One commonly used technique is the Hough transform, which is particularly effective in detecting straight lines. However, this is not true in our image data, especially for A-lines, which appear curved when using a convex ultrasound probe. Another alternative is convolutional neural networks; however, these methods have high computational complexity and are, therefore, not usable for real-time processing. Additionally, they require a significant amount of training data, which might not be available for our purposes.
Our proposed approach for detecting A- and B-lines in lung USG image data involves searching the image both horizontally and vertically for local maxima. This method is efficient in terms of computation and can be used for real-time processing, as it does not require training since it is purely analytical. In comparison to the Hough transform, it is also able to deal with curved lines. A vertical search is used to detect horizontal maxima (for A-line detection), and a horizontal search is used to detect vertical maxima (for B-line detection). By connecting the local maxima, we acquired candidate lines (step
c in
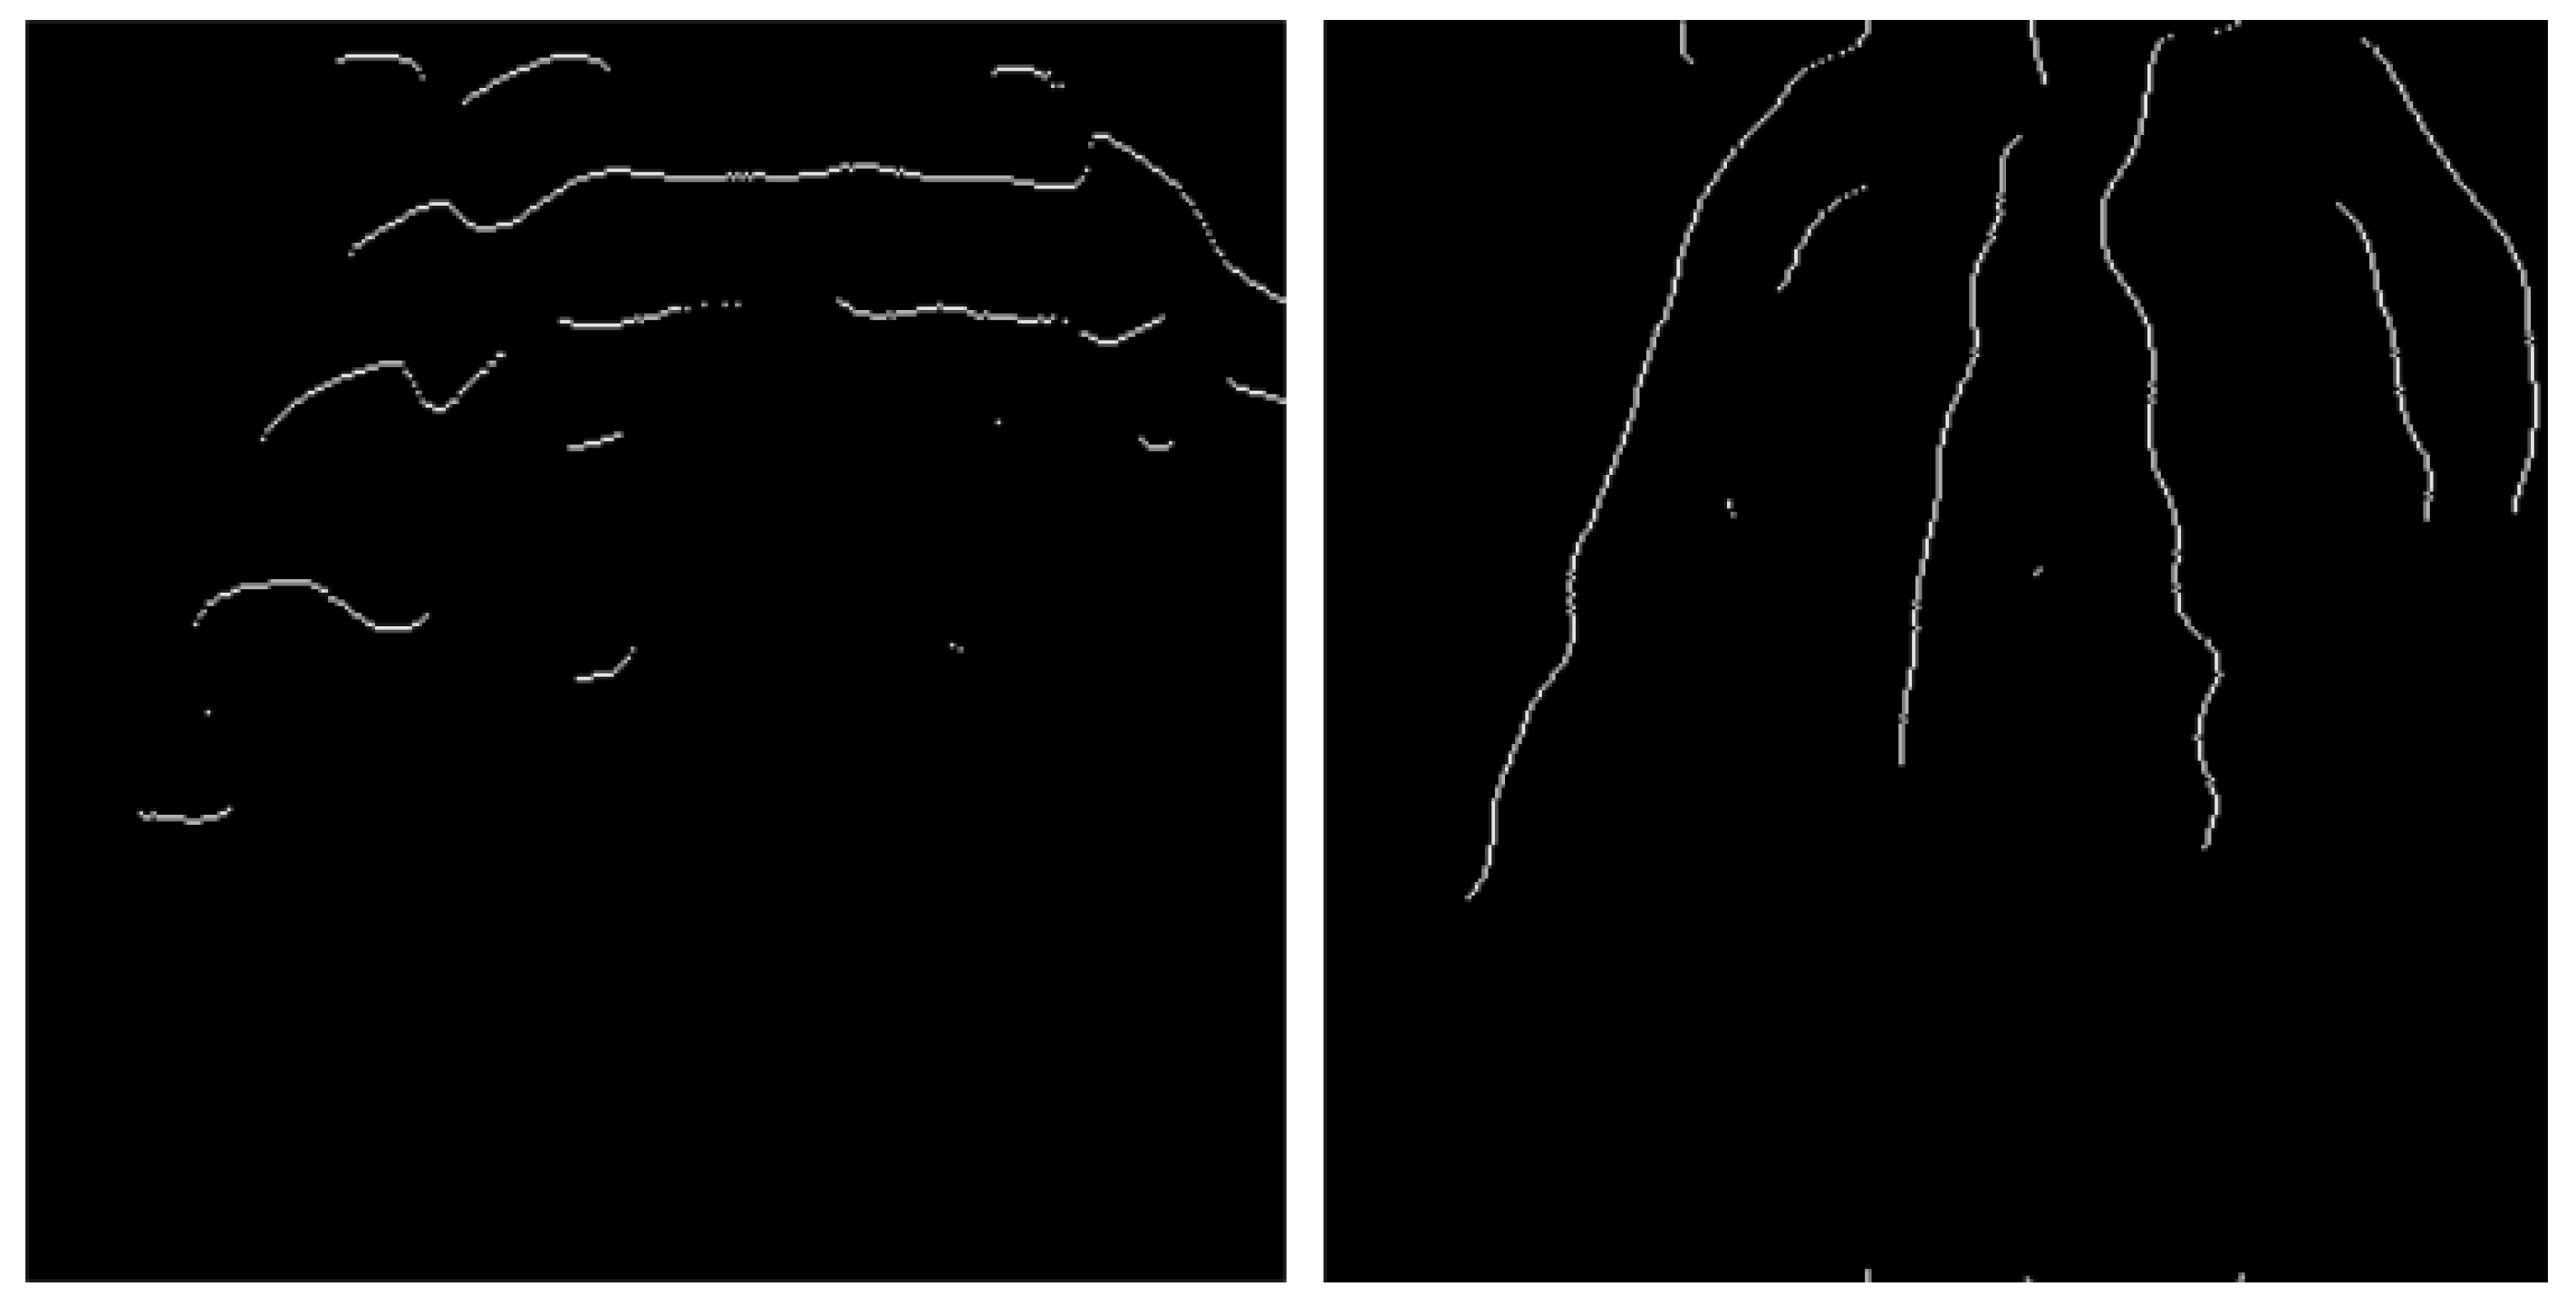
Figure 3), which were further evaluated and identified as relevant artifacts or noise. We generated two independent binary image plains, which were used for respective artifact types. This generated image had a black background and white candidate lines; see
Figure 5.
As illustrated in
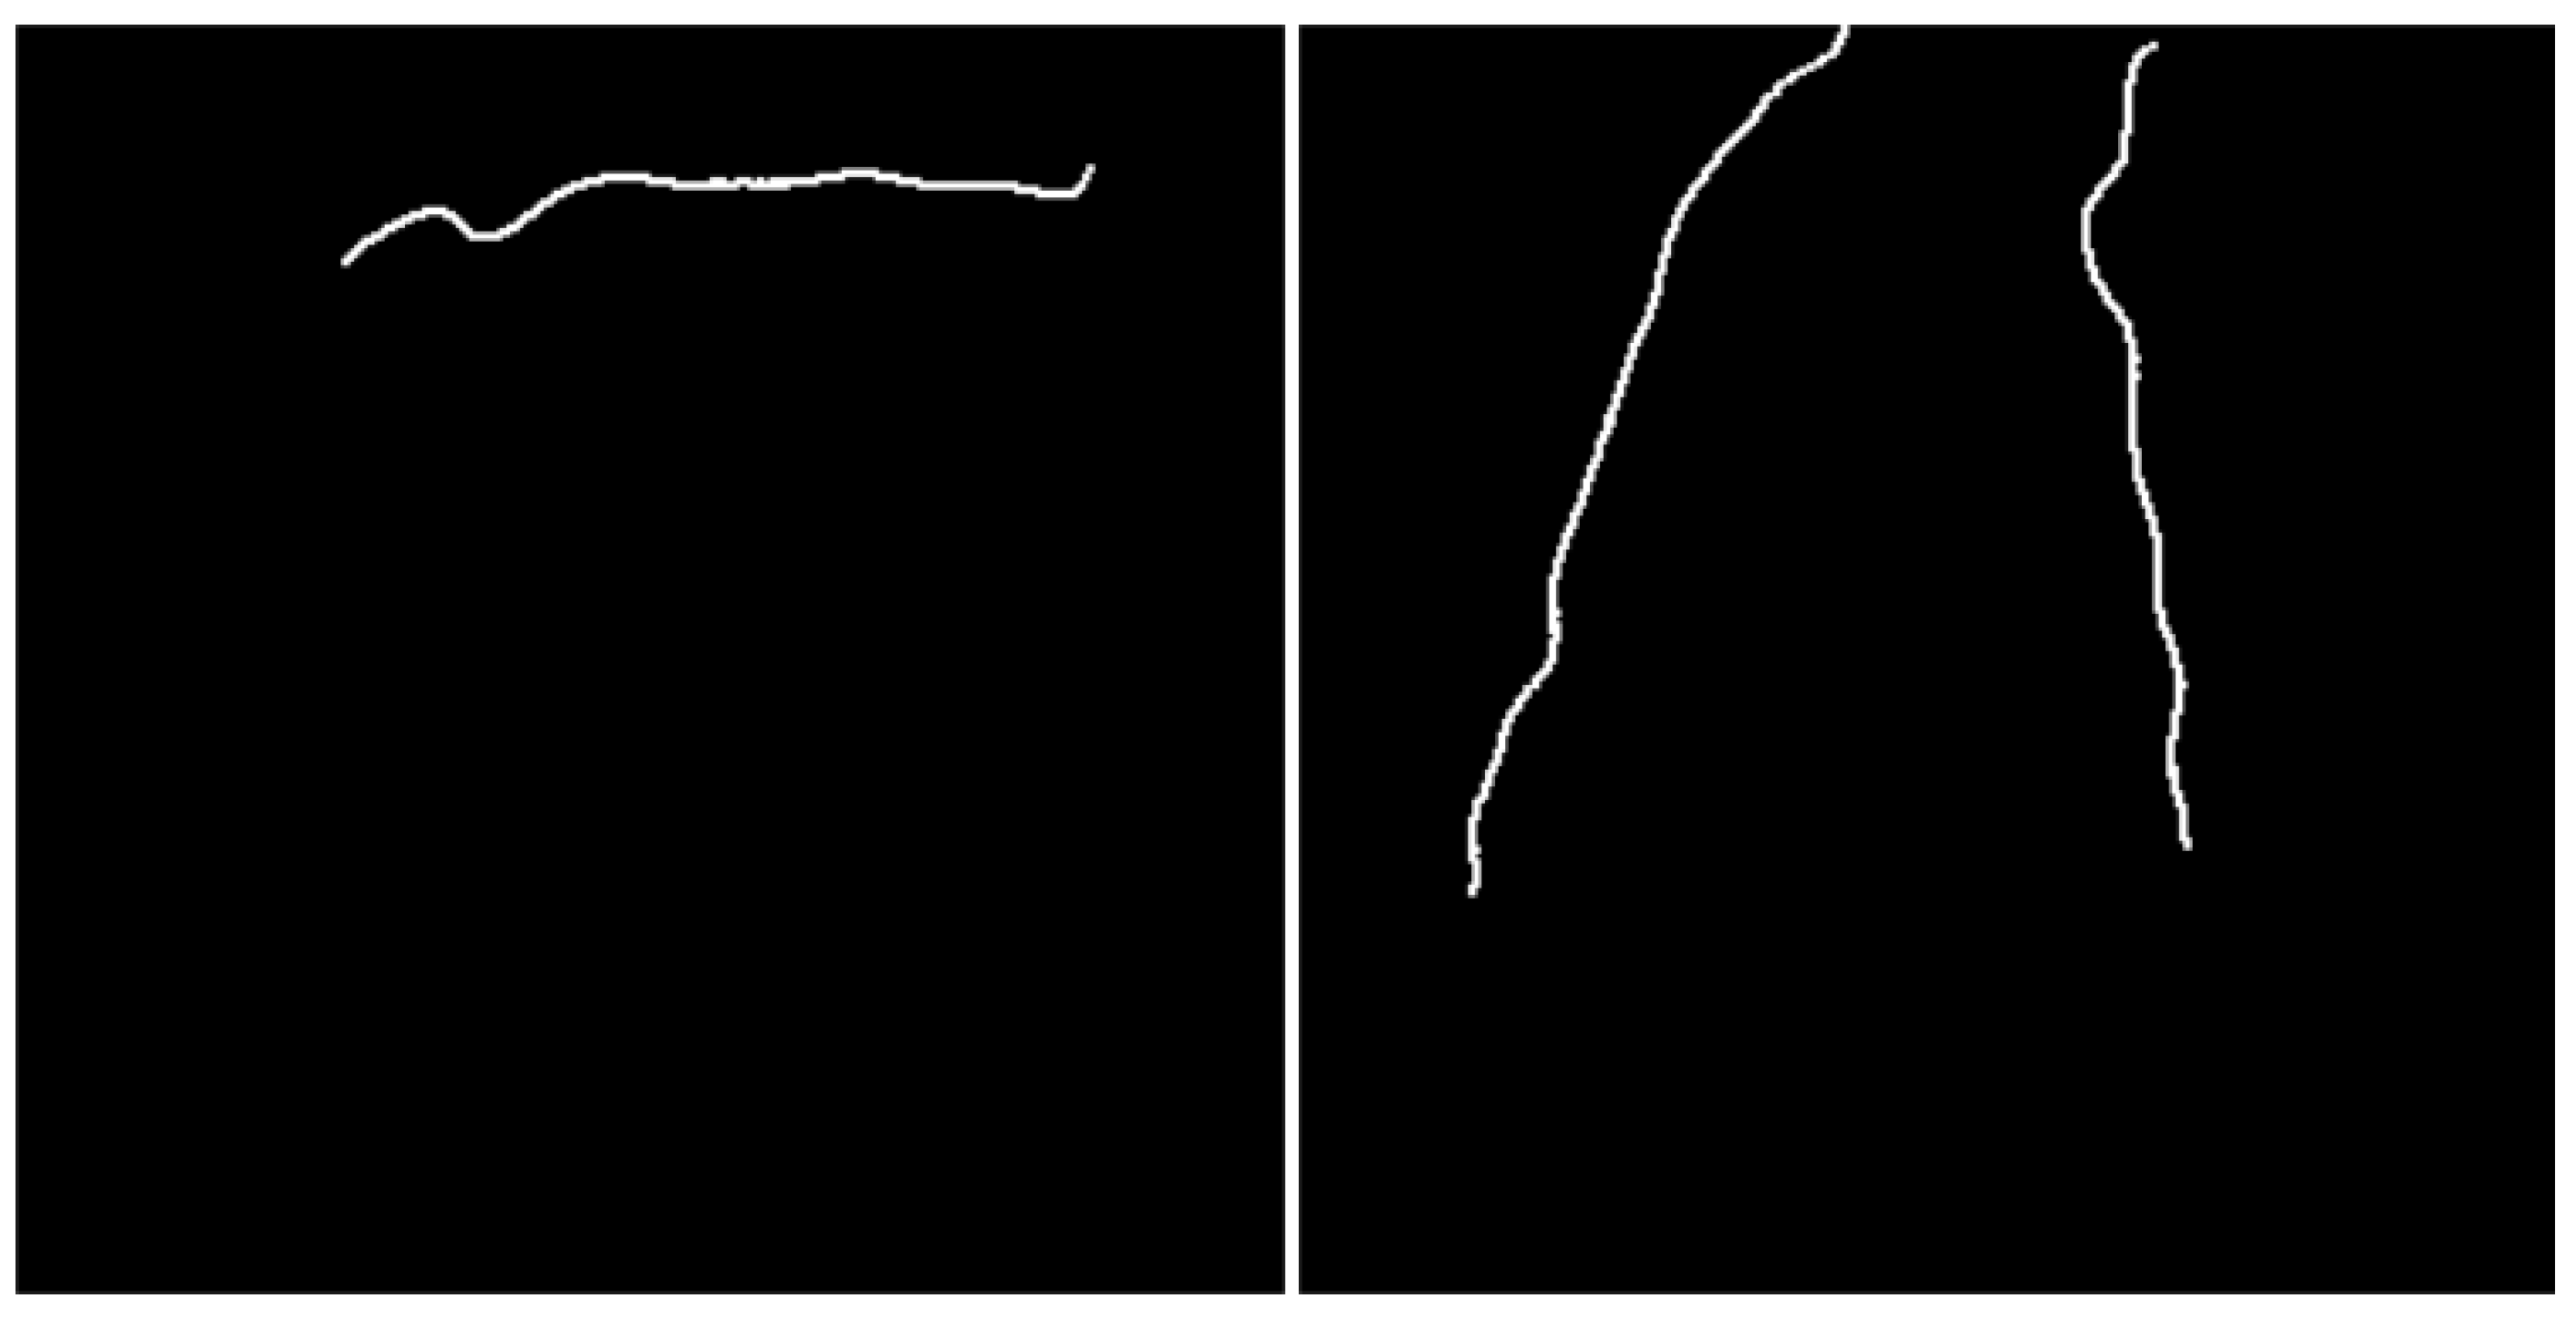
Figure 5, a substantial quantity of disconnected pixels and lines were present. These interruptions were rectified by utilizing morphological dilation. Subsequently, the candidate lines were segregated, and invalid candidates were eliminated through the utilization of a contour search and a high-pass filter based on the contents of the selected contour (step
d in
Figure 3). The filtered lines, corresponding to the state depicted in
Figure 5, are depicted in
Figure 6. Line filtering is defined by parameters such as dilation kernel size, minimum line length, the minimum distance between lines, and minimum angle distance for B-lines. These parameters are fully adjustable to account for differences between imaging using various ultrasound probes and settings.
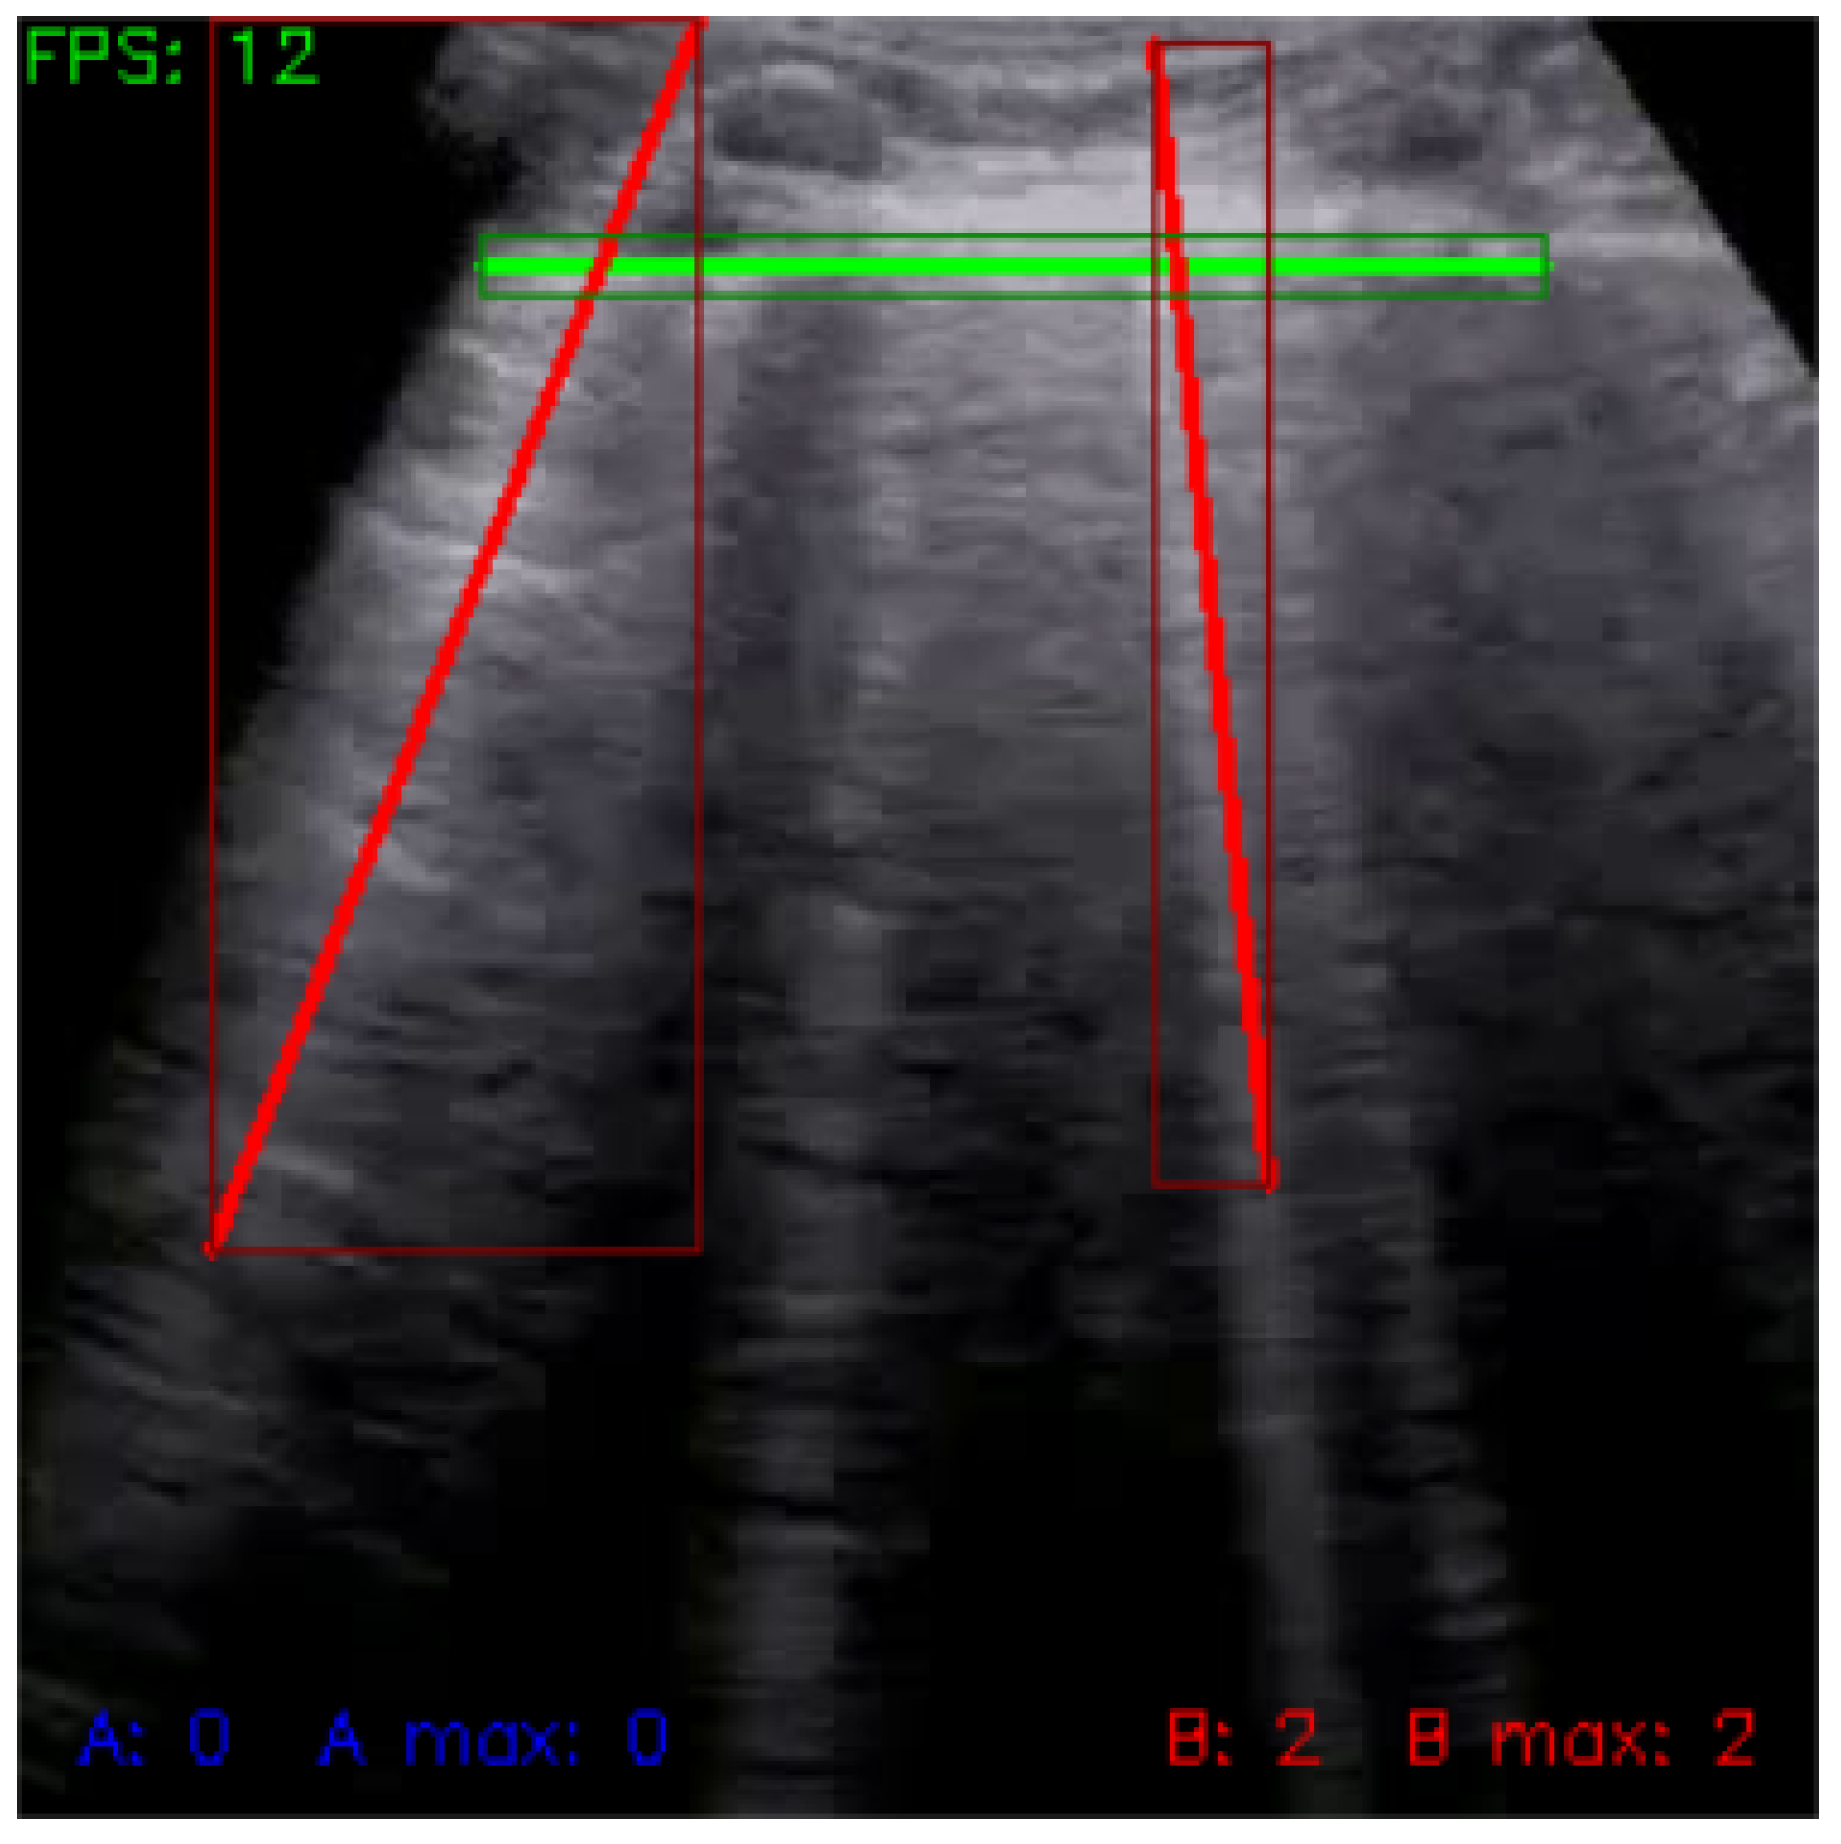
In the last step of line detection, we transformed the detected lines into vectors (step
e in
Figure 3). Horizontal A-lines were transformed into a constant function (Equation (
1)), vertical B-lines were transformed into a linear function (Equation (
2)), while tangent
a and constant
were determined using least square approximation. Each detected line was then saved as two points (starting and ending) with
x and
y coordinates on the image.
Figure 7 shows a sample of the final output of line detection.
The described line detection method was used independently for each video frame. However, to apply this detection result to the entire video and to stabilize detection, we used buffering, which made it easier for the user to see which lines were detected by the algorithm. For visualization, we aggregated the calculated coordinates of detected lines from each frame and visualized their average position on neighboring frames, resulting in a more stable and easier-to-follow visualization with minimum oscillation of lines and their position. We stored the detected lines in a temporary memory, cleared after a set number of frames. The bigger the buffer, the longer the lines were maintained in the memory, and the smaller the amount of oscillation between frames. For both line types, we defined separate buffers with specific functionality.
We also saved the largest number of lines detected on a single frame throughout the entire video, the accumulated number of detected lines, and the result of high-pass filtering based on the length of the newly added lines. For the buffer of horizontal lines, we defined an additional functionality, namely detecting the pleura, which was considered the uppermost horizontal line detected in the upper half of the frame. We also used high-pass filtering based on the distance between detected horizontal lines since the distance between A-lines must be constant and equal to the distance between the top of the frame and the pleura line. The buffer for vertical lines contains a high-pass filter based on the angle difference between the line and the horizontal axis.
4.3. Data Analysis
Before video classification, we processed line detection results over individual frames by calculating statistical metrics based on accumulated values from buffers.
We defined five metrics that have a significant impact on classification:
average number of A-lines per frame:
where
n is the number of frames, and
is the number of A-lines identified in frame
t (as stored in the buffer);
maximum number of A-lines on a single frame:
average number of B-lines per frame:
maximum number of B-lines on a single frame:
the ratio of A- and B-lines:
4.4. Classification
For video classification, we created a configurable set of IF–THEN heuristic rules based on results over selected videos from the dataset. The rules were stored in a knowledge base as JSON structures. Classification results were stored in JSON files for more straightforward evaluation. The classification was done into three classes, and each video was evaluated independently for the presence of A- and B-lines.
Table 3 shows classification results of each class.
For classification, the following rules were used:
if the maximum number of A-lines and B-lines is smaller than
and
, these being adjustable threshold parameters, then the video is of class X:
if the ratio of A- and B-lines is bigger than
, the average number of B-lines per frame is smaller than
, and the maximum number of B-lines on a frame is smaller than
, the video is of class A; threshold values are adjustable:
any other video is considered to belong to class B:
5. Results
The proposed analytical approach was first evaluated on videos from the POCUS dataset. We then evaluated the method’s ability to support segmentation on data labeled by doctors and identified some shortcomings with regard to detecting A-lines. To address this issue, we trained a neural network to detect the pleura to support further analytical processing of the frames.
5.1. Video Classification Using Fourier Transform
In our first set of experiments, we evaluated the accuracy of the proposed approach based on a Fourier transform for video classification, as described in the previous section. The Fourier spectrum cutout had a size of , the minimum height of maxima was set to 50, the minimum contour area was 100, the dilation kernel had a size of , we used a buffer of 10, and a minimum distance between lines of 30 for both A- and B-lines. For A-lines, the minimum line length was set to 100, and the pleura could only be detected in the upper half of the image. For B-lines, the minimum line length was set to 150 with a minimum angle difference of 0.085.
For the classification heuristic rules, we set and to 2, to 0.5, to 1.5 and to 3. These values were determined using experimental evaluation but must be adjusted based on the specific characteristics of the available data to account for variability, such as using a convex or linear probe. However, the parameter optimization process can be automated using standard methods.
We employed three metrics to evaluate the classification outcome: accuracy, balanced accuracy, and a confusion matrix. We conducted tests on a subset of 17 videos from the dataset, comprising five videos displaying A-lines, nine videos displaying B-lines, and three videos displaying neither. Our experiments yielded an accuracy of 76.471%, and a balanced accuracy of 60%.
The confusion matrix is shown in
Table 3, where we can see that 13 videos were classified correctly. From videos with no artifacts, two were classified as having B-lines and one as having A-lines. However, by further examining the videos, we found that in all cases, there were signs of B-lines existing, but human experts considered the videos unsuitable for classification due to the amount of noise.
A key indicator of the analytical approach’s success is its ability to process videos in real-time. During our experiments, we achieved a frequency of at least 12 FPS on various commercially available mid-range computers, pointing at the accessibility of our solution in everyday use with no dedicated hardware required.
5.2. Segmentation Using Fourier Transform
The same approach based on the Fourier transform was evaluated for segmentation on real-life data labeled by doctors from the Department of Thoracic Surgery at the University Hospital in Martin. Compared to the video frames from the POCUS dataset, the hospital recordings were made with a linear ultrasound probe. Besides video classification for the presence of A-, and B-lines, doctors marked regions for pleura, A- and B-lines on approximately every tenth relevant frame. For the remaining frames, the position of these artifacts was generated using interpolation.
We then evaluated segmentation accuracy with a Fourier spectrum cutout set to . For A-lines, the peak height was set to 50, the minimum contour area was 100, and a kernel size of was chosen. For the buffer, the minimum distance between lines was 50 with a minimum line length of 150, a buffer size of 5, and the pleura could be detected in the range of 0 to 400. For B-lines, the peak height was 10, the minimum contour area 200, and a kernel was used. The minimum distance between lines was set to 20 with a minimum line length of 200, a minimum angle difference of 1, and a buffer size of 2. The configuration was determined based on experimental validation.
The Intersection over Union (IoU) metric is commonly employed to evaluate the precision of segmentation. However, our dataset marked artifacts with polygons and our approach generated lines. Therefore, we defined the line width for the generated masks as ten and calculated the ratio of the intersection between the ground truth and the predicted mask to the size of the predicted mask. If this value was higher than 0.5, we considered the segmentation correct. If the ground truth mask did not contain any lines, and our approach detected no line, the frame was considered a true negative example. If any line was detected, but there was no artifact in the mask, we considered it to be a false positive result. If there was an artifact in the mask, but no line was detected, we considered it a false negative.
The segmentation was evaluated along multiple standard metrics: accuracy and balanced accuracy, F1 score, recall and precision, specificity, and negative predictive value. For A-line segmentation, we used 19 videos and used 17 videos with B-lines. The confusion matrix for A-lines is shown in
Table 4. The confusion matrix for B-lines is shown in
Table 5. The overall results are shown in
Table 6.
The experimental evaluation clearly showed that the parameter configuration depends on the data structure, as ascertained by the difference of the parameters for data from convex and linear probes. In addition, the approach performs better for detecting vertical lines than horizontal lines.
For A-lines, the approach achieved high precision, meaning that once an A-line was detected by our method, there was a strong positive predictive value. However, recall remained low, which suggests that only a small amount of real A-lines were identified correctly. Despite this, the more balanced F1 score was 0.389, while accuracy remained low. Overall, the proposed method could not successfully identify and locate horizontal lines in real-life data, and further research is required in this field.
Figure 8 shows an example of A-line segmentation.
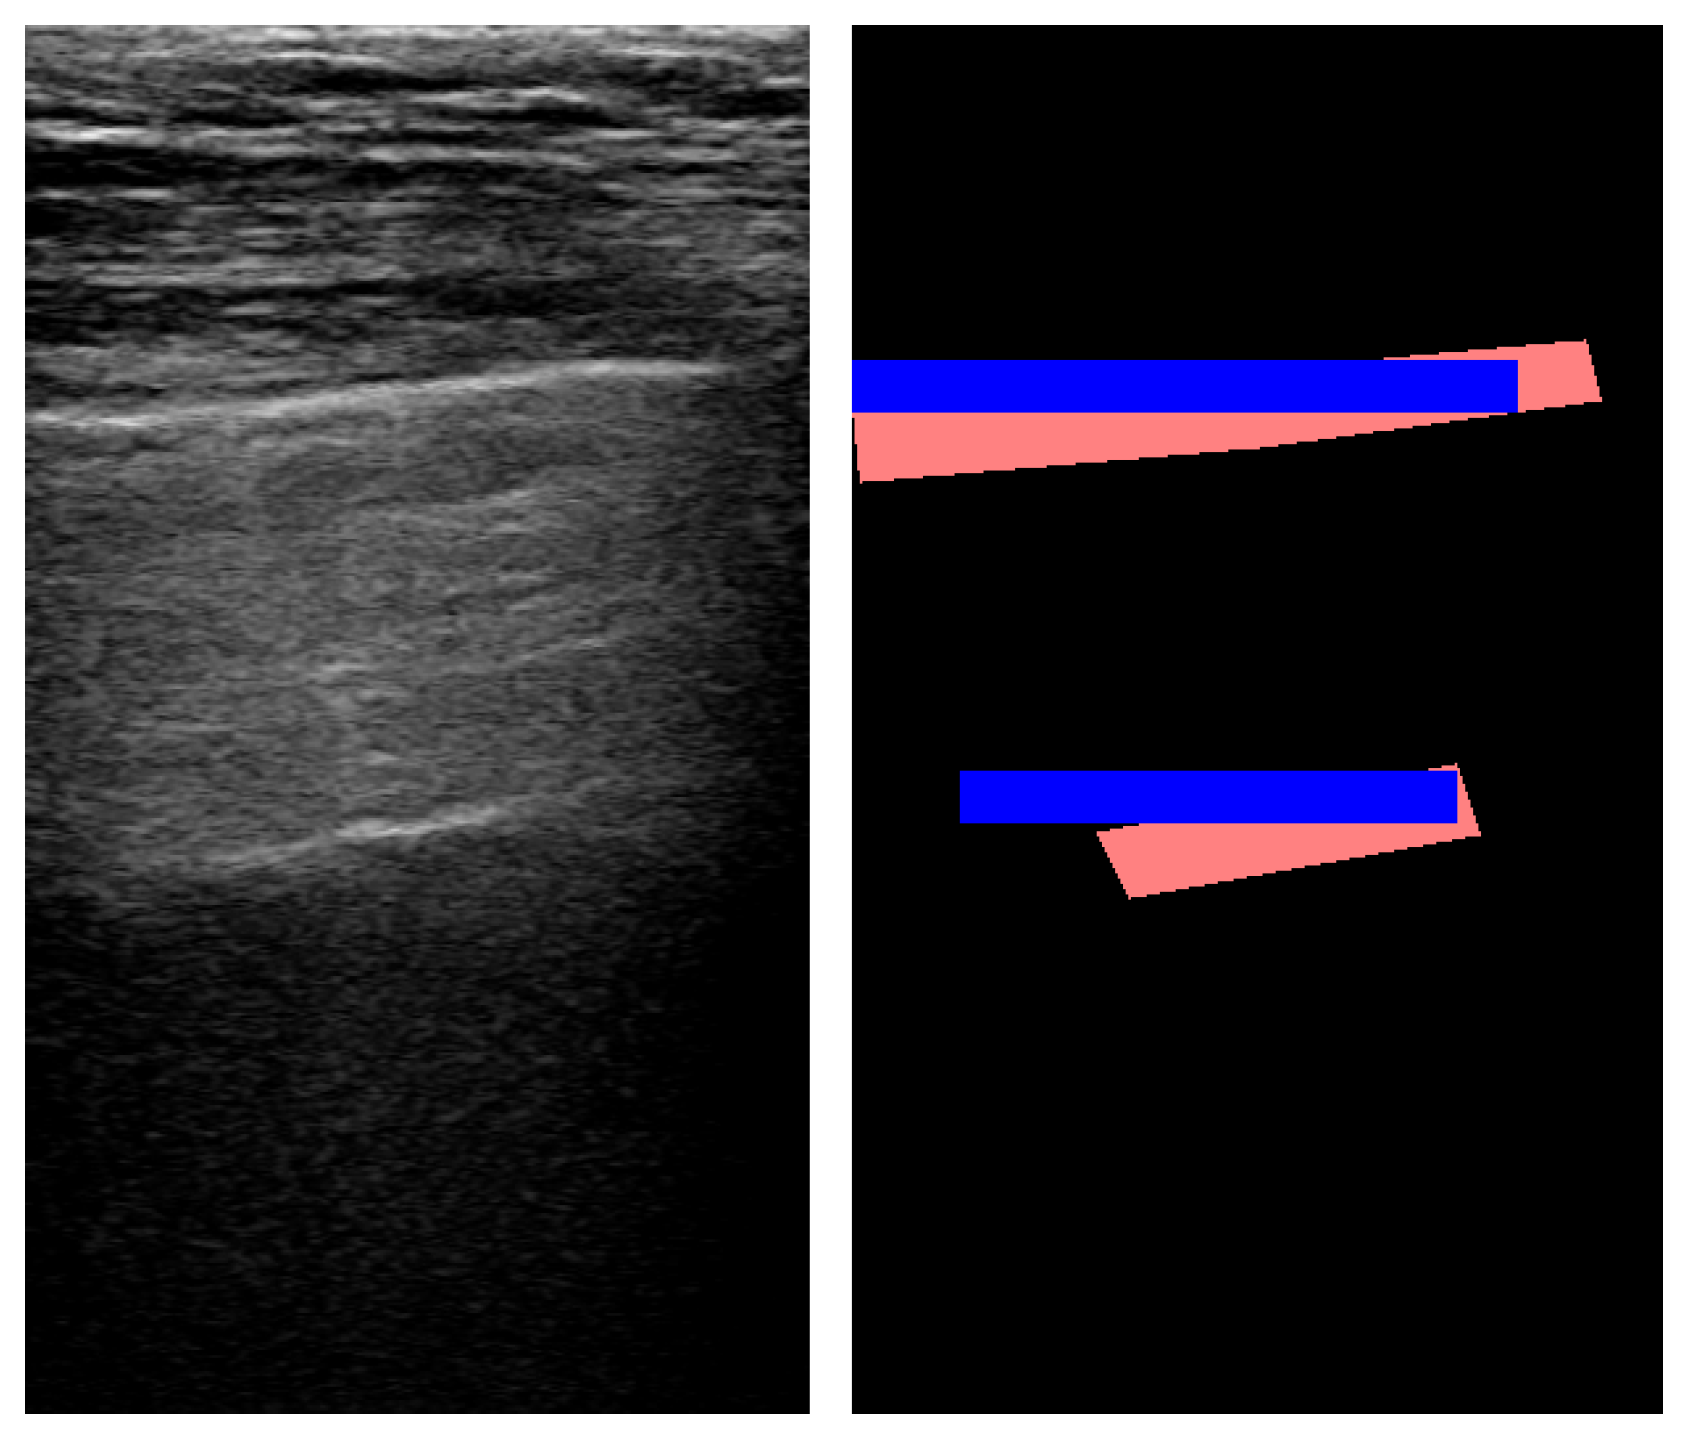
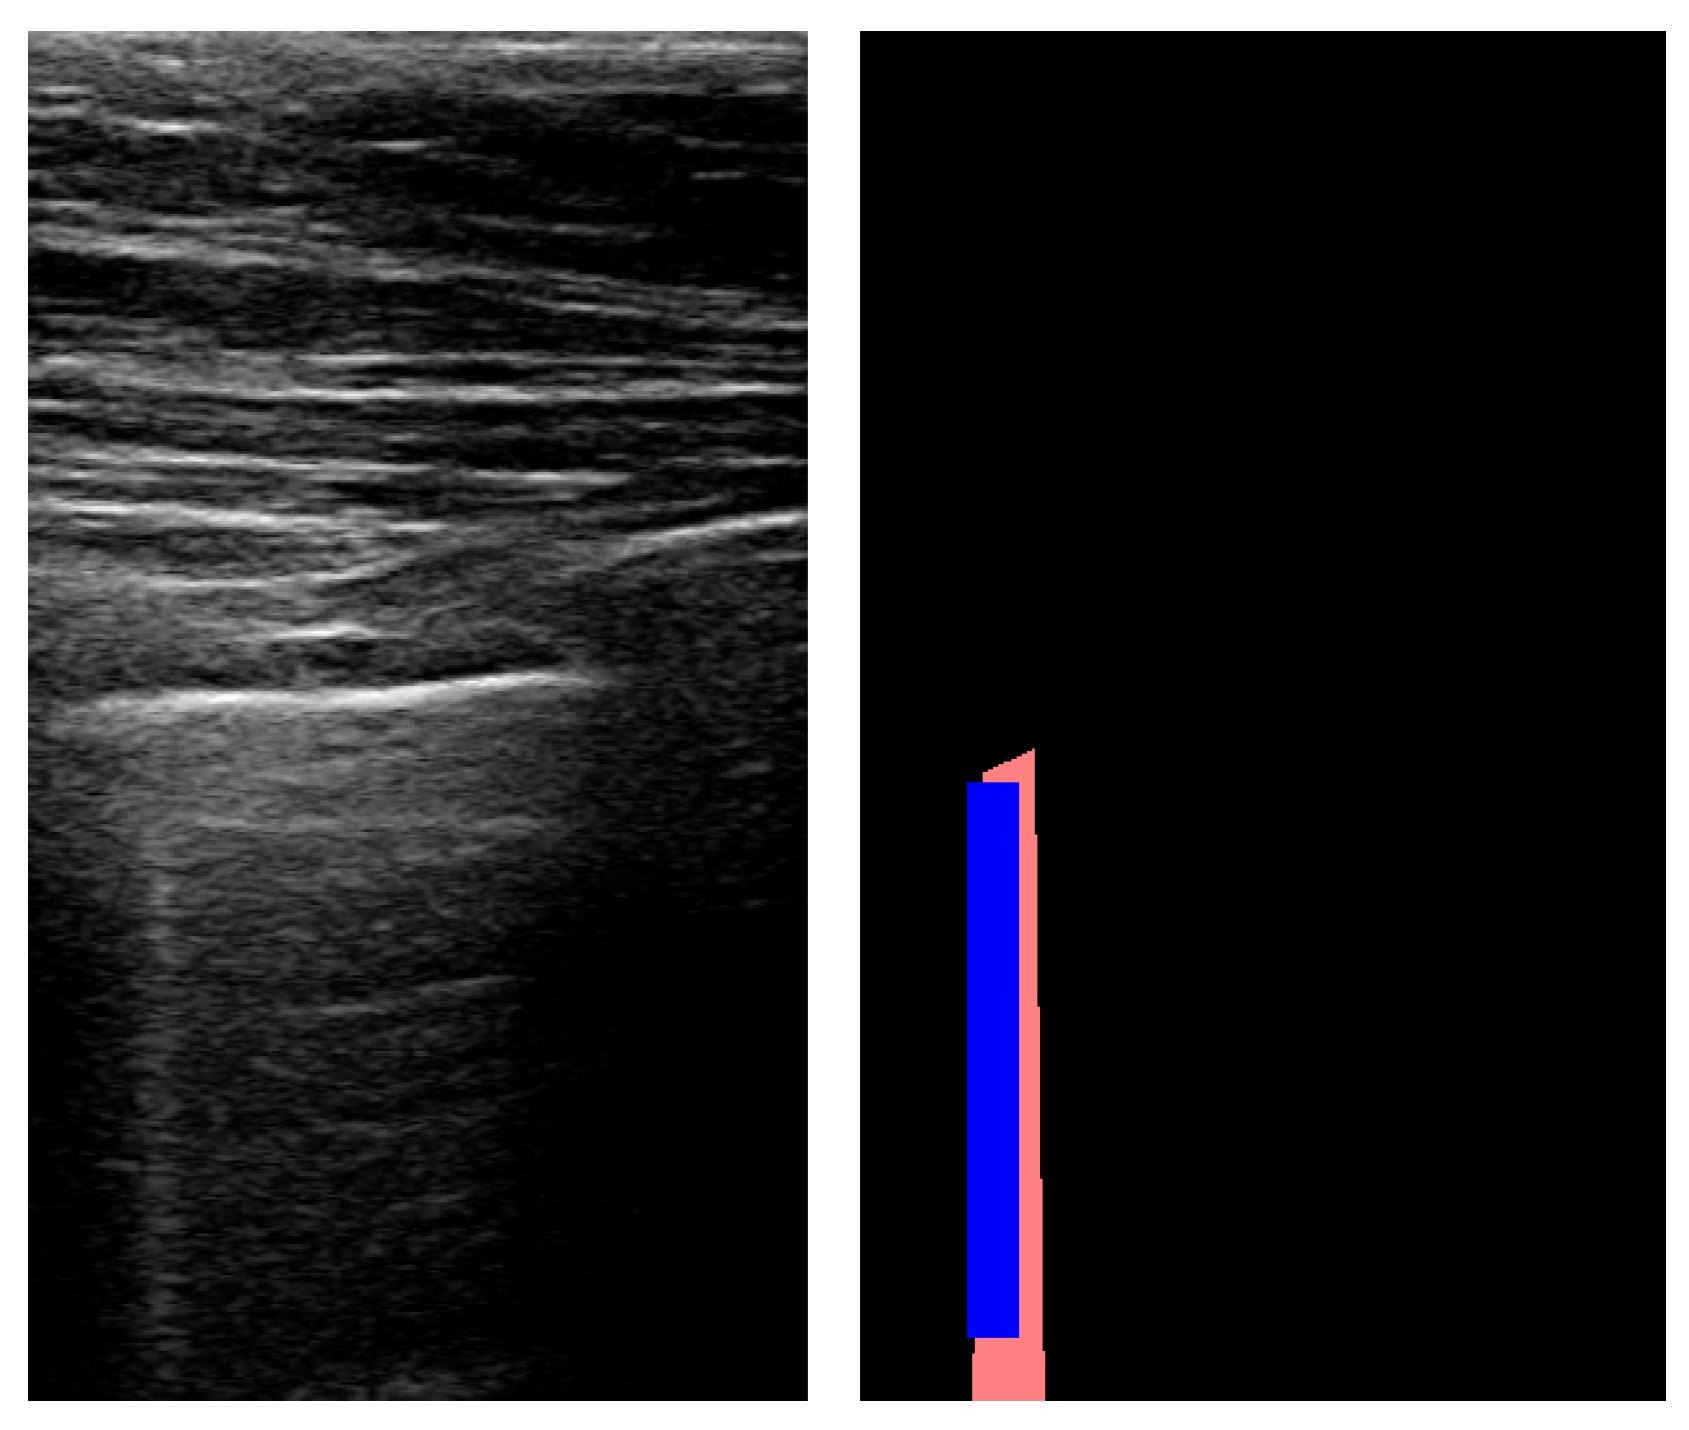
The method reached a high accuracy for detecting B-lines with an 88.8% success rate. While recall remained at a level comparable to A-lines, precision was also low for B-lines, resulting in an F1 score of 0.257. However, specificity was high due to the imbalanced nature of the data: B-lines were detectable only on a small number of frames. An example of B-line segmentation is shown in
Figure 9.
5.3. Pleura Detection
To address the proposed method’s inability to detect A-lines correctly, we propose a hybrid two-step solution, where the pleura (the uppermost horizontal line in the image) is detected using a neural network, and A-lines are then detected analytically. This can be done thanks to the distance between horizontal lines being constant and equal to the distance between the top of the frame and the pleura. A computational speedup compared to a solution using a neural network solely can be achieved by only periodically using the neural network to update the pleura’s position since it will not be subject to change for every single frame. This way, real-time processing can still be possible without specific hardware supporting robust neural network models.
To test the accuracy of neural network-based segmentation for pleura detection, we trained multiple networks using real-life data labeled by doctors. We used transfer learning when training our models, which were all based on TransUNet [
25]. We trained for 20 epochs in all experiments and considered the model with the smallest validation loss. We trained three models:
Model 1 was trained on frames that were only cropped from the original videos into the same image size. We used Dice loss for training.
Model 2 was trained on the same data as Model 1, but used a combination of Dice loss and crossentropy.
Model 3 was trained on data cropped only to the relevant parts of the frame (showing only USG frames). We also evaluated the effect of different loss functions on the accuracy, achieving the best results with Dice loss.
To evaluate the success of segmentation, we used a metric analogous to the one used for Fourier transform. We also considered the accuracy with different intersection levels between the predicted and true masks. Results are summarized in
Table 7.
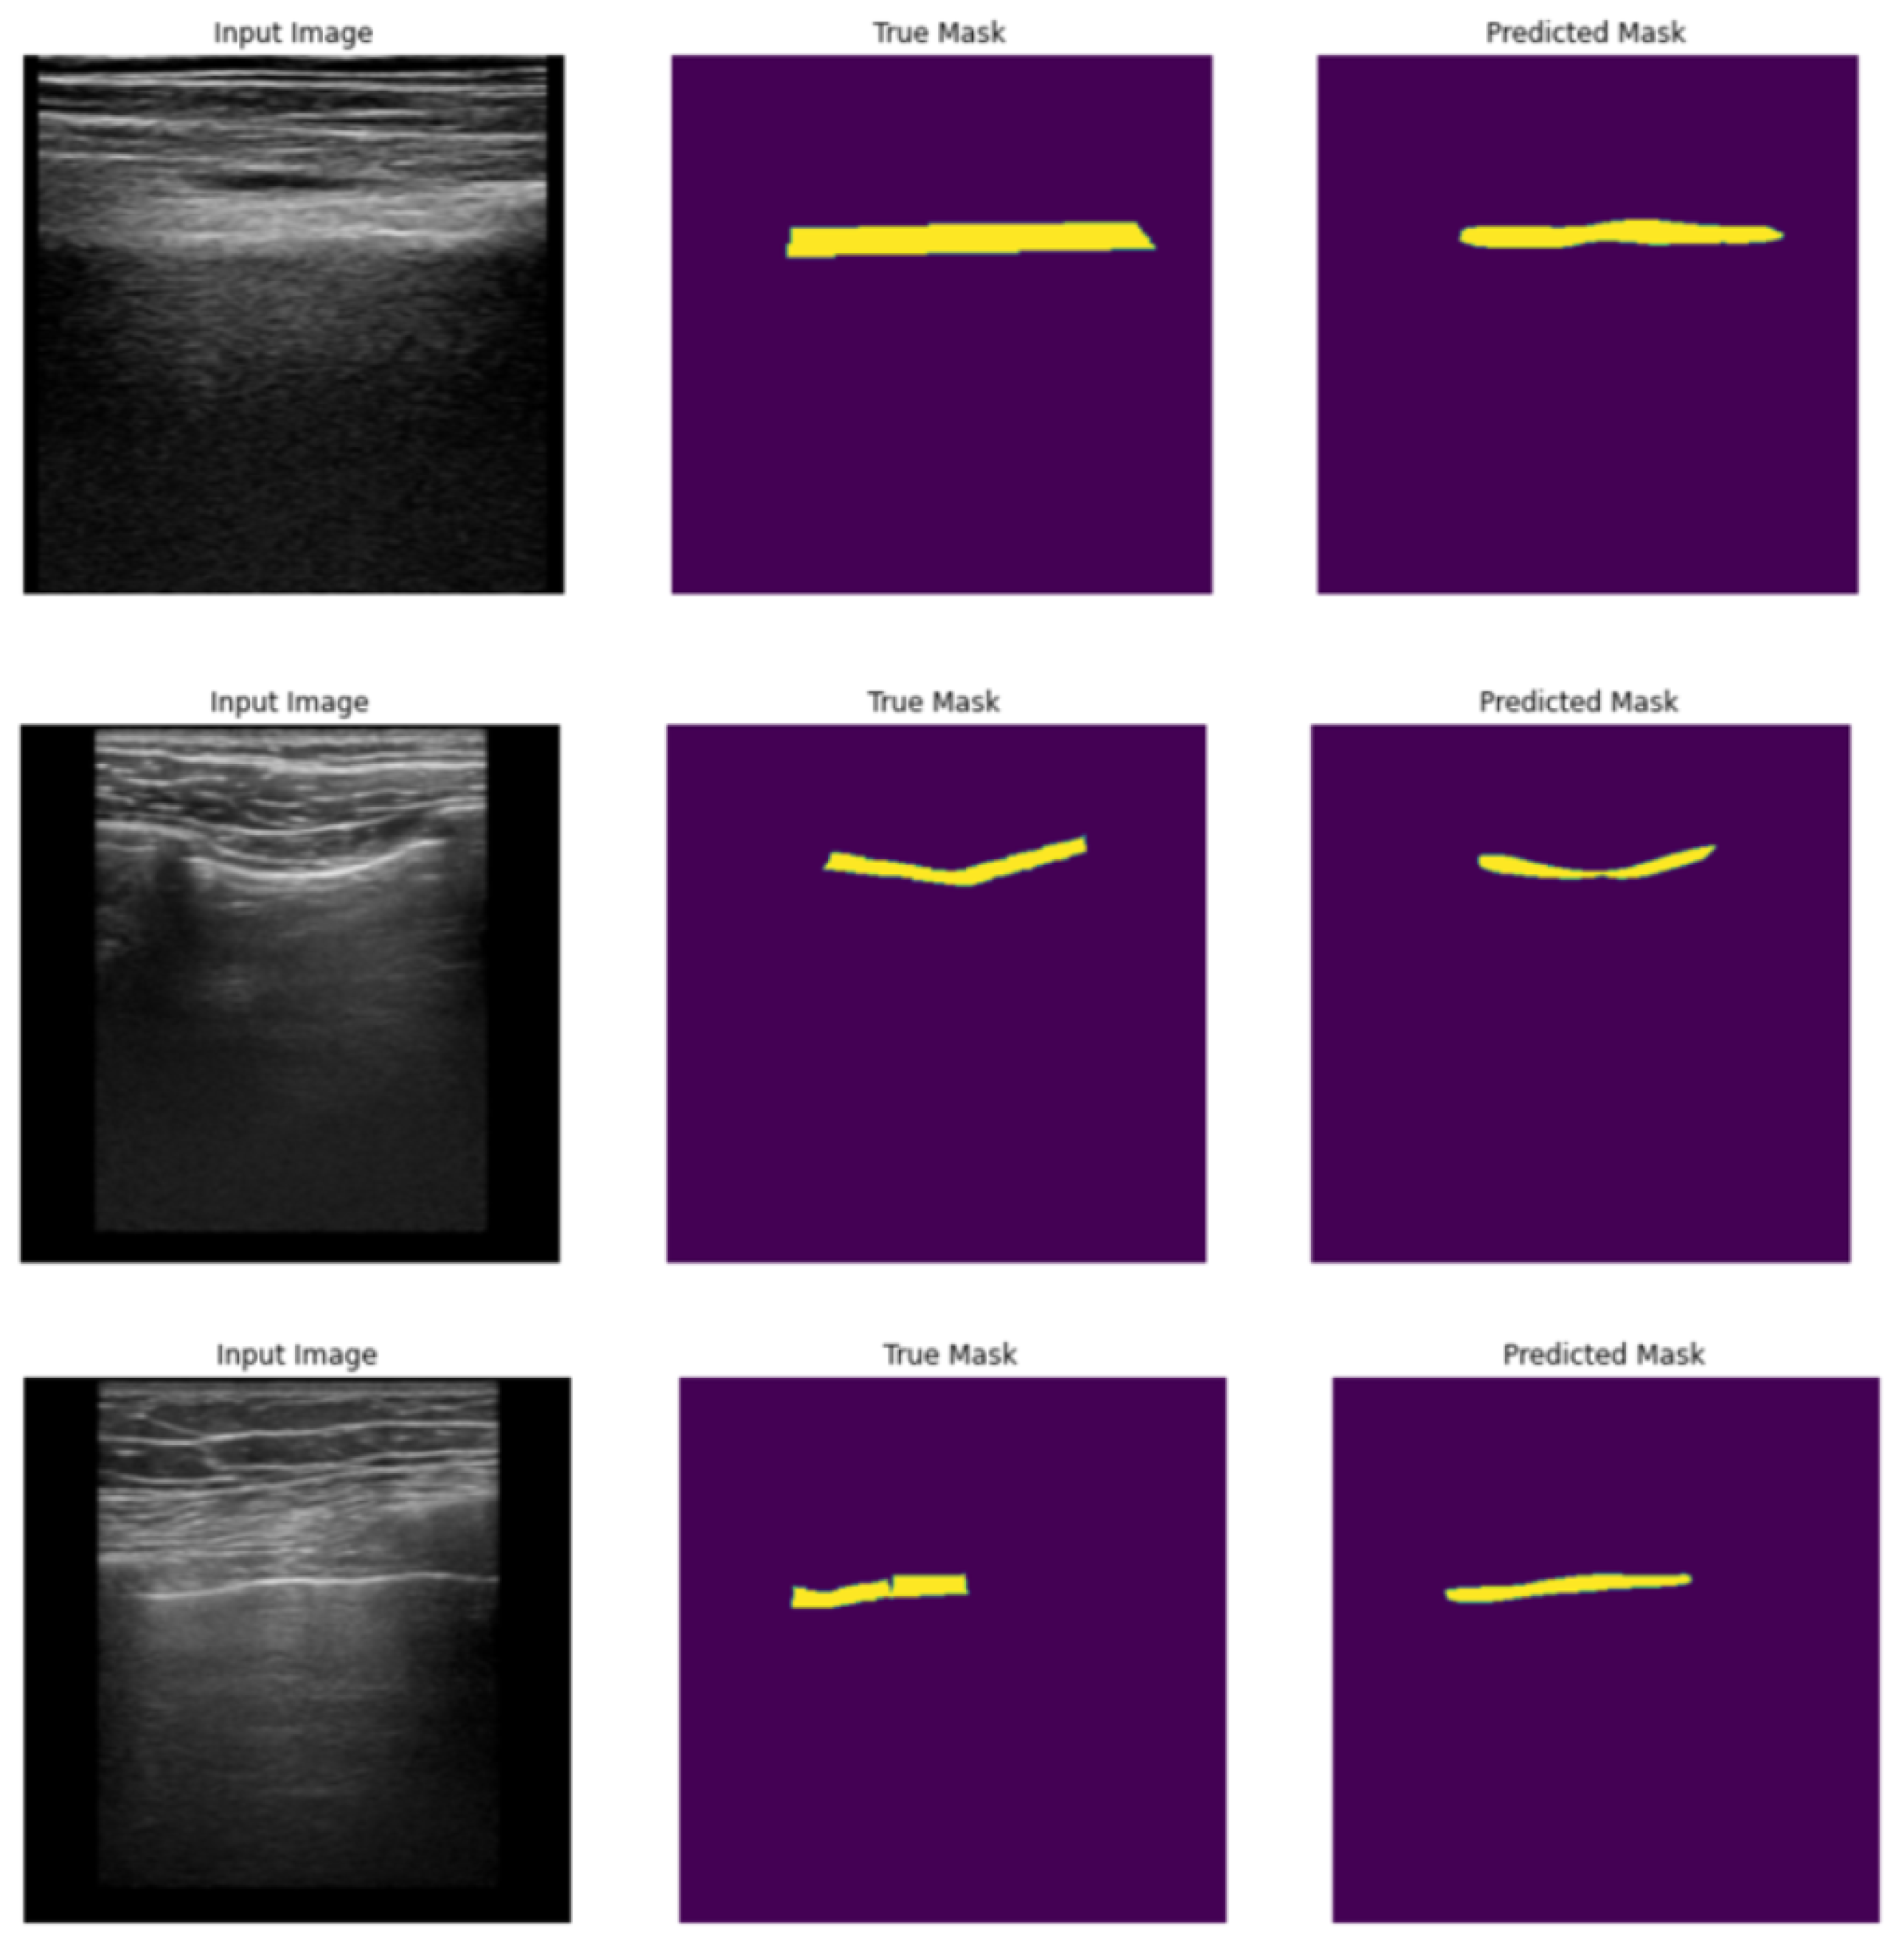
Our results indicate that utilizing different iterations of the models improves precision, as demonstrated by the average level of intersection between the predicted and true masks. This trend is also evident in the percentage of predicted masks that match with at least 50% and 70% of the true masks. The accompanying figures (
Figure 10) provide visual examples of original images, along with the corresponding true and predicted pleura segmentation masks.
6. Discussion
We presented an analytical approach to artifact detection in lung ultrasound images, namely using Fourier transform to detect horizontal A-lines and vertical B-lines used for diagnosing various pleural conditions. The proposed method was evaluated on sample data from the POCUS dataset, as well as on data from hospital scans. Our experiments showed that the approach gave mixed results, and parameters must be adjusted to the exact nature of the data.
The main advantage of the proposed method is that, unlike neural network-based solutions, it can process video data in real-time with no special hardware requirements, as showcased by a minimum of 12 FPS for video processing. It also requires no training data; it is easier to adjust to new types of data compared to neural networks since only parameters must be readjusted, and it can support classification and segmentation in the same process. The algorithm output should guide medical practitioners in analyzing the video and can aid them during the examination due to its ability to provide real-time results. This can be useful in drawing the doctors’ attention to specific areas in the lungs that can be further examined for the presence of relevant artifacts.
In the first test scenario, we used our approach to classify videos into three categories: with A-lines, with B-lines, and containing no artifacts. From 17 selected videos, the model classified 13 correctly, resulting in an accuracy of 76.47% and a balanced accuracy of 60%. Our method detected the presence of A- and B-lines on the test data even when they were not present according to the labels provided by domain experts.
In the following step, we evaluated the effectiveness of our method for segmentation on real-world data obtained from the University Hospital in Martin, Slovakia. The data used in this evaluation consisted of lung ultrasound records labeled by physicians, who marked the position of the pleura and A- and B-lines in relevant frames. For the remaining frames, the position of the artifacts was approximated through linear interpolation. Our method achieved an accuracy of 88.8% for B-line detection and an accuracy of 26% for A-line detection. These results indicate that while the proposed approach can be effectively utilized for B-line detection, it encounters difficulties in identifying horizontal lines.
To address this shortcoming, a hybrid approach was proposed, where the pleura—represented as the uppermost horizontal line in the ultrasound frame—is located using neural network-based segmentation, and A-lines are detected using an analytical approach. This is possible because the distance between horizontal artifacts is constant and equal to the distance between the skin and the pleura in LUS images. This approach can still be applied for real-time processing, as the position of the pleura is relatively stable between frames, thereby reducing the need for recurrent use of the neural network on each frame.
As a starting point for this research, we trained multiple neural networks using data from a hospital. This approach produced results that were unique compared to prior research that mainly focused on identifying the presence of artifacts instead of segmentation. Our neural network models were based on the TransUNet and reached high accuracies with Intersection over Union above 0.8 and average match of the predicted and true masks reaching 81%.
7. Conclusions
This paper described an analytical approach to processing lung ultrasound data for artifact detection. We experimentally evaluated the approach on publicly available data for classification and segmentation and also tested on labeled data from a local hospital. Although the experiments showcased the feasibility of the proposed method, we also identified some shortcomings.
The method’s main advantage is that it requires no training data since it is fully analytical. Another advantage is that the careful adjustment of parameter values can be adjusted to different types of ultrasound probes and settings. However, it failed to accurately detect A-lines, which we believe lies in the filtration setting in the frequency domain. While the nature of B-lines corresponds to the signal of lower frequency, it is also easier to identify the approximate range of frequencies of interest in the spectrum. A-lines, on the other hand, correspond to more abrupt changes in the image’s luminance and a higher frequency signal. Thus, the setting of the parameters identifying the frequencies of interest is more sensitive because of the high noise level in the images, which also corresponds to high-frequency signals.
We assume that the identification of A-lines could be improved using a different technique, for example, by using an optimized convolutional filter sensitive to horizontal edges. We tested this hypothesis by training a neural network that could successfully detect the pleura on images. This network can then aid A-line detection since the distance between the top of the image and the pleura is equal to the distance between A-lines. However, it is important to note that the training of such a neural network requires labeled data. For this hybrid approach, further exploration is required to examine the potential of combining neural networks and analytical methods to ensure real-time processing.


 ,
, 


