Article

Open-Circuit Switch Fault Diagnosis and Accommodation of a Three-Level Interleaved Buck Converter for Electrolyzer Applications

1
Department of Teacher Training in Electrical Engineering, Faculty of Technical Education, King Mongkut’s University of Technology North Bangkok (KMUTNB), Bangkok 10800, Thailand
2
Group of Research in Electrical Engineering of Nancy (GREEN), Université de Lorraine, F-54000 Nancy, France
3
Renewable Energy Research Centre (RERC), Thai French Innovation Institute (TFII), King Mongkut’s University of Technology North Bangkok (KMUTNB), Bangkok 10800, Thailand
4
ICAR, Institute for High Performance Computing and Networking, Italian National Research Council of Italy, 90146 Palermo, Italy
*
Author to whom correspondence should be addressed.
Electronics 2023, 12(6), 1349; https://doi.org/10.3390/electronics12061349
Submission received: 20 February 2023 / Revised: 8 March 2023 / Accepted: 10 March 2023 / Published: 12 March 2023

Abstract

:
This article proposes a novel open-circuit switch fault diagnosis method (FDM) for a three-level interleaved buck converter (TLIBC) in a hydrogen production system based on the water electrolysis process. The control algorithm is suitably modified to ensure the same hydrogen production despite the fault. The TLIBC enables the interfacing of the power source (i.e., low-carbon energy sources) and electrolyzer while driving the hydrogen production of the system in terms of current or voltage. On one hand, the TLIBC can guarantee a continuity of operation in case of power switch failures because of its interleaved architecture. On the other hand, the appearance of a power switch failure may lead to a loss of performance. Therefore, it is crucial to accurately locate the failure in the TLIBC and implement a fault-tolerant control strategy for performance purposes. The proposed FDM relies on the comparison of the shape of the input current and the pulse width modulation (PWM) gate signal of each power switch. Finally, an experimental test bench of the hydrogen production system is designed and realized to evaluate the performance of the developed FDM and fault-tolerant control strategy for TLIBC during post-fault operation. It is implemented with a real-time control based on a MicroLabBox dSPACE (dSPACE, Paderborn, Germany) platform combined with a TI C2000 microcontroller. The obtained simulation and experimental results demonstrate that the proposed FDM can detect open-circuit switch failures in one switching period and reconfigure the control law accordingly to ensure the same current is delivered before the failure.

1. Introduction

According to Climate Watch by the World Resources Institute [1], the energy sector represents three quarters of global greenhouse gas (GHG) emissions. Transportation, electricity production, and industry generate the majority of global GHG since they are mainly based on fossil fuel burning. For this reason, it is crucial to decarbonize these sectors to reverse the global trend of GHG emissions and temperature rise as well. Beyond the growing development of renewable energy sources (RES) (particularly wind and photovoltaic) to generate low-carbon electricity, hydrogen as an energy carrier can play a key role in decarbonizing energy sectors [2,3]. Hydrogen features a high energy density and can be exploited to deliver and store usable energy. However, its production pathway is still dominated by thermochemical processes (coal gasification, natural gas reforming) that may be coupled with carbon capture, utilization, and storage (CCUS) solutions to decrease GHG [3], even if the future perspective is tied to green hydrogen produced by renewables [3,4].
In fact, to cope with this issue, the dissemination of large water electrolysis power plants all over the world supplied by low-carbon power sources (wind, photovoltaic, hydro, and nuclear) has seen rising interest over the last few years [4]; on the other hand, a relevant increase could come from the diffusion of many small power plants. The water electrolysis process consists of exploiting electricity coming from low-carbon power sources and pure water to deliver green hydrogen that can be used to store energy, supply fuel cells for electricity generation in transportation or industrial/commercial/residential buildings, and for power-to-x applications such as the generation of green gas [5,6,7]. The water electrolysis process is made possible thanks to the use of electrolyzers. Currently, four electrolyzer technologies have been reported in the literature, depending on their electrolyte material and the ionic species they transport: alkaline water electrolysis [8], proton exchange membrane (PEM) water electrolysis [9], solid oxide (SO) water electrolysis [10], and anion exchange membrane (AEM) water electrolysis [11]. For now, only alkaline and PEM water electrolysis technologies are available on the market; while SO and AEM technologies are still being investigated, with promising features and results with developed prototypes reported in the literature [10,11].
The literature has given great attention to the entire conversion chain from electricity to hydrogen production. Electrolyzers can be seen as loads requiring very high currents (thousands of amps) and high voltage (hundreds of volts) [12]. Since such supply is not directly available, the electrolyzers are usually combined with power electronics systems that can be classified into two categories: (1) AC-DC converters that are thyristor-based [13] or IGBT-based [14], and (2) union AC-DC converters and DC-DC converters [15]. Currently, thyristor-based AC-DC converters such as 6-pulse and 12-pulse rectifiers dominate the market for large-scale water electrolysis power plants because of the very high current ratings of thyristors compared to IGBT [16]. The performance and the reliability of such systems depend on many factors including harmonics superimposed on the supply current, control algorithms, and fault tolerance. As pointed out in the literature, power converters suffer from generating harmonics affecting the power quality and contributing to high current ripple, decreasing the specific energy consumption [13,17]. Furthermore, further investigations are expected to have a better understanding of the current ripple effects on the performance [18,19] and aging of electrolyzers [20,21]. On the other hand, the combination between AC-DC converters and DC-DC converters allows facing power quality and current ripple issues [12,17], assessing that the ripple reduction improves the electrolyzer’s reliability. Control algorithms are currently under study, aiming to increase robustness against fault [22] and to encompass features of grid services [23,24,25]. Nevertheless, some issues are remaining such as the increase in the power rating due to the limit of IGBT’s current ratings (roughly equal to 1400 A) and the reliability in case of electrical failures [15].
Nowadays, the availability on the market of power devices, providing high efficiency to the converters in which they are adopted, has increased the interest in the development of DC/DC converters of rated power up to about 10 kW to be used also in domestic applications [26,27]. In this case, the operating voltage is reduced (about ten volt), enhancing safety; however, the market requires improved reliability so that the maintenance cost is reduced, and the continuity of the production is guaranteed.
In the case under study, the reliability issue is investigated since DC-DC converters are frequently sources of failures in many applications [28]. Indeed, as highlighted in the literature, the decrease in reliability of these converters is caused by operating and climate conditions. Moreover, the components featuring the highest failure rates in these converters are capacitors and power switch devices [29]. In this work, open-circuit failures (OCF) are studied, considering that short-circuit failure (SCF) monitoring and detection can be handled by current driver boards [30]. When considering RES coupled with the electrolyzer where the operating conditions are governed by the weather conditions (wind speed, solar irradiance), discontinuous operating and climate conditions such as voltage and current spikes and high temperature can occur, and consequently may cause failures. The water electrolysis process is a critical application and hydrogen generation must be ensured despite the occurrence of failures. Hence, to avoid any disruption in hydrogen production, the use of fault-tolerant DC-DC converters and fault diagnosis is highly recommended [31,32].
Over the last decade, many researchers have employed fault-tolerant DC-DC converters, taking advantage of static redundancy or additional circuits coupled with fault diagnosis to ensure the continuity of service in case of failures while enhancing the performance of the system [33,34,35,36,37,38,39,40,41]. From the current literature, it can be noted that fault diagnosis is generally proposed for interleaved converters [34,35,36,37,38,39,40,42], floating interleaved converters [41], which are suitable for fuel cell and photovoltaic applications, and microgrids [43]. On one hand, due to their static redundancy, these converters can continue to operate despite the occurrence of failures. On the other hand, albeit to improve their performance, fault diagnosis is needed. Studies specifically focused on electrolyzer applications are relatively poor in the literature, and only one paper has been published so far [44]. In this paper, the authors have proposed a fault-tolerant operation control strategy in the case of OCF for a multiphase stack interleaved buck converter. However, fault diagnosis has not been investigated.
Starting from this literature review, the main contribution of this paper is to develop a fault diagnosis method (FDM) to detect and accurately locate OCF and a fault-tolerant control strategy in a three-level interleaved buck converter (TLIBC) conceived for electrolyzer applications. The FDM consists of comparing the shape of the input current and the pulse width modulation (PWM) gate signal of each power switch. To assess the performance of the studied developed FDM and fault-tolerant control strategy for TLIBC during post-fault operation, an experimental test bench of the hydrogen production system has been realized with a real-time control based on a MicroLabBox dSPACE (dSPACE, Paderborn, Germany) platform combined with a TI C2000 microcontroller. The obtained simulation and experimental results have demonstrated that the proposed FDM can detect open-circuit switch failures in one switching period. Furthermore, the fault does not interrupt the function of the converter, which continues to operate with a reduced circuit configuration.
Compared to the existing literature, the proposed paper encompasses features of improving reliability, maintaining the same performance before fault, fault tolerance, and control. The converter differs from those shown by the survey [15], representing an improvement. Specifically, the proposed converter shows a better efficiency than that in [27] thanks to the current sharing and zero-current switching on power devices. In comparison with the fault-tolerant architecture described by [31,32], our device requires neither additional components nor redundant parts (meaning zero cost) to perform a phase shift adjustment to compensate for the fault. The fault is detected without using a dedicated observer as in [29,34] and without a current sensor as in [38]. Even though current sharing to minimize losses is also proposed in two-level interleaved converters [35,36,37], our TLIBC reduces the voltage and thermal stress on power devices; moreover, a novel open-circuit FDM is proposed. In contrast to traditional interleaved converters in which reconfiguration after fault modifies the amplitude and ripple frequency, the proposed TLIBC maintains the same current ripple before fault thanks to two complementary pairs of power devices, and using a phase shift technique as in [36]. The obtained reduced ripple is compliant with the requirements addressed by [13,17,18,19]. The adopted fault diagnosis is simpler than the one proposed in [41]. The TLIBC can be controlled like a dynamic load thanks to its control algorithm, as the traditional converters proposed by [23,24], ensuring the absence of overshoots on the electrolyzer with step current reference variation and including the fault-tolerance features that are not addressed by [23,24]. The proposed converter is not suitable for very high power levels, as those described by [8,9,12]; however, it can contribute to a distributed use of hydrogen even at the domestic level. In addition, it encompasses all the main features required for a converter devised for hydrogen production: high efficiency, fault tolerance, and low current ripple. Finally, design considerations address the correct choice of power components so that the converter does not require stopping operation after failure, postponing the replacement of the failed component.
This paper is composed of six sections. After providing a thorough discussion of the state-of-the-art focused on the reliability of power electronics and the motivations to carry out this work, the second section presents the investigated DC-DC converter for fault diagnosis purposes and some simulation results to bring out the impacts of open-circuit failures into the converter. Then, in section three, the proposed FDM and adopted fault-tolerant control strategies are described. Afterwards, in section four, simulation results are given to validate both the FDM and fault-tolerant control strategies. In section five, the designed experimental test bench is detailed, and experimental results are provided to support the performance of the proposed FDM in detecting and precisely identifying the failure of the converter. Finally, section six addresses converter design issues to achieve a fault-tolerant converter; the main advantages of the proposed approach are then summarized in the conclusion.

2. Investigated DC-DC Converter for Fault Diagnosis Purposes

As is well known, the conversion of electric energy to H2 production by a PEM electrolyzer is based on the reaction in which the water molecule is split into protons and oxygen, giving electrons for the conduction according to:
H 2 O 2 H + + 1 2 O 2 + 2 e
The electrons go outside the anode and contribute to the current, whereas the protons go through the membrane. Once the protons reach the cathode, they combine with electrons coming from the terminal at a negative potential, producing hydrogen:
2 H + + 2 e H 2
The electrons’ flow corresponds to an electric current that must be supplied by a suitable generator. Ideally, a constant current generator should be employed; in practice, it is realized by a power electronic circuit that implements a voltage generator with a control algorithm able to assure the desired performance. The supply of a PEM requires some design constraints such as a high value of DC current with a negligible ripple, the possibility to regulate the DC current based either on the H2 to be produced or on the available energy in case of exploitation of renewable sources, and finally, a high reliability or fault-tolerant features to assure the continuity of production. As explained in the introduction, the literature proposes many architectures for power converters; however, few studies address the issues related to the PEM. The knowledge of the PEM behavior (or of its dynamical equivalent model) is crucial since this kind of load can alter the performance of the converter compared to a traditional purely resistive load [27,45]. The converter proposed here shows a better fault-tolerant architecture and efficiency compared to those in [27] and [45] thanks to its topology, as described below.

2.1. Three-Level Interleaved Buck Converter

Over the last few years, a lot of efforts have aimed at proposing new DC-DC converter topologies to interface RES and electrolyzers for medium-power applications (around ten kilowatts) [22,27,44,46,47,48]. These converters can be connected directly to photovoltaic systems [22,46] or wind turbine conversion systems through the use of an additional AC-DC stage [15]. The good operation of the DC-DC converter is crucial for the conversion chain [27]. In this work, the investigation of open-circuit fault diagnosis is focused on a three-level interleaved buck converter (TLIBC) to address the main issues specified above. To the best of the authors’ knowledge, no related works have been reported in the literature.
The TLIBC scheme and its principle of operation are shown in Figure 1 and Figure 2, respectively. From its electrical architecture point of view, the TLIBC presents similarities with the four-phase floating interleaved boost converter presented in [41]. However, the converter shown in Figure 1 operates in buck mode (i.e., step-down operation since the electrolyzer requires a low voltage (about ten volt)). In the upper part of the TLIBC, two basic buck DC-DC converters are connected in parallel; as well as the reverse versions of the buck DC-DC converter in the lower part. Therefore, the current can be equally shared between the phases, and the current stress through the power electronics devices can be lowered. Furthermore, this solution reduces conduction losses since one half of the total current flowing through the same parasitic resistance (given by the sum of the on-state resistance of the power switch and the resistance of the inductor) will give one quarter of the total loss. As a consequence, the total conduction losses considering Q1 and Q2 are halved. This redundancy also not only allows the converter to be kept in operation even in case of failure (a result that could be achieved with only one complementary pair of devices), but also current with the same ripple reduction to be compensated for. The latter feature is crucial for powering the electrolyzers since the current ripple degrades its performance by decreasing reliability [18,19]. At the input of the TLIBC, two capacitors C1, C2 can be found; they reduce the voltage stress at the terminals of the power electronics devices. As a matter of fact, they are subjected to a blocking voltage of a single capacitance. Finally, at the output, two inductors L0/2 are used to achieve zero-current switching. In summary, the proposed TLIBC features can be summarized as follows: it has a (a) low step-down voltage ratio, (b) low current ripple, and (c) high energy efficiency, and (d) it can continue to operate in case of power switch failures because of its interleaved architecture adopting two pairs of complementary switches.
Regarding the operation of the TLIBC shown in Figure 2, each PWM gate control signal driving the power switches is controlled with a shift angle of π/2 radian in this order: Q1, Q3, Q2, Q4. Each power switch with its free-wheel diode behaves like in a traditional buck converter; however, thanks to the phase displacement of the gate driving signals, each device is operated for half of the switching period, reducing the thermal stress. As a result, the current flowing through the load, given by the sum of IL1 and IL2, will exhibit a reduced peak-to-peak value. Hence, the output current ripple can be reduced and allows optimizing the performance of the electrolyzer, drawing from a recent investigation of current ripple effects on the degradation of electrolyzer performance that showed the performance worsening and reliability lessening increasing the current ripple [19]. Thanks to the adoption of two pairs of complementary switches, the ripple compensation is also achieved in case of fault.

2.2. Operation after Open-Circuit Failures without Suitable Control Strategy

To point out the effects of an OCF on the system, simulations have been performed using Matlab-Simulink Software (version R2022a). The simscape electrical library has been employed to implement both the TLIBC and also the electrolyzer model based on an equivalent electrical circuit considering static and dynamic operations [26]. The technical specifications of the TLIBC used for the simulations are given in Table 1. The switching frequency of the converter has been set at 10 kHz. It should be noted that in this analysis, the output current is regulated by a modified sliding mode-based controller designed in [49]; this solution allows the fault effect to be minimized. Moreover, this control law is designed for two main objectives: first, to control the hydrogen flow rate, and second, to ensure the balance of both input capacitor voltages. The schematic diagram of the controller is depicted in Figure 3.
Based on Figure 3, the input current (iin), output current (iCH), and capacitor voltage of C1 and C2 (VC1 and VC2), have been measured so that the modified sliding mode control can calculate the duty cycle (d). Moreover, the duty cycle of Q1 and Q2 is assumed as d 1 = d 2 , whereas the duty cycle of Q3 and Q4 is d 3 = d 4 . In addition, the output current reference is filtered by a second-order filter to smooth the aggressive current of the output capacitor.
In order to verify the performance in case of fault, firstly, an OCF has been simulated in the lower part (i.e., power switch Q3) and the obtained simulation results are shown in Figure 4a,b. From Figure 4a, on one hand, during the operation in healthy mode (i.e., without failure), the output current is equal to 10 A with a very reduced ripple (lower than 0.1 A, meaning about 1%), while the four inductor currents (i.e., iL1, iL2, iL3, iL4) are perfectly balanced (around 5 A). Even if the currents through L1, L2, L3, and L4 are subjected to ripple, the results are compensated on the load. On the other hand, as a result of an OCF in Q3, Figure 4b shows the consequence of the TLIBC operation keeping the same control law as in the healthy case. After a slight transient of a few switching periods’ duration, the new steady operation shows that the TLIBC is still able to operate but shows reduced performance. Specifically, the output current is lowered by about 10% and the related ripple is almost doubled. In comparison, the power switch Q4 compensates for the OCF in Q3 since it is located in the faulty part. Indeed, both the upper and lower parts are independent of each other. Accordingly, the magnitude of the current iL2 is twice the value in healthy mode (around 10 A) and the output current is kept near its reference value through the robustness of the controller. However, a slight increase in the current ripple can be perceived (0.16 A), which is emphasized in Figure 4b. This increase is due to an unfit shift angle of the PWM gate control signals driving the healthy power switches, which also causes a modified shape of the current, as highlighted in Figure 4b compared to a healthy mode with a fit shift angle. This operation in faulty mode can be compensated for by adopting the re-phase and compensating techniques proposed in this paper conceived to restore the original performance.
From this detailed analysis when an OCF occurs, a fault diagnosis and fault-tolerant control strategy are required, and are presented in the next section. Although the control strategy described in [49] is able to minimize the effect of an OCF, it requires the precise identification of the power switch with the fault. For this reason, one of the most important features required for the fault diagnosis that is proposed in this paper is to precisely identify the location of the failure. On this basis, by the suitable accommodation technique proposed here, the original performance is restored.

3. Proposed Fault Diagnosis Method and Fault-Tolerant Control Strategies

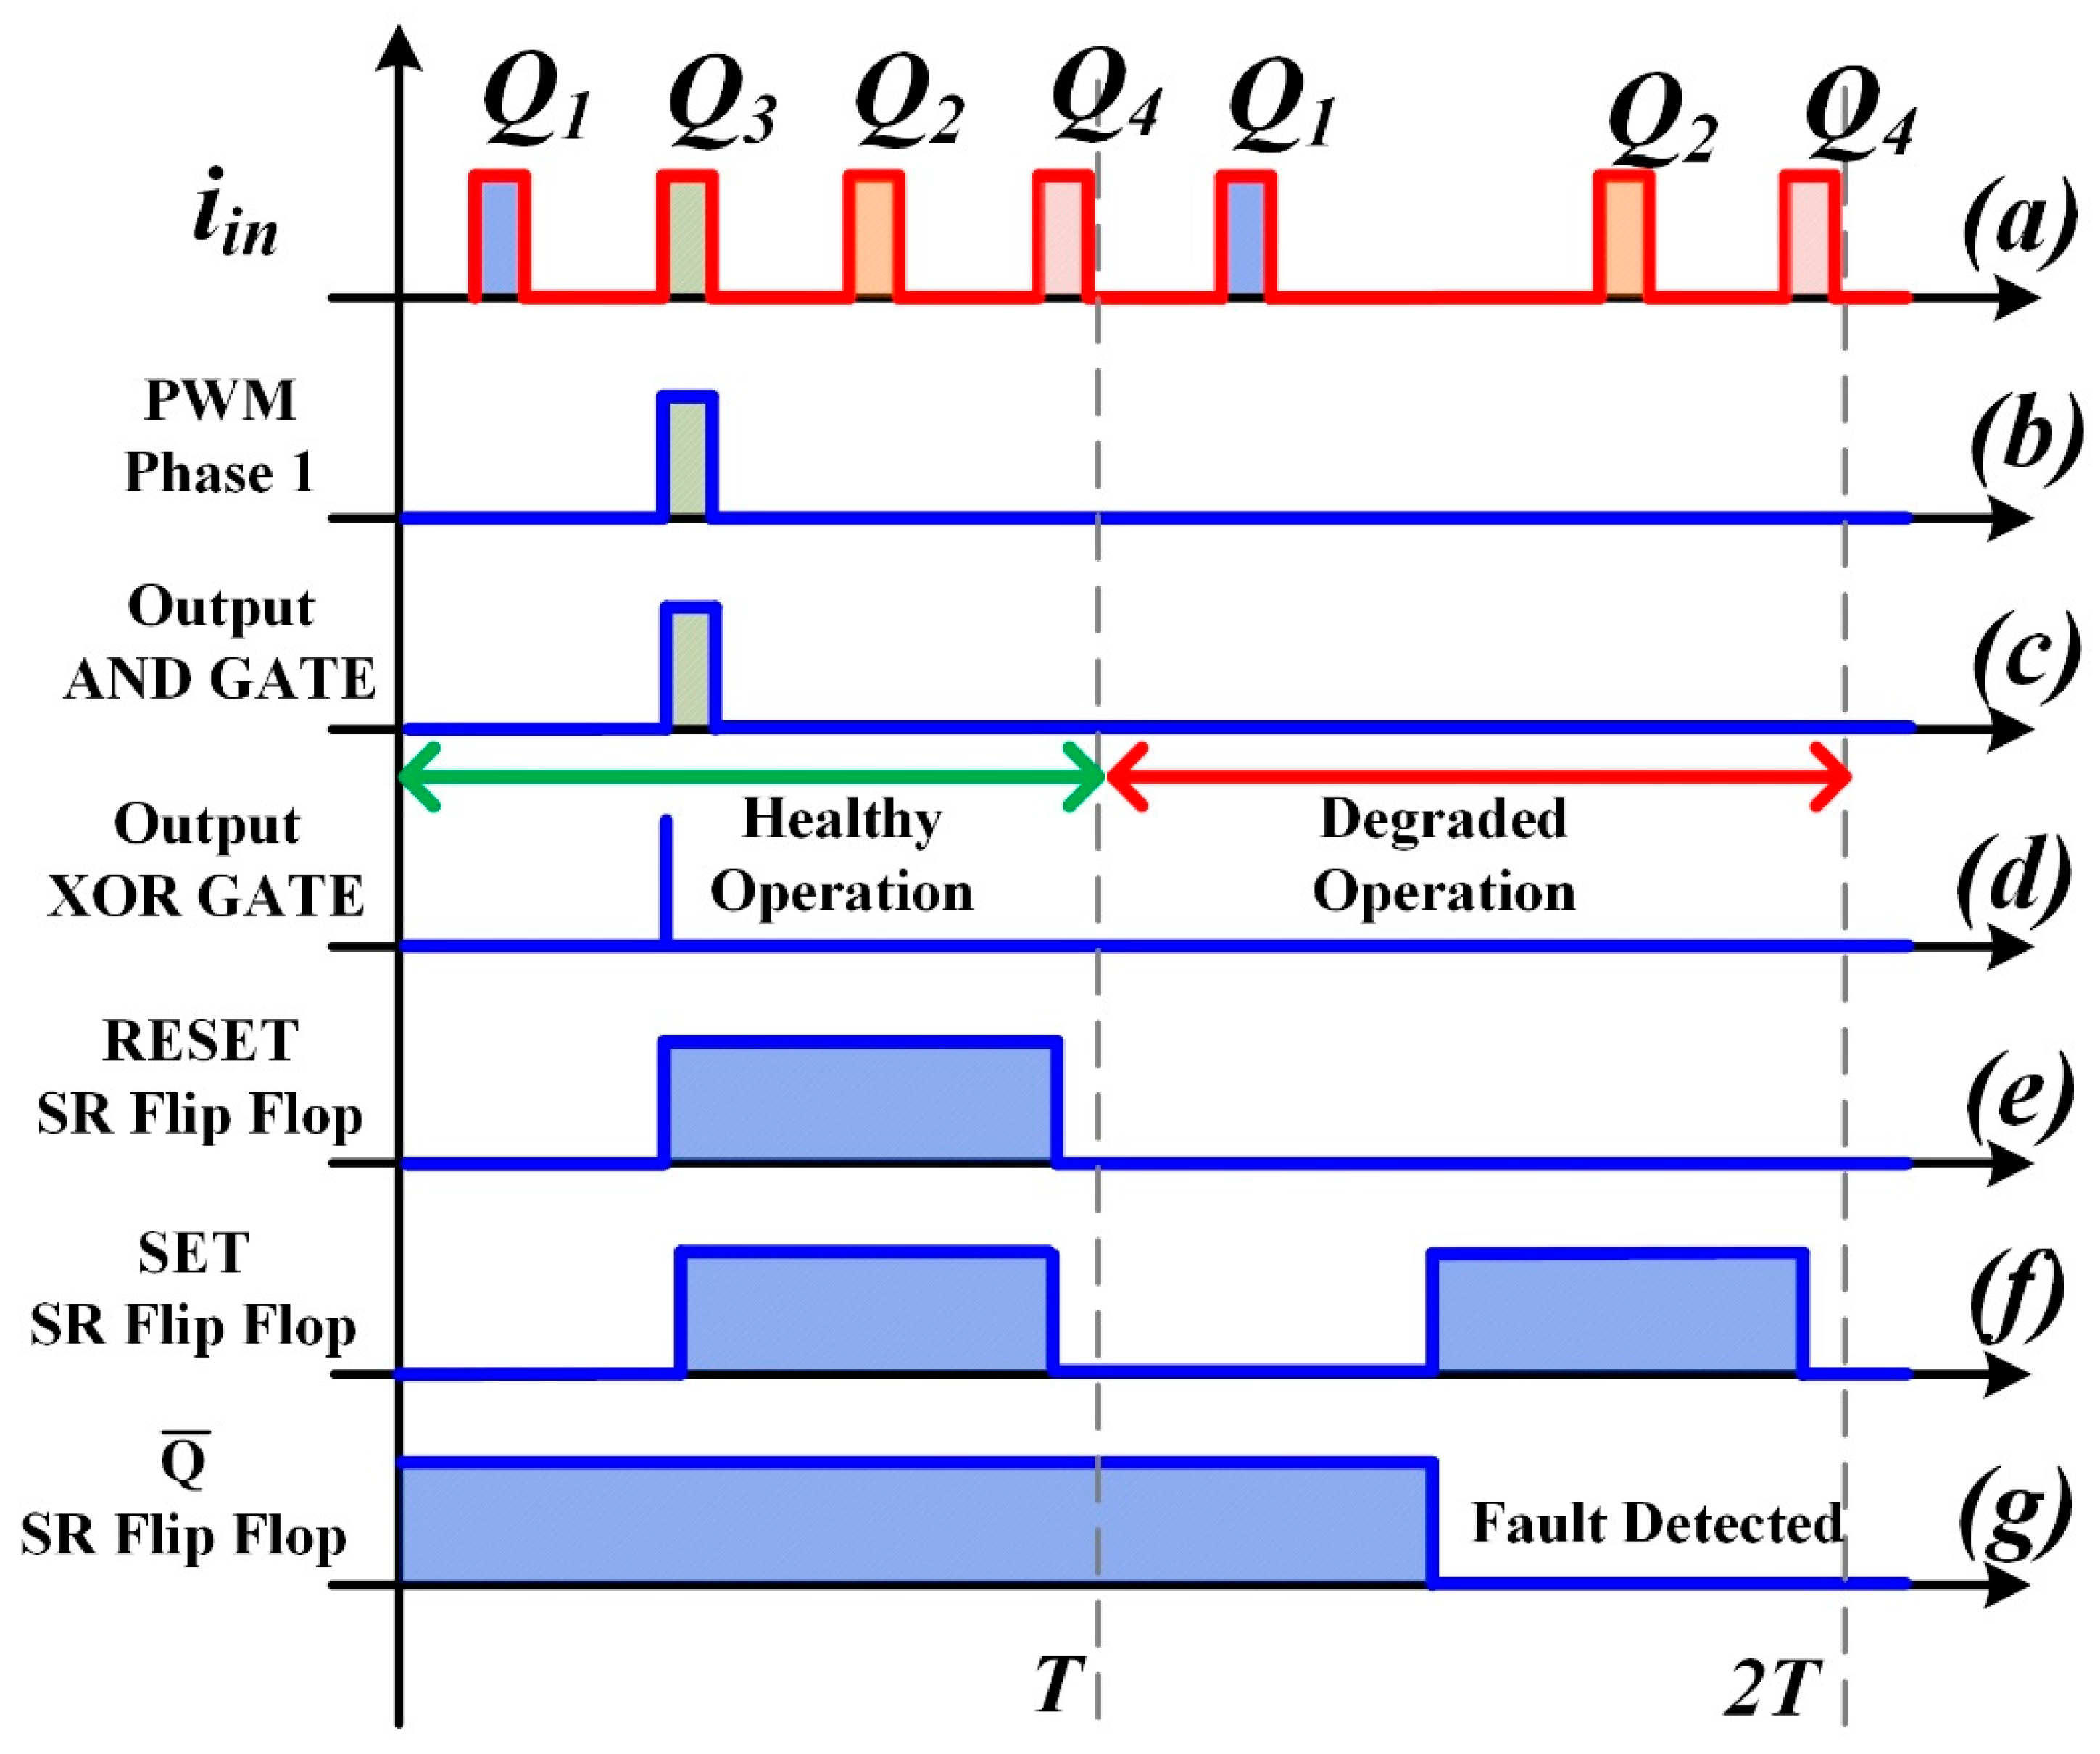
3.1. Description of the Fault Diagnosis

An FDM has been designed to precisely identify the OCF in the TLIBC. It relies on the comparison of the shape of the input current with the PWM gate signal of each power switch in the TLIBC. As mentioned in Section 2.1, the PWM gate signal control of each phase of the TLIBC is shifted π/2 (i.e., Q1, Q3, Q2, Q4.). Hence, the shape of the input current iin of TLIBC is a pulse signal with 4-phase PWM waveforms. A schematic diagram of the proposed FDM of phase 3 is illustrated in Figure 5.
Based on Figure 5, the developed FDM is composed of 3 signals (i.e., input current (iin), PWM signal, and Pulse Generator), 2 analog comparators (i.e., AND gate and XOR gate), Relay, SR Flip Flop, integral, and gain. The studied FDM starts with receiving the input current (iin) of the TLIBC. The waveform of the input current is similar to the ON state of the 4-phase PWM signal. After that, the Relay converts the input current (iin) from high amplitude into binary form to compare with the PWM signal.
After this, the output of the Relay and the PWM signal of phase 3 are compared via the use of an “AND gate” to capture the shape of the current of phase 3. As a result, the signal output of the AND gate shows only the current of phase 3 as compared with the output of Relay.
Subsequently, to detect the fault of phase 3, the XOR gate has been applied to compare the output of the AND gate and, once again, with the PWM signal of phase 3. On one hand, the output of the XOR gate is equal to 1 (ON state) when both inputs are ON at the same time. However, the output of the XOR gate is the ON state for a few seconds. For this reason, the integrator and gain have been applied to this signal to increase the ON period. Additionally, the value of gain is equal to the period of switching frequency (i.e., 10 ms). On the other hand, the output of the XOR gate is equal to 0 (OFF state) when both inputs are in different states.
Moreover, an SR Flip Flop has been employed in this FDM. The RESET terminal of the SR Flip Flop is commanded by the output of the XOR gate. Additionally, a pulse generator with the same phase shift and switching frequency of PWM phase 3 at duty cycle 50% has been utilized for the SET of SR Flip Flop and to reset the value of the integrator. Finally, the output of the SR Flip Flop at Q ¯ is equal to 1 or 0 when the TLIBC operates in healthy and degraded modes, respectively. The operation of the proposed FDM during healthy mode switch to degraded mode is sketched in Figure 6.
According to Figure 6, the waveforms show only two switching periods with seven signals: input current (iin), the PWM signal of phase 3, the output of AND gate, the output of XOR gate, and the RESET, SET, and Q ¯ outputs of the SR Flip Flop.
The diagram starts with the TLIBC operating in healthy mode (first switching period). It can be highlighted that the input current signal (filtered by the Relay) is composed of the ON state of the 4-phase PWM gate control signals (Figure 6a). After this, the output of the AND gate presents only the current of phase 3 (Figure 6c). Hence, both inputs of the XOR gate are the same signals. As a result, the output of the XOR gate is the ON state for a short period (Figure 6d). Subsequently, this signal has been integrated and multiplied by a gain to increase the ON period (Figure 6e) and applied to the RESET terminal of the Flip Flop. Moreover, the pulse signal at duty cycle 50% with the same phase angle and frequency of PWM phase 3 has been generated to SET SR Flip Flop, and allows the resetting of the integrator (Figure 6f). Finally, the output of the SR Flip Flop at Q ¯ is equal to 1 because both inputs of the SR Flip Flop are in the same states. In this case, the TLIBC operates in healthy mode.
Afterwards, in the second switching period, the 3-LIBC starts operating in degraded mode. It can be observed that an OCF has occurred at phase 3. To create this failure, the PWM gate signal of Q1 has been forced to 0. Consequently, the current of phase 3 in the input current has disappeared. The input current displays only phase 1, 2, and 4 (Figure 6a). Hence, both inputs of the AND gate and XOR are equal to 0, resulting in both outputs being 0 (Figure 6c,d). Finally, both inputs of the SR Flip Flop are in different states. Therefore, the output of the SR Flip Flop at Q ¯ is equal to 0. This means that the proposed FDM has detected an OCF in phase 3.
The knowledge of the faulty power switch enables the application of a suitable fault-tolerant control strategy for the TLIBC, which is provided in the following section.

3.2. Fault-Tolerant Control Strategies Adopted

Referring to the obtained simulation results in Figure 4a,b, the occurrence of an OCF causes the increase in the output current ripple (i.e., iCH) and the current flowing through the power switch located in the faulty part (i.e., the value of the current is twice higher than in a healthy operating mode without failure). Furthermore, the output current ripple is an unsymmetrical waveform because of an unsuitable phase shift angle of the remaining PWM gate control signals compared to a healthy mode. As recently pointed out in the literature [18,19], the current ripple alters the energy efficiency and the performance of the PEM electrolyzer, especially from DC-DC converters operating at high switching frequencies. Hence, in this subsection, fault-tolerant control strategies have been investigated to decrease the output current ripple and enhance electrolyzer performance over a long period of operation.
The proposed fault-tolerant control strategies of the TLIBC in degraded mode are developed depending on the remaining healthy power switches. Once the faulty power switch is identified by the fault diagnosis, the unfit PWM phase shift is adjusted consequently to the suitable phase angle of the remaining power switches. Indeed, the proposed fault-tolerant control strategies are re-phased to shift 2π/3 radian between each remaining power switch instead of π/2 in healthy mode. As a result, the studied fault-tolerant control strategies’ tracking phase failures are given in Table 2.
The values indicated in Table 2 show the phase that has to be added to the original value before the fault to achieve the phase shift allowing compensation after the fault. As an example, the new phase value of Q2 will be modified from π to (π + π/6) in case of failure detected in Q1, from π to (π − π/3) in case of failure detected in Q3, and from π to (π + π/3) in case of failure detected in Q4.
Relying on Table 2, it can be observed that the new phase shift angles (indicated as re-phase in the following) of the remaining power switches are modified to achieve a suitable angle based on the initial phase angle. Moreover, one of the phase angles of the healthy power switch is not changed (still in the initial phase angle) to make the reference of the remaining two power switches. On one hand, with the fault occurring in phase 1, the phase angle of Q3 is chosen as a reference. On the other hand, with the fault occurring in phases 2, 3, and 4, the phase angle of Q1 does not need to be shifted because the initial angle is 0 radian. Thus, the phase angle of TLIBC during degraded mode is adjusted to 2π/3 radian.
In the last sections, simulations and experiments are performed to prove the performance of the proposed fault diagnosis and fault-tolerant control strategies in identifying the faulty power switch and enhancing the system operation. Furthermore, a comparison between the performance of the proposed fault diagnosis and those reported in the literature is provided to conclude this work.

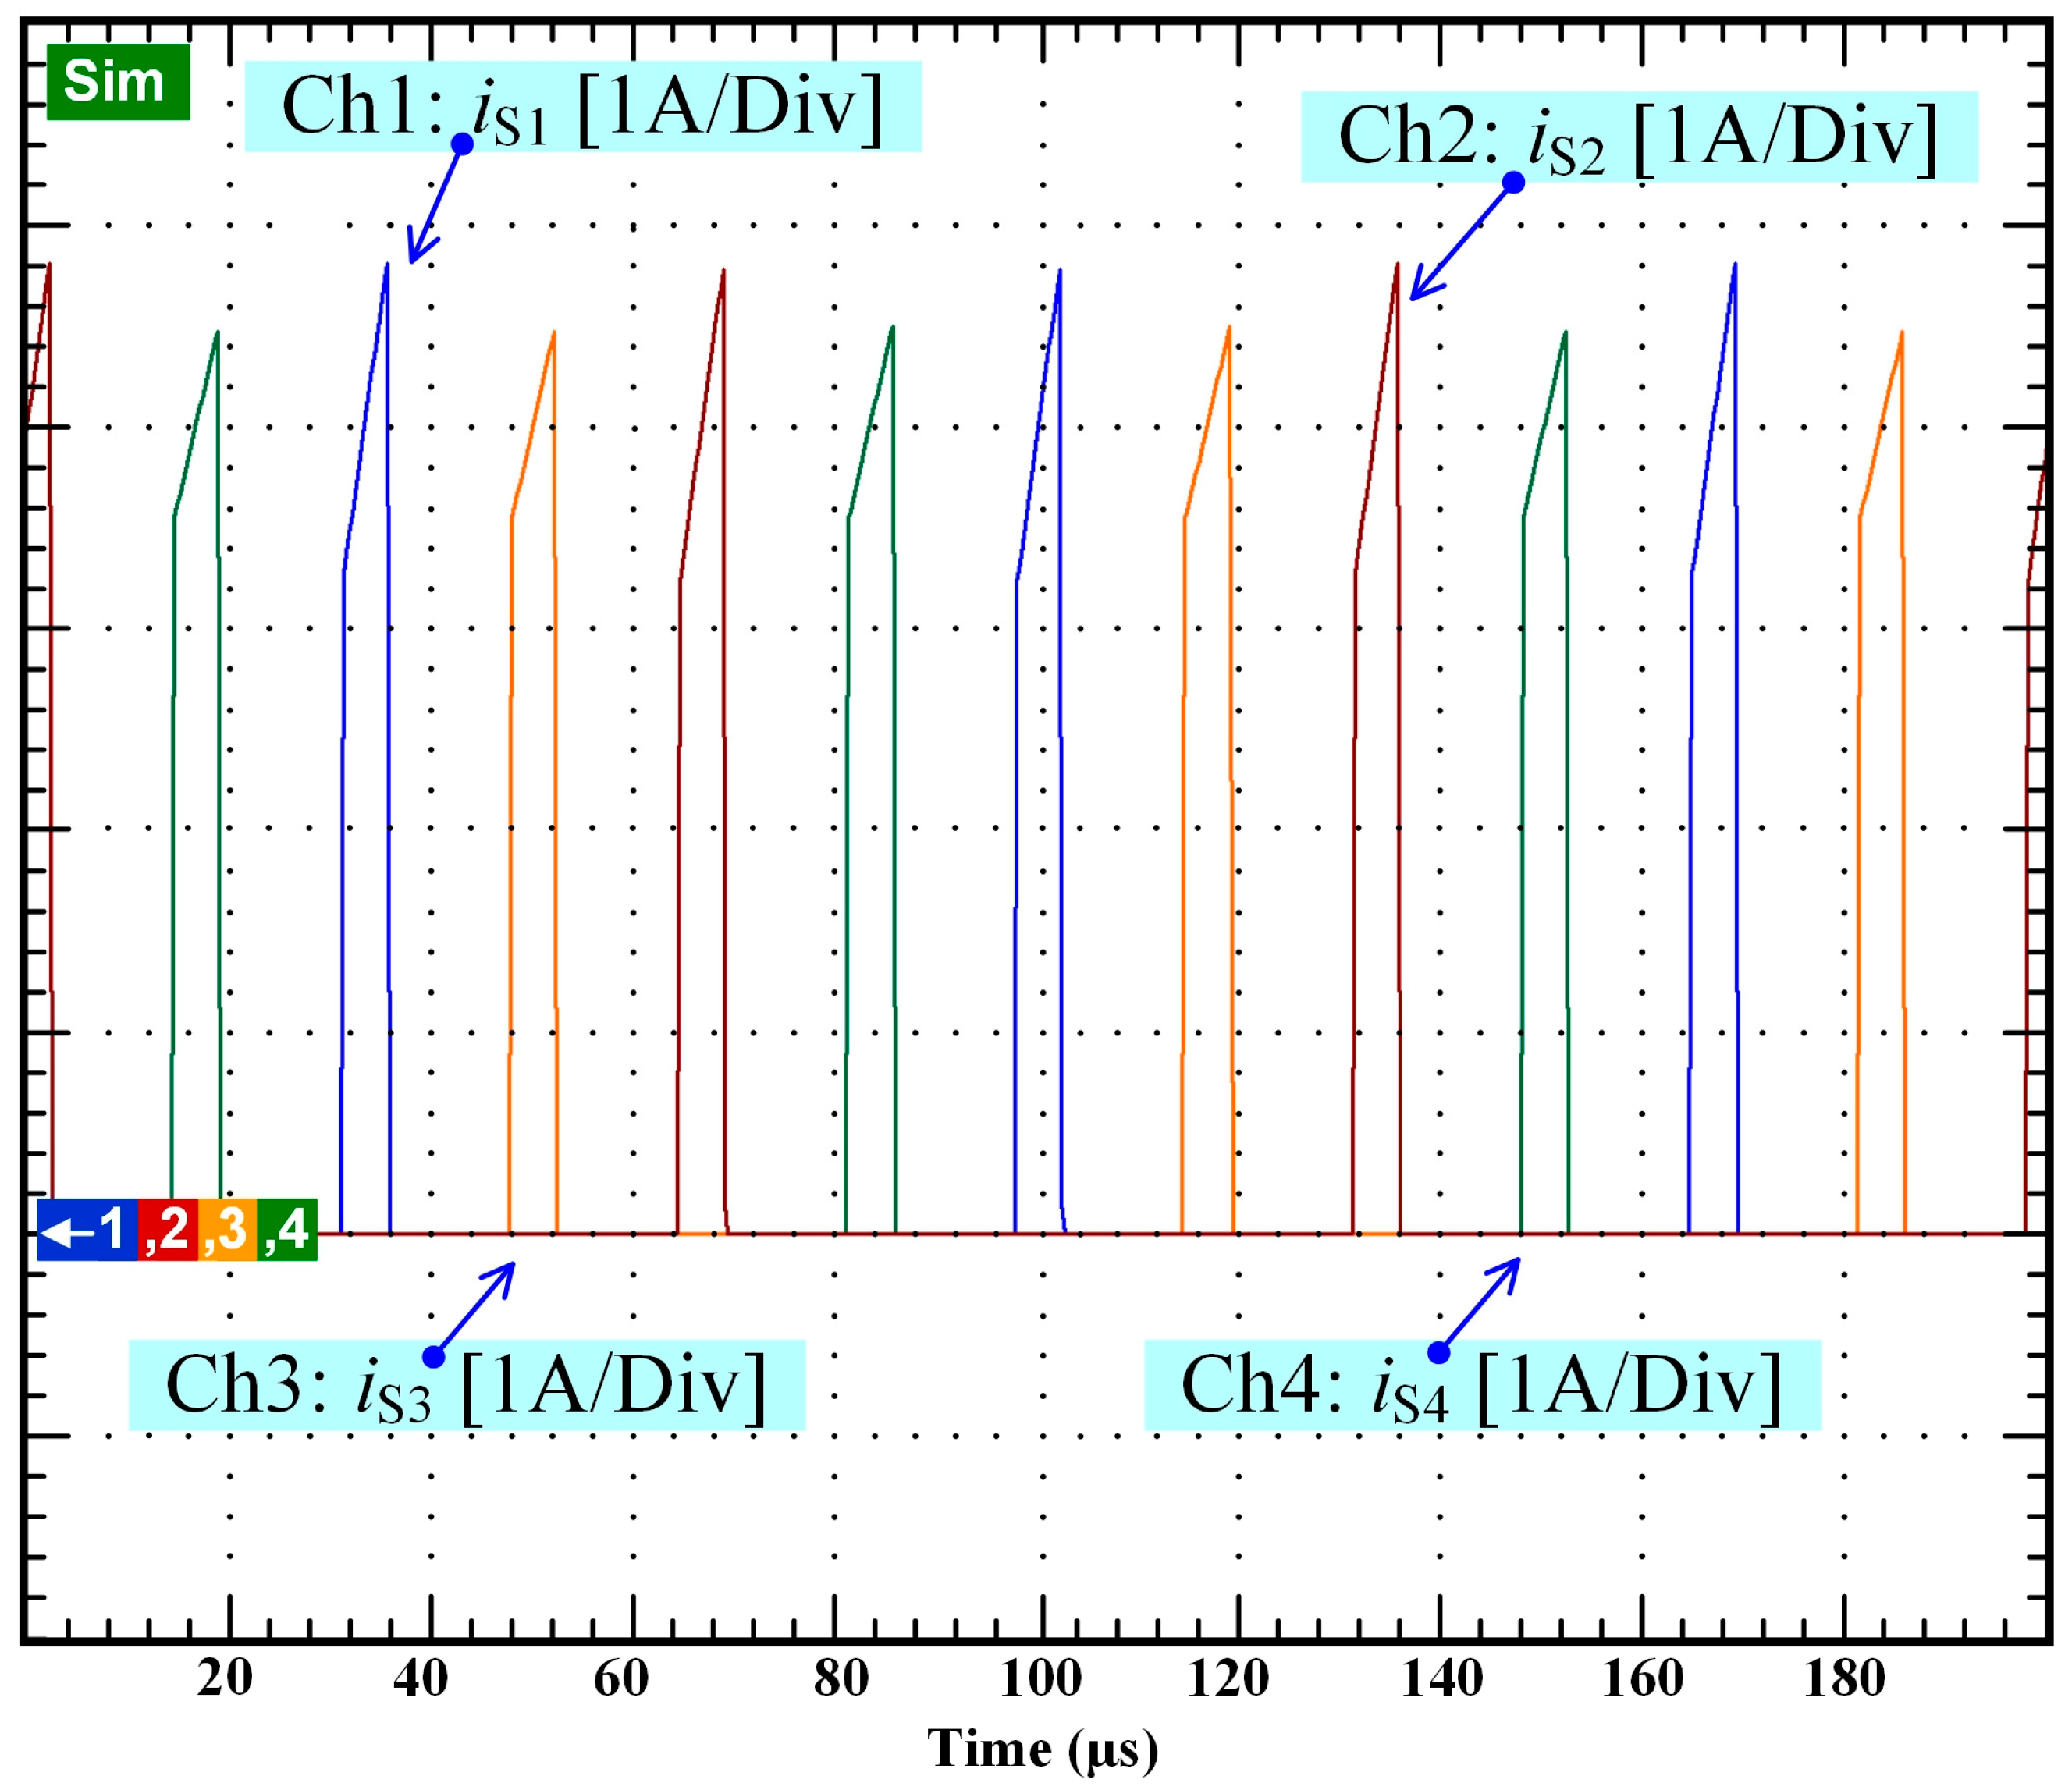
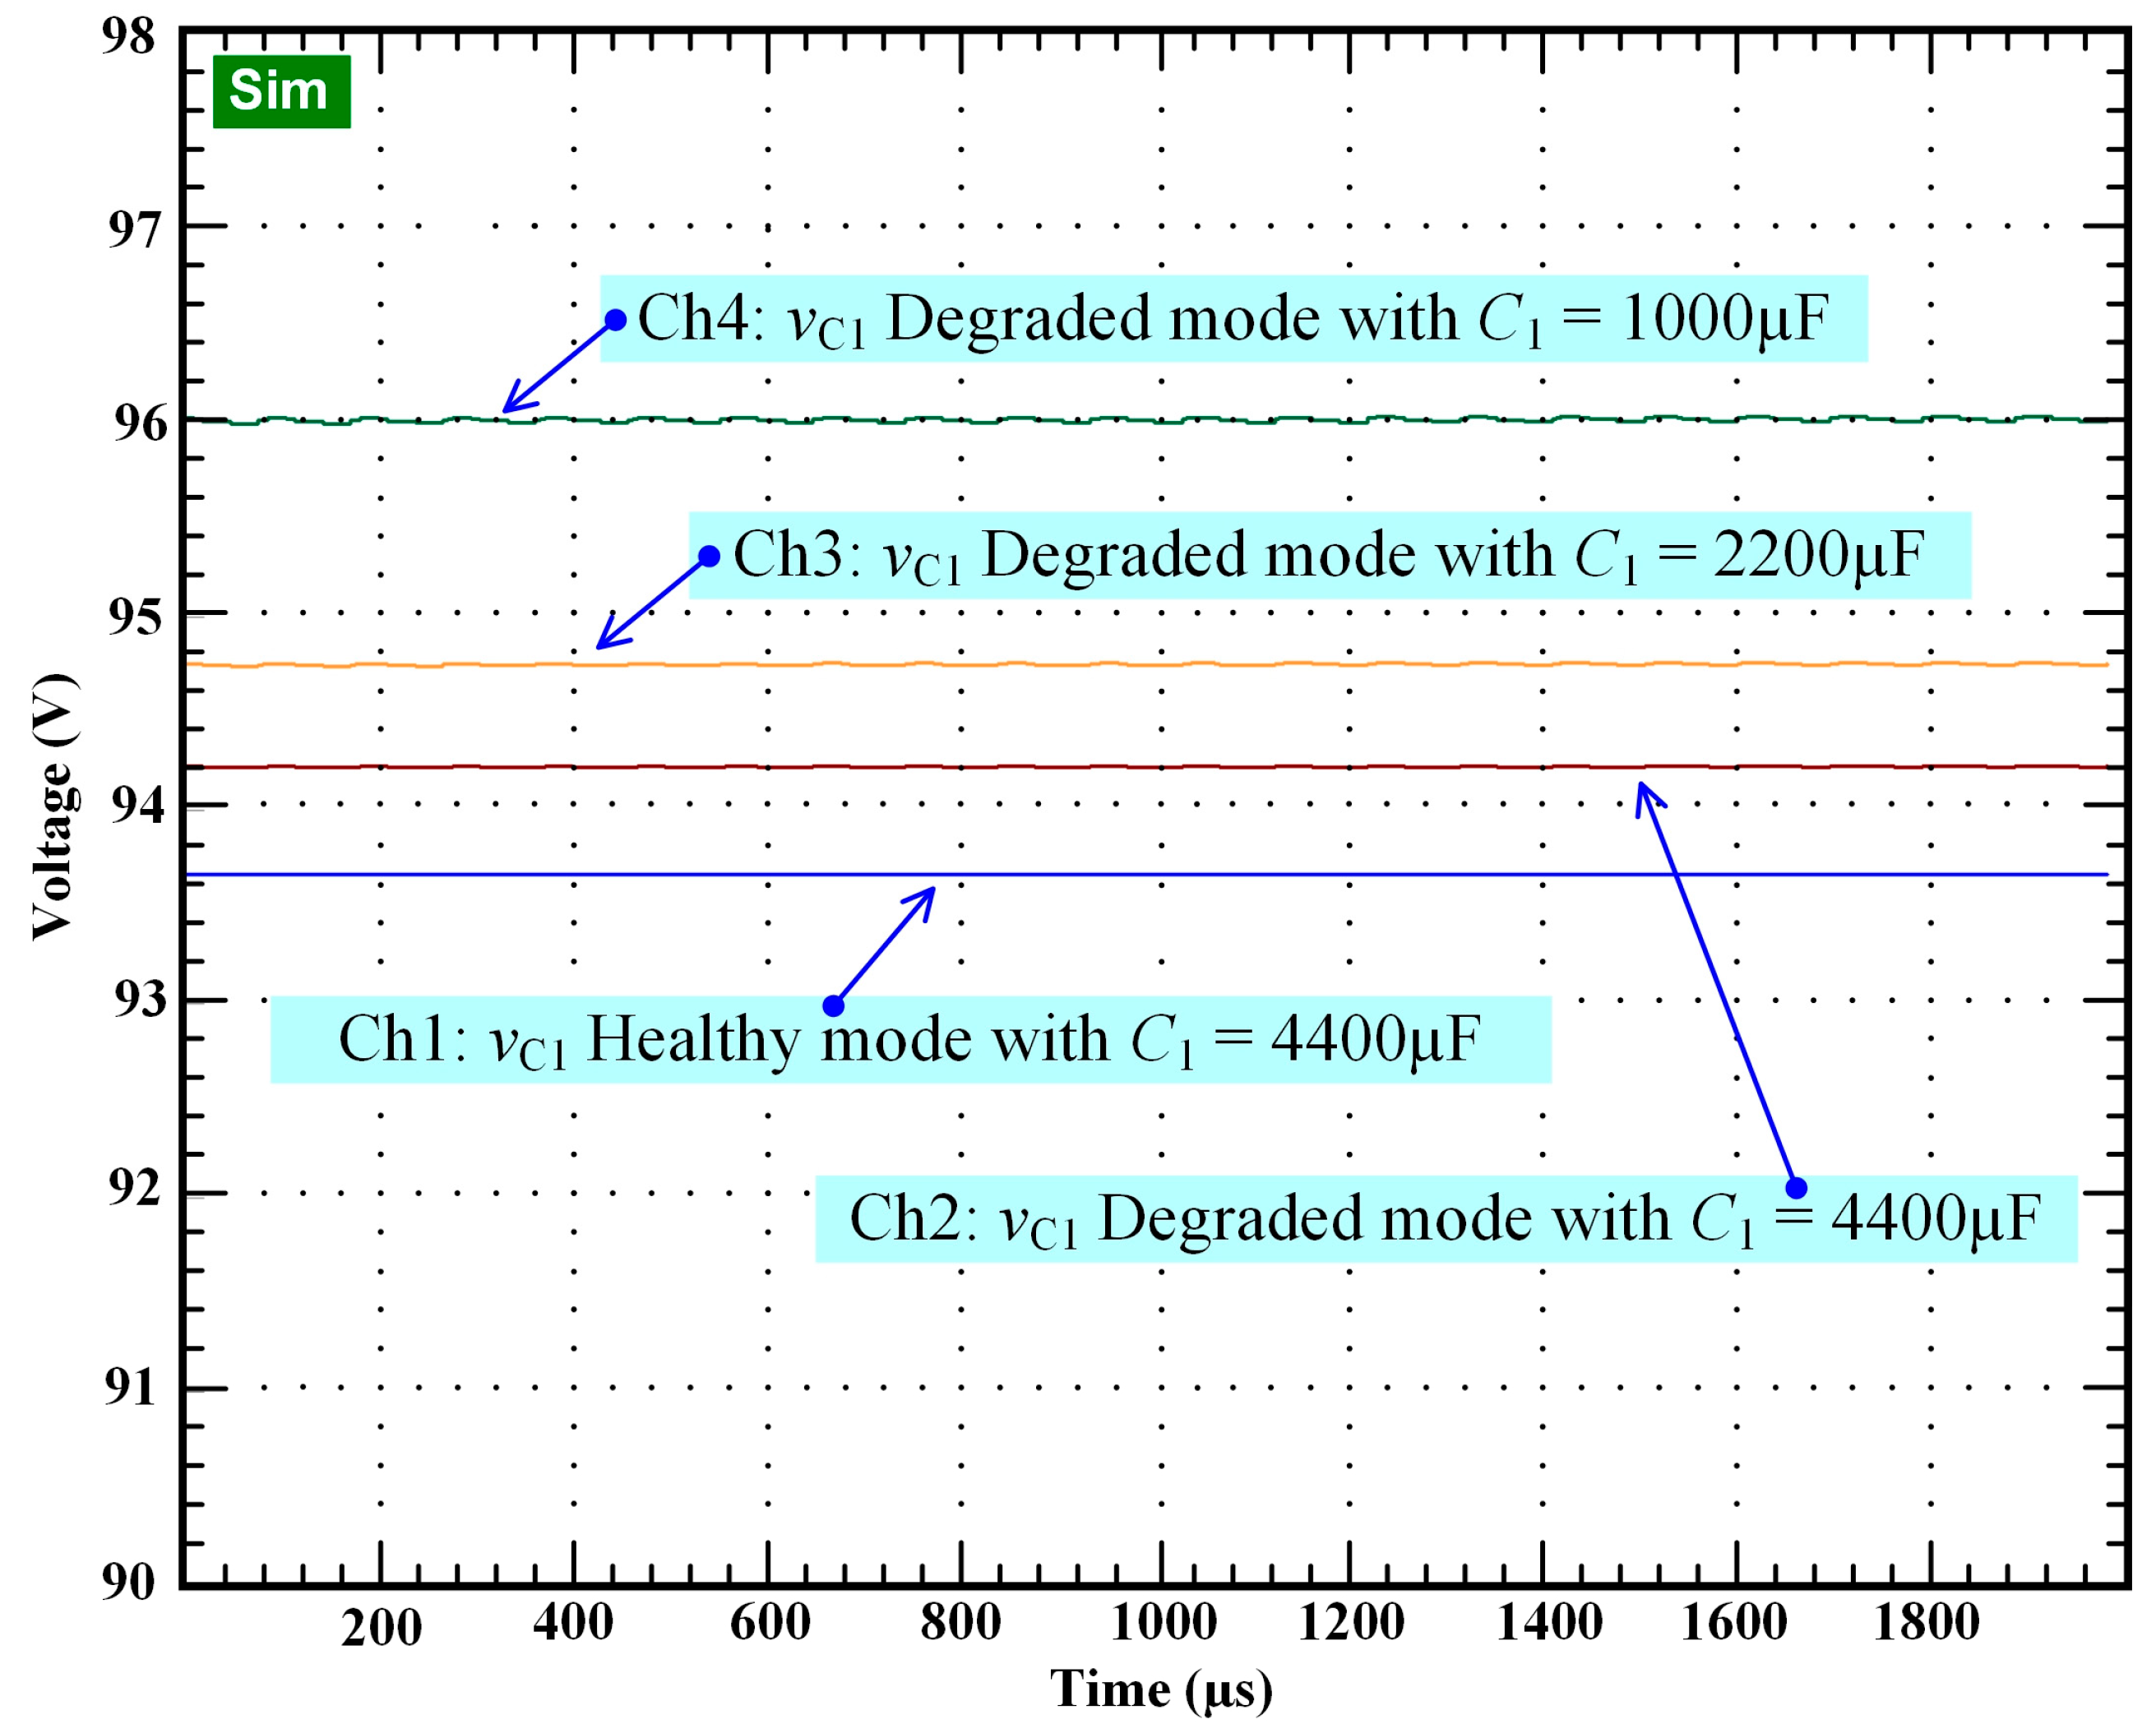
4. Simulation Results

Starting from the healthy operation shown in Figure 4a, this section shows the benefits of re-phase and compensation on the output current. For the sake of clarity, the effects of the re-phase and compensation methods are firstly shown separately. Then, a simulation by adopting both techniques is shown to demonstrate the complementarity of both solutions.
The currents flowing through the four inductors and the output currents, adopting the re-phase technique only, are given in Figure 7. Compared to the results of Figure 4b (fault mode with no control corrections), the output current ripple minimization can be appreciated.
By adopting the compensation technique only, as shown in Figure 8, it can be noticed that the compensation technique is able to restore the original value of the output current, meaning that the produced hydrogen is unchanged; however, an increased ripple can be noticed. As explained above, the ripple has to be minimized.
Finally, both the effects of re-phase and compensation are shown in Figure 9, where both the current and its ripple have resumed, as in the healthy mode.
Concerning the transient between the healthy and fault mode, as shown in Figure 10, it can be noticed that after 6 ms, the converter can operate as before the fault. The time constant is due mainly to the output capacitance. It is a very reduced time interval, in which the electrolyzed does not experience any overshoot.

5. Experimental Validation

5.1. Experimental Test Bench

To assess the performance of the fault diagnosis method in identifying the OCF and fault-tolerant control strategies, an experimental platform has been built at the Renewable Energy Research Centre (RERC), King Mongkut’s University of Technology North Bangkok; a picture of the test rig is given in Figure 11. The platform encompasses the designed TLIBC (1) with the technical specifications provided in Section 2, a DC power supply (2), a dSPACE Microlabbox (3), a computer with the dSPACE Control Desk Software (4), a C2000 Microcontroller (5), a PEM electrolyzer (6), and an 8-channel oscilloscope (7). For the load of the system, a PEM electrolyzer emulator described and designed in [50] has been employed in this work. This emulator enables the recreation of the static and dynamic behavior of a real PEM electrolyzer through the use of an equivalent electrical circuit as shown in Figure 12. Furthermore, it is low-cost and allows avoiding the use of a real PEM electrolyzer whose performance could be degraded during experiments as pointed out in [19,51]. The operation of the PEM emulator is based on its dynamic model as explained in the following.
The voltage VEL of the electrolyzer emulator is given by the following equation:
V E L = E r e v + V A C T , A + V A C T , C + V M
where E r e v is the reversible voltage, V A C T , A and V A C T , C are the activation overpotentials at the anode and cathode, respectively, and V M is the ohmic overvoltage. Both RC branches at the anode and cathode allow the consideration of the chemical kinetics that influence the speed of the chemical reaction when modifying the operating conditions (in our case, a change in the supply current). The equations that govern these chemical kinetics are summarized below:
d V A C T , A d t = 1 R A i E L 1 R A C A V A C T , A
d V A C T , C d t = 1 R C i E L 1 R C C C V A C T , C
The time constants at the anode and cathode, respectively, are expressed as follows:
τ A = R A C A
τ C = R C C C
In summary, the “essence of electrolysis” in our case is fully represented by our emulator since we demonstrated that it behaves like a real electrolyzer; as a consequence, we can adopt this circuit to test the dynamic performance of our converter. It is different from a simple electrolyzer model considering only the static behavior of the electrolyzer using a simple resistance [27]. A detailed description of the emulator can be found in [50].
The modified sliding mode-based controller (shown in Figure 3) designed in [49] to control the output current and balance the two input capacitors (C1, C2) of the TLIBC, has been implemented in the dSPACE Microlabbox (dSPACE, Paderborn, Germany) (through the use of Matlab/Simulink software (version 2019b). The proposed fault diagnosis (as presented in Figure 5) has been realized via an analog circuit including operational amplifiers. In comparison, fault-tolerant control strategies have been embedded in the C2000 Microcontroller. The dSPACE Control Desk Software (version 7.0) allows for the monitoring, supervising, and recording of the conducted experiments. The required current and voltage sensors for control and fault diagnosis purposes are inserted into the designed TLIBC. The acquired current and voltage signals are sent to the inputs of the dSPACE Microlabbox.

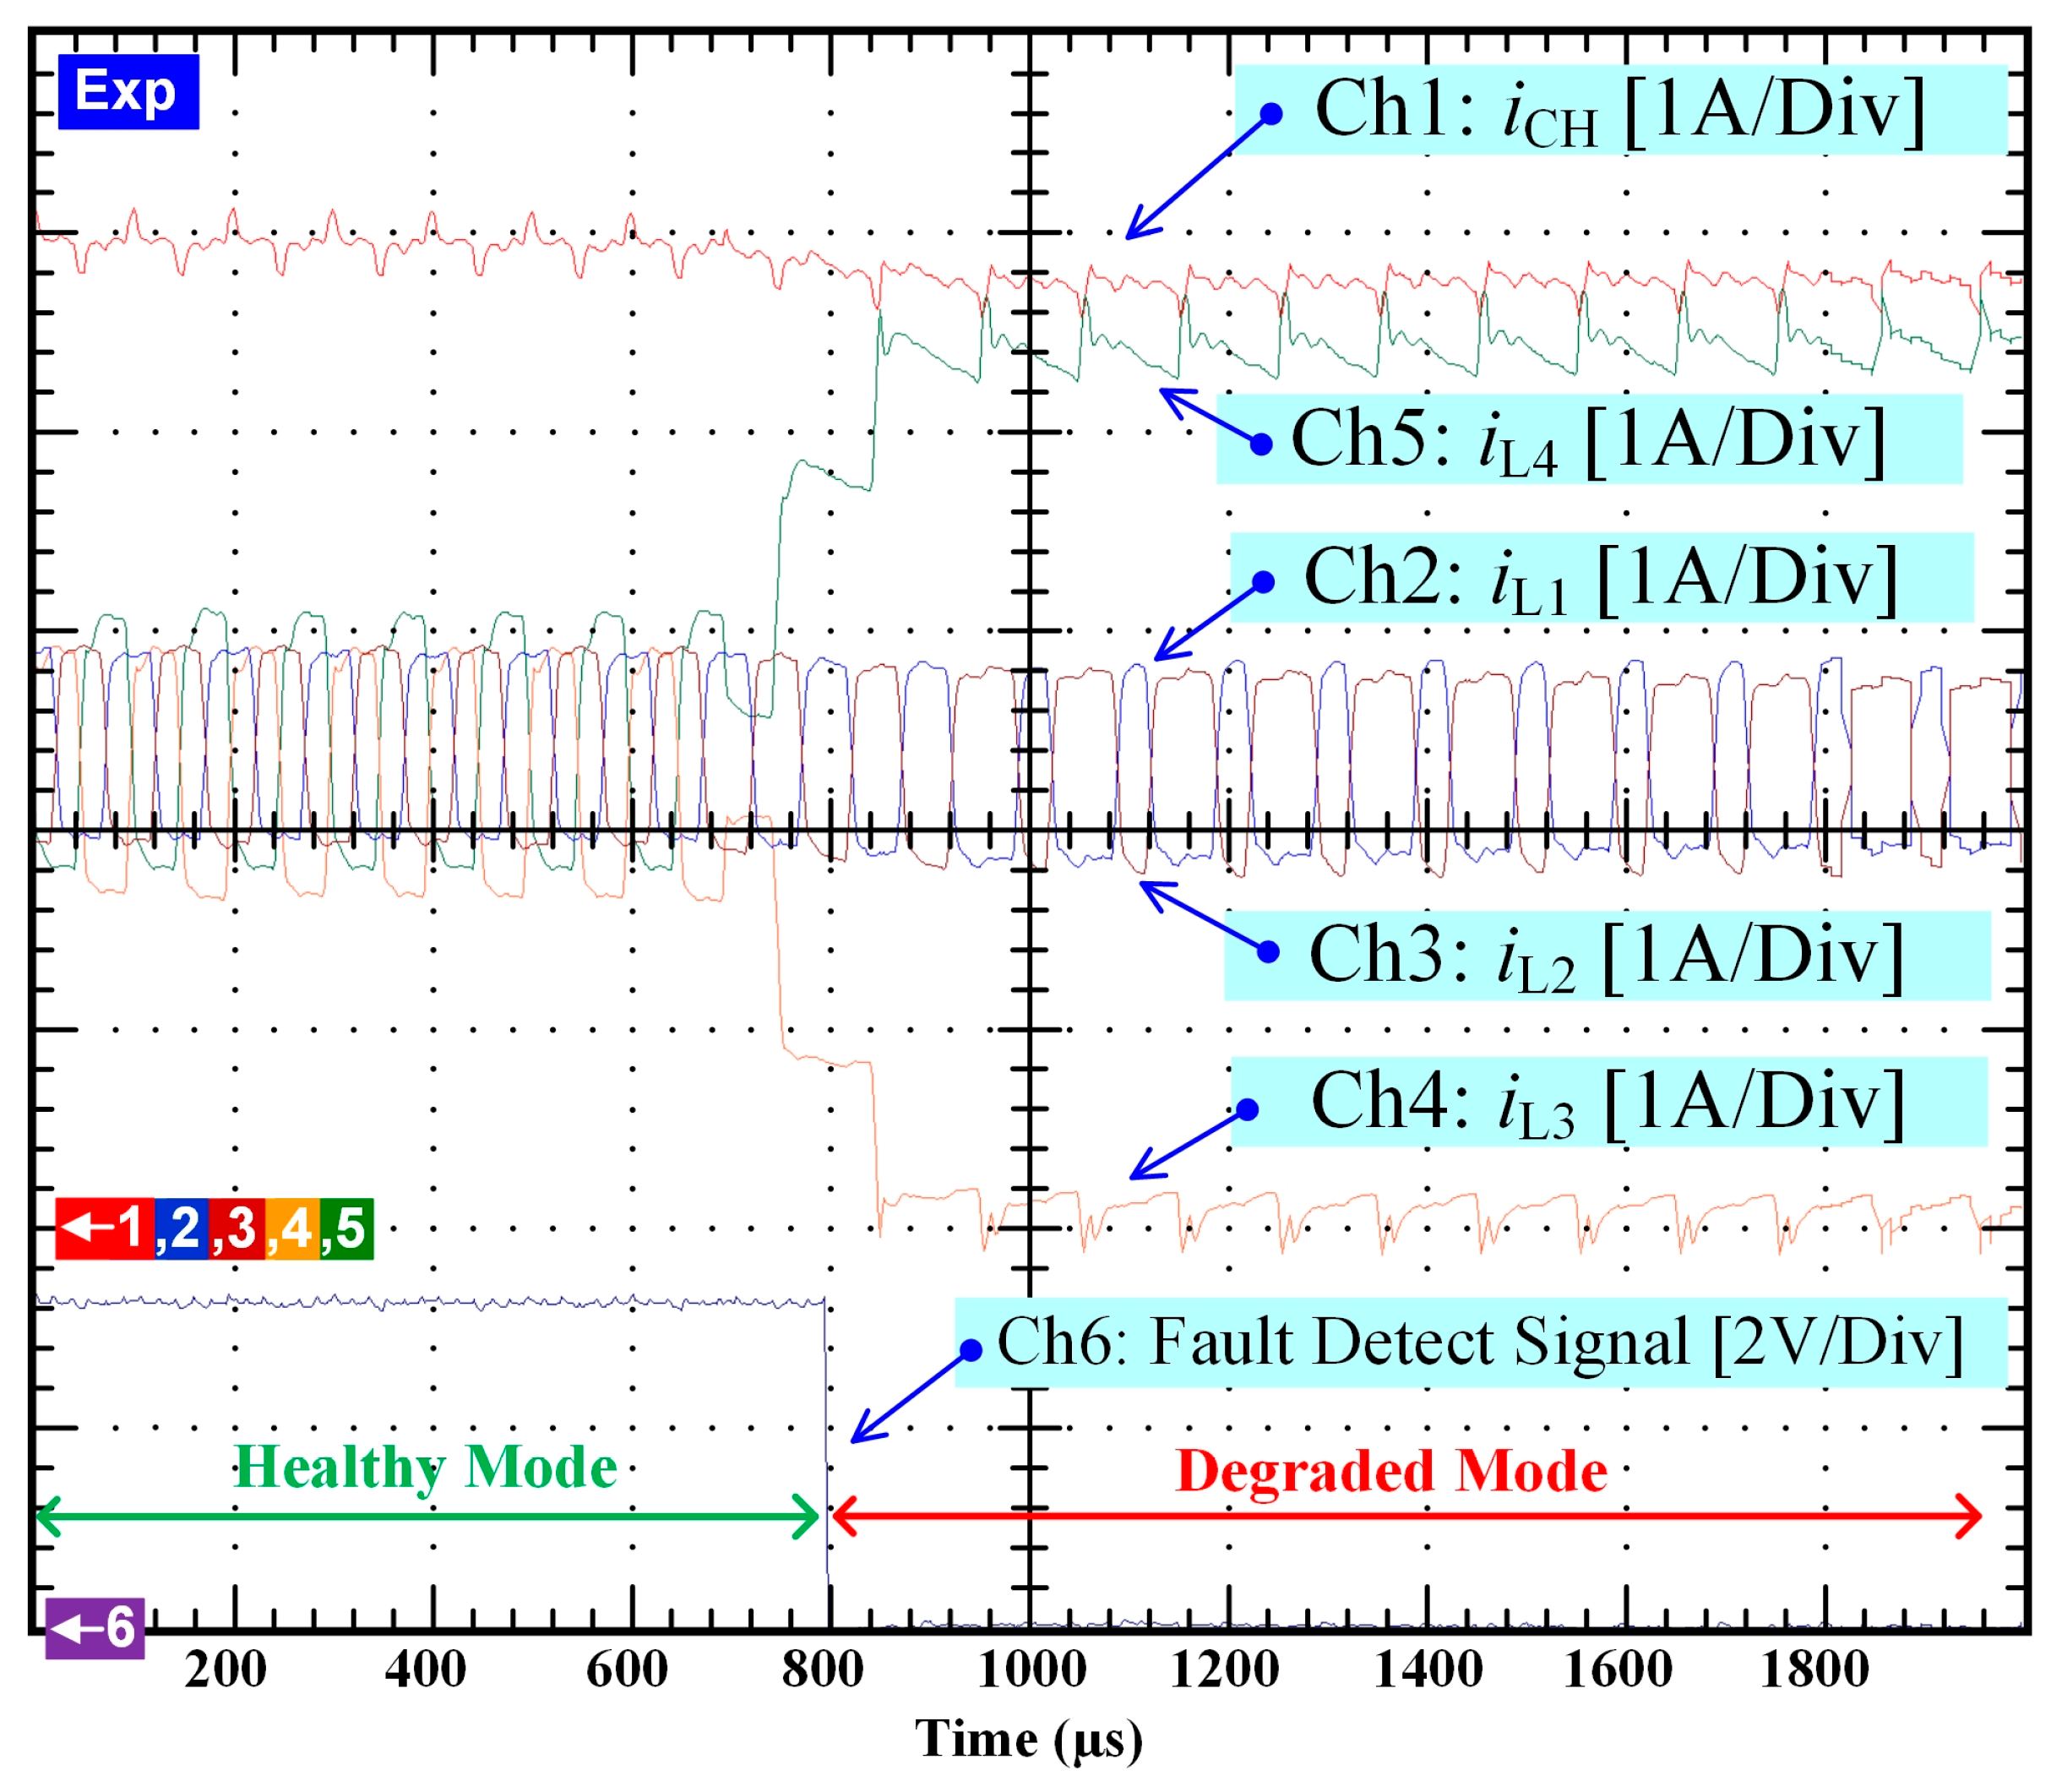
5.2. Obtained Experimental Results

After performing simulations through Matlab/Simulink, experimental tests have been carried out to corroborate the obtained simulation results. Moreover, the experimental results enable conclusions on the performance of the fault diagnosis coupled with fault-tolerant control strategies. Like in the simulations, an OCF in the power switch Q3 has been generated at 4 ms and the output current of the TLIBC is regulated at 5 A. The obtained experimental results are given in Figure 13, Figure 14 and Figure 15. In Figure 13 (relying on the fault diagnosis scheme given in Figure 5), the output “relay”, the output “AND GATE”, the output “XOR GATE”, and the Q ¯ output of the SR Flip Flop are depicted. Before the occurrence of the failure, the outputs “AND GATE” and “XOR GATE” indicate that the TLIBC operates in healthy mode as highlighted in Figure 5. Then, after fault occurrence at 400 µs, the absence of the outputs “AND GATE” and “XOR GATE” emphasizes that the TLIBC operates in degraded mode. The OCF in Q3 can be detected in one switching period, namely 100 µs, as shown in the Q ¯ output of the SR Flip Flop. Furthermore, it can be noticed that the reconfiguration of the phase shift between the remaining healthy switches (Q1, Q2, and Q4) occurs at 200 µs after fault occurrence.
In Figure 14 and Figure 15, the same experimental results of the TLIBC are shown with different time scales to point out both the transient and steady-state operations after the fault occurrence. Regarding both figures, it can be noted that after fault occurrence and identification of the OCF by the fault diagnosis, the TLIBC keeps operating normally and the output current is still regulated at 5 A. The transient state of the output current lasts 3 ms before reaching its reference value. The failure in Q3 is entirely compensated for by the power switch Q4 located in the faulty part (i.e., lower part of the TLIBC), whereas the power switches Q1 and Q2 are not affected by the failure in Q3 as observed in Figure 14. It can also be seen that the output current ripple in degraded operating mode is lower than in healthy operating mode due to the reconfiguration of the phase shift between the remaining power switches. Thus, the TLIBC continues to supply the electrolyzer with a very low current ripple at high switching frequency, contributing to its reliability in maintaining optimal performance [19].

6. Fault-Tolerant Architecture Design Considerations

It has been shown that by the re-phase and compensation method, it is possible to maintain the original operating conditions of the converter even if a fault on a power switch occurs. However, to ensure the converter’s reliability, some considerations of its design are necessary.

6.1. Power Switches Design

Figure 16 and Figure 17 show the currents flowing through the power switches and the related free-wheel diodes, respectively. The symmetry between complementary pairs (Q1-Q2 and Q3-Q4) can be noted. The currents correspond to the operation of a buck converter showing a peak of about 4.5 A for the power switches and 5 A for the free-wheel diodes. Clearly, after fault compensation and the related re-phase, the currents will show different values; this aspect must be taken into account for designing a fault-tolerant topology. While the hydrogen production is related to the mean current that is maintained by the fault-tolerant algorithm, the power devices are forced to support higher current peaks, as shown in Figure 18 and Figure 19. The maximum current peak represents a constraint for a correct choice of the devices; it can be noted that, as expected, the device belonging to the complementary pair in which a power switch experiences the fault (Q3 in our case) has to support higher current. Remarkably, both the power switch Q4 and the related free-wheel diode exhibit a peak of about 7.8 A. Concerning the design constraint, the rated current of the power switches in normal operation requires a safety factor equal to two.
Regarding efficiency, it can be noted that the conduction time of Q4 is slightly increased after the fault and the current is almost doubled. In the case of MOSFET devices, losses will be increased four times since they depend on the square of the current multiplied by the device conduction resistance RON; in contrast, for bipolar devices, such as IGBT, the conduction losses are doubled as well as losses on the free-wheel diode. The switching losses are doubled in Q4 since the final value of the current is doubled.
Considering that, as an example, for an IGBT-based converter, the power due to the loss before fault can be calculated as four times the sum of switching and conduction losses on power switches and free-wheel diodes, (indicated as Psw_Q, Pcond_Q, Psw_D, Pcpnd_D, respectively), and after fault, it results from the operation of the three remaining devices, it follows that the total power dissipated before fault PT_before_fault and after fault PT_after_fault can be calculated as:
P T _ before _ fault = 4 ( P sw _ Q + P sw D + P cond _ Q + P cond _ D ) 1 , 2 , 3 , 4
P T _ after _ fault = 2 ( P sw _ Q + P sw D + P cond _ Q + P cond _ D ) 1 , 2        + ( 2   P sw _ Q + 2   P sw D + 2   P cond _ Q + 2   P cond _ D ) 4
where the subscript n indicates the devices. After the fault on device 3, devices 1 and 2 continue with the same operation as before the fault, whereas device 4 has to support the total current. Since conduction losses in an IGBT linearly depend on the current as well as the switching losses, device 4 (Q4 and its free-wheel diode) is solicited with a power double compared to the condition before the fault. Obviously, this requires a proper choice of devices, as is discussed in more detail below.
For MOSFET-based converters, similar considerations can be made considering that the conduction losses depend on the square of the current; if the current in a device doubles, the power will be four times greater. As a consequence, only the conduction losses are increased.
P T _ after _ fault = 2 ( P sw _ Q + P sw D + P cond _ Q + P cond _ D ) 1 , 2        + ( 2   P sw _ Q + 2   P sw D + 4   P cond _ Q + 2   P cond _ D ) 4
In this case, the total losses after failure will be higher than before failure. In particular, the conduction losses on Q4 are increased.
These considerations can guide the designer to the correct sizing of the rated power of power devices and of the heatsink. In any case, taking into account the increased losses for MOSFET-based converters is feasible and does not jeopardize the design.

6.2. Power Inductor Design

To ensure the operation fault mode, the rated current of inductor currents L1, L2, L3, and L4 must correspond to the load-rated current. Even though in healthy mode, this current is halved compared to the load current, in fault mode, the inductor belonging to the complementary couple in which one device is in OCF has to support the total load current. On the other hand, their value depends on the imposed current variation, which does not need to be minimized since it is compensated by interleaved topology through L0/2 . As a consequence, even if 200 µH inductors are adopted in our prototype, a lower value could be employed, assuring the continuous conduction mode (CCM) operation.

6.3. Capacitor Design

The capacitive divider has the task of maintaining a reduced voltage compared to the input one. The optimal sizing can be achieved by assuring a low variation in the middle point after fault and, at the same time, a negligible voltage ripple. The experimental verification has been performed by using two capacitors of 4400 µF, available in the laboratory; however, by simulation, lower values have been tested as well. Figure 20 shows the voltage at the C1 terminals before fault considering a value of 4400 µF and the voltage after fault calculated with 4400 µF, 2200 µF, and 1000 µF, respectively. As expected, only a slight voltage increase is appreciated, decreasing the capacitance values; the voltage ripple remains negligible. As a consequence, the capacitive divider can be designed with lower capacitance values.

7. Conclusions

The design of the power converter devised for supplying electrolyzers must encompass, as a constraint, the feature of accommodating performance after fault to maintain the hydrogen production. The proposed converter topology fulfills this requirement. It is based on a three-level interleaved buck converter (TLIBC) and on a suitable architecture, which is able to detect a fault on a power device and to accommodate it assuring the same load current and ripple as before the fault.
The performance of the proposed TLIBC architecture has been verified by simulation and experimentally on a practical case of a converter loaded by a suitable electrolyzer emulator set-up on purpose by the authors. A fault on a power device is detected by a suitable diagnostic system in a very short time interval, then the control system provides accommodation by varying the phase displacement and the duty cycle so that the original operation is restored both in terms of DC load current and ripple. The DC component of the current delivered by the converter does not show significant variation after the fault accommodation, remaining equal to 8A in our case study, and its superimposed ripple goes from 0.1021 A to 0.1123 A peak-to-peak. The electrolyzer is always protected against fault consequences and no overshoots occur.

Author Contributions

Conceptualization, B.Y., S.S., D.G., M.H., M.P., W.K. and G.V.; methodology, B.Y., S.S., D.G., M.H., M.P., W.K. and G.V.; validation, B.Y., S.S. and D.G.; investigation, B.Y., D.G. and M.P.; writing—original draft preparation, D.G. and G.V.; writing—review and editing, B.Y., D.G., M.H. and G.V. All authors have read and agreed to the published version of the manuscript.

Funding

This work was supported in part by an International Research Partnership “Electrical Engineering—Thai French Research Center (EE-TFRC)” under the project framework of the Lorraine Université d’Excellence (LUE) in cooperation between Université de Lorraine and King Mongkut’s University of Technology North Bangkok (KMUTNB), in part by the National Research Council of Thailand (NRCT) under Senior Research Scholar Program under Grant No. N42A640328, and in part by King Mongkut’s University of Technology North Bangkok under grant KMUTNB-66-KNOW-10.

Data Availability Statement

The data presented in this study are available on request from the corresponding author.

Acknowledgments

The authors would like to sincerely thank Surin Tohtubtiang, distinguished Member of the KMUTNB council committee, in supporting Burin Yodwong’s Ph.D. thesis. Furthermore, the authors would like to address their heartfelt acknowledgments to the Thai French innovation institute of KMUTNB, the GREEN laboratory of the University of Lorraine, and the Italian National Research Council for their constant support in research cooperation with Thailand, France, and Italy.

Conflicts of Interest

The authors declare no conflict of interest.

References

  1. Ritchie, H.; Roser, M.; Rosado, P. CO2 and Greenhouse Gas Emissions. Our World Data. 2020. Available online: https://ourworldindata.org/co2-and-greenhouse-gas-emissions (accessed on 8 March 2023).
  2. Yue, M.; Lambert, H.; Pahon, E.; Roche, R.; Jemei, S.; Hissel, D. Hydrogen energy systems: A critical review of technologies, applications, trends and challenges. Renew. Sustain. Energy Rev. 2021, 146, 111180. [Google Scholar] [CrossRef]
  3. Guilbert, D.; Vitale, G. Hydrogen as a Clean and Sustainable Energy Vector for Global Transition from Fossil-Based to Zero-Carbon. Clean Technol. 2021, 3, 881–909. [Google Scholar] [CrossRef]
  4. Pleshivtseva, Y.; Derevyanov, M.; Pimenov, A.; Rapoport, A. Comprehensive review of low carbon hydrogen projects towards the decarbonization pathway. Int. J. Hydrogen Energy 2023, 48, 3703–3724. [Google Scholar] [CrossRef]
  5. Ozturk, M.; Dincer, I. A comprehensive review on power-to-gas with hydrogen options for cleaner applications. Int. J. Hydrogen Energy 2021, 46, 31511–31522. [Google Scholar] [CrossRef]
  6. Buttler, A.; Spliethoff, H. Current status of water electrolysis for energy storage, grid balancing and sector coupling via power-to-gas and power-to-liquids: A review. Renew. Sustain. Energy Rev. 2018, 82, 2440–2454. [Google Scholar] [CrossRef]
  7. Massaro, M.C.; Biga, R.; Kolisnichenko, A.; Marocco, P.; Monteverde, A.H.A.; Santarelli, M. Potential and technical challenges of on-board hydrogen storage technologies coupled with fuel cell systems for aircraft electrification. J. Power Source 2023, 555, 232397. [Google Scholar] [CrossRef]
  8. Brauns, J.; Turek, T. Alkaline Water Electrolysis Powered by Renewable Energy: A Review. Processes 2020, 8, 248. [Google Scholar] [CrossRef] [Green Version]
  9. Keddar, M.; Zhang, Z.; Periasamy, C.; Doumbia, M.L. Power quality improvement for 20 MW PEM water electrolysis system. Int. J. Hydrogen Energy 2022, 47, 40184–40195. [Google Scholar] [CrossRef]
  10. Kupecki, J.; Niemczyk, A.; Jagielski, S.; Kluczowski, R.; Kosiorek, M.; Machaj, K. Boosting solid oxide electrolyzer performance by fine tuning the microstructure of electrodes—Preliminary study. Int. J. Hydrogen Energy 2022, in press. [Google Scholar] [CrossRef]
  11. Xu, Q.; Zhang, L.; Zhang, J.; Wang, J.; Hu, Y.; Jiang, H.; Li, C. Anion Exchange Membrane Water Electrolyzer: Electrode Design, Lab-Scaled Testing System and Performance Evaluation. EnergyChem 2022, 4, 100087. [Google Scholar] [CrossRef]
  12. Koponen, J.; Poluektov, A.; Ruuskanen, V.; Kosonen, A.; Niemelä, M.; Ahola, J. Comparison of thyristor and insulated-gate bipolar transistor -based power supply topologies in industrial water electrolysis applications. J. Power Source 2021, 491, 229443. [Google Scholar] [CrossRef]
  13. Speckmann, F.-W.; Bintz, S.; Birke, K.P. Influence of rectifiers on the energy demand and gas quality of alkaline electrolysis systems in dynamic operation. Appl. Energy 2019, 250, 855–863. [Google Scholar] [CrossRef]
  14. Combe, Q.; Abasian, A.; Pierfederici, S.; Weber, M.; Dufour, S. Control of a Three-Phase Current Source Rectifier for H2 Storage Applications in AC Microgrids. Energies 2022, 15, 2436. [Google Scholar] [CrossRef]
  15. Yodwong, B.; Guilbert, D.; Phattanasak, M.; Kaewmanee, W.; Hinaje, M.; Vitale, G. AC-DC Converters for Electrolyzer Applications: State of the Art and Future Challenges. Electronics 2020, 9, 912. [Google Scholar] [CrossRef]
  16. Chen, M.; Chou, S.-F.; Blaabjerg, F.; Davari, P. Overview of Power Electronic Converter Topologies Enabling Large-Scale Hydrogen Production via Water Electrolysis. Appl. Sci. 2022, 12, 1906. [Google Scholar] [CrossRef]
  17. Koponen, J.; Ruuskanen, V.; Kosonen, A.; Niemelä, M.; Ahola, J. Effect of Converter Topology on the Specific Energy Consumption of Alkaline Water Electrolyzers. IEEE Trans. Power Electron. 2019, 34, 6171–6182. [Google Scholar] [CrossRef]
  18. Buitendach, H.P.C.; Gouws, R.; Martinson, C.A.; Minnaar, C.; Bessarabov, D. Effect of a ripple current on the efficiency of a PEM electrolyser. Results Eng. 2021, 10, 100216. [Google Scholar] [CrossRef]
  19. Parache, F.; Schneider, H.; Turpin, C.; Richet, N.; Debellemanière, O.; Bru, É.; Thieu, A.T.; Bertail, C.; Marot, C. Impact of Power Converter Current Ripple on the Degradation of PEM Electrolyzer Performances. Membranes 2022, 12, 109. [Google Scholar] [CrossRef]
  20. Järvinen, L.; Ruuskanen, V.; Koponen, J.; Kosonen, A.; Ahola, J.; Hehemann, M. Implementing a power source to study the effect of power quality on the PEM water electrolyzer stack. In Proceedings of the 2019 21st European Conference on Power Electronics and Applications (EPE ’19 ECCE Europe), Genova, Italy, 3–5 September 2019; pp. 1–8. [Google Scholar]
  21. Zhang, K.; Liang, X.; Wang, L.; Sun, K.; Wang, Y.; Xie, Z.; Wu, Q.; Bai, X.; Hamdy, M.S.; Chen, H.; et al. Status and perspectives of key materials for PEM electrolyzer. Nano Res. Energy 2022, 1, e9120032. [Google Scholar] [CrossRef]
  22. Gorji, S.A. Reconfigurable Quadratic Converters for Electrolyzers Utilized in DC Microgrids. IEEE Access 2022, 10, 109677–109687. [Google Scholar] [CrossRef]
  23. Nguyen, B.L.H.; Panwar, M.; Hovsapian, R.; Nagasawa, K.; Vu, T.V. Power Converter Topologies for Electrolyzer Applications to Enable Electric Grid Services. In Proceedings of the IECON 2021—47th Annual Conference of the IEEE Industrial Electronics Society, Toronto, ON, Canada, 13–16 October 2021; pp. 1–6. [Google Scholar]
  24. Nguyen, B.L.H.; Panwar, M.; Hovsapian, R.; Agalgaokar, Y.; Vu, T. Hierarchical Control of Grid-Connected Hydrogen Electrolyzer Providing Grid Services. arXiv 2022. [Google Scholar] [CrossRef]
  25. Babayomi, O.; Zhang, Z.; Dragicevic, T.; Heydari, R.; Li, Y.; Garcia, C.; Rodriguez, J.; Kennel, R. Advances and opportunities in the model predictive control of microgrids: Part II–Secondary and tertiary layers. Int. J. Electr. Power Energy Syst. 2022, 134, 107339. [Google Scholar] [CrossRef]
  26. Guilbert, D.; Vitale, G. Dynamic Emulation of a PEM Electrolyzer by Time Constant Based Exponential Model. Energies 2019, 12, 750. [Google Scholar] [CrossRef] [Green Version]
  27. Guilbert, D.; Sorbera, D.; Vitale, G. A stacked interleaved DC-DC buck converter for proton exchange membrane electrolyzer applications: Design and experimental validation. Int. J. Hydrogen Energy 2020, 45, 64–79. [Google Scholar] [CrossRef]
  28. Peyghami, S.; Palensky, P.; Blaabjerg, F. An Overview on the Reliability of Modern Power Electronic Based Power Systems. IEEE Open J. Power Electron. 2020, 1, 34–50. [Google Scholar] [CrossRef] [Green Version]
  29. Peyghami, S.; Blaabjerg, F.; Palensky, P. Incorporating Power Electronic Converters Reliability Into Modern Power System Reliability Analysis. IEEE J. Emerg. Sel. Top. Power Electron. 2021, 9, 1668–1681. [Google Scholar] [CrossRef]
  30. Mohsenzade, S.; Naghibi, J.; Mehran, K. Reliability Enhancement of Power IGBTs under Short-Circuit Fault Condition Using Short-Circuit Current Limiting-Based Technique. Energies 2021, 14, 7397. [Google Scholar] [CrossRef]
  31. K, P.S.; Vijayakumar, T. Review of Fault Tolerant Power Converters Deployed in Critical Applications. In Proceedings of the 2021 Second International Conference on Electronics and Sustainable Communication Systems (ICESC), Coimbatore, India, 4–6 August 2021; pp. 306–311. [Google Scholar]
  32. Bento, F.; Marques Cardoso, A.J. A comprehensive survey on fault diagnosis and fault tolerance of DC-DC converters. Chin. J. Electr. Eng. 2018, 4, 1–12. [Google Scholar] [CrossRef]
  33. Jamshidpour, E.; Poure, P.; Saadate, S. Common Switch Fault Diagnosis for Two-Stage DC-DC Converters Used in Energy Harvesting Applications. Electronics 2019, 8, 293. [Google Scholar] [CrossRef] [Green Version]
  34. Zhuo, S.; Gaillard, A.; Xu, L.; Liu, C.; Paire, D.; Gao, F. An Observer-Based Switch Open-Circuit Fault Diagnosis of DC–DC Converter for Fuel Cell Application. IEEE Trans. Ind. Appl. 2020, 56, 3159–3167. [Google Scholar] [CrossRef]
  35. Liu, Z.; Xu, Z.; Zhang, X. A Novel Real-Time Fast Fault-Tolerance Diagnosis and Fault Adjustment Strategy for m-Phase Interleaved Boost Converter. IEEE Access 2021, 9, 11776–11786. [Google Scholar] [CrossRef]
  36. Li, C.; Yu, Y.; Tang, T.; Liu, Q.; Peng, X. A Robust Open-Circuit Fault Diagnosis Method for Three-Phase Interleaved Boost Converter. IEEE Trans. Power Electron. 2022, 37, 11187–11198. [Google Scholar] [CrossRef]
  37. Li, P.; Li, X.; Zeng, T. A Fast and Simple Fault Diagnosis Method for Interleaved DC-DC Converters Based on Output Voltage Analysis. Electronics 2021, 10, 1451. [Google Scholar] [CrossRef]
  38. Bento, F.; Marques Cardoso, A.J. Open-Circuit Fault Diagnosis and Fault Tolerant Operation of Interleaved DC–DC Boost Converters for Homes and Offices. IEEE Trans. Ind. Appl. 2019, 55, 4855–4864. [Google Scholar] [CrossRef]
  39. Wassinger, N.; Penovi, E.; Retegui, R.G.; Maestri, S. Open-Circuit Fault Identification Method for Interleaved Converters Based on Time-Domain Analysis of the State Observer Residual. IEEE Trans. Power Electron. 2019, 34, 3740–3749. [Google Scholar] [CrossRef]
  40. Xu, L.; Ma, R.; Xie, R.; Xu, J.; Huangfu, Y.; Gao, F. Open-Circuit Switch Fault Diagnosis and Fault- Tolerant Control for Output-Series Interleaved Boost DC–DC Converter. IEEE Trans. Transp. Electrif. 2021, 7, 2054–2066. [Google Scholar] [CrossRef]
  41. Zhuo, S.; Xu, L.; Gaillard, A.; Huangfu, Y.; Paire, D.; Gao, F. Robust Open-Circuit Fault Diagnosis of Multi-Phase Floating Interleaved DC–DC Boost Converter Based on Sliding Mode Observer. IEEE Trans. Transp. Electrif. 2019, 5, 638–649. [Google Scholar] [CrossRef]
  42. Fu, H.; Duan, S.; Bao, J.; Jiang, D.; Fu, H.; Li, Q. Asymmetric Fault-Tolerant Control of 3-Phase Coupled Buck–Boost Converter. Electronics 2022, 11, 2252. [Google Scholar] [CrossRef]
  43. Mahdavi, M.S.; Karimzadeh, M.S.; Rahimi, T.; Gharehpetian, G.B. A Fault-Tolerant Bidirectional Converter for Battery Energy Storage Systems in DC Microgrids. Electronics 2023, 12, 679. [Google Scholar] [CrossRef]
  44. Guo, X.; Zhang, S.; Liu, Z.; Sun, L.; Lu, Z.; Hua, C.; Guerrero, J.M. A new multi-mode fault-tolerant operation control strategy of multiphase stacked interleaved Buck converter for green hydrogen production. Int. J. Hydrogen Energy 2022, 47, 30359–30370. [Google Scholar] [CrossRef]
  45. Guida, V.; Guilbert, D.; Vitale, G.; Douine, B. Design and Realization of a Stacked Interleaved DC–DC Step-Down Converter for PEM Water Electrolysis with Improved Current Control. Fuel Cells 2020, 20, 307–315. [Google Scholar] [CrossRef]
  46. Concha, D.; Renaudineau, H.; Hernández, M.S.; Llor, A.M.; Kouro, S. Evaluation of DCX converters for off-grid photovoltaic-based green hydrogen production. Int. J. Hydrog. Energy 2021, 46, 19861–19870. [Google Scholar] [CrossRef]
  47. Koundi, M.; Fadil, H.E.; Nady, S.; Intidam, A.; Bentalhik, I.; Hizoune, R. hydrogen flow rate control using an adaptive output feedback second-order sliding mode control for hydrogen production by PEM EL. IFAC-Pap. 2022, 55, 282–287. [Google Scholar] [CrossRef]
  48. Zhang, C.; Wang, J.; Pan, Y.; Diao, Y.; Li, D. A DC/DC Converter for Electrolytic Hydrogen Production Based on DC Microgrid. In Proceedings of the 2022 IEEE International Power Electronics and Application Conference and Exposition (PEAC), Guangzhou, Guangdong, China, 4–7 November 2022; pp. 1348–1353. [Google Scholar]
  49. Yodwong, B.; Guilbert, D.; Kaewmanee, W.; Phattanasak, M.; Hinaje, M.; Vitale, G. Modified Sliding Mode-Based Control of a Three-Level Interleaved DC-DC Buck Converter for Proton Exchange Membrane Water Electrolysis. In Proceedings of the 2021 Research, Invention, and Innovation Congress: Innovation Electricals and Electronics (RI2C), Bangkok, Thailand, 1–3 September 2021; pp. 221–226. [Google Scholar]
  50. Yodwong, B.; Guilbert, D.; Hinaje, M.; Phattanasak, M.; Kaewmanee, W.; Vitale, G. Proton Exchange Membrane Electrolyzer Emulator for Power Electronics Testing Applications. Processes 2021, 9, 498. [Google Scholar] [CrossRef]
  51. Papakonstantinou, G.; Algara-Siller, G.; Teschner, D.; Vidaković-Koch, T.; Schlögl, R.; Sundmacher, K. Degradation study of a proton exchange membrane water electrolyzer under dynamic operation conditions. Appl. Energy 2020, 280, 115911. [Google Scholar] [CrossRef]
Figure 1. Three-level interleaved buck converter investigated in this work.
Electronics 12 01349 g001
Figure 2. Principle of operation of the three-level interleaved buck converter.
Electronics 12 01349 g002
Figure 3. Schematic diagram of studied modified sliding mode control.
Electronics 12 01349 g003
Figure 4. Simulation results: (a) healthy operation 1; (b) operation when an OCF occurs with unmodified control showing a performance degradation in terms of the output current.
Electronics 12 01349 g004
Figure 5. A schematic diagram of the developed fault diagnosis method of phase 3.
Electronics 12 01349 g005
Figure 6. The diagram of proposed fault diagnosis method in case of an OCF in phase 3.
Electronics 12 01349 g006
Figure 7. Simulation results: TLIBC performance with re-phase technique only.
Electronics 12 01349 g007
Figure 8. Simulation results: TLIBC performance with compensation technique only.
Electronics 12 01349 g008
Figure 9. Simulation results: TLIBC performance with compensation and re-phase technique.
Electronics 12 01349 g009
Figure 10. Simulation results: transient after fault detection with re-phase and compensation.
Electronics 12 01349 g010
Figure 11. Developed experimental platform to validate the proposed fault diagnosis method and fault-tolerant control strategies.
Electronics 12 01349 g011
Figure 12. Equivalent electrical circuit of the electrolyzer emulator.
Electronics 12 01349 g012
Figure 13. Experimental results: outputs of the fault diagnosis scheme to detect the failure.
Electronics 12 01349 g013
Figure 14. Obtained experimental results showing the transient and accommodation after fault.
Electronics 12 01349 g014
Figure 15. Obtained experimental results: zoom to observe the transient operation after fault occurrence.
Electronics 12 01349 g015
Figure 16. Simulation results: power switch currents in healthy mode.
Electronics 12 01349 g016
Figure 17. Simulation results: free-wheel diode currents in healthy mode.
Electronics 12 01349 g017
Figure 18. Simulation results: power switch currents in faulty mode.
Electronics 12 01349 g018
Figure 19. Simulation results: free-wheel diode currents in faulty mode.
Electronics 12 01349 g019
Figure 20. Voltage across C1 terminals before and after fault, calculated with different values of the capacitance.
Electronics 12 01349 g020
Table 1. Synthesis of the technical specifications and controller parameters of the studied TLIBC.
ComponentValueUnit
Inductor L 1 = L 2 = L 3 = L 4 200µH
Inductor L 0 / 2 800µH
Input Capacitors C 1 = C 2 4400µF
Output Capacitor C 0 3300µF
Sampling Frequency10kHz
k i = λ i 1256-
k V = λ V 125-
Table 2. Fault-tolerant control strategies of PWM tracking phase failure showing the phase correction added to the value corresponding to the healthy mode.
Phase FailureNew Phase Shift Angle to Decrease Current Ripple [Rad]
Q1Q2Q3Q4
Phase 1-π + π/6 π / 2 3 π / 2 + π/3
Phase 20- π / 2 + π/6 3 π / 2 − π/6
Phase 30π − π/3- 3 π / 2 − π/6
Phase 40π + π/3 π / 2 + π/6-
Disclaimer/Publisher’s Note: The statements, opinions and data contained in all publications are solely those of the individual author(s) and contributor(s) and not of MDPI and/or the editor(s). MDPI and/or the editor(s) disclaim responsibility for any injury to people or property resulting from any ideas, methods, instructions or products referred to in the content.

