1. Introduction
The Internet of Things (IoT) is a network of sensors that facilitates the exchange of data between various types of smart devices, such as mobile phones, refrigerators, watches, fire alarms, locks, bicycles, medical sensors, fitness trackers, and security systems. As more and more homes and businesses adopt IoT devices, a significant number of interconnected devices transforms the way data are utilized and consumed. While the popularity of IoT continues to rise, the risks related to its security are increasing [
1].
The field of IoT is expanding quickly, enabling devices to communicate and share information. Among the trending technologies employed in IoT, IPv6 over Low-Power Wireless Personal Area Network (6LoWPAN) is particularly noteworthy as it offers an affordable and energy-efficient networking solution for IoT devices. Despite its benefits, 6LoWPAN is susceptible to security risks, particularly routing attacks, which can cause considerable harm to IoT systems by interrupting communication between devices, exposing data confidentiality and integrity, and triggering device malfunctions [
2].
Detecting attacks on the routing system of 6LoWPAN-based IoT devices can be difficult due to several factors such as the limited resources of the devices, the constantly changing network topology, and the different ways in which an attack can occur. To address this issue, various techniques such as anomaly detection, intrusion detection, and machine learning-based methods have been developed in recent years. These methods use different features of the network traffic, such as routing metrics, packet header information, and traffic patterns, to identify and classify routing attacks. This article specifically focuses on RPL protocol, which is a target of routing attacks. The attacks on RPL can be divided into two categories: those inherited from WSNs and those that exploit vulnerabilities unique to RPL (known as RPL-specific attacks). These attacks mainly target layer 3 of the OSI model, and this article describes several RPL attacks including Flood Attacks, Data-DoS/DDoS Attacks, Wormhole Attacks, RPL Rank Attacks, Blackhole Attacks, Version Attacks, and Sinkhole Attacks [
3].
The Intrusion Detection System (IDS) technology has initially been designed for conventional networks, and thus the existing methods of developing IDSs for IoT are unable to identify various types of intrusions for the following reasons. First, the recent IDSs protect against known as security threats, so they are beaten by the new types of malware used by cybercriminals as they can escape conventional systems [
4,
5]. For example, a high quantity of Distributed Denial-of-Service (DDoS) attacks uses methods that trick source IP addresses to conceal attacks; therefore, they become unnoticeable by conventional IDSs. Second, IoT systems become extremely diverse in terms of devices, platforms, communication techniques, and protocols [
6]. Thirdly, one more significant matter is the feature related to IoT network design. In conventional networks, the devices are entirely connected to specific device sensors that are responsible for sending packets to the endpoints. In contrast, the IoT system connects with various devices and actuators to achieve various checking and management tasks. There are substantial additional kinds of IoT sensors and many forms of networks other than conventional networks. Consequently, using conventional IDSs in an IoT system is difficult because of their limited features, such as restricted source devices and network needs.
In recent years, numerous incidents involving IoT (Internet of Things) devices, such as brute-force attacks, privilege escalation attacks, IoT ransomware, IoT botnets, and DNS threats. To counteract such threats, Intrusion Detection Systems (IDSs) have been developed as an additional layer of protection against abnormal activity. However, deploying a traditional IDS system directly onto IoT networks is not feasible due to the unique characteristics of IoT networks. IoT devices are typically resource-constrained, with limited power, computing, communication, and storage capabilities. Therefore, existing security techniques need to be simplified, optimized, and adapted to suit IoT networks. Additionally, IoT networks use different protocol stacks and standards, which require the development of corresponding security mechanisms [
7].
There are various dangers associated with IoT devices, and protecting them requires identifying when they are being attacked. Intrusion detection is necessary for such situations. For instance, a hacker may infiltrate an IoT device in a hospital network and insert malware to gain access to the sensitive medical, personal, and financial information of patient’s data. In another example, the Black Energy malware targets industrial control systems (ICSs). Hackers may use the fixed network on a flight to gain control of an airplane’s network, or even use light bulbs as an entry point to a corporate network. Unfortunately, in such scenarios, these devices cannot determine whether they are under attack, and may process or discard the packets they receive without any knowledge of whether they are legitimate or malicious. Static networks are particularly vulnerable because there are only a few IP addresses to exploit. Since IoT devices are regularly targeted and can serve as a gateway to other devices on the network, proper intrusion detection is of the utmost importance.
The hybrid Intrusion Detection System (IDS) is created to overcome the limitations of Single IDS (SIDS) and Aggregation IDS (AIDS) when detecting routing attacks. The goal of the hybrid IDS is to use the advantages of both techniques and address the limitations of SIDSs, while also leveraging the lower processing cost of AIDS. Since traditional IDSs are insufficient in detecting various attacks in IoT systems and consume a considerable amount of memory and processing resources, our approach employs AIDS to identify zero-day routing attacks and SIDS to recognize known attacks. By combining the strengths of both techniques, our approach aims to produce a more resilient IDS. To achieve higher accuracy, the boosting technique is utilized to combine multiple classifiers. SIDS is based on the popular C4.5 decision tree classifier, which employs nodes to form a directed tree structure. Conversely, AIDS is based on a one-class Support Vector Machine that employs known attacks on data to build profiles of normal behavior. The contributions of this paper are as follows:
The simulation of several attacks on the IoT to identify if packet drop along with energy consumption constraints are suitable features for identifying routing attacks on IoT;
A novel intelligent IDS is used to identify IoT attacks with high detection accuracy and low false alarm rates;
An experiment to show how several types of intrusion functionality and attack techniques affect power consumption;
This paper proposes a dataset of routing attacks that contains normal IoT network traffic in conjunction with several kinds of attacks. The reliability of the routing dataset using well-known machine learning techniques is assessed;
An investigation on IoT malware functionality and techniques, and how these RPLs can be used for successful intrusion detection.
The structure of this document is as follows: The background is covered in
Section 2.
Section 3 discusses relevant work. In
Section 4, our strategy for developing models for the study is presented. The experimental design and outcomes are described in
Section 5. The evaluation of approaches is discussed in
Section 6. In
Section 6, the conclusion is offered.
2. Background
2.1. Routing Protocol for Low-Power and Lossy Networks (RPL)
The Routing Protocol for Low-Power and Lossy Networks (RPL) is a protocol that is specifically designed for low-power and lossy networks (LLNs) to route messages with minimal power consumption. In this protocol, the network topology is formed as a Destination-Oriented Directed Acyclic Graph (DODAG), with a root node at the top and leaf nodes at the bottom [
2].
Nodes in the network maintain routing tables and communicate with their neighbors to find the best path to the root node. RPL uses a metric known as Expected Transmission Count (ETX) to evaluate the link quality between two nodes. The nodes with better links are ranked higher in the DODAG and are used for routing [
2].
To help save power in the network, RPL includes several features. Nodes can enter sleep mode to conserve energy when they are not actively participating in routing. They can additionally indicate to their neighbors that they are low on energy and should not be used for routing. RPL uses various message types to maintain the network topology and update routing tables. The root node broadcasts a DAG Information Object (DIO) to update the network regarding the current state of the DODAG. Nodes respond with Destination Advertisement Objects (DAOs) to advertise their presence and update their parent node in the DODAG. Lastly, the DODAG Information Solicitation (DIS) message is used to request DIO messages from the root node when a node joins the network or loses its parent [
8].
In
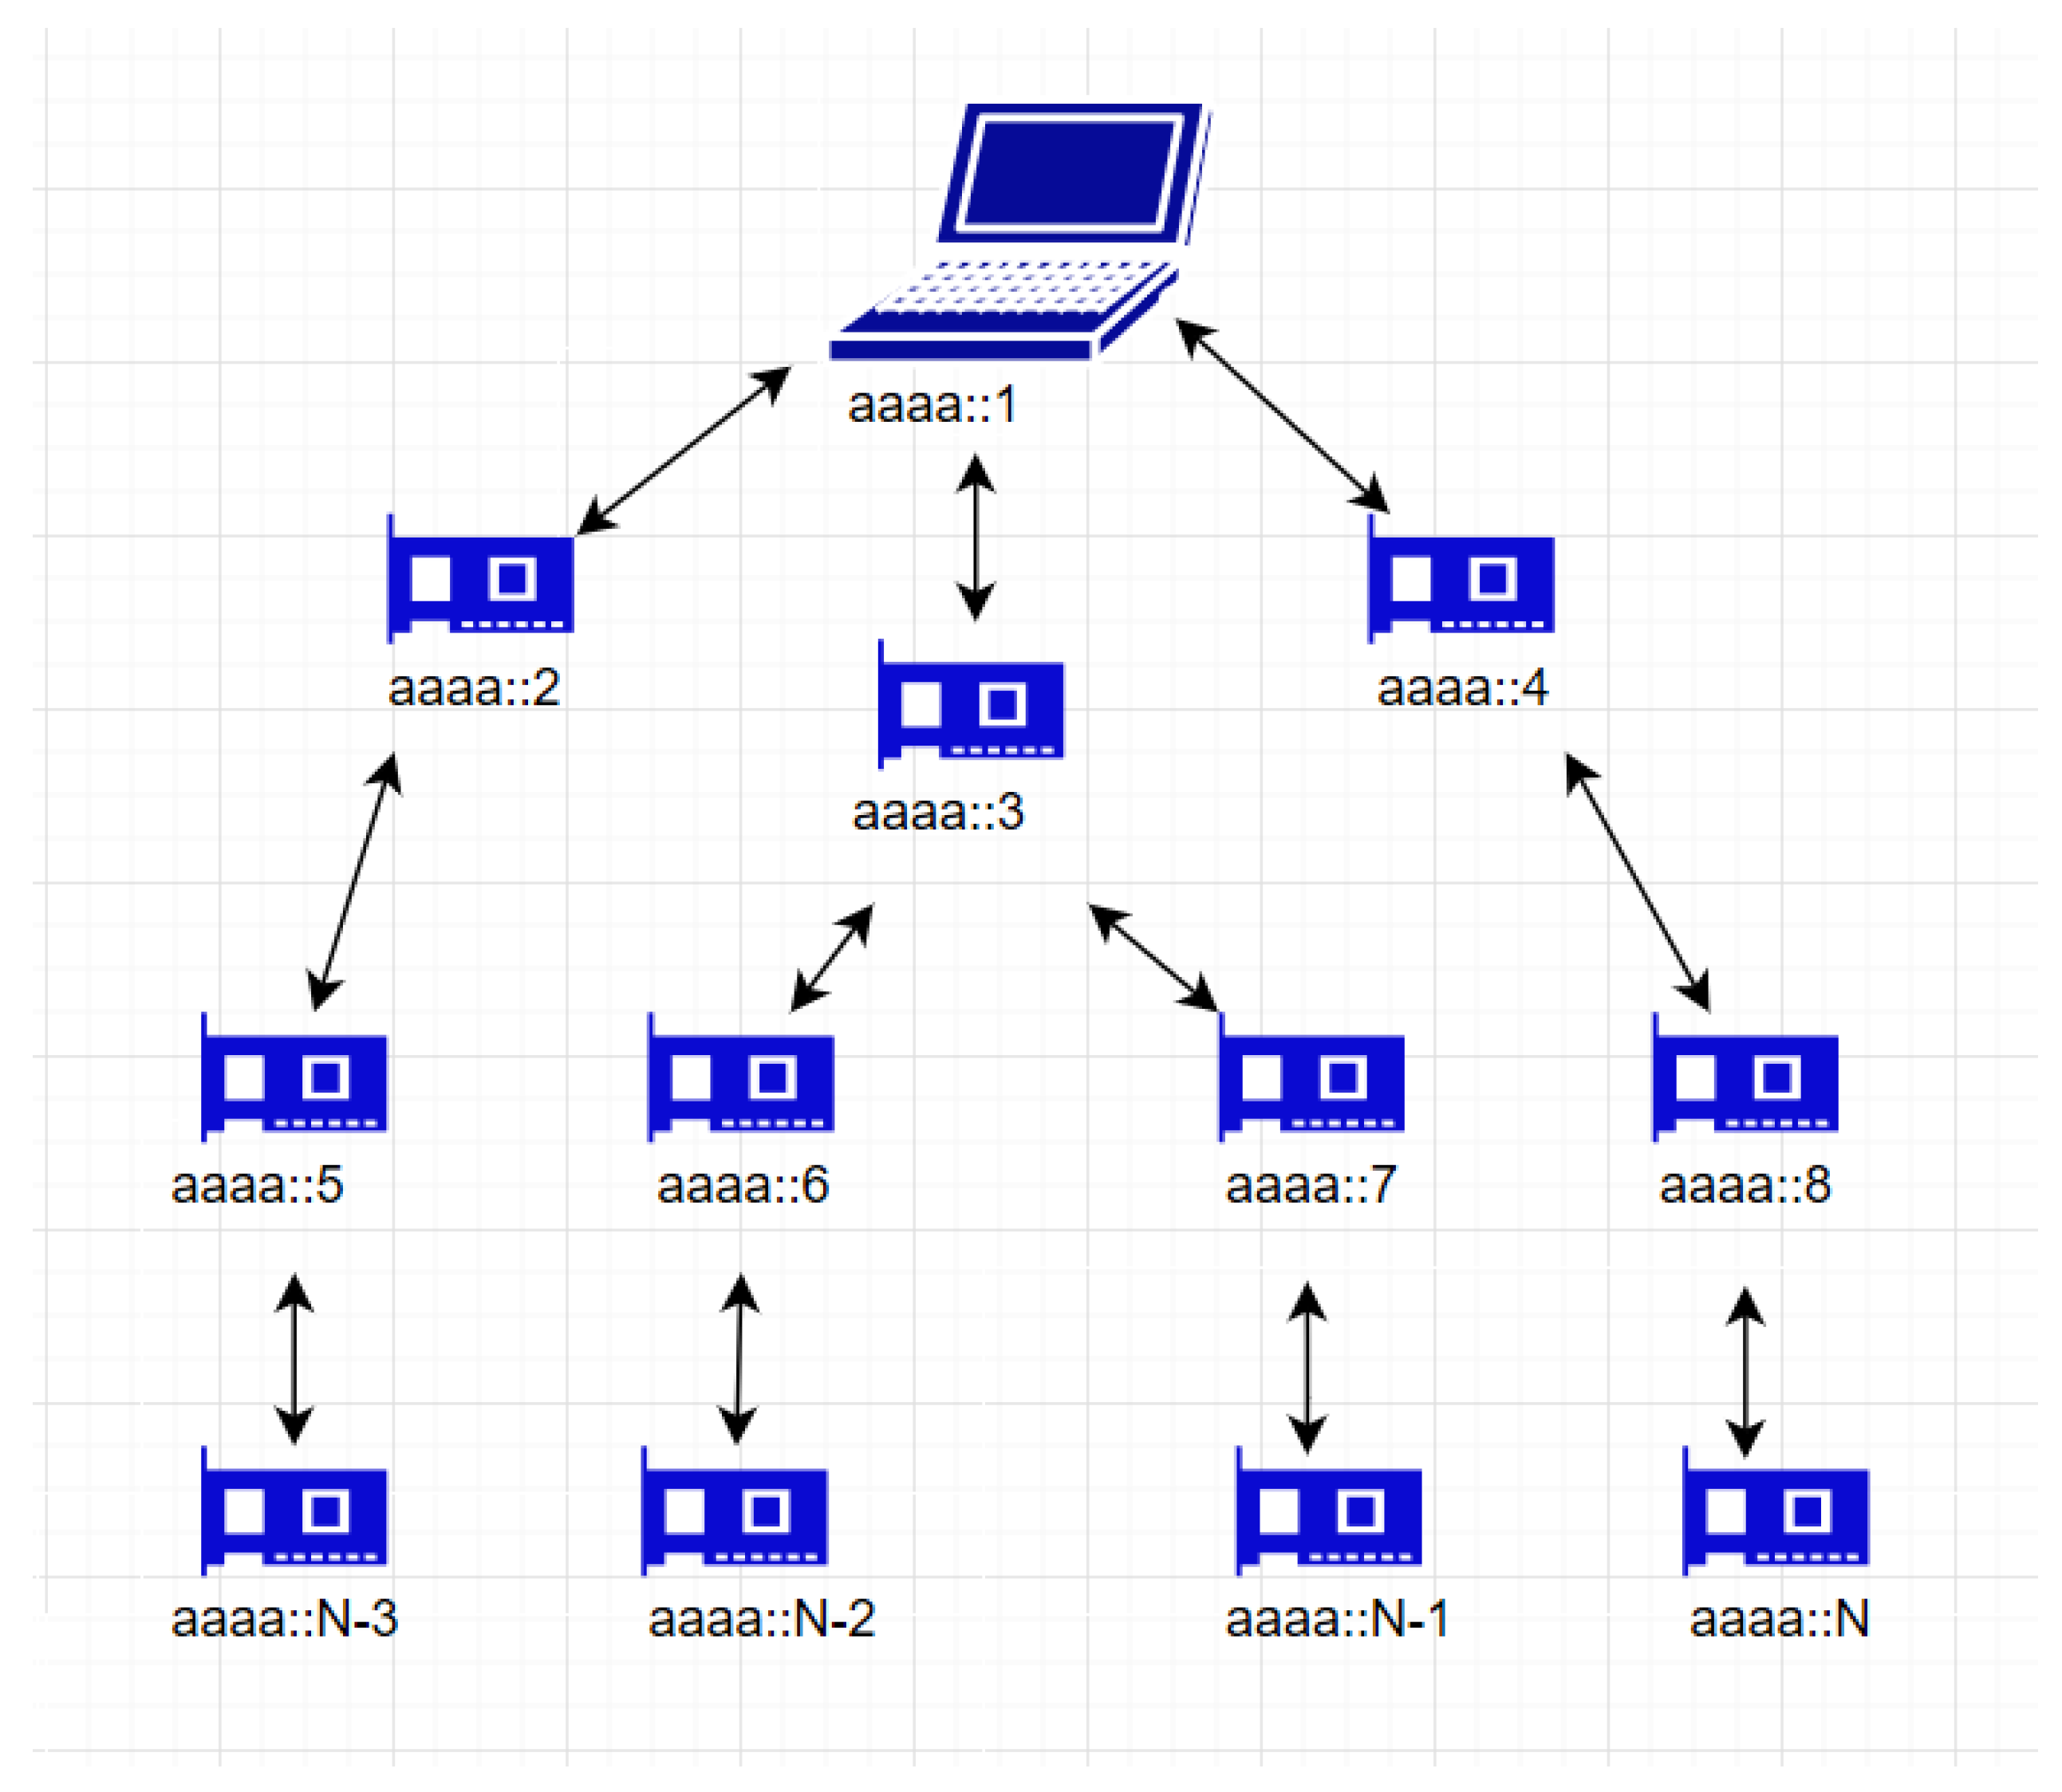
Figure 1, the process of forming the Destination-Oriented Directed Acyclic Graph (DODAG) begins with the root node. The structure formed can be in the shape of a tree, and there may be one or more root nodes. The root node starts advertising information by sending out a DAG Information Object (DIO) message. Neighboring nodes receive and process the message to determine whether to join the network or not. This process continues from the root to the parent nodes and leaf nodes in the network. Each node selects a parent node from its neighboring nodes. The root node has a rank of 0, and the ranks of nodes increase based on the Objective Function (OF). To prevent possible packet loss, no loops should be formed, unlike traditional routing [
9].
Routing in RPL begins at the root node and routes are distributed to other protocols connected through the Destination Advertisement Object (DAO) message. RPL is more applicable in IoT where power supply is a regular constraint in low-energy and lossy networks.
2.1.1. Sinkhole Attack
A Sinkhole Attack is an internal assault in which an impacted node attempts to attract network traffic by propagating bogus routing updates. An attacker launches an attack on a network by adding bogus nodes. The objective of this attack is to reroute traffic from a certain region across a malicious node that appears to be highly appealing to the surrounding nodes [
10].
2.1.2. Selective Forwarding Attack
A Selective Forwarding Attack is a security threat wherein an attacker manipulates network traffic by selectively forwarding or dropping packets. The attacker gains control over one or more nodes in the network and selectively forwards packets to some nodes while dropping or delaying packets to others. This disrupts the communication between the nodes and can compromise the security of the network. The attacker can selectively drop packets containing critical information, leading to data loss and the disruption of the communication between nodes. This type of attack can be particularly harmful in WSNs and IoT networks where nodes have limited resources and rely on efficient and reliable communication. To ensure network security and reliability, effective defense mechanisms must be developed to detect and prevent selective forwarding attacks.
2.1.3. Sybil Attack
A Sybil Attack is a type of attack in which a malicious actor creates multiple fake identities or nodes in a network to gain control and manipulate the network. This type of attack is particularly dangerous in peer-to-peer networks and distributed systems where trust is critical. In the context of RPL, a Sybil attack involves a malicious node creating multiple fake identities or nodes that can participate in the network and influence the routing process. These fake nodes can cause routing loops, interfere with routing decisions, and lead to network congestion, which can ultimately result in denial of service (DoS) attacks [
11].
2.1.4. Blackhole Attack
A Blackhole Attack is a security threat that disrupts the routing process by selectively forwarding or dropping network packets. The attacker pretends to have the shortest path to the destination node, causing legitimate nodes to forward packets to the attacker instead of the actual destination. Once the attacker has control over the packets, they can be selectively dropped or forwarded to other nodes, resulting in severe damage to the network. The consequences of a Blackhole Attack can be significant, including communication disruption, data loss, and network failures. In RPL, which is commonly used in IoT networks, a blackhole attack can be particularly damaging since many IoT devices have limited resources and rely on reliable and efficient communication to function properly [
12].
2.2. Intrusion Detection System (IDS)
An Intrusion Detection System (IDS) is a crucial component in the field of cybersecurity that helps to detect and prevent unauthorized access to computer networks and systems. The IDS is designed to identify potential security breaches and intrusions that could compromise the confidentiality, integrity, and availability of data and system resources. The primary function of an IDS is to monitor network traffic and system activity, looking for anomalous or malicious behavior that may indicate an attack. The IDS operates by analyzing traffic patterns and comparing them to known attack signatures or deviations from established patterns of normal behavior. Once an intrusion is detected, the IDS can alert security personnel or take automated action to block or mitigate the attack. The IDS is used in various settings such as enterprise networks, cloud infrastructure, and IoT devices, and it can be deployed in different forms including network-based, host-based, or hybrid IDS. With the increasing sophistication and frequency of cyber-attacks, IDS is becoming an increasingly vital component in protecting the security of digital systems and infrastructure [
7,
13,
14].
IDS systems have two main approaches: Signature Intrusion Detection Systems (SIDSs) and Anomaly Intrusion Detection Systems (AIDSs).
Signature Intrusion Detection Systems (SIDS) are based on pattern-matching techniques to find a known attack; these are also known as Knowledge-based Detection or Misuse Detection. In other words, an alert is raised when a recognized intrusion meets a malicious string database. For well-known attacks, SIDS frequently produces positive detection outcomes. The second approach is Anomaly Intrusion Detection Systems (AIDS), which identify unusual behaviors on a computer system. They are categorized into several sub-categories based on the learning approaches applied, such as statistical techniques, data mining, artificial neural networks, and genetic algorithms [
15]. The main benefit of an anomaly-based scheme is that it can potentially detect attacks even when detailed prior information of the attack does not exist and can be used to obtain signature information used by misuse-based IDS.
Researchers are aware of this potential to identify a zero-day attack, AIDSs have captured the attention of numerous studies. AIDSs can identify unusual computer user behavior. This method is predicated on the idea that malicious user behavior is distinct from benign user activity. AIDSs use a combination of chosen features plus machine learning techniques to build a behavioral profile of typical user activity. Then, they compare the new data’s behaviors to the predetermined normal behavior profile to look for abnormalities. Users who exhibit odd activity are flagged as potential attackers. In general, the AIDS contains two stages: the training stage and a testing stage. In the training stage, the normal activity profile is categorized using data that identify normal behavior; in the testing stage, the new data set are examined based on the profile that has been built in the first stage.
Many researchers use a variety of machine-learning techniques and algorithms to detect anomalies. These techniques include both supervised and unsupervised learning approaches to address different pattern recognition problems. In supervised learning, a model is built from labeled training data wherein each trained data point is associated with a class label. During the training phase, a classifier model is developed, which can classify additional examples based on learned class labels. Several machine learning structures have been employed with A-NIDS, and some of the most prominent structures are described below, including their main strengths and limitations [
16].
Decision trees: A decision tree is a tree-like model wherein each node represents a feature or attribute, each branch represents a decision rule, and each leaf node represents a predicted outcome or class label. The algorithm works by recursively partitioning the data based on the values of the features, to create pure leaf nodes where all instances in a leaf node belong to the same class or have the same predicted value.
There are many different decision tree algorithms, including ID3 [
17], C4.5 [
18], and CART [
19]. The decisions are often simple attribute tests that isolate the data using one attribute at a time. By using categories established at lower nodes, new data can be classified. Quinlan (1993) promoted using a decision tree technique, and C4.5 is the most recent version of Quinlan’s model [
20,
21].
Bayesian Networks: To model an uncertain domain, a Bayesian network is used widely and applied in various ways to treat AIDSs. The Bayesian intrusion detection system has been applied to learning an attack strategy to relate alerts, and it expects possible upcoming attacks in a connected system. A Bayesian network is a graphical model that consists of a directed acyclic graph (DAG). In this graph, each node represents a random variable, and the edges represent probabilistic dependencies between these variables. The structure of these networks shows how the variables are related to each other. The relationships are represented by the conditional probability distributions between the nodes. The probability distribution of a node is determined based on the values of its parent nodes in the graph. This approach allows us to make inferences about the joint probability distribution of all the variables in the network, given certain evidence or observations.
One Support Vector Machine (SVM): The one-class Support Vector Machine (SVM) is a type of machine learning algorithm is used for detecting anomalies. Unlike traditional SVMs that separate data into two classes, the one-class SVM works with a single class of data, which are usually the expected or normal data. The purpose of the one-class SVM is to identify typical patterns of normal data, and any data that deviate from this pattern are considered an anomaly. The algorithm first maps the input data to a high-dimensional feature space and finds a hyperplane that separates the normal data from the rest of the data. This hyperplane is defined as the decision boundary, and any data that falls on the other side of the hyperplane is considered an anomaly.
Multilayer Perceptron (MLP): An MLP is an artificial neural network used in machine learning that has several layers of nodes or artificial neurons arranged in a feedforward fashion. The input layer, which accepts the input data, is the first layer, while the output layer is the last layer, which generates the output. In the middle, there may be one or more hidden layers that perform computations. Each neuron receives input from the previous layer, applies an activation function to the input, and produces an output that is sent to the next layer. During a training process, a backpropagation algorithm is used to learn the weights of the connections between neurons, which are adjusted based on the error between the predicted output and the actual output. MLPs are mostly used for supervised learning, such as classification and regression. They can learn complex non-linear relationships between inputs and outputs and support various activation and loss functions. However, they may be prone to overfitting and require the careful tuning of hyperparameters to achieve optimal performance.
3. Related Works
Cho et al. introduced a technique for detecting botnet attacks by analyzing packet length at the border router between physical and network devices, but they did not provide details on how they developed a normal behavior profile or how the method would perform on IoT nodes with limited resources [
22].
Raza et al. proposed a new intrusion detection system called SVELTE, designed for IoT networks to detect routing attacks such as spoofing, Sinkhole, and Selective Forwarding. They implemented SVELTE in the Contiki OS and evaluated it, showing that it can detect all malicious nodes in simulated scenarios with some false alarms, while having minimal overhead that enables it to be deployed on constrained nodes with limited resources [
23].
Rathore et al. proposed a semi-supervised fuzzy learning-based distributed attack detection framework for IoT and evaluated it using the NSL-KDD dataset, which has similar dataset-related issues to those mentioned previously [
24].
To identify DDoS and DoS assaults against genuine IoT network traffic, Hodo et al. used an Artificial Neural Network (ANN). The suggested ANN model was tested against the simulated IoT network.
Diro et al. proposed a new approach to cybersecurity that uses deep learning to detect attacks in the Social Internet of Things (IoT). The paper compares the performance of the deep learning model with traditional machine learning approaches and evaluates a distributed attack detection system against a centralized detection system. The experiments show that the distributed attack detection system using deep learning outperforms centralized detection systems, and that the deep learning model is more effective in detecting attacks compared to shallow counterparts [
25].
To identify aberrant activity in various botnet attempts against the Domain Name System (DNS), Hyper Text Transfer Protocol (HTTP), and Message Queue Telemetry Transport, Moustafa et al. suggested an ensemble of IDSs (MQTT) [
26]. Their ensemble approaches are based on the AdaBoost learning approach, and they evaluated their approach using three machine learning techniques: Artificial Neural Networks (ANN), Decision Trees (DT), and Naive Bayes (NB) [
26]. Performance overhead is impacted by the planned IDS.
Using Artificial Neural Networks (ANN) to identify Distributed Denial of Service (DDoS/DoS) attacks, Hoda et al. presented a threat analysis of IoT devices. Using web packet traces for training, a multi-level perceptron, a form of supervised ANN, is evaluated on its capacity to prevent (DDoS/DoS) attacks [
27]. The likelihood of implementing the suggested IDS in the IoT ecosystem with low-capacity devices was not taken into account by Hoda et al. Their testing revealed that the technology has a 99.4% accuracy rate for DDoS/DoS. However, no information on the dataset was offered.
IDSs were suggested by Cervantes et al. for 6LoWPAN for the IoT to detect Sinkhole Attacks. Their IDS strategy combines anomaly detection with signatures, supported by a Support Vector Machine (SVM). Each IDS agent learns the SVM as part of their IDS’s training process, and a majority voting decision is made to identify the infected nodes [
28]. According to their simulation results, their IDS can detect sinkholes up to 92% of the time in a stationary situation, and 75% of the time in a mobile scenario. Their strategy has not been tested against other IoT attack types either.
Khraisat et al. combined a C5 classifier with a one-class Support Vector Machine classifier to create a hybrid Intrusion Detection System (HIDS). The Bot-IoT dataset, including realistic IoT network traffic and a variety of attacks, is used to evaluate the proposed HIDS [
7].
Table 1 shows the summary of the proposed research on IDSs for IoT.
4. Proposed Combination Approach for an IoT Intrusion Detection System
Hybrid IDS was proposed to overcome the limitations of SIDS and AIDS by combining them to detect both known and unknown attacks. Innovative methods were utilized to merge the results of SIDS and AIDS. In our methodology, AIDS was used to identify zero-day attacks, while SIDS was used to detect known attacks. The boosting method was employed to combine the classifiers and reduce the combined model’s bias. The Hybrid IDS comprises two stages: the SIDS stage and the AIDS stage, as shown in
Figure 2. The objective of AIDS is to create profiles of normal node activity and raise an alarm if the difference between regular requests exceeds a predefined threshold for a particular observation. The profiles of nodes were generated by utilizing benign action records. The system then observes the traffic’s behavior and compares the new records with the built profiles to identify any anomalies. When a malicious request is detected, the system stores it in the signature database to protect against similar attacks in future malicious activities. In other words, SIDS will have a suitable history of previously known attacks.
4.1. Feature Selection and Extraction
The IoT is composed of smart devices that have limited processing power, memory, energy, and communication range. One of the main challenges for IDS in this ecosystem is dealing with numerous irrelevant features that can cause overhead on the system. It is widely known that redundant and irrelevant features can lead to a low detection rate. Therefore, the objective of feature selection is to identify the most significant features that can be used in the IDS to detect various attacks effectively. The features are analyzed for both normal and abnormal behaviors using the extracted labels, and an information gain method is applied for feature selection. The information gain technique has a fast execution time, and it extracts the best-performing feature set for the specific type of model. In previous studies, information gain has been regularly used to assess how well each distinct attribute separates the given dataset. The overall entropy “I” of a given dataset “S” is calculated using this method.
According to Gray’s work from 2010, the total entropy, denoted as
I, of a particular set of data,
S, can be defined as follows. The following formula represents the entropy of a system
S, where
c is the number of classes in the system, and
pi is the proportion of elements belonging to the
ith class. The entropy measures the uncertainty or randomness of the system, and this is defined as the sum of the probabilities of each class multiplied by their logarithm base 2.
This formula represents the information gain (IG) of feature A concerning a set of data S in a decision tree. It is calculated by subtracting the sum of the weighted entropies of the possible subsets of S that result from splitting S on feature A from the entropy of S.
(S) is the entropy of set S. It measures the impurity of set S. The higher the entropy, the more mixed the labels are in the set;
A is the feature being considered for splitting the data;
v is a possible value of feature A;
S_(A,v) is the subset of S in which feature A has value v;
S_v is the subset of S in which feature A takes value v, and I(S_v) is the entropy of S_v.
The formula can be interpreted as the reduction in entropy achieved by splitting the data on feature A. It selects the feature with the highest information gain as the root of the decision tree and recursively applies the same procedure to the subsets resulting from the split until a stopping criterion is met.
4.2. Stage One: SIDS Stage
The SIDS phase involved using the C4.5 decision tree classifier to generate a decision tree. Once the tree is constructed, it can be used to classify other samples with varying degrees of success, depending on how well it models the dataset. The decision tree can then be used as a set of rules for identifying whether a test sample is a malicious or benign software. For unknown traffic, pattern matching was used to determine if it represented normal or abnormal behavior. If the request matched an attack signature from the database, an alarm was raised indicating it was a malicious sample. If it did not match, the traffic was passed to the next stage of the framework, which was AIDS, designed to detect unknown attacks, such as zero-day attacks, as depicted in
Figure 2.
4.3. Stage Two: AIDS Stage
To improve the identification of unknown attacks, the SIDS stage’s output is utilized to train the AIDS stage in recognizing abnormal behaviors. By training with benign samples, one-class SVM is used to teach AIDS how to differentiate activities that do not appear normal, which are commonly exhibited by malware. With one-class SVM, benign activities are learned, and this kind of classifier can accurately identify normal activities, as normal class training data are abundant. On the other hand, zero-day attacks are uncommon, so few or even none of these attacks may be present in the training datasets. Therefore, in the second stage, normal behavior is recognized, and any activities that are outside the usual behavior are classified as zero-day attacks. One-class classification methods attempt to build models when the malware class is not present, has a poor sample, or is not well defined. Unlike traditional multi-class classification, in one-class classification, normal behavior is effectively defined by the training data, while unknown malware has no examples.
4.4. Stage Three: Stacking of the Two Stages
To overcome the limitations of both SIDS and AIDS, a hybrid approach is suggested that combines both methods through an ensemble of classifiers. Ensemble techniques are often used in machine learning to improve the accuracy of predictions. However, it is challenging to determine the optimal ensemble configuration for identifying zero-day attacks. A two-stage approach is applied, with a C4.5 classifier in the first stage and a one-class SVM in the second stage, to create an ensemble of classifiers that improves the accuracy of the IDS.
4.5. Centralized IDS Deployment
The IDS is situated either on a dedicated host, such as a cluster head node, or on the root node, such as a border router, and monitors the traffic passing through it to detect attacks. Typically, the central node of the IDS sends periodic requests to the monitored network for updates. This model collects data from different sources within the network and transmits them to a central location for analysis and correlation to identify potential security threats. This deployment model offers several advantages, such as enhanced visibility and control of network traffic, simplified management of security infrastructure, and centralized policy management. However, it also poses some challenges, such as the potential for a single point of failure and the need for a high-speed network connection to transmit data to the central system.
5. Experiment Setup and Results
5.1. Experiment Setup
Contiki OS was used to create an adaptive intrusion detection system that is distributed. This operating system supports the IP for sensor networks and was initially built on the foundation of IPv4. Later, when the 6LoWPAN specification was established, IPv6 functionality was introduced. The RPL now supports IPv6 implementation, which was previously lacking [
29]. Contiki was chosen because it supports IPv6 and RPL. To test and simulate the system, the Cooja simulator was employed, which is a Java-based simulator that supports Contiki OS on multiple levels. It has different interfaces that are used to collect various types of information. The RPL protocol implementation is available in the Contiki source code, and default parameters have been used, including a wake-up interval of 125 ms. The mote output window in
Figure 3 records packet information, such as packet length and type of information being exchanged. Power Tracker, available in Cooja, is used to record power usage in the motes and display radio communications between nodes, including RX and TX signals.
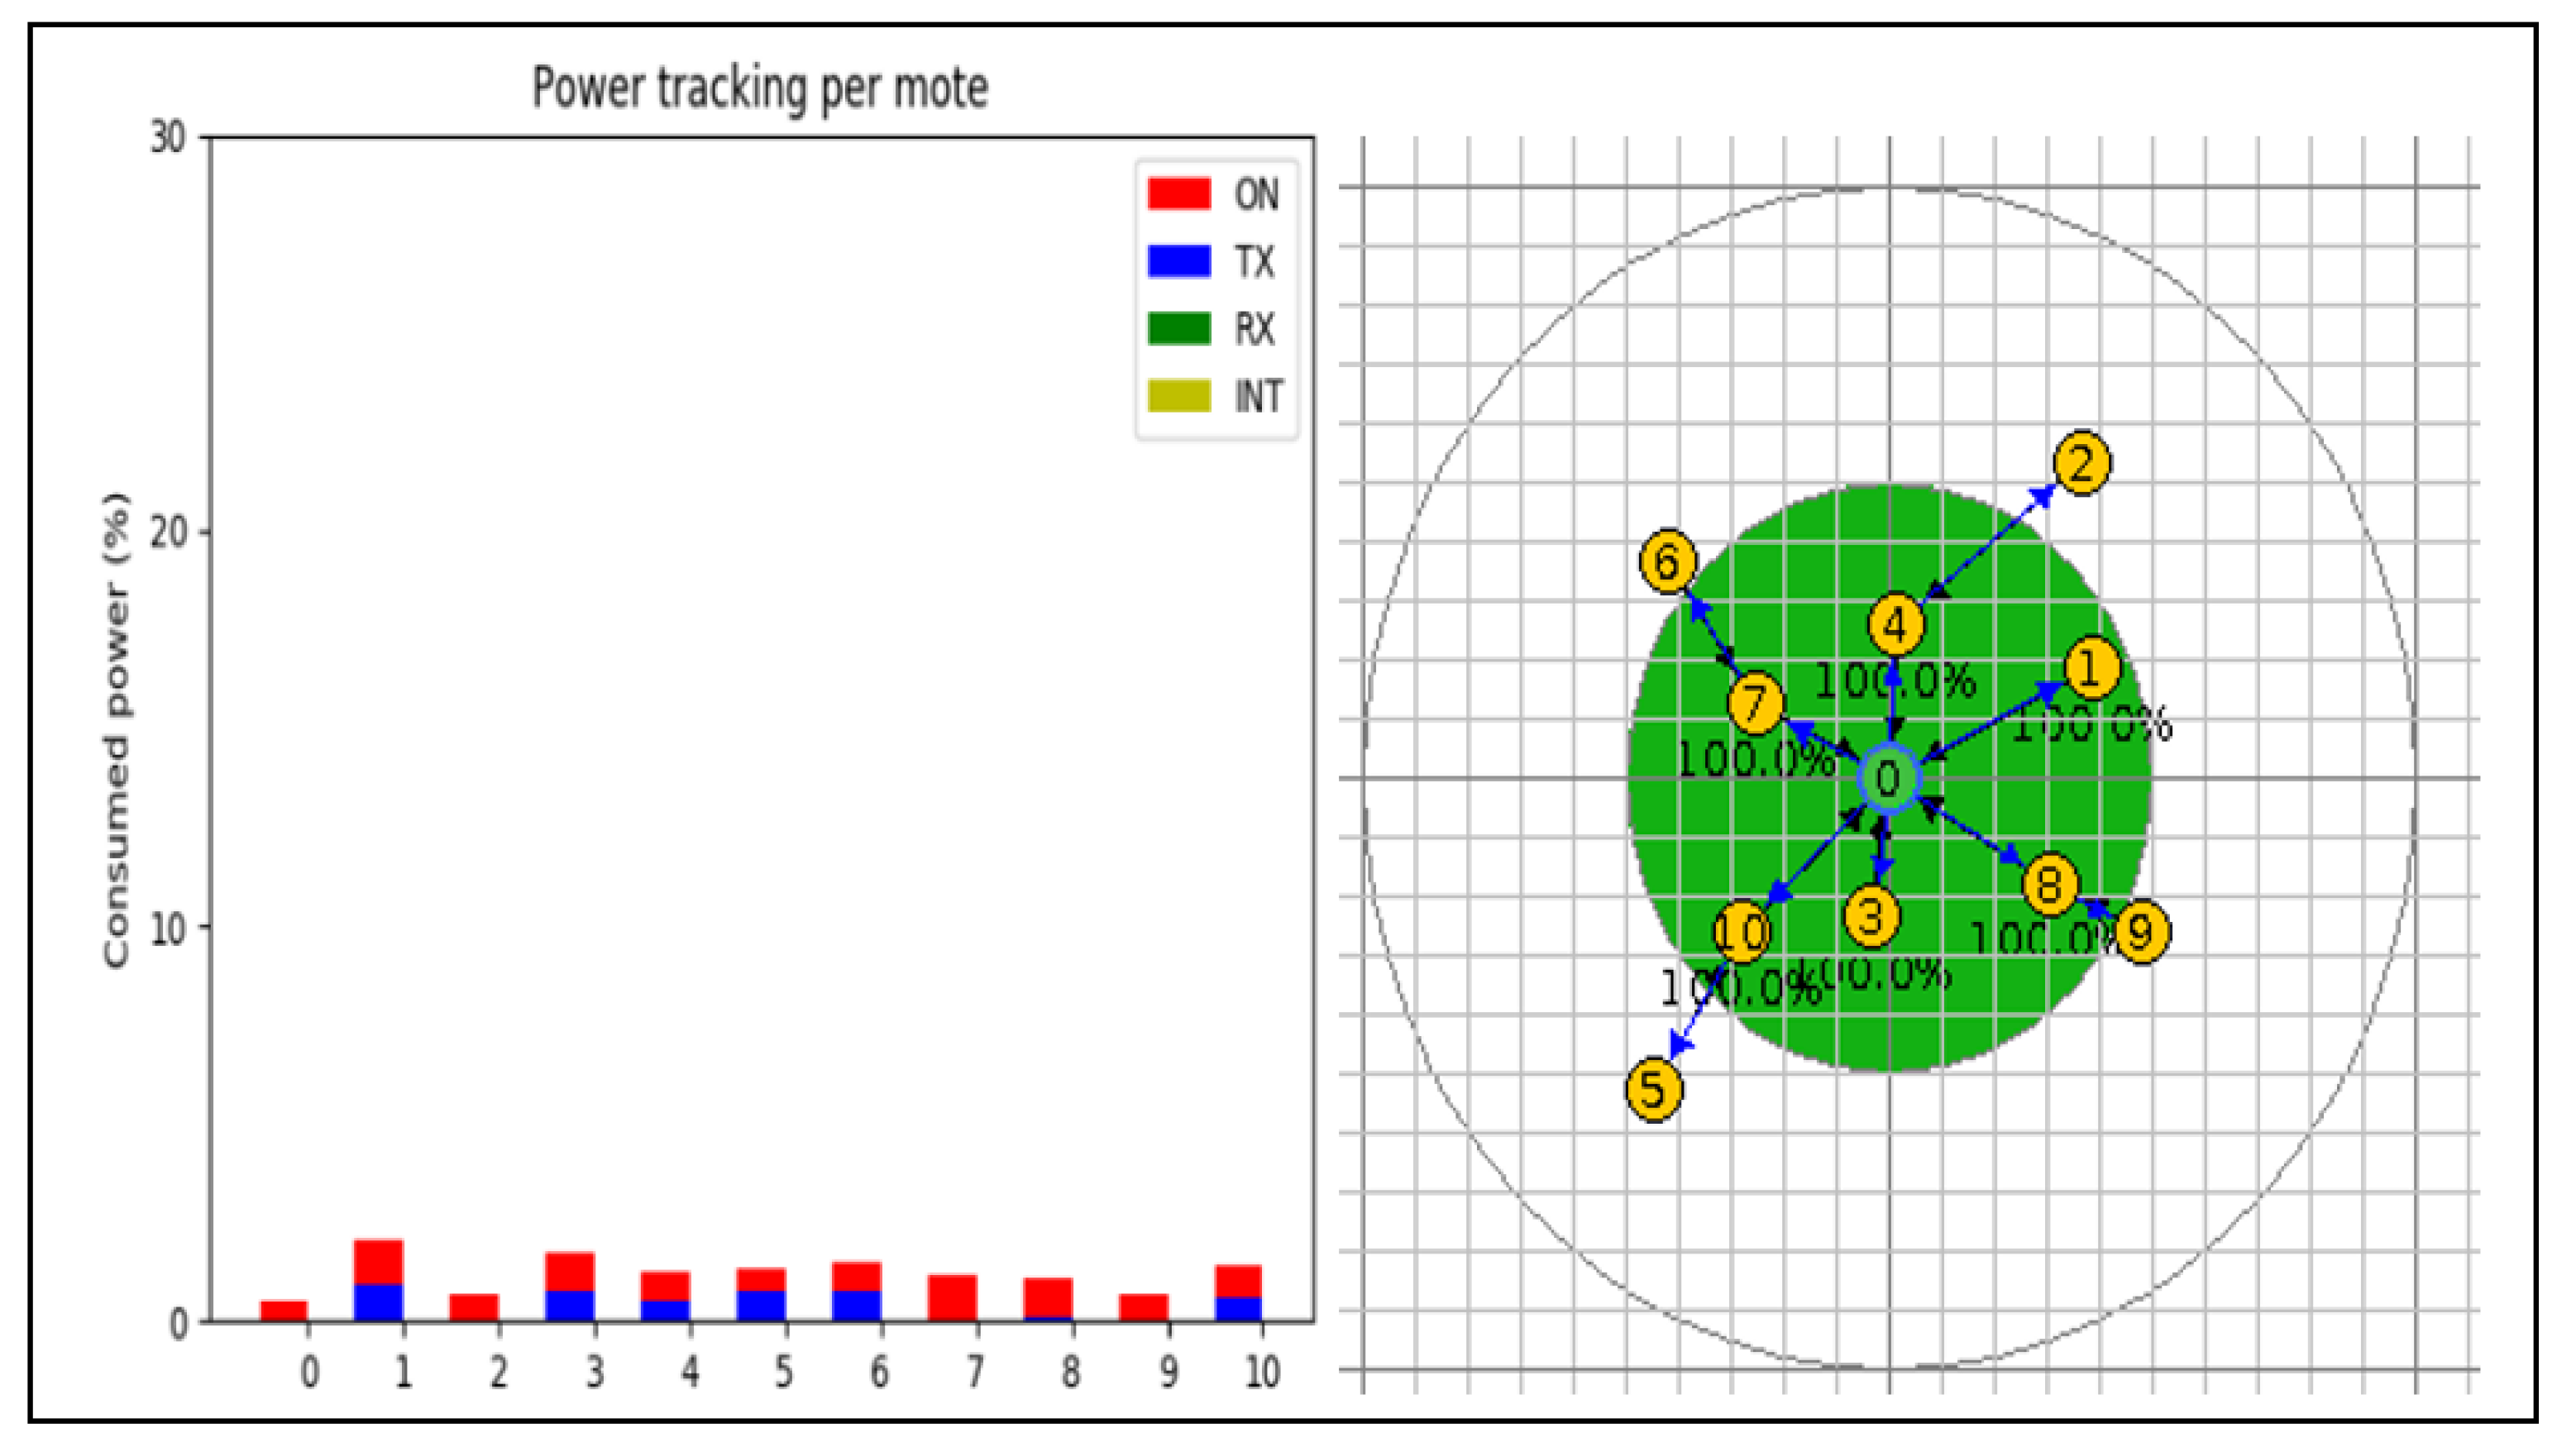
The power utilization in motes is shown in
Figure 4 above, and once the simulation has run for 120 s, it can be observed that it is eminently reasonable. Every mote uses less than 5% of the available power. The fundamental cause of the low power consumption is that, because fewer DIS packets are being transmitted across the network, the motes do not need to be turned on all the time. The nodes use less energy as a result.
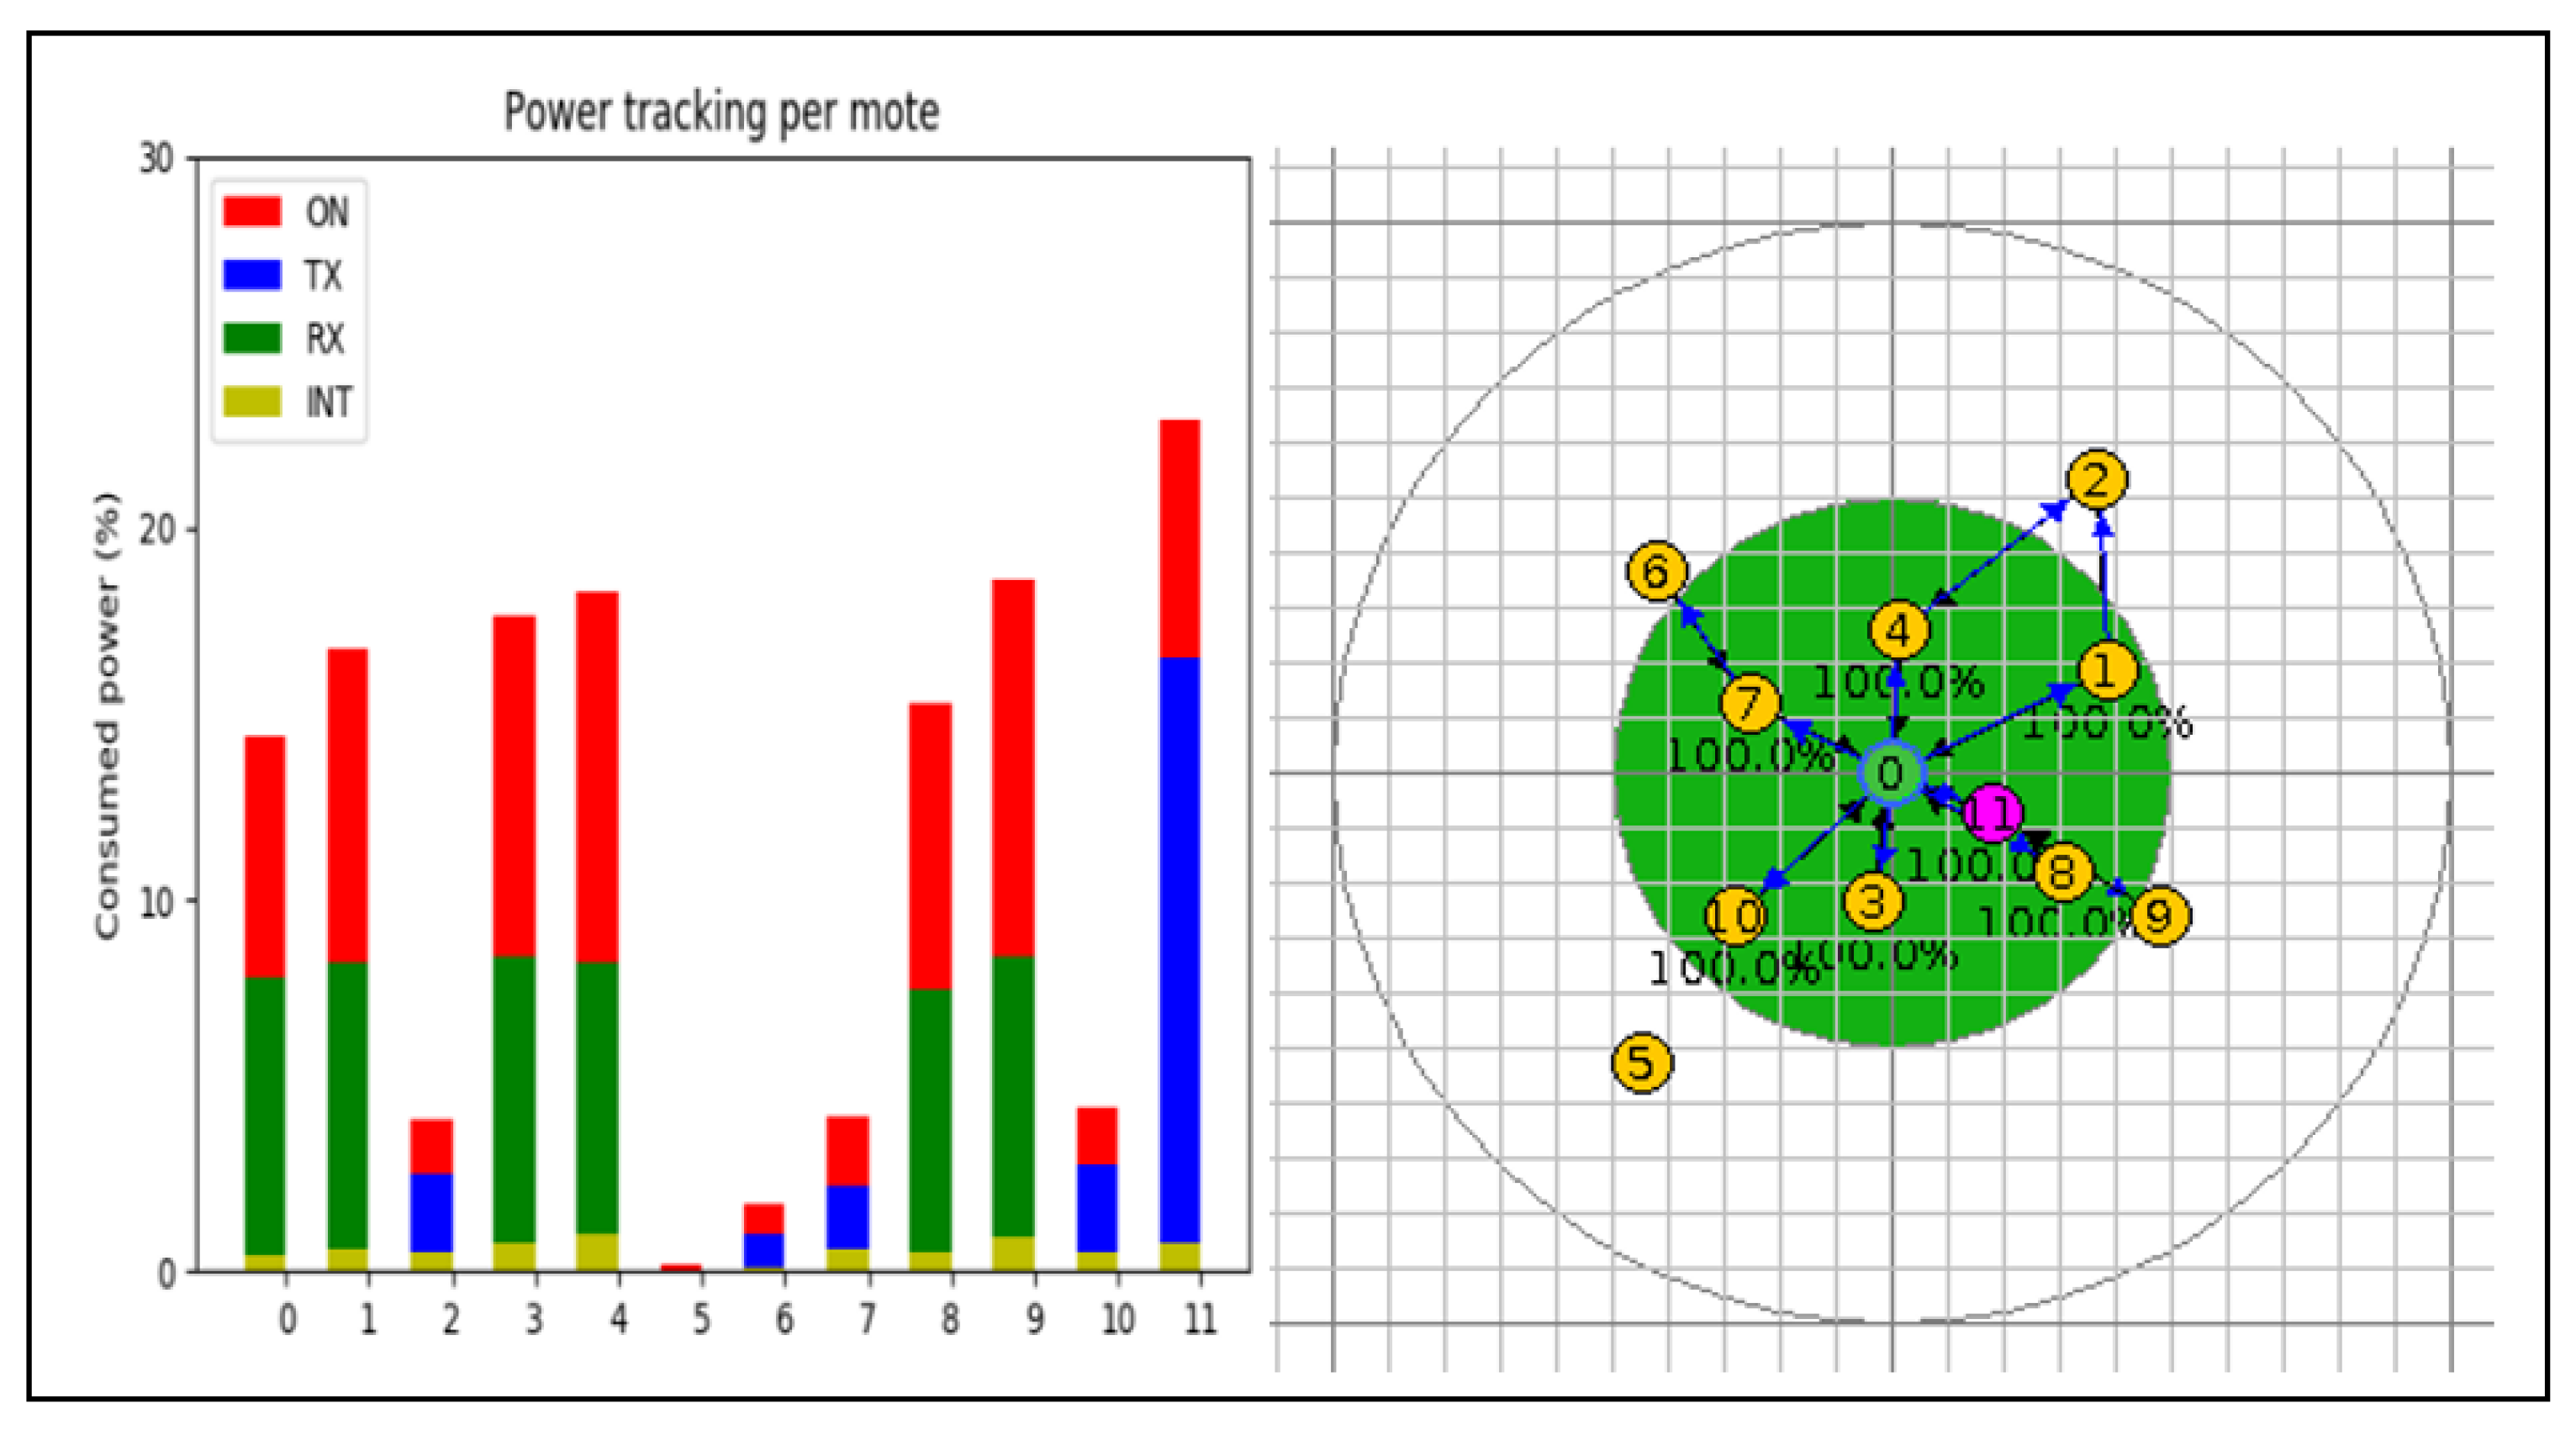
The following diagram shows the network and the mote power usage with the malicious mote in the network.
Figure 5 to the right of the screen displays a network that includes the malicious node 11 as well as other nodes.
Figure 5 on the right shows the network’s power utilization. On the left side of
Figure 5, it can be observed that the network’s power consumption is significantly more than 15%. RX is high for typical sensor nodes. This is because a DIO packet from within the malicious mote is continuously received by the nodes. TX and RX are both high in the malicious mote. This is because they are transmitting and receiving high multicast packets simultaneously.
5.2. Analysis of the Captured Data
The nodes’ power consumption was recorded and stored in a file. The CSV file identified the network’s power consumption as normal traffic, whereas the IoT network’s power consumption with a malicious node was classed as an attack. After that, machine learning software was used to examine the data.
There are seven different fields in the Power Tracker file, and these are listed in
Table 2.
Cooja is employed, which is a simulation tool from the Contiki OS that is popular among academics studying the IoT ecosystem. The major goal of using Cooja is to determine how to make use of it to evaluate the impacts of attacks and create more effective security solutions. In this paper, the effects of insider threats on RPL-based IoT sensor nodes are examined. Based on the seven different scenarios, values from the mote were obtained during the experiment and saved in data collection (DC) files named “DC1”, “DC2”, “DC3”, “DC4”, “DC5”, “DC6”, and “DC7”. There are various totals for attack and normal motes/nodes in each instance. In the simulation, new members of the community introduce themselves by transmitting their identification number with signal strength alongside a “Hello” message to their closest neighbors. Every node then modifies its routing tables and broadcasts individual messages. Malicious nodes frequently send out “Hello” messages in Sinkhole, Hello Flood, DDoS/DoS, Wormhole, Blackhole, or RPL Rank Attacks by sending out DIS packets that make them appear to be neighbors. As a result, they are the node that other nodes may reach the easiest. As a result, they make their neighbors spend time and resources coping with pointless data packets. The average amount of DIO, DIS, and DAO messages a node sends out each day increases with level or rank. A message takes longer to get through the system when there are more hops between both the root and any additional node. For instance, the first-rank malicious node transmits 40 bytes of data for each packet, or 320 bytes for a packet of 40 bytes. The actual bandwidth is 10 Kbytes per second, or 10,240 bits each second.
After the simulation begins, the IoT routing dataset, which contains both attack and normal nodes, is created.
Table 3 shows the Characteristics of the Cooja simulator. The final routing dataset provided in
Table 4 includes upwards of 6893 instances with 46 characteristics.
Nodes within the range of the malicious node experienced a significant increase in energy consumption, with the percentage difference between energy consumed during the attack simulation and the reference simulation being approximately 2000%. Nodes in close proximity to the malicious node can consume up to 20 times more energy. The attack directly affects nodes within the range of the malicious node, and there is a correlation between attacker–victim distance and power consumption. All power markers, except for Low-Power Mode, showed significant increases with slight variations depending on the distance of the node to the malicious node.
5.3. Experiment Discussion
An attack on the Routing Protocol for Low-Power and Lossy Networks (RPL) can have a significant impact on the power usage of the nodes in the network. RPL is designed for low-power and lossy networks, such as those found in Internet of Things (IoT) devices, where nodes often have limited resources and rely on efficient communication to conserve battery life. An attack on the RPL routing protocol can lead to nodes taking longer routes, which can result in higher power consumption due to increased data transmission and reception. Additionally, if the routing protocol is compromised, nodes may be forced to repeatedly transmit data packets, which can further drain their batteries. This can lead to reduced network lifetime, as nodes may run out of power and fail.
Furthermore, if a malicious node is introduced into the network, it may consume more power than other nodes by participating in attacks, such as Selective Forwarding and Blackhole Attacks. This can further exacerbate the power consumption issues and reduce the overall network efficiency. Therefore, it is crucial to develop effective security mechanisms to prevent attacks on the RPL routing protocol in order to ensure the longevity and reliability of the network.
5.4. Model Results and Evaluation
Table 5 reveals the confusion matrix for a two-class classifier. The instances in a predicted class are represented in each column of the matrix, while the occurrences in an actual class are represented in each row.
This model will be evaluated based on the following standard performance measures.
True Positive Rate (
TPR), also known as Detection Rate (
DR) or Sensitivity, is determined by dividing the number of accurately identified attacks by the total number of attacks. Achieving a
TPR of 1, which means all intrusions are detected correctly, is highly unlikely for an
IDS. In summary,
TPR is given by the following formula:
False Positive Rate (
FPR) is computed by dividing the number of normal instances identified as attacks by the total number of normal instances. Mathematically,
FPR can be expressed as follows:
When an anomaly is not detected by the system and is mistakenly classified as normal, it is referred to as a false negative. The False Negative Rate (
FNR) is calculated as follows:
The Classification Rate (CR) or Accuracy of an IDS refers to the ability of the system to correctly identify both normal and abnormal traffic behavior. It is computed by dividing the total number of correctly classified instances based on the baseline behavior features by the total number of instances, expressed as a percentage. In other words, the CR can be defined mathematically as:
The F-measure (
FM) is an evaluation metric that provides a single accuracy measure for a given threshold by calculating the harmonic mean of the Precision and Recall at that threshold. It is particularly useful when only one accuracy metric is needed to evaluate the performance of the system.
Table 6 displays the confusion matrix for a two-category classifier. The matrix is arranged such that the rows represent the instances that belong to each actual class, while the columns represent the examples that belong to each predicted class.
To evaluate the performance of the system in this study, the dataset was divided into “k” distinct parts using the k-fold cross-validation method. In each cycle of this process, one fold was selected randomly for testing, while the other (k-1) folds were used for training. To achieve low bias, low variance, low overfitting, and accurate error estimation, k was set to 10 for each experiment. The dataset was partitioned into ten distinct folds, each representing the entire dataset. The learning process was executed ten times on different training sets, and the resulting error rates were averaged to obtain an estimate of the overall error. The accuracy measures used to evaluate the performance of the classifiers and the confusion matrix, which present examples that belong to a predicted class and the instances that belong to an actual class, are displayed in
Table 7, including TP, FP, FN, and TN.
5.4.1. Stage One: SIDS Results
The proposed technique’s performance is evaluated using the confusion matrix, with the results for the C4.5 classifier in the first stage shown in
Table 7.
Table 7 also details the accuracy of each of the classifiers, revealing that the C4.5 classifiers performed significantly better than the rest of the classifiers used in the study. The C4.5 classifier has the highest accuracy, with a score of 93.2609%, followed by Multilayer Perceptron, Naive Bayes, and SVM, in that order.
Table 8 provides a detailed analysis of the accuracy of the C4.5 decision tree classification. The table breaks down the accuracy of the C4.5 decision tree into more specific categories, which enables a more thorough evaluation of the model’s performance.
5.4.2. Stage Two: AIDS Results
The One-class SVM with RBF kernel was implemented through the use of LIBSVM, and the results obtained have been presented in the form of a confusion matrix for stage two, which, as can be seen in
Table 9 and
Table 10, provides accuracy measures of SVM.
5.4.3. Stage Three: The Combination of the Two Stages
The proposed hybrid IDS approach employs a combination of the C4.5 classifier in the first stage and one-class SVM in the second stage. A stacking ensemble method is used to integrate the results of the two stages.
Table 11 displays the confusion matrices for the combined classifiers in stage three. The accuracy of stage three is detailed in
Table 12.
According to
Figure 6, the malware detection accuracy with the IoT intrusion dataset was 93.26% in stage one and 81.91% in stage two. However, in stage three, the accuracy improved to 97.1%. Therefore, the proposed framework provides a higher detection accuracy and a lower false alarm rate compared to using only a single stage of detection.
6. Conclusions
In conclusion, routing attacks pose a significant threat to the security and reliability of 6LoWPAN-based IoT networks. Various types of routing attacks, such as Blackhole, Selective Forwarding, and Sybil Attacks, can compromise the network’s integrity and disrupt communication between the nodes. An attack on the Routing Protocol for Low-Power and Lossy Networks (RPL) can have a significant impact on the power usage of the nodes in the network. The RPL protocol is designed to ensure efficient communication to conserve the battery life of these resource-constrained nodes. If the RPL routing protocol is attacked, nodes may take longer routes, resulting in increased power consumption due to greater data transmission and reception. Additionally, nodes may be forced to re-transmit data packets, which can further deplete their batteries. This can ultimately lead to a reduction in the network lifetime as nodes run out of power and fail. In addition, the presence of a harmful node in the network can lead to increased power consumption due to its involvement in various attacks, including Selective Forwarding and Blackhole Attacks. As a result, the overall network efficiency may decrease, and power consumption issues may become more severe.
Therefore, it is crucial to develop effective defense mechanisms to detect and prevent routing attacks in IoT networks. This article has introduced a new Intrusion Detection System (IDS) for IoT infrastructure that utilizes a feature set specifically designed to detect various types of routing attacks. The proposed system is based on a hybrid IDS approach that combines two stages of detection using a stacking ensemble method, resulting in improved detection accuracy. The experimental results demonstrate that the hybrid IDS, which uses an ensemble of C4.5 and one-class SVM in two cascaded stages, outperforms other individual techniques and approaches reported in previous studies in terms of accuracy and false alarm rate. This implies that the proposed technique can be valuable for use in designing modern IDSs. Future work will involve extending the proposed IDS to detect other types of attacks against IoT systems.


