Article

Swin-UperNet: A Semantic Segmentation Model for Mangroves and Spartina alterniflora Loisel Based on UperNet

1
College of Information Science, Shanghai Ocean University, Shanghai 201306, China
2
Key Laboratory of Marine Environmental Survey Technology and Application, Ministry of Natural Resources, Guangzhou 510300, China
3
Key Laboratory of Space Active Opto-Electronics Technology, Shanghai Institute of Technical Physics, Chinese Academy of Sciences, Shanghai 200083, China
4
South China Sea Institute of Planning and Environmental Research, State Oceanic Administration, Guangzhou 510300, China
5
Technology Innovation Center for South China Sea Remote Sensing, Surveying and Mapping Collaborative Application, Ministry of Natural Resources, Guangzhou 510300, China
*
Author to whom correspondence should be addressed.
Electronics 2023, 12(5), 1111; https://doi.org/10.3390/electronics12051111
Submission received: 10 January 2023 / Revised: 16 February 2023 / Accepted: 17 February 2023 / Published: 24 February 2023
(This article belongs to the Special Issue Applications of Deep Neural Network for Smart City)

Abstract

:
As an ecosystem in transition from land to sea, mangroves play a vital role in wind and wave protection and biodiversity maintenance. However, the invasion of Spartina alterniflora Loisel seriously damages the mangrove wetland ecosystem. To protect mangroves scientifically and dynamically, a semantic segmentation model for mangroves and Spartina alterniflora Loise was proposed based on UperNet (Swin-UperNet). In the proposed Swin-UperNet model, a data concatenation module was proposed to make full use of the multispectral information of remote sensing images, the backbone network was replaced with a Swin transformer to improve the feature extraction capability, and a boundary optimization module was designed to optimize the rough segmentation results. Additionally, a linear combination of cross-entropy loss and Lovasz-Softmax loss was taken as the loss function of Swin-UperNet, which could address the problem of unbalanced sample distribution. Taking GF-1 and GF-6 images as the experiment data, the performance of the Swin-UperNet model was compared against that of other segmentation models in terms of pixel accuracy (PA), mean intersection over union (mIoU), and frames per second (FPS), including PSPNet, PSANet, DeepLabv3, DANet, FCN, OCRNet, and DeepLabv3+. The results showed that the Swin-UperNet model achieved the best PA of 98.87% and mIoU of 90.0%, and the efficiency of the Swin-UperNet model was higher than that of most models. In conclusion, Swin-UperNet is an efficient and accurate model for mangrove and Spartina alterniflora Loise segmentation synchronously, which will provide a scientific basis for Spartina alterniflora Loise monitoring and mangrove resource conservation and management.

1. Introduction

Mangroves and Spartina alterniflora Loise are the primary vegetation communities in coastal wetlands. Mangroves grow at the junction of land and sea and play a vital role in purifying seawater, preventing wind and waves, storing carbon, and maintaining biodiversity [1]. The invasion of Spartina alterniflora Loise species has changed the ecological structure of mangrove wetlands and seriously affected the function and stability of the mangrove wetland ecosystem. Therefore, knowledge of the spatial distribution of mangroves and Spartina alterniflora Loise is important for the conservation and restoration of mangrove resources [2,3].
Remote sensing technology has the advantages of image-spectrum merging, wide detection range, less restriction by ground conditions, and fast information acquisition and has been widely used in practical applications, such as urban planning [4,5], traffic monitoring [6,7], land cover classification [8,9], and change detection [10,11]. Using remote sensing images, several methods have been proposed to segment the mangroves and the Spartina alterniflora Loise [12,13,14], such as characteristics-based methods and deep learning methods. Characteristics-based methods are designed based on the spectral reflectance or shape features of objects and each pixel is analyzed. For example, Pham et al. [15] modeled, mapped, and analyzed the biomass change between 2000 and 2011 of mangrove forests in the Cangio region in Vietnam with characteristics-based image analysis and machine learning algorithms. Hermon et al. [16] developed a model of mangrove land cover change to analyze the change in mangroves. Pham et al. [17] used a characteristics-based approach for segmentation of the different LANDSAT sensors (TM, ETM+, and OLI) and used a geographic information system (GIS) to study the changes in mangroves during different periods from 1989 to 2013. Characteristics-based methods are a highly accurate but time-consuming method for segmenting mangroves or Spartina alterniflora Loise. Motivated by the success of deep learning, different deep learning models have been used to segment objects in remote sensing images.
With the development of convolutional neural networks (CNNs) in computer vision, “deep learning” has opened up new research ideas for semantic segmentation [18], and AlexNet [19], VGGNet [20], and GoogLeNet [21] have been proposed for semantic segmentation successfully. For remote sensing images, fully convolutional network (FCN) [22], U-Net [23], SegNet [24], pyramid scene parsing network (PSPNet) [25], DeepLab [26], and unified perceptual parsing network (UperNet) [27] have been proposed for semantic segmentation. Kampffmeyer et al. [28] proposed a deep convolutional neural network (CNN) for land cover mapping in remote sensing images with a focus on urban areas. Hamaguchi et al. [29] introduced a local feature extraction module to a CNN and acquired remarkably good results, especially for small objects. Gao et al. [30] developed a semantic segmentation model for extracting mangroves in remote sensing images by using pixel classification. Several deep learning methods have been proposed for mangrove segmentation. However, in many cases, small areas of mangroves are often missed in the remote sensing images. Spartina alterniflora Loise segmentation is also critical for the analysis of remote sensing data. Currently, the segmentation methods of Spartina alterniflora Loise are rarely reported, especially synchronous segmentation of mangroves and Spartina alterniflora Loise in remote sensing images.
UperNet is a multivision task model; it can perform scene recognition, target detection, and region segmentation simultaneously. Thus, the hierarchical structure of UperNet can contribute to object differentiation with a low computation cost. However, when UperNet is applied to segment objects in remote sensing images, the multiband remote sensing images also present a challenge for feature extraction. On the issue of feature extraction, the application of a transformer in computer vision provides a new research direction for this purpose. Different from a CNN, a transformer with self-attentiveness establishes the connection between image locations at the first layer of information processing. Vision transformer (ViT) [31], transformer in transformer (TNT) [32], pyramid vision transformer (PVT) [33], tokens-to-token ViT (T2T-ViT) [34], and Swin transformer [35] have also gradually been proposed for extracting image features. In addition, the Swin transformer can solve the problems of large variations in scale of visual entities and the high resolution of pixels (Figure 1). The patch merging layer is designed to build a hierarchical structure (Figure 1a). The shifted windowing scheme brings greater efficiency by limiting self-attention computation to non-overlapping local windows while also allowing for cross-window connection (Figure 1b). M-MSA and SW-MSA attention mechanisms are applied in the shifted windowing scheme to handle two consecutive feature maps (Figure 1c).
Mangroves and Spartina alterniflora Loise have similar spectral and textural characteristics to other vegetation; therefore, it is difficult to segment mangroves and Spartina alterniflora Loise from other vegetation. Mangroves and Spartina alterniflora Loise also coexist; it is, therefore, a challenge for the semantic segmentation model to distinguish between the mangroves and the Spartina alterniflora Loise. However, the size and distribution of mangroves and Spartina alterniflora Loise are not uniform. Therefore, it is still worth researching a design for a novel model to improve the accuracy of segmenting mangroves and Spartina alterniflora Loise in remote sensing.To achieve high efficiency and high accuracy of mangrove and Spartina alterniflora Loise segmentation synchronously, a semantic segmentation model based on UperNet was proposed (Swin-UperNet), which was inspired by the hierarchical structure of UperNet and the Swin transformer’s method of handling image-encoded data. In the proposed model, a data concatenation module was proposed to make full use of the spectral information of images, which could distinguish between the mangroves and the Spartina alterniflora Loise. The backbone network was replaced with a Swin transformer to improve the feature extraction ability, especially for small areas of mangroves and Spartina alterniflora Loise. A boundary optimization module was designed to optimize the rough segmentation results, which could further improve the accuracy of segmentation of mangroves and Spartina alterniflora Loise. In addition, the loss function was substituted with a linear combination of cross-entropy loss and Lovasz-Softmax loss to solve the unbalanced sample distribution problem. Swin-UperNet can be an efficient semantic segmentation model for mangrove and Spartina alterniflora Loise segmentation synchronously.

2. Data and Preprocessing
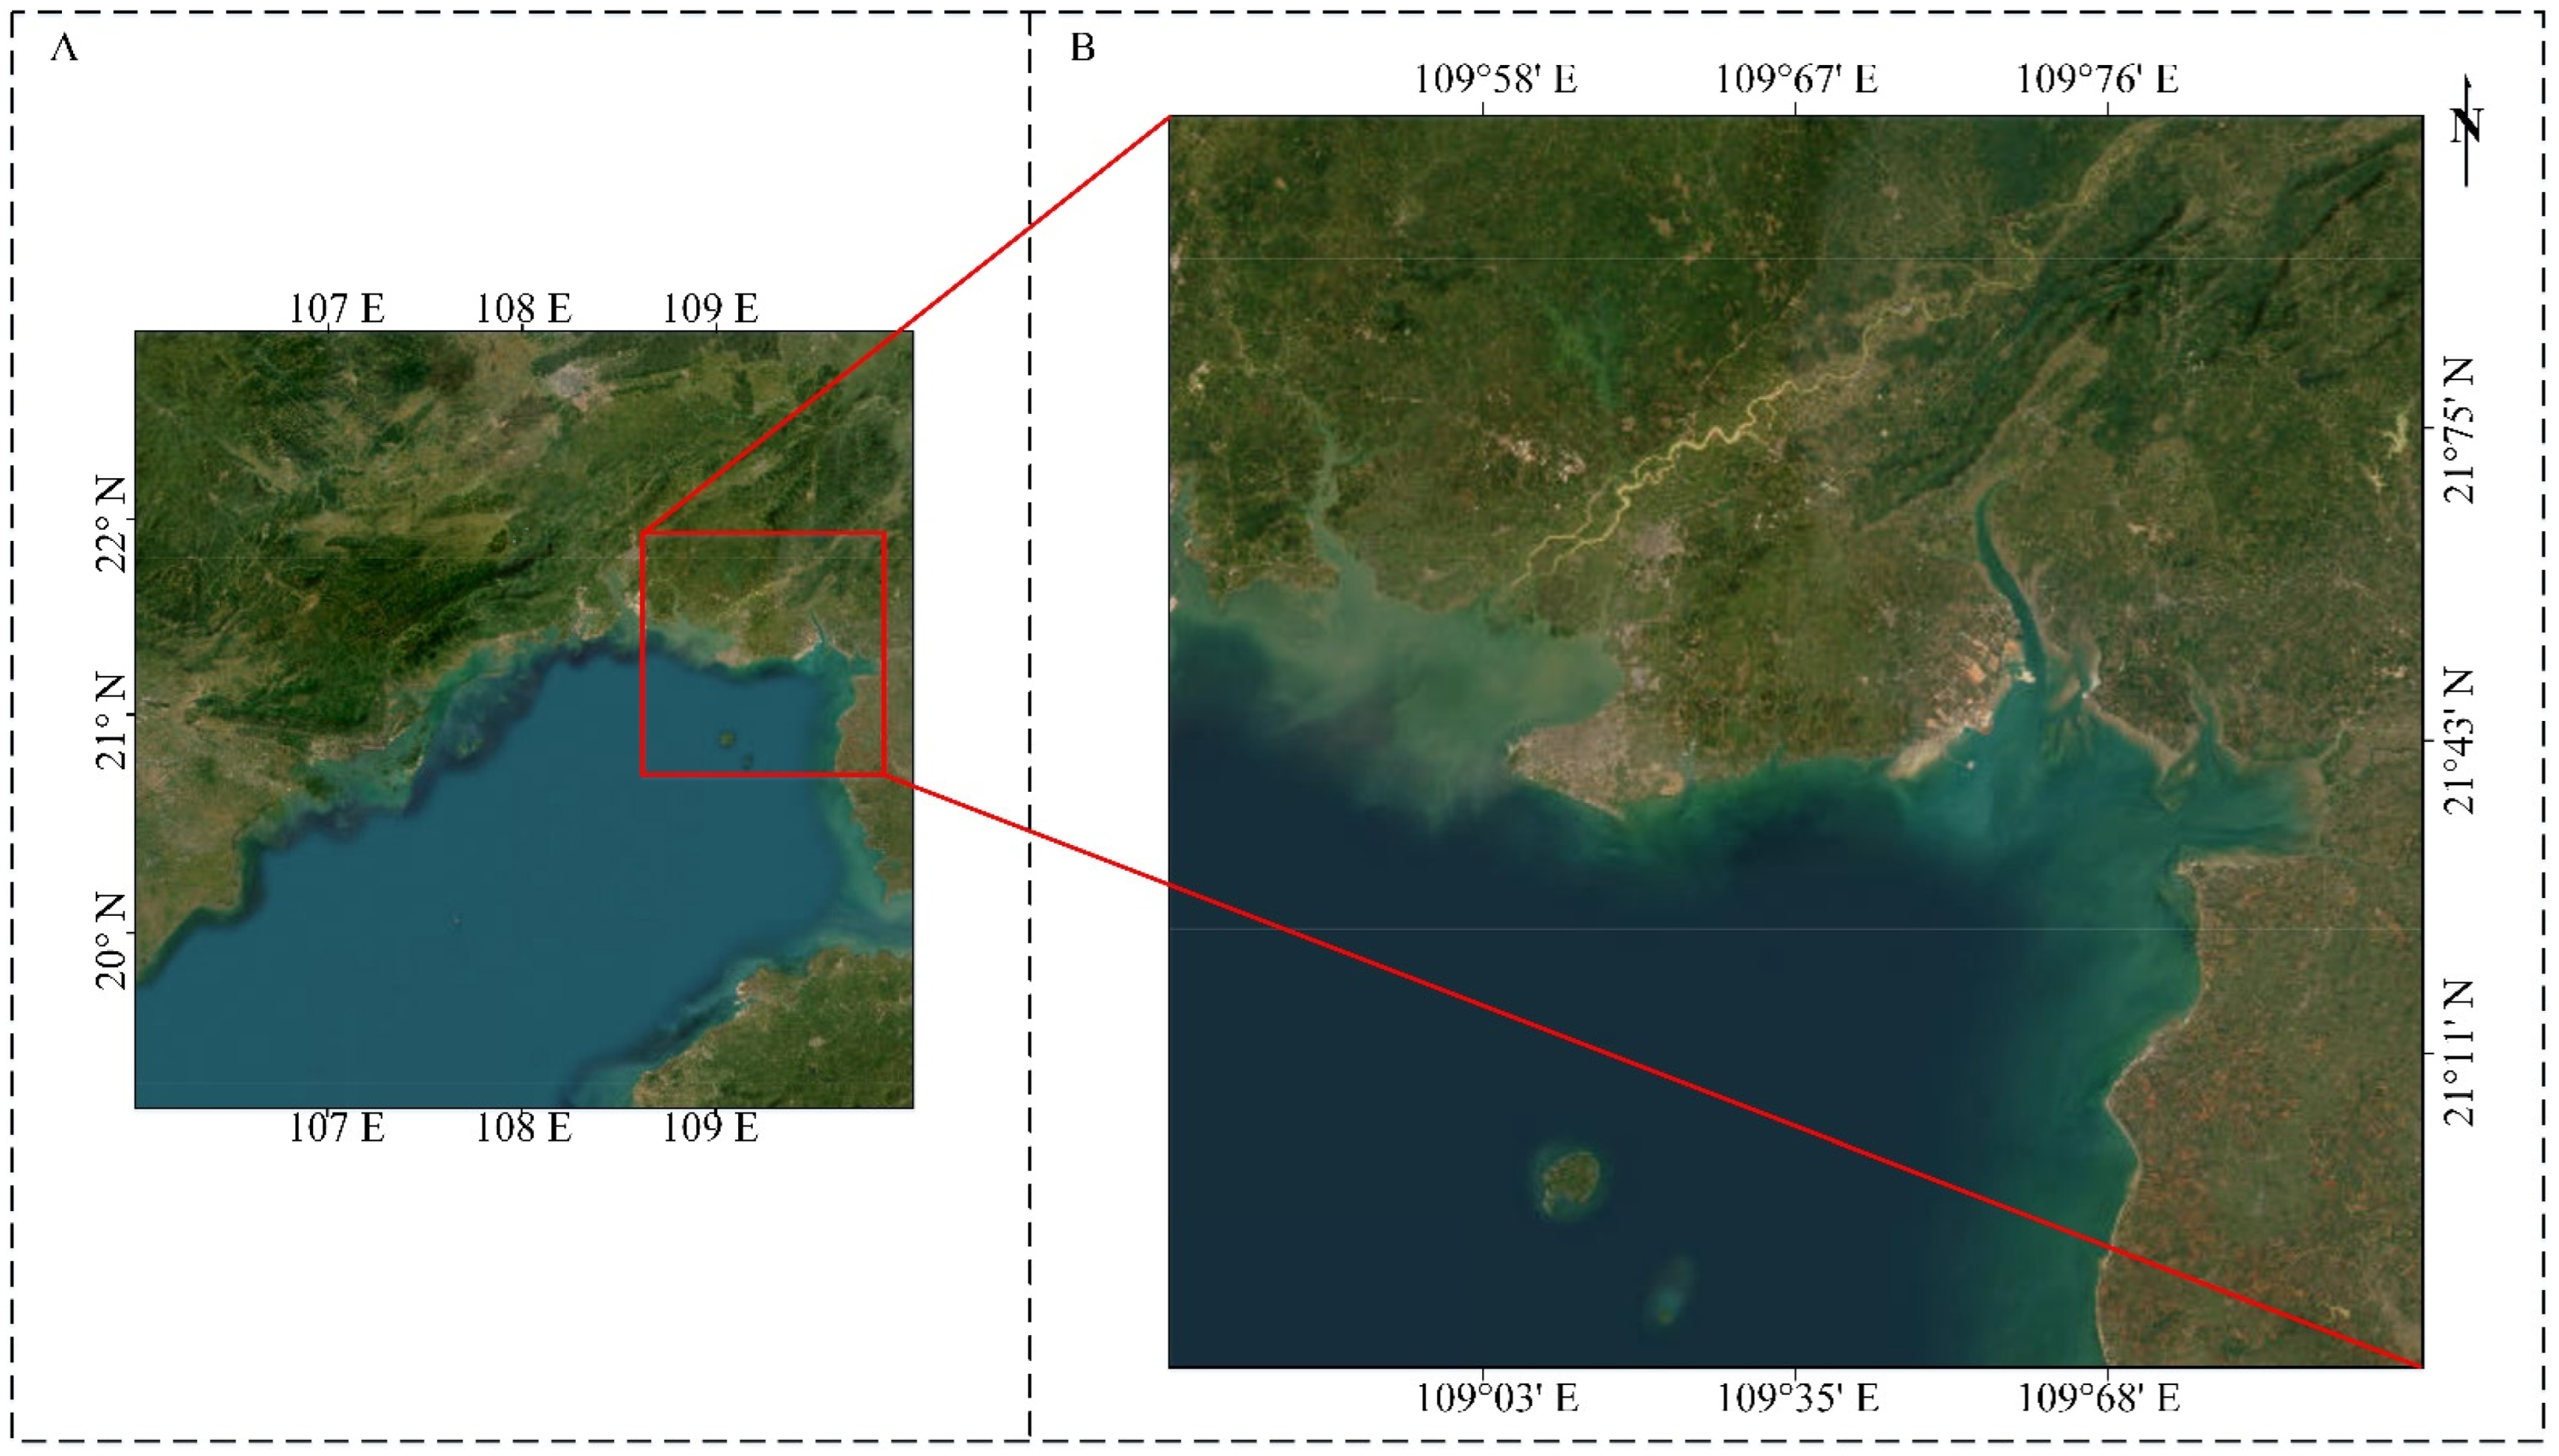
2.1. Data

The experimental datasets were acquired by GF-1 and GF-6 from 23 August 2016 to 18 December 2021, along the northeastern coast of Beibu Gulf, Guangxi, China, with a cloud coverage of less than 5% and spatial resolution of 8 m. Figure 2 shows the location of the study region. Table 1 shows the information of the studied remote sensing images.

2.1.1. GF-1

The GF-1 satellite carries a 2 m panchromatic camera, an 8 m multispectral camera, and four 16 m wide field view (WFV) cameras and was launched by China on 26 April 2013. To segment mangroves and Spartina alterniflora Loise, GF-1 multispectral images with 8 m resolution were chosen. The multispectral bands of this image consist of blue (0.45~0.52 μm), green (0.52~0.59 μm), red (0.63~0.69 μm), and near infrared (NIR) (0.77~0.89 μm) bands (Table 2).

2.1.2. GF-6

The GF-6 satellite is configured with a 2 m panchromatic/8 m multispectral high-resolution camera and a 16 m multispectral medium-resolution wide-field-view camera. The 2 m panchromatic/8 m multispectral camera has an observation width of 90 km, and the 16 m multispectral camera has an observation width of 800 km. The GF-6 satellite was successfully launched at Jiuquan Satellite Launch Center on 2 June 2018. Similar to the case for the GF-1 images, GF-6 multispectral images with 8 m resolution were chosen. The multispectral bands of this image consist of blue (0.45~0.52 μm), green (0.52~0.60 μm), red (0.63~0.69 μm), and near infrared (NIR) (0.76~0.90 μm) bands (Table 3).

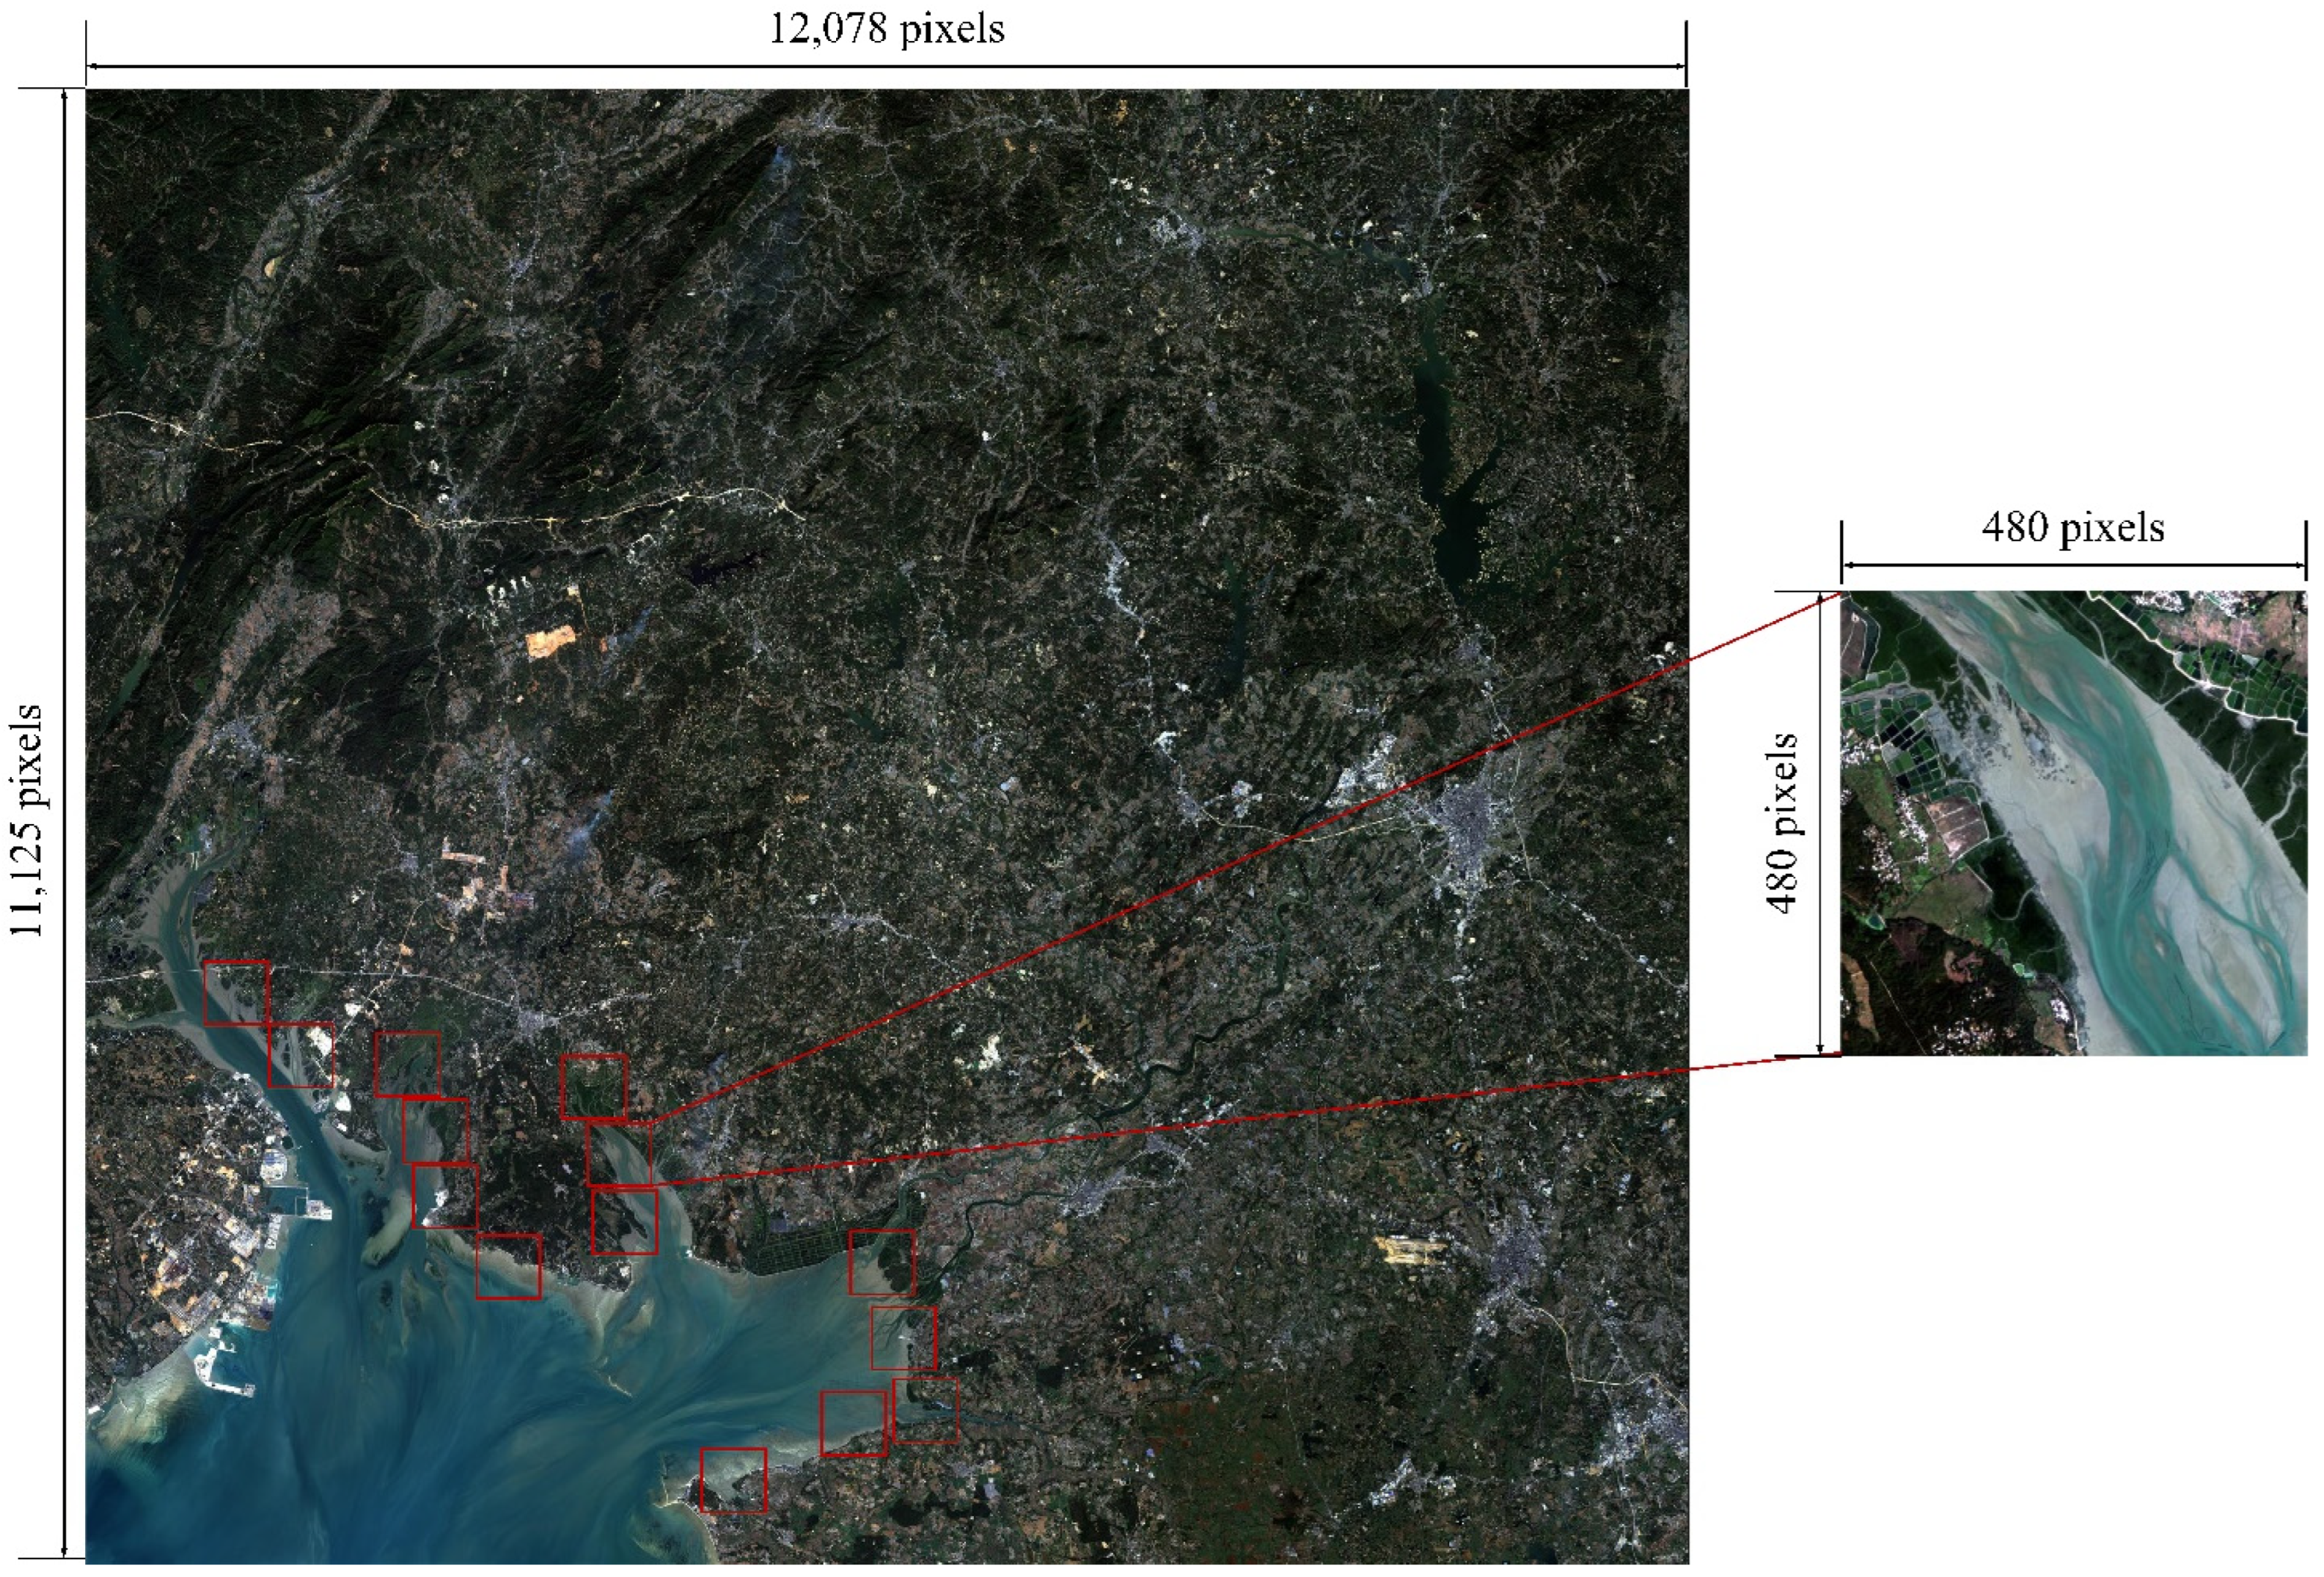
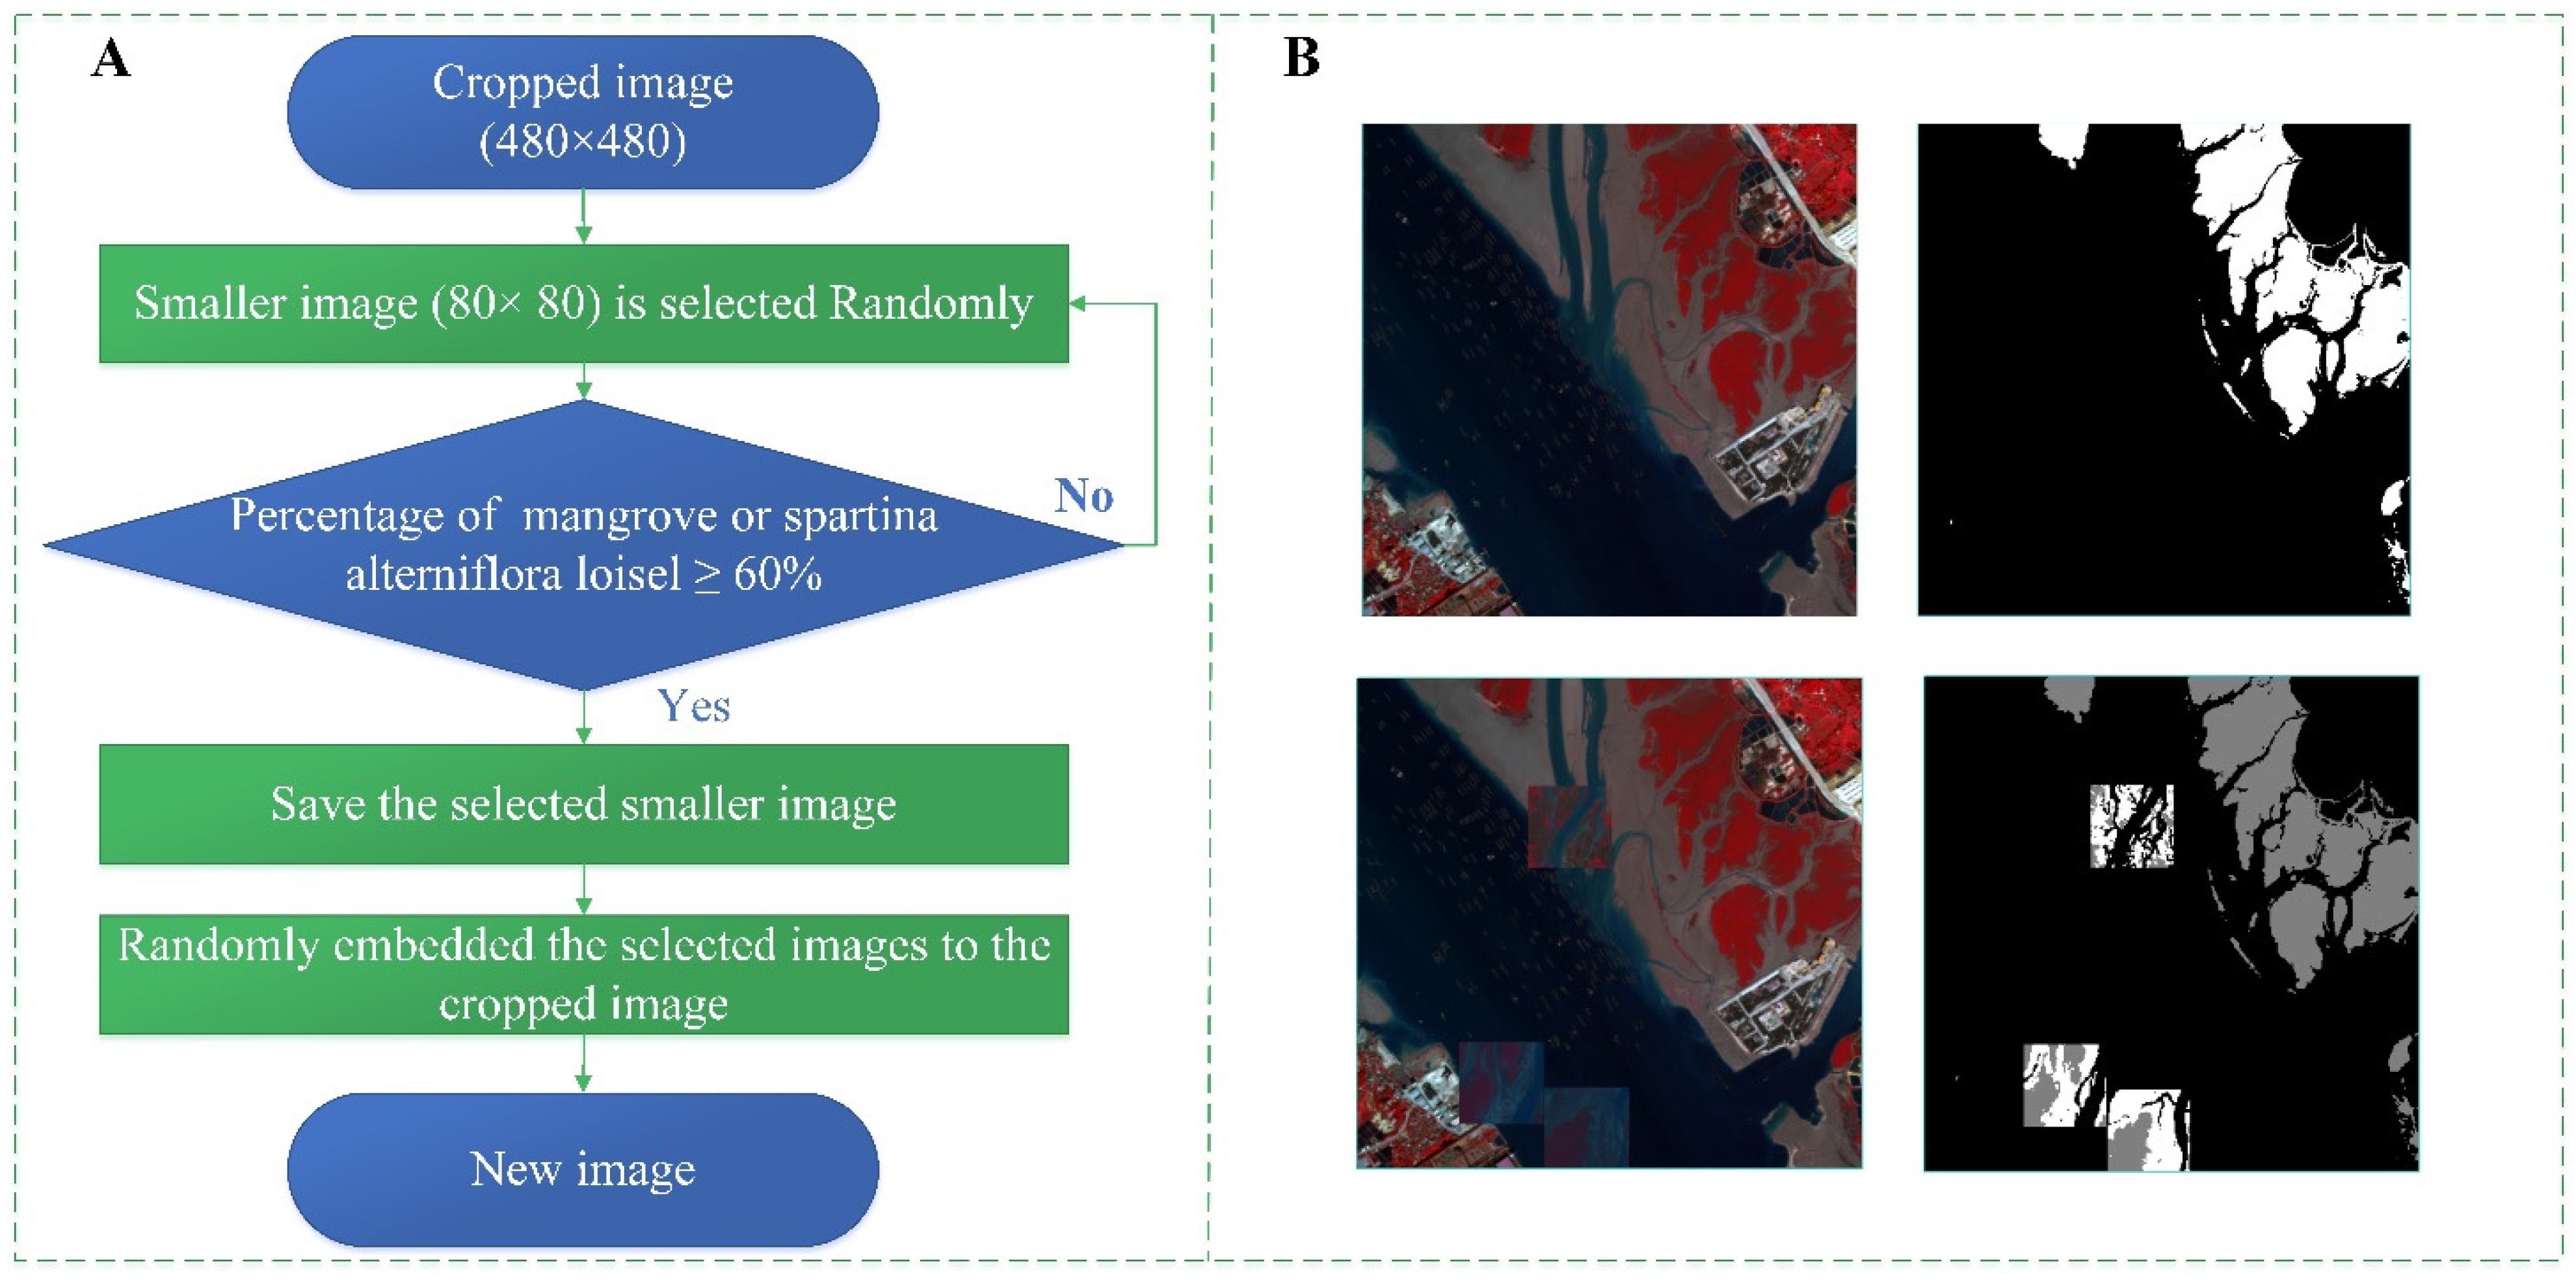
2.2. Data Preprocessing

The size of the GF-1 and GF-6 original images is larger than the area of mangrove or Spartina alterniflora Loise. However, the large size of remote sensing images leads to large amounts of computation. Therefore, smaller images containing the mangrove or Spartina alterniflora Loise were cropped manually. Figure 3 shows a schematic diagram of the original image and the cropped images; 14 smaller images were cropped from the original image.
In the cropped images, the area of the mangrove and Spartina alterniflora Loise was still small, which would lead to the unbalanced sample distribution problem. Hence, the mangrove and Spartina alterniflora Loise data were expanded. Figure 4 shows the flow and examples of the expansion. A smaller image of 80 × 80 was randomly selected in the cropped image, and if the percentage of the area of mangrove and Spartina alterniflora Loise was greater than 60%, the selected smaller image was saved. Finally, the saved images were randomly embedded into the cropped image, and a new image was generated.

3. Methods

Figure 5 shows the workflow of Swin-UperNet. Taking UperNet as the framework, the backbone network was replaced with a Swin transformer to improve the feature extraction capability (Figure 5B). In the Swin-UperNet model, a data concatenation module was proposed to make full use of the multispectral information of remote sensing images (Figure 5A); a boundary optimization module was designed to refine the rough segmentation results (Figure 5C); and a linear combination of cross-entropy loss and Lovasz-Softmax loss was taken as the loss function to address the problem of unbalanced sample distribution.

3.1. Data Concatenation Module

In the data concatenation module, 8 channels were used to enhance the spectral information for mangrove and Spartina alterniflora Loise segmentation, including blue, green, red, and NIR bands, normalized-difference vegetation index (NDVI), forest discrimination index (FDI), difference vegetation index (DVI), and normalized-difference water index (NDWI), wherein NDVI, FDI, DVI, and NDWI were spectral vegetation or water indexes [36,37,38,39] (Figure 5A).
The NIR and red bands are useful for extracting information on different vegetation [40]. The spectral vegetation and water indexes are spectral measures of canopy greenness [41], which could better reflect the difference between vegetation cover and growth conditions, especially suitable for vegetation monitoring. The normalized-difference vegetation index (NDVI) reflects the growth status and spatial distribution density of vegetation, which is widely used for vegetation assessment. The forest discrimination index (FDI) reflects the level of vegetation density classification in forest monitoring, which is frequently applied in mangrove distribution research. The difference vegetation index (DVI) reflects the change in soil background, which is used for vegetation ecology monitoring. The normalized-difference water index (NDWI) reflects information on water bodies, which contributes to distinguishing between mangroves and water bodies. Table 4 shows the calculation method of several spectral vegetation or water indexes.

3.2. Boundary Optimization Module

The boundary optimization module (BOM) was designed with inspiration from a residual block in ResNet (Figure 5C). The BOM avoided the problem of low-level feature vanishing caused by convolution operations and adjusted the rough segmentation results using a low-level feature map. The BOM added the output of two consecutive conv blocks using a skip connection. The conv block contained conv3×3, batch normalization, and ReLu activation function operations.

3.3. Loss Function

Linear combination of cross-entropy loss and Lovasz-Softmax loss was taken as the loss function to address the problem of unbalanced sample distribution [42]. The cross-entropy loss function is a pixel-wise loss function used in semantic segmentation tasks to measure the variability of pixels between the predicted value and the ground truth value, which is defined as follows:
Loss CE = 1 N I = 1 N y i * log y ^ i
where N is the number of pixels, y i is the ground truth class vector of a pixel i, and y ^ i is the output of the model of a pixel i. The cross-entropy loss function considers the probability that the prediction is correctly labeled, but when the number of samples in different categories is unbalanced, it will ignore the learning of the foreground class and affect the efficiency of the algorithm. For example, when the number of samples in the background class is much larger than the number of samples in the foreground class, the background class will be used as the dominant factor to learn. In this study, the number of samples of Spartina alterniflora Loise was smaller compared to other classes, and the unbalanced sample distribution is a serious problem for the segmentation of mangroves and Spartina alterniflora Loise. Hence, Lovasz-Softmax loss was selected to solve the unbalanced sample distribution problem and to optimize the accuracy of segmentation.
Lovasz-Softmax loss is proposed by Berman et al. for the Jaccard index (also called the intersection over union). The Jaccard index of class c is defined as
J c y , y ˜ = y = c y ˜ = c y = c y ˜ = c
where y is a vector of the ground truth labels and y ˜ is a vector of the predicted labels. Then, Jaccard index loss can be defined as
Δ J c y , y ˜ = 1 J c y , y ˜
and we can define the set of mispredicted pixels for class c as
M c y , y ˜ = y = c , y ˜ c y c , y ˜ = c
Equation (4) can be rewritten with M c as
Δ J c y , y ˜ = M c y = c M c
However, this loss function is not derivable. In order to optimize the Jaccard index for the training model, the discrete loss was smoothly extended based on a submodular analysis of the set function. The smooth extension is named the Lovasz extension, which is a set function Δ ¯ and is defined as
Δ J c ¯ m i = i = 1 p m i g i m
where p is the number of pixels in an image, m is the vector of pixel errors for class c, and the g i m is defined as
g i m = Δ J c π 1 ,   , π i Δ J c π 1 ,   , π i 1
where π 1 ,   , π i means a permutation ordering the components of m in decreasing order, such as m π 1   m π 2   m π 3     m π p .
In a multiclass segmentation task, the pixel errors vector of class c can be defined as
m i c = 1 f i c ,       if   c = y i f i c ,       otherwise
where f i c 0 , 1 is the predicted class of pixel I for class c. Then, the Lovasz-Softmax loss can be defined as
Loss LS = 1 C c C Δ J c ¯ m c
where C is the number of classes.
Therefore, to achieve sample distribution balance and excellent segmentation accuracy, the loss function of Swin-UperNet was defined as
loss = Loss CE + 1 Loss LS
where is a weight parameter to balance the cross-entropy loss and Lovasz-Softmax loss functions.

4. Result and Discussion

To evaluate the segmentation performance of the Swin-UperNet model, two comparison experiments were designed. In the ablation experiment, each improved component was analyzed. In the comparison experiment, the segmentation efficiency and accuracy of the Swin-UperNet model were compared against those of other models, including PSPNet, PSANet [43], DeepLabv3 [44], DANet [45], FCN, OCRNet [46], and DeepLabv3+ [47].

4.1. Experimental Data

Based on 27 GF-1/GF-6 remotes sensing images, 200 images with a size of 480 × 480 pixels were cropped. These 200 images were then flipped horizontally, vertically, and diagonally, and 800 remote sensing images were generated. Therefore, the experimental dataset consisted of 800 remote sensing images with a size of 480 × 480 pixels and 8 channels. The 800 remote sensing images were then divided into three sets: 640 images for training, 60 images for testing, and 100 images for validation. To ensure the reliability and validity of the segmentation results, the training and testing data were independent. Before training, the dataset was scaled in range of 0.5–1.5 with random multiplicity. Figure 6 shows the different input channels of the image and the ground truth, wherein the ground truth was labeled by experts.

4.2. Experimental Setups

The batch size was set to 2; the optimizer was “AdamW”; the weight decay was 0.01; the initial learning rate was 6 × 10⁻⁵; the learning rate strategy was “poly”; and the number of training iterations was 160,000. The segmentation models were implemented using PyTorch 1.7.1+cu101 with the MMSegmentation 0.11.0+ framework and executed on the Windows 10 platform with an NVIDIA Quadro RTX 3000 GPU.

4.3. Evaluation Metrics

Three evaluation metrics: pixel accuracy (PA), mean intersection over union (mIoU), and frames per second (FPS) [48] were used to evaluate the segmentation performance of the different models.
Pixel accuracy represents the ratio of pixels properly classified, divided by the total number of pixels. For K classes, PA is defined by
PA = i = 1 K + 1 p ii i = 1 K + 1 j = 1 K + 1 p ij
where K + 1 classes include K foreground classes and 1 background class, and p ij is the number of class i predicted as class j.
Mean intersection over union represents the average IoU over all classes, and IoU is the area of intersection between the predicted result and the label. mIoU is defined by
mIoU = i = 1 K + 1 A i B i A i B i K + 1
where A and B denote the label and the predicted results, respectively.
FPS represents frames processed per second, which is used to evaluate the computation efficiency of methods. FPS is defined by
FPS   = 1 t
where t represents the time taken to process an image.

4.4. Ablation Experiment

Table 5 shows the comparison of evaluation metrics between models with different settings, including with different loss functions, data processing (DP), data concatenation module (DCM), Swin transformer tiny (ST-Tiny), and boundary optimization module (BOM), respectively.
Compared to the models with a different loss function, the Swin-UperNet model achieved the best mIoU of 56.36% and PA of 94.29%, which illustrated that the linear combination of cross-entropy loss and Lovasz-Softmax loss was effective for mangrove and Spartina alterniflora Loise segmentation. Compared to the model without the data processing operation, the mIoU and PA of the Swin-UperNet model increased 29.8% and 2.76%, respectively. Compared to the model with a ResNet backbone network, the mIoU and PA of the Swin-UperNet model increased by 7.04% and 4.52%, respectively, which indicated that the Swin transformer was able to better extract object features for dealing with multichannel data. Compared to the model without a boundary optimization module, the Swin-UperNet model achieved the best mIoU and PA of 90.0% and 98.87%, respectively, which showed that the boundary optimization module could adjust the boundary segmentation and eliminate some misclassifications. These results denote that the Swin-UperNet model could improve the segmentation accuracy of mangroves and Spartina alterniflora Loise.
Table 6 shows the comparison of evaluation metrics between models with different input channels. The Swin-UperNet model achieved the best mIoU and PA. Furthermore, the mIoU and PA for mangrove segmentation increased from 83.0% to 91.03% and 87.37% to 98.35%, respectively. The mIoU and PA for Spartina alterniflora Loise segmentation increased from 63.18% to 79.65% and 69.65% to 89.15%, respectively. These results denote that adding spectral vegetation or water indexes to the data concatenation module of the Swin-UperNet model could improve the accuracy of mangrove and Spartina alterniflora Loise segmentation.

4.5. Comparison Experiment

We compared the proposed Swin-UperNet model against other models, including PSPNet, PSANet, DeepLabv3, DANet, FCN, OCRNet, and DeepLabv3+ to evaluate the segmentation performance for mangroves and Spartina alterniflora Loise. The segmentation results for mangroves and Spartina alterniflora Loise are shown in Figure 7, where red area, yellow area, and blue area denote mangrove, Spartina alterniflora Loise, and other, respectively. In the first and second rows, we see that the segmentation results obtained with the Swin-UperNet model were more accurate and the segmentation boundaries were closer to the ground truth. The third row shows that only the segmentation results of the Swin-UperNet model did not misclassify other categories as Spartina alterniflora Loise. From the fourth row, only the segmentation results of the Swin-UperNet model contained the small Spartina alterniflora Loise regions. Figure 7 shows that the segmentation results of the Swin-UperNet model were more consistent with ground truth.
Table 7 shows the results of the evaluation metrics. The Swin-UperNet model achieved the highest mIoU and PA, which were 90.0% and 98.87%, respectively. As for FPS, the Swin-UperNet model substantially exceeded PSPNet, PSANet, DeepLabv3, DANet, OCRNet, and DeepLabv3+.

5. Conclusions

Changes in the growth and distribution of mangroves and Spartina alterniflora Loise affect the security of ecological systems. Due to tides and silt, field observation is difficult and ineffective. Here, we proposed a Swin-UperNet model for highly efficient and accurate segmentation of mangroves and Spartina alterniflora Loise in remote sensing images.
In the Swin-UperNet model, the mangrove and Spartina alterniflora Loise datasets were built, which provided data support for the deep learning models. The data processing method was designed, which increased the diversity of data and the size of Spartina alterniflora Loise samples. The data concatenation module was proposed, which selected some multispectral bands and indexes and was beneficial for segmenting mangroves and Spartina alterniflora Loise. The Swin transformer was chosen as the backbone network, which improved the accuracy of segmentation. The boundary optimization module was proposed, which optimized the rough segmentation result and resolved the misclassification problem. A linear combination of cross-entropy loss and the Lovasz-Softmax loss was chosen as the loss function, which solved the problem of unbalanced sample distribution.
Three metrics were used to evaluate the accuracy and efficiency of the Swin-UperNet model, including pixel accuracy (PA), mean intersection over union (mIoU), and frames per second (FPS), which achieved results of 90.0%, 98.87%, and 10, respectively. The experiment results demonstrated that the proposed Swin-UperNet model could achieve higher efficiency and accuracy of segmentation results for mangroves and Spartina alterniflora Loise synchronously in remote sensing images. Moreover, the combination of remote sensing technology and deep learning could overcome the difficulty in field observation. However, there are still several challenges for the segmentation of mangroves and Spartina alterniflora Loise: How to use multisource remote sensing data to improve the accuracy of Spartina alterniflora Loise segmentation? How to predict the changing trends of distribution of mangroves and Spartina alterniflora Loise in time?

Author Contributions

Conceptualization, Z.W. and J.L.; methodology, J.L. and Z.T.; validation, M.L. and Z.W.; formal analysis, Z.W., X.L. and M.L.; investigation, J.L. and Z.T.; writing—original draft preparation, J.L. and Z.W.; writing—review and editing, Z.W., X.L. and M.L.; supervision, Z.W.; funding acquisition, Z.W. All authors have read and agreed to the published version of the manuscript.

Funding

This work was generously supported by the Key Laboratory of Marine Environmental Survey Technology and Application, Ministry of Natural Resources (Grant No. MESTA-2021-B007 to Z.W.), and by grants from the Capacity Development for Local College Project (Grant No. 19050502100 to Z.W.).

Data Availability Statement

The datasets for this study are available from the corresponding author on reasonable request.

Acknowledgments

We would like to thank the anonymous reviewers for their valuable suggestions.

Conflicts of Interest

The authors declare no conflict of interest.

References

  1. Liao, B.W.; Zhang, Q.M. Area, distribution and species composition of mangroves in China. Wetl. Sci. 2014, 12, 435–440. [Google Scholar] [CrossRef]
  2. Zhou, T.; Liu, S.; Feng, Z.; Liu, G.; Gan, Q.; Peng, S. Use of exotic plants to control Spartina alterniflora invasion and promote mangrove restoration. Sci. Rep. 2015, 5, 12980. [Google Scholar] [CrossRef] [PubMed] [Green Version]
  3. Zhang, Z.; Nie, S.; Sang, Y.; Mo, S.; Li, J.; Kashif, M.; Su, G.; Yan, B.; Jiang, C. Effects of Spartina alterniflora invasion on nitrogen fixation and phosphorus solubilization in a subtropical marine mangrove ecosystem. Microbiol. Spectr. 2022, 10, e00682-21. [Google Scholar] [CrossRef] [PubMed]
  4. Kasturi, K.; Afsaneh, S.; Arthur, C.; Hong, G.; Tan, K.P.; Ho, C.S.; Rasli, F.N. Satellite images for monitoring mangrove cover changes in a fast growing economic region in southern peninsular malaysia. Remote Sens. 2015, 7, 14360–14385. [Google Scholar] [CrossRef] [Green Version]
  5. Volpi, M.; Ferrari, V. Semantic segmentation of urban scenes by learning local class interactions. In Proceedings of the 2015 IEEE Conference on Computer Vision and Pattern Recognition Workshops (CVPRW), Boston, MA, USA, 7–12 June 2015; pp. 1–9. [Google Scholar] [CrossRef] [Green Version]
  6. Liu, K.; Mattyus, G. Fast multiclass vehicle detection on aerial images. IEEE Geosci. Remote Sens. Lett. 2015, 12, 1938–1942. [Google Scholar] [CrossRef] [Green Version]
  7. Audebert, N.; Saux, B.L.; Lefèvre, S. Segment-before-detect: Vehicle detection and classification through semantic segmentation of aerial images. Remote Sens. 2017, 9, 368. [Google Scholar] [CrossRef] [Green Version]
  8. Kemker, R.; Salvaggio, C.; Kanan, C. Algorithms for semantic segmentation of multispectral remote sensing imagery using deep learning. ISPRS J. Photogramm. Remote Sens. 2018, 145, 60–77. [Google Scholar] [CrossRef] [Green Version]
  9. Kemker, R.; Gewali, U.B.; Kanan, C. EarthMapper: A Tool Box for the Semantic Segmentation of Remote Sensing Imagery. arXiv preprint 2018, arXiv:1804.00292. [Google Scholar]
  10. Fu, W.; Shao, P.; Dong, T.; Liu, Z. Novel Higher-Order Clique Conditional Random Field to Unsupervised Change Detection for Remote Sensing Images. Remote Sens. 2022, 14, 3651. [Google Scholar] [CrossRef]
  11. Shao, P.; Shi, W.; Liu, Z.; Dong, T. Unsupervised change detection using fuzzy topology-based majority voting. Remote Sens. 2021, 13, 3171. [Google Scholar] [CrossRef]
  12. Liu, K.; Zhu, Y.; Qian, L.I.; Yuenan, L.I.; Xiao, W.; Meng, L. Analysis on mangrove resources changes of zhenhai bay in guangdong based on multi source remote sensing images. Trop. Geogr. 2016, 36, 850–859. [Google Scholar]
  13. Maurya, K.; Mahajan, S.; Chaube, N. Remote sensing techniques: Mapping and monitoring of mangrove ecosystem—A review. Complex Intell. Syst. 2021, 7, 2797–2818. [Google Scholar] [CrossRef]
  14. Jia, M.; Zhang, Y.; Wang, Z.; Song, K.; Ren, C. Mapping the distribution of mangrove species in the Core Zone of Mai Po Marshes Nature Reserve, Hong Kong, using hyperspectral data and high-resolution data. Int. J. Appl. Earth Obs. Geoinf. 2014, 33, 226–231. [Google Scholar] [CrossRef]
  15. Pham, L.T.; Brabyn, L. Monitoring mangrove biomass change in Vietnam using SPOT images and an object-based approach combined with machine learning algorithms. ISPRS J. Photogramm. Remote Sens. 2017, 128, 86–97. [Google Scholar] [CrossRef]
  16. Hermon, D.; Ganefri, P.A.; Oktorie, O. The model of mangrove land cover change for the estimation of blue carbon stock change in Belitung Island-Indonesia. Int. J. Appl. Environ. Sci. 2018, 13, 191–202. [Google Scholar]
  17. Pham, T.D.; Yoshino, K. Mangrove mapping and change detection using multi-temporal Landsat imagery in Hai Phong city, Vietnam. In Proceedings of the International Symposium on Cartography in Internet and Ubiquitous Environments, Tokyo, Japan, 17 March 2015; pp. 17–19. [Google Scholar]
  18. Wu, Z.; Gao, Y.; Li, L.; Xue, J.; Li, Y. Semantic segmentation of high-resolution remote sensing images using fully convolutional network with adaptive threshold. Connect. Sci. 2019, 31, 169–184. [Google Scholar] [CrossRef]
  19. Krizhevsky, A.; Sutskever, I.; Hinton, G.E. Imagenet classification with deep convolutional neural networks. Commun. ACM 2017, 60, 84–90. [Google Scholar] [CrossRef] [Green Version]
  20. Simonyan, K.; Zisserman, A. Very deep convolutional networks for large-scale image recognition. arXiv Preprint 2014, arXiv:1409.1556. [Google Scholar]
  21. Szegedy, C.; Liu, W.; Jia, Y.; Sermanet, P.; Reed, S.; Anguelov, D.; Erhan, D.; Vanhoucke, V.; Rabinovich, A. Going deeper with convolutions. In Proceedings of the IEEE Conference on Computer Vision and Pattern Recognition, Boston, MA, USA, 7–12 June 2015; pp. 1–9. [Google Scholar] [CrossRef] [Green Version]
  22. Long, J.; Evan, S.; Darrell, T. Fully convolutional networks for semantic segmentation. IEEE Trans. Pattern Anal. Mach. Intell. 2020, 39, 640–652. [Google Scholar] [CrossRef]
  23. Ronneberger, O.; Fischer, P.; Brox, T. U-net: Convolutional networks for biomedical image segmentation. In Proceedings of the Medical Image Computing and Computer-Assisted Intervention–MICCAI 2015: 18th International Conference, Munich, Germany, 5–9 October 2015; pp. 234–241. [Google Scholar]
  24. Badrinarayanan, V.; Kendall, A.; Cipolla, R. SegNet: A Deep Convolutional Encoder-Decoder Architecture for Image Segmentation. IEEE Trans. Pattern Anal. Mach. Intell. 2017, 39, 2481–2495. [Google Scholar] [CrossRef] [PubMed]
  25. Zhao, H.; Shi, J.; Qi, X.; Wang, X.; Jia, J. Pyramid Scene Parsing Network. In Proceedings of the 2017 IEEE Conference on Computer Vision and Pattern Recognition (CVPR), Honolulu, HI, USA, 21–26 July 2017; pp. 6230–6239. [Google Scholar] [CrossRef] [Green Version]
  26. Chen, L.C.; Papandreou, G.; Kokkinos, I.; Murphy, K.; Yuille, A.L. Semantic Image Segmentation with Deep Convolutional Nets and Fully Connected CRFs. arXiv Preprint 2014, arXiv:1412.7062. [Google Scholar] [CrossRef]
  27. Xiao, T.; Liu, Y.; Zhou, B.; Jiang, Y.; Jian, S. Unified Perceptual Parsing for Scene Understanding. In Proceedings of the European Conference on Computer Vision, Munich, Germany, 8–14 September 2018; pp. 418–434. [Google Scholar] [CrossRef] [Green Version]
  28. Kampffmeyer, M.; Salberg, A.B.; Jenssen, R. Semantic Segmentation of Small Objects and Modeling of Uncertainty in Urban Remote Sensing Images Using Deep Convolutional Neural Networks. In Proceedings of the IEEE Conference on Computer Vision and Pattern Recognition (CVPR) Workshops, Las Vegas, NV, USA, 19 December 2016; pp. 680–688. [Google Scholar] [CrossRef]
  29. Hamaguchi, R.; Fujita, A.; Nemoto, K.; Imaizumi, T.; Hikosaka, S. Effective Use of Dilated Convolutions for Segmenting Small Object Instances in Remote Sensing Imagery. In Proceedings of the 2018 IEEE Winter Conference on Applications of Computer Vision (WACV), Lake Tahoe, NV, USA, 12–15 March 2018; pp. 1442–1450. [Google Scholar] [CrossRef] [Green Version]
  30. Guo, M.; Yu, Z.; Xu, Y.; Huang, Y.; Li, C. ME-Net: A Deep Convolutional Neural Network for Extracting Mangrove Using Sentinel-2A Data. Remote Sens. 2021, 13, 1292. [Google Scholar] [CrossRef]
  31. Dosovitskiy, A.; Beyer, L.; Kolesnikov, A.; Weissenborn, D.; Zhai, X.; Unterthiner, T.; Dehghani, M.; Minderer, M.; Heigold, G.; Gelly, S.; et al. An image is worth 16x16 words: Transformers for image recognition at scale. arXiv Preprint 2020, arXiv:2010.11929. [Google Scholar]
  32. Han, K.; Xiao, A.; Wu, E.; Guo, J.; Xu, C.; Wang, Y. Transformer in transformer. Adv. Neural Inf. Process. Syst. 2021, 34, 15908–15919. [Google Scholar]
  33. Wang, W.; Xie, E.; Li, X.; Fan, D.P.; Song, K.; Liang, D.; Lu, T.; Luo, P.; Shao, L. Pyramid vision transformer: A versatile backbone for dense prediction without convolutions. In Proceedings of the IEEE/CVF International Conference on Computer Vision, Montreal, QC, Canada, 10–17 March 2021; pp. 568–578. [Google Scholar] [CrossRef]
  34. Yuan, L.; Chen, Y.; Wang, T.; Yu, W.; Shi, Y.; Tay, F.E.; Francis, E.; Feng, J.; Yan, S. Tokens-to-token vit: Training vision transformers from scratch on imagenet. In Proceedings of the IEEE/CVF International Conference on Computer Vision (ICCV), Montreal, QC, Canada, 10–17 October 2021; pp. 538–547. [Google Scholar] [CrossRef]
  35. Liu, Z.; Lin, Y.; Cao, Y.; Hu, H.; Wei, Y.; Zhang, Z.; Lin, S.; Guo, N. Swin Transformer: Hierarchical Vision Transformer using Shifted Windows. In Proceedings of the IEEE/CVF International Conference on Computer Vision (ICCV), Montreal, QC, Canada, 10–17 October 2021; pp. 10012–10022. [Google Scholar] [CrossRef]
  36. DeFries, R.S.; Townshend, J.R.G. NDVI-derived land cover classifications at a global scale. Int. J. Remote Sens. 1994, 15, 3567–3586. [Google Scholar] [CrossRef]
  37. Peter, B.; Richard, L. The delineation of tree crowns in Australian mixed species forests using hyperspectral Compact Airborne Spectrographic Imager (CASI) data. Remote Sens. Environ. 2006, 101, 230–248. [Google Scholar] [CrossRef]
  38. Jiang, Z.; Huete, A.R.; Chen, J.; Chen, Y.; Li, J.; Yan, G.; Zhang, X. Analysis of ndvi and scaled difference vegetation index retrievals of vegetation fraction. Remote Sens. Environ. 2006, 101, 366–378. [Google Scholar] [CrossRef]
  39. Gao, B.C. NDWI. A normalized difference water index for remote sensing of vegetation liquid water from space. Remote Sens. Environ. 1996, 58, 257–266. [Google Scholar] [CrossRef]
  40. Xue, J.; Su, B. Significant Remote Sensing Vegetation Indexs: A Review of Developments and Applications. J. Sens. 2017, 2017, 1353691. [Google Scholar] [CrossRef] [Green Version]
  41. Huete, A.R. Vegetation Indexs, Remote Sensing and Forest Monitoring. Geogr. Compass 2012, 6, 513–532. [Google Scholar] [CrossRef]
  42. Berman, M.; Triki, A.R.; Blaschko, M.B. The lovasz-softmax loss: A tractable surrogate for the optimization of the intersection- over-union measure in neural networks. In Proceedings of the IEEE Conference on Computer Vision and Pattern Recognition, Salt Lake City, UT, USA, 18–23 June 2018; pp. 4413–4421. [Google Scholar] [CrossRef] [Green Version]
  43. Nova, R.; Nurmaini, S.; Partan, R.U.; Putra, S.T. Automated image segmentation for cardiac septal defects based on contour region with convolutional neural networks: A preliminary study. Inform. Med. Unlocked 2021, 24, 100601. [Google Scholar] [CrossRef]
  44. Zhao, H.; Zhang, Y.; Liu, S.; Shi, J.; Loy, C.C.; Lin, D.; Jia, J. Psanet: Point-wise spatial attention network for scene parsing. In Proceedings of the European Conference on Computer Vision (ECCV), Munich, Germany, 8–14 September 2018; pp. 267–283. [Google Scholar] [CrossRef]
  45. Chen, L.C.; Papandreou, G.; Schroff, F.; Adam, H. Rethinking atrous convolution for semantic image segmentation. arXiv Preprint 2017, arXiv:1706.05587. [Google Scholar] [CrossRef]
  46. Fu, J.; Liu, J.; Tian, H.; Li, Y.; Bao, Y.; Fang, Z.; Lu, H. Dual Attention Network for Scene Segmentation. In Proceedings of the 2019 IEEE/CVF Conference on Computer Vision and Pattern Recognition (CVPR), Long Beach, CA, USA, 15–20 June 2019; pp. 3141–3149. [Google Scholar] [CrossRef] [Green Version]
  47. Yuan, Y.; Chen, X.; Wang, J. Object-contextual representations for semantic segmentation. In Proceedings of the European Conference on Computer Vision, Glasgow, UK, 23–28 August 2020; pp. 173–190. [Google Scholar] [CrossRef]
  48. Chen, L.C.; Zhu, Y.; Papandreou, G.; Schroff, F.; Adam, H. Encoder-Decoder with Atrous Separable Convolution for Semantic Image Segmentation. In Proceedings of the European Conference on Computer Vision (ECCV), Munich, Germany, 8–14 September 2018; pp. 801–818. [Google Scholar]
Figure 1. Flowchart of Swin transformer. (a) Patch merging. (b) Shifted window. (c) Two successive Swin transformer blocks.
Electronics 12 01111 g001
Figure 2. Location of the study region. (A) Northeastern coast of Beibu Gulf. (B) Study region.
Electronics 12 01111 g002
Figure 3. Schematic diagram of original image and the cropped images.
Electronics 12 01111 g003
Figure 4. Mangrove and Spartina alterniflora Loise data expansion. (A): Flowchart of expansion; (B): post-expansion examples.
Electronics 12 01111 g004
Figure 5. Flowchart of Swin-UperNet. (A): Data concatenation module; (B): Swin transformer; (C): boundary optimization module.
Electronics 12 01111 g005
Figure 6. Different input channels and the ground truth.
Electronics 12 01111 g006
Figure 7. Segmentation results for mangroves and Spartina alterniflora Loise by different models.
Electronics 12 01111 g007
Table 1. Information on GF-1 and GF-6 remote sensing images.
Study AreaSatelliteNumber of ImagesDate
Northeastern coast of Beibu Gulf, Guangxi, ChinaGF-12023 August 2016–18 December 2021
GF-6723 November 2019–4 December 2021
Table 2. Characteristics of GF-1 remote sensing image.
BandBand NameWavelength (μm)Spatial
Resolution (m)
Temporal
Resolution (Days)
Swath Width (km)
B1Blue0.45–0.528460
B2Green0.52–0.59
B3Red0.63–0.69
B4Near infrared0.77–0.89
Table 3. Characteristics of GF-6 remote sensing images.
BandBand NameWavelength (μm)Spatial
Resolution (m)
Temporal
Resolution (Days)
Swath Width (km)
B1Blue0.45–0.528490
B2Green0.52–0.60
B3Red0.63–0.69
B4Near infrared0.77–0.90
Table 4. Several spectral vegetation/water indexes.
IndexCalculation MethodCalculation in GF-1/GF-6
NDVINDVI = (NIR − R)/(NIR + R)(B4 − B3)/(B4 + B3)
FDIFDI = NIR − (Red + Green)B4 − (B3 + B2)
DVIDVI = NIR − RB4 − B3
NDWINDWI = (Green − NIR)/(Green + NIR)(B2 − B4)/(B2 + B4)
Table 5. Evaluation metrics comparison between models with different setting.
Loss FunctionDPDCMBackboneBOMmIoU (%)PA (%)
Cross-EntropyLovasz-SoftmaxOursResNet-50ST-Tiny
47.3993.46
55.0589.71
56.2694.29
81.0697.05
89.9198.86
82.8794.44
90.098.87
Table 6. Evaluation metrics comparison between different input channels.
Input ChannelMangroveSpartina alterniflora LoiselmIoU (%)PA (%)
IoU (%)PA (%)IoU (%)PA (%)
NIR + R + G83.087.3763.1869.6581.0697.05
NIR + R + G + NDVI89.5992.5773.8981.3887.1998.10
NIR + R + G + NDVI + FDI90.093.0674.6881.4987.6298.18
NIR + R + G + NDVI + FDI + DVI90.1593.1175.2882.3887.8898.21
NIR + R + G + NDVI + FDI + DVI + NDWI90.2193.2475.4582.7887.9598.22
NIR + R + G + B + NDVI + FDI + DVI + NDWI (Ours)91.0398.3579.6589.1589.9198.86
Table 7. Performance comparison between different segmentation models.
ModelBackboneMangroveSpartina alterniflora LoiselmIoU (%)PA (%)FPS
IoU (%)PA (%)IoU (%)PA (%)
PSPNetResNet5082.28 ± 1.8587.83 ± 2.1558.59 ± 2.0370.35 ± 3.3877.23 ± 2.9896.36 ± 0.345
PSANetResNet5082.11 ± 0.9787.78 ± 1.7656.75 ± 2.5165.85 ± 4.0176.49 ± 3.2796.16 ± 0.754
DeepLabv3ResNet5082.0 ± 0.5587.82 ± 1.0856.31 ± 2.5862.0 ± 4.3775.93 ± 3.0896.59 ± 0.323
DANetResNet5079.53 ± 3.7486.78 ± 2.2053.69 ± 3.3761.74 ± 4.5375.53 ± 3.6195.86 ± 2.145
FCNHRNet1884.74 ± 1.5489.43 ± 1.8762.98 ± 2.3374.24 ± 1.8981.68 ± 1.4396.31 ± 1.3312
OCRNetHRNet1883.04 ± 3.0586.98 ± 3.660.45 ± 5.1467.44 ± 7.5580.77 ± 2.3196.94 ± 0.548
DeepLabv3+ResNet5069.80 ± 3.3373.33 ± 13.4152.47 ± 8.5360.44 ± 11.7272.51 ± 1.9495.30 ± 1.685
OursSwin transformer tiny91.10 ± 0.1596.64 ± 0.5179.89 ± 1.2689.50 ± 1.4290.0 ± 0.4398.87 ± 0.0710
Disclaimer/Publisher’s Note: The statements, opinions and data contained in all publications are solely those of the individual author(s) and contributor(s) and not of MDPI and/or the editor(s). MDPI and/or the editor(s) disclaim responsibility for any injury to people or property resulting from any ideas, methods, instructions or products referred to in the content.

