Abstract
Automatic target detection of remote sensing images (RSI) plays an important role in military surveillance and disaster monitoring. The core task of RSI target detection is to judge the target categories and precise location. However, the existing target detection algorithms have limited accuracy and weak generalization capability for RSI with complex backgrounds. This study presents a novel feature enhancement single shot multibox detector (FESSD) algorithm for remote sensing target detection to achieve accurate detection of different categories targets. The FESSD introduces feature enhancement module and attention mechanism into the convolution neural networks (CNN) model, which can effectively enhance the feature extraction ability and nonlinear relationship between different convolution features. Specifically, the feature enhancement module is used to extract the multi-scale feature information and enhance the model nonlinear learning ability; the self-learning attention mechanism (SAM) is used to expand the convolution kernel local receptive field, which makes the model extract more valuable features. In addition, the nonlinear relationship between different convolution features is enhanced using the feature pyramid attention mechanism (PAM). The experimental results show that the mAP value of the proposed method reaches 81.9% and 81.2% on SD-RSI and DIOR datasets, which is superior to other compared state-of-the-art methods.
1. Introduction
Remote sensing image (RSI) target detection is one of the hot-research problems in the (RSI) interpretation field, which relates to many essential and fundamental applications in both military and civilian areas [1,2,3]. In the specific applications, remote sensing target detection can be applied in ship location [4], vehicle counting [5], disaster rescue [6], target attacks [7], warfare analysis [8], and so on. However, compared with the optical images, RSI has the characteristics of complex background, high target density, small target size, and large feature similarity between different categories targets [9,10].
In recent years, many RSI target detection methods have been proposed and widely used in different fields. The existing RSI target detection methods can be classified into traditional machine learning (ML) methods and deep learning (DL)-based methods [11]. In the process of using ML-based methods, the extracted features are specific to the target characteristics, such as colour, texture, shape, angle, and so on [12]. The commonly used feature extraction methods include scale-invariant feature transform (SIFT) [13], histogram of oriented gradient (HOG) [14], and deformable part model (DPM) [15]. In addition, many multi-feature combination methods have been proposed, which can effectively enhance the feature extraction effect [16,17,18,19]. To accurately classify the target category, the commonly used classifiers include support vector machine (SVM) [20], random forest (RF) [21], decision tree model (DTM) [22], and naive bayes classifier (NBC) [23]. However, the ML-based methods are dependent on prior knowledge, resulting in poor adaptability and generalization capabilities [24]. Currently, deep learning (DL) has achieved more significant breakthroughs and success in many application fields on image processing and computer vision [25,26,27,28]. The DL-based target detection methods can be divided into regression-based single-stage detection methods [29], and region proposal-based two-stage target detection methods [30]. The single-stage detection methods include DSSD [31], RetinaNet [32], RefineDet [33], and so on. The currently proposed two-stage target detection methods include Faster R-CNN [34], Mask R-CNN [35], FPN [36], and Cascade RCNN [37]. The DL-based target detection methods use the convolution neural network (CNN) structure for image feature extraction [38], which presents encouraging performances on target detection. However, due to the significant difference between the RSI and optical images, single convolution cannot fully extract the target region features.
In this study, we propose a feature enhancement single shot multibox detector algorithm (FESSD), where the feature enhancement module, self-attention mechanism (SAM) [39], and feature pyramid attention mechanism (FPA) are combined with the original (single shot multibox detector) SSD algorithm. In FESSD, the feature enhancement module is used to enhance the shallow features and deep features extracted by different convolution layers, and the SAM is used to expand the local and global receptive fields while enhancing the correlation between different features. Moreover, the FPA is used for multi-scale feature fusion and improving the model nonlinear learning ability. In summary, the main contributions of this study are as follows,
- To improve the accuracy of remote sensing target detection, this study proposed a feature enhancement single shot multibox detector algorithm (FESSD). Different from previous DL-based methods, the FESSD can effectively extract multi-scale feature information of remote sensing images.
- Feature enhancement structures that including feature enhancement module, self-attention mechanism, and feature pyramid attention mechanism are proposed for extracting meaningful features of remote sensing targets and suppressing background feature information interference.
- To assess the performance of the proposed FESSD, we perform a wide range of comparisons between different target detection methods on SD-RSI and DIOR dataset. The experiments results show that the proposed method is far more efficient than the other state-of-art methods.
2. Related Work
The related works are reviewed in this section, including the traditional machine learning (ML)-based methods and deep learning (DL)-based methods for target detection.
2.1. ML-Based Remote Sensing Target Detection Method
Many ML-based methods have been proposed for remote sensing target detection in the past decades. The main steps of ML-based methods include feature extraction, feature selection, and category classification. Specifically, Dong et al. [40] extract multi-scale features of remote sensing images and uses random forest metric learning (RFML) as a classifier for remote sensing target detection. Li et al. [41] proposed an automatic target detection using contour spatial model, which uses dynamic programming to calculate the similarity between contour information and target templates to achieve target detection. In [42], the sparse representation and hough transform (HT) are combined for target detection, the learned target and background dictionaries are used to represent sparse images specific classes, and the hough voting is used for spatial feature integration. The multi-feature fusion method is an effective way to achieve accurate target detection. In [43], multiple features, including colour, texture, shape, density, orientation, etc., are combined to realize target detection. Zhu et al. [44] present a novel target detection method based on both bottom-up and top-down saliency, where the scale-invariant features transform and SVM are used to detect the target regions. In [45], it combined the target information and first-order Markov model to train the nonlinear support vector data description (SVDD) and conduct target classification. Yang et al. [46] propose a novel target detection framework sparse CEM and sparse ACE based on the constrained energy minimization (CEM) and the adaptive coherence estimator (ACE). Zhang et al. [47] proposed a regularization framework for the measurement matrices, which adds a scaled identity matrix to strengthen the inverse matrices stability and improve the detection accuracy. However, the ML-based methods are susceptible to interference from complex scenes and background information, thus limiting its robustness and generalization.
2.2. DL-Based Remote sensing Target Detection Method
Benefiting from the feature extraction ability of CNN, it has been widely used in RSI target detection. Lei et al. [48] proposed a region-enhanced CNN (RECNN) for RSI target detection. In RECNN, it uses saliency constraint and multilayer feature fusion strategy to enhance the CNN model detection performance. Lu et al. [49] proposed a novel target detection model, which uses the channel attention mechanism to learn the global and local features of the target. To obtain a suitable ROI scale, Dong et al. [50] carried out the statistical analysis on the target, and designed a better target detection model based on the suitable ROI scale. In [51], Sun et al. proposed a novel method for designing loss function, called adaptive saliency biased loss (ASBL), which can train target detectors model to achieve better performance. Bai et al. [52] use the dense residual network (DRNet) and ROI pooling to enhance the original Faster R-CNN detection performance. YOLOv3 is a commonly used single-stage target detection method, Ma et al. [53] use the ShuffleNet to enhance the feature extraction capability of YOLOv3. To alleviate the influence of illumination transformation and complex background, Li et al. [54] proposed a novel Global-Local Saliency Constraint Network (GLS-Net), which can make full use of global semantic feature information and achieve more accurate oriented bounding boxes. Sun et al. [55] proposed a part-based convolutional neural network (PBNet) for complex composite object detection, using the context refinement module to obtain multi-scale and global context features. To improve the model feature extraction ability, He et al. [56] proposed a deformable contextual feature pyramid for adaptive extraction the multi-scale features contained in RSI. Wang et al. [57] proposed a feature-merged single-shot detection (FMSSD) for multi-scale objects detection in RSI, which uses the atrous spatial feature pyramid (ASFP) module to extract and fuse the multi-scale features, and the area-weighted loss function is used for improving the detection accuracy.
3. Proposed Method
3.1. Overall Architecture
Single shot multibox detector (SSD) as a single-stage target detection algorithm has achieved better results in ordinary optical image detection [58]. However, limited by the ability to obtain deep features and global context information, SSD cannot achieve accurate detection of small and dense targets. To improve the detection accuracy of small and dense target in RSI, the FESSD is proposed based on the SSD algorithm. In FESSD, the shallow feature enhancement (SFE) module, deep feature enhancement (DFE) module, self-attention mechanism (SAM), and feature pyramid attention mechanism (PAM) are introduced into SSD algorithm to improve the detection accuracy of remote sensing image targets. The overall framework of FESSD is shown in Figure 1, where the SFE module and DFE module are used to perform shallow and deep feature enhancement; the SAM is introduced into the backbone network to enhance the correlation of the extracted features by different convolution layer; and the PAM is used to fully extract local and global features.
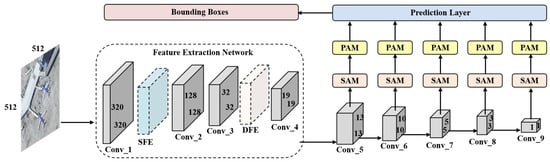
Figure 1.
The structure of feature enhancement single shot multiBox detector (FESSD), including the Shallow Feature Enhancement (SFE) Module, Deep Feature Enhancement (DFE) Module, Self-Attention Mechanism (SAM), and Feature Pyramid Attention Mechanism (PAM).
3.2. Feature Enhancement Module
To enhance the model feature extraction ability and relationships between different features, inspired by Inception [59], ResNet [60], and dual-path network (DPN) [61], we proposed shallow feature enhancement (SFE) module and deep feature enhancement (DFE) module. The structure of the feature enhancement module is shown in Figure 2.
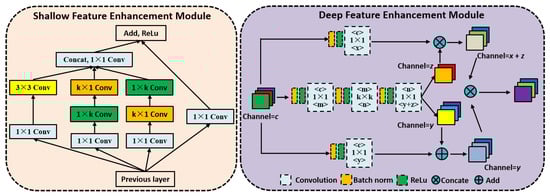
Figure 2.
The structure of feature enhancement module, including the Shallow Feature Enhancement (SFE) Module and Deep Feature Enhancement (DFE) Module.
Shallow Feature Enhancement (SFE) Module. The SFE module contains four different branches, the first branch uses convolution and dilated convolution to enhance the model global receptive field range and nonlinear learning ability. the second and third branches use group convolution to improve the feature extraction ability without increasing calculation parameters; the fourth branch uses convolution to obtain original primary features and uses the residual connection for feature transfer. Specifically, the SFE module uses group convolution to decompose the convolution kernel into and , which saves training time while ensure the local receptive field unchanged, and the function and fusion operation are used to fuse the different branch feature maps. The formal description is as follows,
- (1)
- The convolution layer is defined as follows,where, l represents the number of layers, W represents the convolution weight, b represents the bias value, and f represents activation function.
- (2)
- The definition of dilated convolution is as follows,where, ⊛ represents the dilated convolution, F represents the input image, k represents kernel function, and p, s, and t represent the corresponding domains, respectively.
- (3)
- The calculation process of residual learning is as follows,where, represents the current layer, represents the next layer, represents the weight of l layer, and F represents residual function.
- (4)
- The calculation formula of function and fusion operation are as follows,where, and represent the input of different channels, c represents the number of channels, k represents the kernel function, and ∗ represents the convolution operation.
Deep Feature Enhancement (DFE) Module. The DFE module combined the advantages of ResNet [60] and DenseNet [62] for feature extraction, which can not only deepen the model structure, but also realize the progressive fusion of different layer feature information. The DFE module uses the group convolution and dense connection operation to enhance the feature information of different convolution layers and channels. The calculation process of DFF module is as follows,
- (1)
- The dense connection calculation formal is as follows,where, denotes the transformation function, and l denotes convolution layers.
- (2)
- Group convolution. The input of group convolution is , is its filter, and the output by convolution is . Therefore, the number of calculation parameters for group convolution is half of the corresponding origibal convolution operation.
- (3)
3.3. Self-Attention Mechanism
In the operation process of CNN, since the limited and fixed size of the convolution kernel, each convolution operation can only cover the area calculated by the convolution kernel, so the global feature and multi-scale feature contained in the image are not easily obtained. To make the features extracted by the convolution layer more relevant, the self-attention mechanism (SAM) is introduced in FESSD, and the structure of self-attention is shown in Figure 3. The SAM is mainly used to perform multi-scale transformation and fusion of input feature maps. The SAM module includes convolution, feature transformation, feature scaling, and feature fusion. The convolution operation can normalize the channel of the input feature map; the feature transformation and scaling are used to enhance the correlation between different feature points in the feature map; and the feature fusion output the final self-attention feature map.
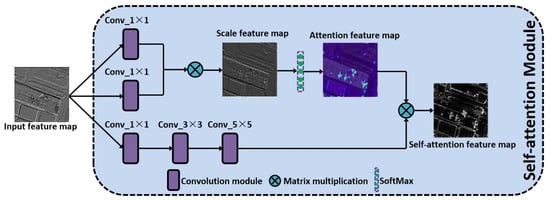
Figure 3.
The structure of self-attention mechanism (SAM), including the convolution module, matrix multiplication, and SoftMax function.
As shown in Figure 3, assuming that the size of input feature map N is , where c represents the number of feature map channels, w represents the width, h represents the height. The overall calculation process of SAM is as follows,
- (1)
- Perform three convolution operations on the input feature map, where the first and second convolution modules uses the convolution kernel to compress the number of feature map channels, and then expand and transform the width and height of the feature map into matrix Q and K; the third convolution module continues to uses convolution, but maintains the number of feature channels unchanged, and expands the width and height of the input feature map into matrix V; then the and convolution operations are performed to further extract the feature information.
- (2)
- The matrix Q is transposed, and the transpose matrix and matrix K are multiplied to obtain the scale feature map matrix .
- (3)
- The scale feature matrix E is is normalized in the column direction using SoftMax function, and the relationship between different feature points of the feature map is obtained, that is the attention matrix feature map, and the matrix elements is calculated as follows,where, represents each element in the attention matrix feature map, represents each element in the scale feature map matrix, N represents the number of elements in the scale feature map matrix.
3.4. Feature Pyramid Attention Mechanism
The feature pyramid network (FPN) can extract feature of different scales from the pixel-level and calculates the multiple receptive field information in parallel [36]. However, in the traditional feature pyramid network, the information fusion between different scales feature maps is completed by simple linear superposition, ignoring the nonlinear relationship between different levels branches. The feature pyramid attention mechanism (FPAM) uses the modified feature pyramid structure to obtain the multi-scale features of different objects and increases the model nonlinear feature extraction ability.
As shown in Figure 4, FPAM includes pyramid feature extraction (PFE) module and attention feature fusion (AFF) module, where the PFE module is used to obtain multi-scale features of different feature map; AFF module is used for multi-scale fusion of different scale attention feature maps. Specially, the PFE module includes four layers of convolution structure, in which , , , and convolution operation are used for multi-scale feature extraction, and the down-sampling is used to reduce the feature map resolution size; the AFF module is constructed with a hierarchical manner, the multi-scale feature extraction is performed by using different size convolution kernels, and the up-sampling operation is used to generate the attention weight map. Moreover, to avoid the misjudgment of the original input feature map in the process of PFE and AFF module, the original feature map is linearly superimposed with the result of AFF module. The FPAM can mapping the feature into different sub-regions, it by aggregating the semantic content of different sub-regions to make the final output feature have global semantic information.
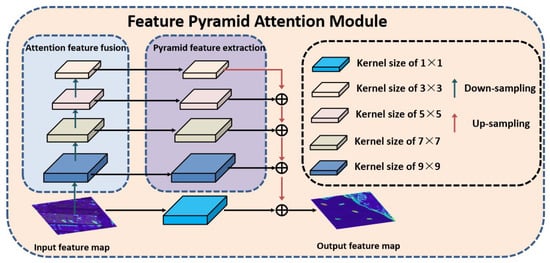
Figure 4.
The structure of feature pyramid attention mechanism (FPAM), including the Attention Feature Fusion (AFF) Module and Pyramid Feature Extraction (AFF) Module.
The formal description of FPAM is as follows,
where, S represents the output, I represents the input, and N represents the number of layers in the FPAM.
where, represents the size of convolution kernel, U represents up-sampling operation, represents the output of the layer.
where, D represents down-sampling operation, represents the input of the layer.
3.5. Bounding Boxes Selection and Loss Function
To accurately detect remote sensing objects of different categories, the bounding boxes with different aspect ratios are designed to match the size of different object categories. Assuming that the convolution feature of m convolution layers are selected for the object detection, the size of candidate bounding boxes for the feature of layer is calculated as
where, and represent the scale coefficients of candidate bounding boxes.
Assuming that the ratio of width to height of the candidate bounding boxes is , the width is , and height is , the center coordinate is calculated as
where, represents the size of layer features.
To solve the problem of model degradation caused by the imbalance of the positive and negative samples of the remote sensing image during the model training process, the FESSD is optimized and trained based on the SSD algorithm loss function combined with the focal classification loss, which is expressed as follows,
where, N denotes the number of bounding boxes that match the ground truth, x denotes the input image, c is the object category, p is the predicted category probability, l denotes the bounding boxes, and a denotes the weight of bounding boxes and ground truth box.
The and are focus classification loss and bounding box regression loss, where the bounding box regression loss is inspired by the position regression function of Faster R-CNN, which is calculated as follows,
where, represents the comparison between candidate boxes and ground truth boxes for category, represents the candidate box value, and represents the ground truth box value. The cross entropy function is sued to calculate the loss of focus classification loss function , which is calculated as follows,
where, represents the predict category corrects probalility, and is the probability calcualted by SoftMax function.
4. Experiments
4.1. Dataset
To evaluate the detection performance of the proposed FESSD algorithm, a total of 1972 optical remote sensing images with a size of 500 × 375 pixels containing seven kinds of targets in different scenes are collected from Google Earth, and the spatial resolution varies from 0.5 to 2 m.
The dataset is named SD-RSI, and the original image and annotation is available at https://drive.google.com/drive/rs-drive (accessed on 5 December 2022). The specific target categories include airplane, ship, bridge, vehicle, storage tank (ST), baseball diamond (BD), and tennis court (TC), which contain 10,550 instance samples, 7558 targets are used as the train dataset, and 2992 targets are used as test dataset. The train samples are separately rotated with the angle of , which extend the number of train samples by 40 times. In addition, according to the criterion, the collected optical remote sensing images are divided into four classes (i.e. small target: area < m; medium target: m < area < m; Large target: area > m) for split the target size, the target data distribution is shown in Table 1. Compared with the existing dataset NWPU VHR-10 [63] and AID [64] dataset, the constructed dataset mainly focuses on small size and medium size targets, and the target distribution is denser.

Table 1.
The sample statistics of constructed dataset.
Figure 5 shows sample examples of the constructed dataset, which are 19 airplanes, 29 storage tanks, 8 ships, 5 vehicles with a resolution of 1m, and 2 bridges with a resolution of 2m. Because some airplane and ship targets only contain a small number of pixels under the condition of low resolution, it is difficult to manually judge whether it is an airplane or ship. Therefore, only targets with more than 5 pixels are labeled. The images annotations process is shown in Figure 6, in which the LabelImg software used for target annotation. In the obtained parameters, represent the coordinates of the upper left corner in the rectangle box where the target is located, w denotes the width, and h denotes the height.
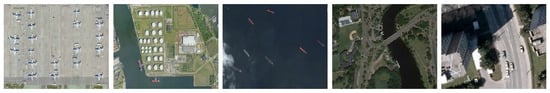
Figure 5.
Samples of the constructed dataset.
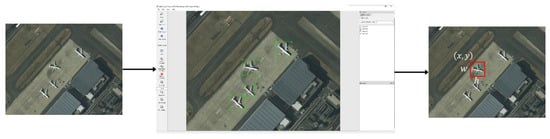
Figure 6.
Dataset image annotation process.
4.2. Evaluation Metrics
To evaluate the proposed MFENet, intersection over ratio (IoU), precision, recall, average precision (AP), and mean AP (mAP) are used to assess the performance of object detection. The IoU is defined as
where, represents the area of the intersection of and ; is the area of union of and . In the object detection process, the overlap threshold is given, if , the predicted bounding box is considered to be true positive. The precision is defined as
where, represents the number of true positive predicted bounding box; represents the number of false positive predicted bounding box. The recall is defined as
where, represents the number of objects that are not detected. The area under the precision-recall curve (PRC) obtained by plotting precision and recall. F1_score is an equilibrium value of target detection accuracy, which is defined as
The AP is commonly used in object detection evaluation, which is defined as the average accuracy of object detection model at different recall levels. The mAP is the mean value of detection accuracy for different object categories, which is defined as
where, N represents the number of object categories.
4.3. Implementation Details
The experiments are conducted on a PC with 11 GB NVIDIA 2080Ti, the operating system is Ubuntu 16.04, and the programming environment is Keras with CUDA kernels. The RSI dataset is divided into train, validation, and test datasets. The train dataset includes 934 images, and each validation and test dataset include 310 remote sensing images. The FESSD use the batch train method for experiment on the dataset, each batch contains 32 images, and the number of iterations is set to 10,000 in the experiment process. The initial learning rate of this stage is set to 0.0001, and it decays 0.1 after 3000 iterations.
4.4. Parameter Optimization
The IoU threshold is an important indicator that affects mAP. The higher thresholds of IoU, the more accurate the regression of the corresponding bounding boxes. Since the target detection in the remote sensing image is a two-class problem, that is, the image includes target area and backbone area.
Therefore, when the predict value exceeds 0.5, it can be determined that the predict class is correct. Under the same experimental parameter settings, the IoU threshold is set to 0.2, 0.35, 0.5, 0.65 and 0.8. To select the appropriate IoU, the precision, recall, F1_score, and mAP indicators are calculated for different IoU thresholds on the test dataset, and the experimental results are shown in Table 2. It can be seen from the experiment results, with the IoU threshold increases, the evaluation indicators of the model changed. The F1_score and mAP indicators first increase then decrease, and the optimal value is obtained when IoU reaches 0.5; From the Equation (17), we can know that precision is determined by TP and FP, so with IoU increases, FP increases accordingly, which leads to the precision value decrease; From the Equation (18), we can know that recall is determined by TP and FN, so with IoU increases, the TP value gradually increases, and the recall also increases; Equation (19) shows that the F1_score depends on precision and recall, so the change trend of F1_score is consistent with precision.
Table 2.
The impact of different IoU thresholds on model performance.
4.5. Performance Evaluation and Comparison
In this experiment, we evaluated the performance of FESSD algorithm, and compared it with multiple target detection algorithms, i.e., Contour-Based Spatial (CBS) Model [41], Partial Intensity Invariant Feature (PIIF) Descriptor [65], ASBL-RetinaNet [51], RECNN [48], GLS-Net [54], SSD [55], YOLOV3 [66], and FFESSD [67]. The results of nine target detection algorithms under the same experimental settings are shown in Table 3. Moreover, to evaluation the detection accuracy, the parameter IoU of all compared model is set to 0.5.
Table 3.
The performance comparisons of different methods on the SD-RSI dataset.
Table 3 shows the detection performance of each algorithm for different target categories, and the evaluation indicators used include AP value, mAP, and FPS. Compared with the SSD algorithm, the mAP of FESSD is boosted from 0.783 to 0.819, which indicates the effectiveness of the proposed improved scheme. In terms of mAP, FESSD is better other compared state-of-the-art algorithms. Specifically, compared with the ML-based methods CBS-Model and PIIF Descriptor, the mAP is 0.116 and 0.139 higher respectively; compared with DL-based detection methods ASBL-RetinaNet, RECNN, and CLS-Net, the mAP of FESSD is 0.078, 0.049, and 0.048 higher respectively; compared with the one-stage detection method YOLOV3 and two-stage detection method FFESSD, the mAP of the proposed method is 0.058 and 0.043 higher respectively. In terms of seven different target detection categories, the AP value of FESSD is better than other detection methods. Specifically, for small targets airplane, vehicle, ship, and storage tank, the AP value of FESSD outperforms the second-best by 0.028, 0.023, 0.034, and 0.033; for medium targets bridge, baseball diamond, and tennis court, the AP of FESSD outperforms the second-best by 0.002, 0.082, and 0.036. In addition, the FPS of FESSD reaches 35.6, which is better than other compared methods, indicating that FESSD has strong real-time performance. However, for small target of airplane, vehicle, and ship, although the FESSD achieved the best AP value, the results are not very satisfactory. The reason may be the small target has fewer pixels, the number of targets is dense, and has the target overlap phenomenon. To further demonstrate the effectiveness of FESSD for target detection, the visual detection results of different target classic are shown in Figure 7. It can be observed from Figure 7, FESSD has better detection results for multiple targets classic under different scenarios, even the remote sensing image with the large variations in orientations and sizes. Particularly, for small targets, the FESSD can achieve accurate detection and location.
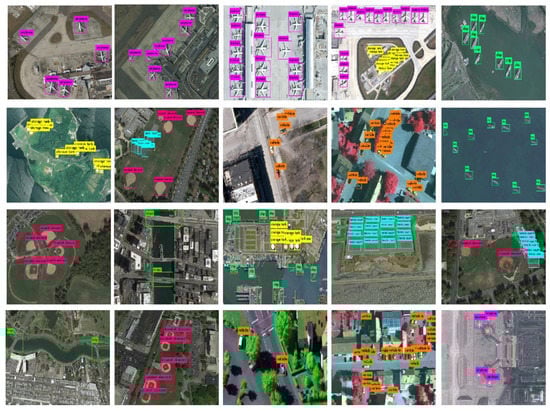
Figure 7.
Visual detection results of FESSD on the SD-RSI dataset.
To further verify the performance of FESSD, we conducted experimental analysis on the DIOR dataset. The DIOR dataset contains more than 23 k images and 192 k instances, covering 20 object categories [68]. In the experimental process, we selected small and dense target categories such as airplane, harbor, ship, vehicle, baseball field (BF), and storage tank (ST) as detection objects, and the performance quantitative analysis of different methods is shown in Table 4. It can be seen from Table 4 that the mAP of FESSD on the DIOR dataset reaches 0.812, which is higher than other compared methods. The mAP of ML-based methods CBS-Model and PIIF are 0.659 and 0.620, indicating that these methods cannot accurately detect small and dense targets. DL-Based remote sensing target detection methods ASBL-RetinaNet, RECNN, and GLS-Net achieve better detection results, but the detection accuracy is relatively poor for small targets such as airplane, ship, and vehicle. The mAP of generic target detection methods SSD, YOLOV3, and FFESSD are 0.669, 0.693, and 0.755, although better than the ML-based methods, but cannot satisfy the requirements for accurate detection of remote sensing targets. In term of detection speed, the FPS of FESSD reaches 36.5, indicating that it can achieve fast detection of remote sensing targets. Figure 8 shows the visual detection results of FESSD on the DIOR dataset, from which it can be seen that FESSD can achieve accurate detection and location of different remote sensing target categories.
Table 4.
The performance comparison of different methods on the DIOR dataset.
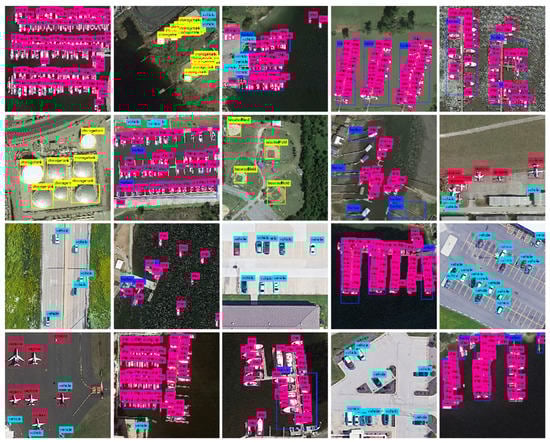
Figure 8.
Visual detection results of FESSD on the DIOR dataset.
4.6. Ablation Study
In this experiment, we evaluate the performance of each part of FESSD. To analyze the impact of the shallow feature enhancement (SFE) module and the deep feature enhancement (DEF) module on the remote sensing target detection accuracy mAP, the experiment set up different feature enhancement module combinations, and the experimental effects of each module are shown in Table 5.
Table 5.
The influence of feature enhancement module on target detection.
It can be seen from Table 5 that by adding the SFE module on the basis of SSD model, the mAP increased from 0.771 to 0.798, and the mAP of the small targets airplane, vehicle, and ship increased by 0.037, 0.026, and 0.053, respectively. However, due to the addition of SFE module, the model parameters increased and the FPS decreased by 8.2. When the DFE module is added on the basis of SSD, the target detection accuracy of each class is improved, and the DFE module makes the deep network structure more efficient, so that the FPS reaches 38.2. When the SFE module and DFE module are added at the same time, in terms of detection accuracy, the mAP of FESSD has reached 0.830, which is an improvement of 0.059 compared to SSD, and the detection accuracy of different class has been improved, especially the small target airplane, vehicle, and ship reached 0.824, 0.731, and 0.763 respectively.
Figure 9 shows the visual detection results of different feature enhancement modules. Figure 9a is the detection result of SSD algorithm, which has problems such as target positioning offset and low confidence; Figure 9b is the detection results of the introduction SFE module, which has been greatly improved compared to the detection confidence of SSD; Figure 9c is the detection result of the introduction DEF module, although the confidence of target detection is improved, but occurs target positioning offset problem; Figure 9d is the detection result of FESSD, which not only accurately detect the target class, but also completes precise target positioning.
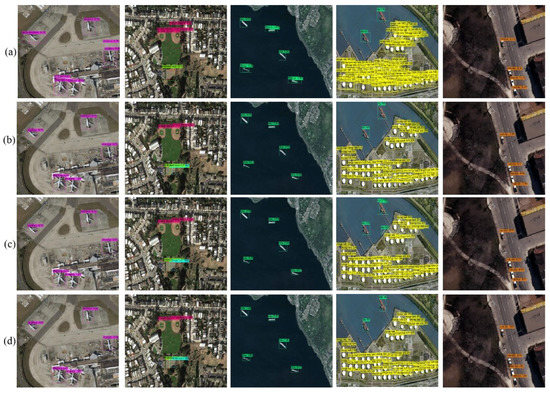
Figure 9.
Visual detection results of different feature enhancement module.
To compare the feature enhancement effects of different feature enhancement modules on the network, we visualize the last convolution layer of FESSD, and the results are shown in Figure 10. It can be seen from the Figure 10 that the original SSD algorithm has no obvious effect on the feature extraction of the detected target, and a large amount of target feature information is lost; When the SFE module is introduced, the feature extraction ability for target has been significantly enhanced, especially for the contour and texture features of small targets; When the DFE module is introduced, its feature extraction ability has been greatly improved compared to SSD, but the feature enhancement effect is not very obvious, because the function of DEF module is to deepen the depth of the network and alleviate the overfitting problem during the training process; FESSD has significant target area feature enhancement capabilities, it can be seen that FESSD accurately enhances the target area features and suppresses a large amount of background information.
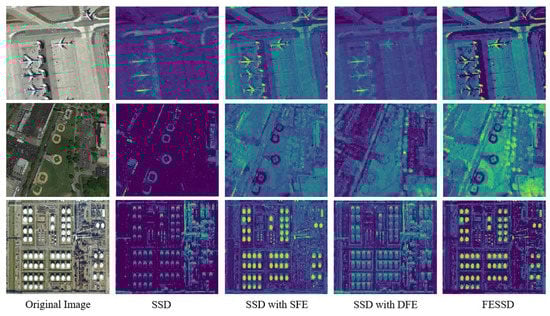
Figure 10.
The feature maps visualization results of the last convolution layer.
The influence of different attention mechanisms on the model training process and detection accuracy is shown in Figure 11. After iterative training, the loss value of SSD algorithm is 0.145, and the detection accuracy mAP reaches 0.832, indicating that its training effect and detection performance still need to be improved. When the attention mechanism module is introduced, both the SAM module and the FPA module improve the performance of the SSD algorithm. When the SAM module is introduced, the loss value and mAP of the model reaches 0.130 and 0.905. When the FPA module is introduced, the loss value and mAP of the model reaches 0.140 and 0.931. Compared with the SSD algorithm, the model with FPA and SAM has obvious advantages, and from the loss curve and mAP value, it can be analyzed that the FESSD model training effect and detection performance are better.
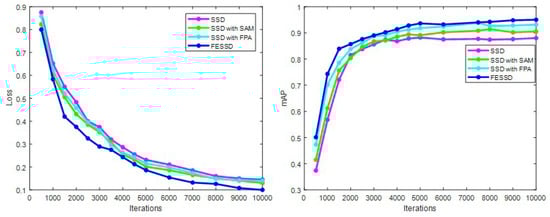
Figure 11.
The comparison of loss values and mAP of different attention mechanisms.
Figure 12 shows the heat maps of SSD algorithm, self-attention mechanism (SAM) module, feature pyramid attention mechanism (PAM) module, and FESSD algorithm. It can be seen from Figure 12 that the region of interest (ROI) of the SSD algorithm does not correspond to the target area, which leads to inaccurate positioning of the target; the introduction of the SAM module enhances the correlation between features, so that ROI focuses on the target area, but there is still attention distraction phenomenon; the introduction of FPA enhances the feature fusion capability of the model, so that the ROI and the target area correspond to each other, and local receptive field is enlarged; When the SAM and FPA modules are introduced at the same time, the local receptive field and ROI of the model are expanded, and the ROI completely corresponds to the target area, which means that the model can accurately extract the features of the target area.
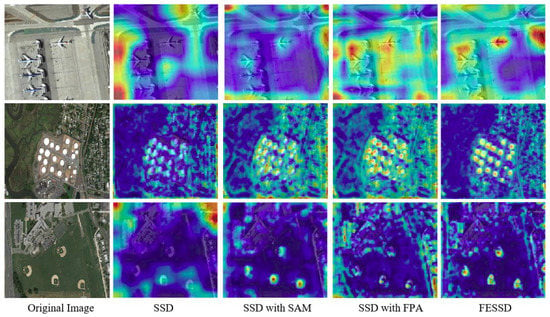
Figure 12.
The effect of different attention mechanism on model performance.
The operational efficiency of different DL-based methods is compared using the evaluation index of memory space (the memory utilization space of the model training process), calculation parameters, train time (the train time required to achieve the model optimal detection accuracy), and single image test time. The calculation efficiency comparison results of different methods are shown in Table 6. The proposed FESSD has advantages in different evaluation indicators of calculation efficiency, its memory space and calculation parameters are 6.38 GB and 32,168,285, which show that FESSD requires less computation resource in the model training process. The train time of FESSD is 7.25 h, which is the minimum of several compared methods, and its single image test time is 2.41 s, further proves that FESSD can satisfy the real-time requirement of remote sensing target detection.
Table 6.
The calculation efficiency comparison of different methods.
5. Conclusions
In this study, we presented a novel remote sensing target detection algorithm FESSD. The proposed method can effectively extract the multi-scale features and global contextual features contained in remote sensing images to achieve accurate detection of small and dense remote sensing targets. In FESSD, the feature enhancement module is used to enhance the shallow and deep features extracted by different convolution layers. The self-learning attention mechanism is used to expand the local receptive fields and multi-scale feature extract ability. In addition, the feature pyramid attention mechanism is used to enhance the nonlinear relationship between different feature maps. The experimental results on SD-RSI and DIOR show that proposed FESSD outperformed the compared state-of-the-art remote sensing target detection methods, which demonstrated the effectiveness and robustness of FESSD. In the future, we will introduce unsupervised learning methods to reduce the dependence on annotation data.
Author Contributions
Conceptualization, J.G. and S.Z.; methodology, J.G.; software, Z.W.; validation, J.G., Z.W. and S.Z.; formal analysis, Z.W. and S.Z.; writing—original draft preparation, J.G., Z.W. and S.Z.; writing—review and editing, J.G. and Z.W.; visualization, Z.W. and S.Z. All authors have read and agreed to the published version of the manuscript.
Funding
This work was supported in part by the Neural Science Foundation of Shaanxi Province under Grant 2021JQ-879, in part by the National Natural Science Foundation of China under Grant 62172338, in part by the National Natural Science Foundation of China under Grant 61671465, and in part by the Shaanxi Province key R&D Program under Grant 2021GY-341 and the research foundation for talented scholars of Xijing University with Grant No. XJ17B06.
Acknowledgments
The authors would like to thank Zhengyang Zhao and Nan Xu for their support, secondly, thanks to Liping Wang and Feng Wang for their support.
Conflicts of Interest
The authors declare no conflict of interest.
References
- Xiao, Z.; Gong, Y.; Long, Y.; Li, D.; Wang, X.; Liu, H. Airport Detection Based on a Multiscale Fusion Feature for Optical Remote Sensing Images. IEEE Geosci. Remote Sens. Lett. 2017, 14, 1469–1473. [Google Scholar] [CrossRef]
- Zhuang, Y.; Li, L.; Chen, H. Small Sample Set Inshore Ship Detection from VHR Optical Remote Sensing Images Based on Structured Sparse Representation. IEEE J. Sel. Top. Appl. Earth Obs. Remote Sens. 2020, 13, 2145–2160. [Google Scholar] [CrossRef]
- Zhang, L.; Zhang, Y. Airport Detection and Aircraft Recognition Based on Two-Layer Saliency Model in High Spatial Resolution Remote-Sensing Images. IEEE J. Sel. Top. Appl. Earth Obs. Remote Sens. 2017, 10, 1511–1524. [Google Scholar] [CrossRef]
- Li, Q.; Mou, L.; Liu, Q.; Wang, Y.; Zhu, X.X. HSF-Net: Multiscale Deep Feature Embedding for Ship Detection in Optical Remote Sensing Imagery. IEEE Trans. Geosci. Remote Sens. 2018, 56, 7147–7161. [Google Scholar] [CrossRef]
- Zhou, H.; Wei, L.; Lim, C.P.; Nahavandi, S. Robust Vehicle Detection in Aerial Images Using Bag-of-Words and Orientation Aware Scanning. IEEE Trans. Geosci. Remote Sens. 2018, 56, 7074–7085. [Google Scholar] [CrossRef]
- Thomas, J.; Kareem, A.; Bowyer, K.W. Automated Poststorm Damage Classification of Low-Rise Building Roofing Systems Using High-Resolution Aerial Imagery. IEEE Trans. Geosci. Remote Sens. 2014, 52, 3851–3861. [Google Scholar] [CrossRef]
- Dai, Y.; Shen, L.; Cao, Y.; Lei, T.; Qiao, W. Detection of Vegetation Areas Attacked By Pests and Diseases Based on Adaptively Weighted Enhanced Global and Local Deep Features. In Proceedings of the IGARSS 2019 IEEE International Geoscience and Remote Sensing Symposium, Yokohama, Japan, 28 July–2 August 2019; pp. 6495–6498. [Google Scholar]
- Zwieback, S.; Hajnsek, I.; Edwards-Smith, A.; Morrison, K. Depth-Resolved Backscatter and Differential Interferometric Radar Imaging of Soil Moisture Profiles: Observations and Models of Subsurface Volume Scattering. IEEE J. Sel. Top. Appl. Earth Obs. Remote Sens. 2017, 10, 3281–3296. [Google Scholar] [CrossRef]
- Wang, Z.; Du, L.; Zhang, P.; Li, L.; Wang, F.; Xu, S.; Su, H. Visual Attention-Based Target Detection and Discrimination for High-Resolution SAR Images in Complex Scenes. IEEE Trans. Geosci. Remote Sens. 2018, 56, 1855–1872. [Google Scholar] [CrossRef]
- Song, Z.; Sui, H.; Hua, L. How to Quickly Find the Object of Interest in Large Scale Remote Sensing Images. In Proceedings of the IGARSS 2018 IEEE International Geoscience and Remote Sensing Symposium, Valencia, Spain, 22–27 July 2018; pp. 4843–4845. [Google Scholar]
- Pang, G.; Shen, C.; Cao, L.; van den Hengel, A. Deep Learning for Anomaly Detection: A Review. ACM Comput. Surv. 2022, 54, 1–38. [Google Scholar] [CrossRef]
- Zhu, H.; Ni, H.; Liu, S.; Xu, G.; Deng, L. TNLRS: Target-Aware Non-Local Low-Rank Modeling with Saliency Filtering Regularization for Infrared Small Target Detection. IEEE Trans. Image Process. 2020, 29, 9546–9558. [Google Scholar] [CrossRef]
- Burger, W.; Burge, M.J. Scale-Invariant Feature Transform (SIFT). In Digital Image Processing; Texts in Computer Science; Springer International Publishing: Cham, Switzerland, 2022; pp. 709–763. [Google Scholar]
- Guedira, M.R.; Qadi, A.E.; Lrit, M.R.; Hassouni, M.E. A Novel Method for Image Categorization Based on Histogram Oriented Gradient and Support Vector Machine. In Proceedings of the 2017 International Conference on Electrical and Information Technologies (ICEIT), Rabat, Morocco, 15–18 November 2017; pp. 1–5. [Google Scholar]
- Felzenszwalb, P.; McAllester, D.; Ramanan, D. A Discriminatively Trained, Multiscale, Deformable Part Model. In Proceedings of the 2008 IEEE Conference on Computer Vision and Pattern Recognition, Anchorage, AK, USA, 24–26 June 2008; pp. 1–8. [Google Scholar]
- Tokarczyk, P.; Wegner, J.D.; Walk, S.; Schindler, K. Features, Color Spaces, and Boosting: New Insights on Semantic Classification of Remote Sensing Images. IEEE Trans. Geosci. Remote Sens. 2015, 53, 280–295. [Google Scholar] [CrossRef]
- Zhao, B.; Zhong, Y.; Xia, G.-S.; Zhang, L. Dirichlet-Derived Multiple Topic Scene Classification Model for High Spatial Resolution Remote Sensing Imagery. IEEE Trans. Geosci. Remote Sens. 2016, 54, 2108–2123. [Google Scholar] [CrossRef]
- Peng, F.; Wang, L.; Gong, J.; Wu, H. Development of a Framework for Stereo Image Retrieval with Both Height and Planar Features. IEEE J. Sel. Top. Appl. Earth Obs. Remote Sens. 2015, 8, 800–815. [Google Scholar] [CrossRef]
- Mylonas, S.K.; Stavrakoudis, D.G.; Theocharis, J.B.; Zalidis, G.C.; Gitas, I.Z. A Local Search-Based GeneSIS Algorithm for the Segmentation and Classification of Remote-Sensing Images. IEEE J. Sel. Top. Appl. Earth Obs. Remote Sens. 2016, 9, 1470–1492. [Google Scholar] [CrossRef]
- Guo, Y.; Jia, X.; Paull, D. A Domain-Transfer Support Vector Machine for Multi-Temporal Remote Sensing Imagery Classification. In Proceedings of the 2017 IEEE International Geoscience and Remote Sensing Symposium (IGARSS), Fort Worth, TX, USA, 23–28 July 2017; pp. 2215–2218. [Google Scholar]
- Sheykhmousa, M.; Mahdianpari, M.; Ghanbari, H.; Mohammadimanesh, F.; Ghamisi, P.; Homayouni, S. Support Vector Machine Versus Random Forest for Remote Sensing Image Classification: A Meta-Analysis and Systematic Review. IEEE J. Sel. Top. Appl. Earth Obs. Remote Sens. 2020, 13, 6308–6325. [Google Scholar] [CrossRef]
- Baraldi, A. Fuzzification of a Crisp Near-Real-Time Operational Automatic Spectral-Rule-Based Decision-Tree Preliminary Classifier of Multisource Multispectral Remotely Sensed Images. IEEE Trans. Geosci. Remote Sens. 2011, 49, 2113–2134. [Google Scholar] [CrossRef]
- Yang, J.; Ye, Z.; Zhang, X.; Liu, W.; Jin, H. Attribute Weighted Naive Bayes for Remote Sensing Image Classification Based on Cuckoo Search Algorithm. In Proceedings of the 2017 International Conference on Security, Pattern Analysis, and Cybernetics (SPAC), Shenzhen, China, 15–17 December 2017; pp. 169–174. [Google Scholar]
- Zhang, L.; Zhang, L.; Tao, D.; Huang, X. Sparse Transfer Manifold Embedding for Hyperspectral Target Detection. IEEE Trans. Geosci. Remote Sens. 2014, 52, 1030–1043. [Google Scholar] [CrossRef]
- Li, M.; Liu, Y.; Liu, X.; Sun, Q.; You, X.; Yang, H.; Luan, Z.; Gan, L.; Yang, G.; Qian, D. The Deep Learning Compiler: A Comprehensive Survey. IEEE Trans. Parallel Distrib. Syst. 2021, 32, 708–727. [Google Scholar] [CrossRef]
- Saha, S.; Mou, L.; Qiu, C.; Zhu, X.X.; Bovolo, F.; Bruzzone, L. Unsupervised Deep Joint Segmentation of Multitemporal High-Resolution Images. IEEE Trans. Geosci. Remote Sens. 2020, 58, 8780–8792. [Google Scholar] [CrossRef]
- Li, G.; Li, L.; Zhu, H.; Liu, X.; Jiao, L. Adaptive Multiscale Deep Fusion Residual Network for Remote Sensing Image Classification. IEEE Trans. Geosci. Remote Sens. 2019, 57, 8506–8521. [Google Scholar] [CrossRef]
- Alam, F.I.; Zhou, J.; Liew, A.W.-C.; Jia, X.; Chanussot, J.; Gao, Y. Conditional Random Field and Deep Feature Learning for Hyperspectral Image Classification. IEEE Trans. Geosci. Remote Sens. 2019, 57, 1612–1628. [Google Scholar] [CrossRef]
- Hou, L.; Xue, J.; Lu, K.; Hao, L.; Rahman, M.M. A Single-Stage Multi-Class Object Detection Method for Remote Sensing Images. In Proceedings of the 2019 IEEE Visual Communications and Image Processing (VCIP), Sydney, Australia, 1–4 December 2019; pp. 1–4. [Google Scholar]
- Chen, X.; Yu, X.; Ding, H.; Xue, Y.; Guan, J. Fast and Reftned Radar Processing for Maneuvering Target via Two-Stage Integration Detection. In Proceedings of the 2019 IEEE 2nd International Conference on Electronic Information and Communication Technology (ICEICT), Harbin, China, 20–22 January 2019; pp. 547–551. [Google Scholar]
- Fu, C.Y.; Liu, W.; Ranga, A.; Tyagi, A.; Berg, A.C. DSSD: Deconvolutional Single Shot Detector. arXiv 2017, arXiv:1701.06659. [Google Scholar]
- Lin, T.-Y.; Goyal, P.; Girshick, R.; He, K.; Dollar, P. Focal Loss for Dense Object Detection. IEEE Trans. Pattern Anal. Mach. Intell. 2020, 42, 318–327. [Google Scholar] [CrossRef] [PubMed]
- Zhang, S.; Wen, L.; Lei, Z.; Li, S.Z. RefineDet++: Single-Shot Refinement Neural Network for Object Detection. IEEE Trans. Circuits Syst. Video Technol. 2021, 31, 674–687. [Google Scholar] [CrossRef]
- Ren, S.; He, K.; Girshick, R.; Sun, J. Faster R-CNN: Towards Real-Time Object Detection with Region Proposal Networks. IEEE Trans. Pattern Anal. Mach. Intell. 2017, 39, 1137–1149. [Google Scholar] [CrossRef]
- He, K.; Gkioxari, G.; Dollar, P.; Girshick, R. Mask R-CNN. In Proceedings of the 2017 IEEE International Conference on Computer Vision (ICCV), Venice, Italy, 22–29 October 2017; pp. 2980–2988. [Google Scholar]
- Lin, T.-Y.; Dollar, P.; Girshick, R.; He, K.; Hariharan, B.; Belongie, S. Feature Pyramid Networks for Object Detection. In Proceedings of the 2017 IEEE Conference on Computer Vision and Pattern Recognition (CVPR), Honolulu, HI, USA, 21–26 July 2017; pp. 936–944. [Google Scholar]
- Cai, Z.; Vasconcelos, N. Cascade R-CNN: High Quality Object Detection and Instance Segmentation. IEEE Trans. Pattern Anal. Mach. Intell. 2021, 43, 1483–1498. [Google Scholar] [CrossRef]
- Shao, L.; Wu, D.; Li, X. Learning Deep and Wide: A Spectral Method for Learning Deep Networks. IEEE Trans. Neural Netw. Learn. Syst. 2014, 25, 2303–2308. [Google Scholar] [CrossRef]
- Vaswani, A.; Shazeer, N.; Parmar, N.; Uszkoreit, J.; Jones, L.; Gomez, A.N.; Kaiser, L.; Polosukhin, I. Attention Is All You Need. arXiv 2017, arXiv:1706.03762. [Google Scholar]
- Dong, Y.; Du, B.; Zhang, L. Target Detection Based on Random Forest Metric Learning. IEEE J. Sel. Top. Appl. Earth Obs. Remote Sens. 2015, 8, 1830–1838. [Google Scholar] [CrossRef]
- Li, Y.; Sun, X.; Wang, H.; Sun, H.; Li, X. Automatic Target Detection in High-Resolution Remote Sensing Images Using a Contour-Based Spatial Model. IEEE Geosci. Remote Sens. Lett. 2012, 9, 886–890. [Google Scholar] [CrossRef]
- Yokoya, N.; Iwasaki, A. Object Detection Based on Sparse Representation and Hough Voting for Optical Remote Sensing Imagery. IEEE J. Sel. Top. Appl. Earth Obs. Remote Sens. 2015, 8, 2053–2062. [Google Scholar] [CrossRef]
- Zhang, D.; Han, J.; Cheng, G.; Liu, Z.; Bu, S.; Guo, L. Weakly Supervised Learning for Target Detection in Remote Sensing Images. IEEE Geosci. Remote Sens. Lett. 2015, 12, 701–705. [Google Scholar] [CrossRef]
- Zhu, D.; Wang, B.; Zhang, L. Airport Target Detection in Remote Sensing Images: A New Method Based on Two-Way Saliency. IEEE Geosci. Remote Sens. Lett. 2015, 12, 1096–1100. [Google Scholar]
- Sakla, W.; Chan, A.; Ji, J.; Sakla, A. An SVDD-Based Algorithm for Target Detection in Hyperspectral Imagery. IEEE Geosci. Remote Sens. Lett. 2011, 8, 384–388. [Google Scholar] [CrossRef]
- Yang, S.; Shi, Z. SparseCEM and SparseACE for Hyperspectral Image Target Detection. IEEE Geosci. Remote Sens. Lett. 2014, 11, 2135–2139. [Google Scholar] [CrossRef]
- Zhang, Y.; Du, B.; Zhang, L. A Sparse Representation-Based Binary Hypothesis Model for Target Detection in Hyperspectral Images. IEEE Trans. Geosci. Remote Sens. 2015, 53, 1346–1354. [Google Scholar] [CrossRef]
- Lei, J.; Luo, X.; Fang, L.; Wang, M.; Gu, Y. Region-Enhanced Convolutional Neural Network for Object Detection in Remote Sensing Images. IEEE Trans. Geosci. Remote Sens. 2020, 58, 5693–5702. [Google Scholar] [CrossRef]
- Lu, X.; Zhang, Y.; Yuan, Y.; Feng, Y. Gated and Axis-Concentrated Localization Network for Remote Sensing Object Detection. IEEE Trans. Geosci. Remote Sens. 2020, 58, 179–192. [Google Scholar] [CrossRef]
- Dong, Z.; Wang, M.; Wang, Y.; Zhu, Y.; Zhang, Z. Object Detection in High Resolution Remote Sensing Imagery Based on Convolutional Neural Networks with Suitable Object Scale Features. IEEE Trans. Geosci. Remote Sens. 2020, 58, 2104–2114. [Google Scholar] [CrossRef]
- Sun, P.; Chen, G.; Shang, Y. Adaptive Saliency Biased Loss for Object Detection in Aerial Images. IEEE Trans. Geosci. Remote Sens. 2020, 58, 7154–7165. [Google Scholar] [CrossRef]
- Bai, T.; Pang, Y.; Wang, J.; Han, K.; Luo, J.; Wang, H.; Lin, J.; Wu, J.; Zhang, H. An Optimized Faster R-CNN Method Based on DRNet and RoI Align for Building Detection in Remote Sensing Images. Remote Sens. 2020, 12, 762. [Google Scholar] [CrossRef]
- Ma, H.; Liu, Y.; Ren, Y.; Yu, J. Detection of Collapsed Buildings in Post-Earthquake Remote Sensing Images Based on the Improved YOLOv3. Remote Sens. 2019, 12, 44. [Google Scholar] [CrossRef]
- Li, C.; Luo, B.; Hong, H.; Su, X.; Wang, Y.; Liu, J.; Wang, C.; Zhang, J.; Wei, L. Object Detection Based on Global-Local Saliency Constraint in Aerial Images. Remote Sens. 2020, 12, 1435. [Google Scholar] [CrossRef]
- Sun, X.; Wang, P.; Wang, C.; Liu, Y.; Fu, K. PBNet: Part-Based Convolutional Neural Network for Complex Composite Object Detection in Remote Sensing Imagery. ISPRS J. Photogramm. Remote Sens. 2021, 173, 50–65. [Google Scholar] [CrossRef]
- He, Q.; Sun, X.; Yan, Z.; Fu, K. DABNet: Deformable Contextual and Boundary-Weighted Network for Cloud Detection in Remote Sensing Images. IEEE Trans. Geosci. Remote Sens. 2022, 60, 5601216. [Google Scholar] [CrossRef]
- Wang, P.; Sun, X.; Diao, W.; Fu, K. FMSSD: Feature-Merged Single-Shot Detection for Multiscale Objects in Large-Scale Remote Sensing Imagery. IEEE Trans. Geosci. Remote Sens. 2020, 58, 3377–3390. [Google Scholar] [CrossRef]
- Liu, W.; Anguelov, D.; Erhan, D.; Szegedy, C.; Reed, S.; Fu, C.-Y.; Berg, A.C. SSD: Single Shot MultiBox Detector. arXiv 2016, arXiv:1512.02325. [Google Scholar]
- Szegedy, C.; Vanhoucke, V.; Ioffe, S.; Shlens, J.; Wojna, Z. Rethinking the Inception Architecture for Computer Vision. In Proceedings of the 2016 IEEE Conference on Computer Vision and Pattern Recognition (CVPR), Las Vegas, NV, USA, 27–30 June 2016; pp. 2818–2826. [Google Scholar]
- He, K.; Zhang, X.; Ren, S.; Sun, J. Deep Residual Learning for Image Recognition. In Proceedings of the 2016 IEEE Conference on Computer Vision and Pattern Recognition (CVPR), Las Vegas, NV, USA, 27–30 June 2016; pp. 770–778. [Google Scholar]
- Chen, Y.; Li, J.; Xiao, H.; Jin, X.; Yan, S.; Feng, J. Dual Path Networks. arXiv 2017, arXiv:1707.01629. [Google Scholar]
- Huang, G.; Liu, Z.; Van Der Maaten, L.; Weinberger, K.Q. Densely Connected Convolutional Networks. In Proceedings of the 2017 IEEE Conference on Computer Vision and Pattern Recognition (CVPR), Honolulu, HI, USA, 21–26 July 2017; pp. 2261–2269. [Google Scholar]
- Cheng, G.; Zhou, P.; Han, J. Learning Rotation-Invariant Convolutional Neural Networks for Object Detection in VHR Optical Remote Sensing Images. IEEE Trans. Geosci. Remote Sens. 2016, 54, 7405–7415. [Google Scholar] [CrossRef]
- Hu, F.; Xia, G.-S.; Hu, J.; Zhang, L. Transferring Deep Convolutional Neural Networks for the Scene Classification of High-Resolution Remote Sensing Imagery. Remote Sens. 2015, 7, 14680–14707. [Google Scholar] [CrossRef]
- Chen, S.; Zhong, S.; Xue, B.; Li, X.; Zhao, L.; Chang, C.I. Iterative Scale-Invariant Feature Transform for Remote Sensing Image Registration. IEEE Trans. Geosci. Remote Sens. 2021, 59, 3244–3265. [Google Scholar] [CrossRef]
- Redmon, J.; Divvala, S.; Girshick, R.; Farhadi, A. You Only Look Once: Unified, Real-Time Object Detection. In Proceedings of the 2016 IEEE Conference on Computer Vision and Pattern Recognition (CVPR), Las Vegas, NV, USA, 27–30 June 2016; pp. 779–788. [Google Scholar]
- Shi, W.; Bao, S.; Tan, D. FFESSD: An Accurate and Efficient Single-Shot Detector for Target Detection. Appl. Sci. 2019, 20, 4276. [Google Scholar] [CrossRef]
- Li, K.; Wan, G.; Cheng, G.; Meng, L.; Han, J. Object Detection in Optical Remote Sensing Images: A Survey and a New Benchmark. ISPRS J. Photogramm. Remote Sens. 2020, 159, 296–307. [Google Scholar] [CrossRef]
Disclaimer/Publisher’s Note: The statements, opinions and data contained in all publications are solely those of the individual author(s) and contributor(s) and not of MDPI and/or the editor(s). MDPI and/or the editor(s) disclaim responsibility for any injury to people or property resulting from any ideas, methods, instructions or products referred to in the content. |
© 2023 by the authors. Licensee MDPI, Basel, Switzerland. This article is an open access article distributed under the terms and conditions of the Creative Commons Attribution (CC BY) license (https://creativecommons.org/licenses/by/4.0/).