


Solution pH Effect on Drain-Gate Characteristics of SOI FET Biosensor

 , ,
, ,  , and
, and
Abstract
1. Introduction
2. Materials and Methods
2.1. Materials
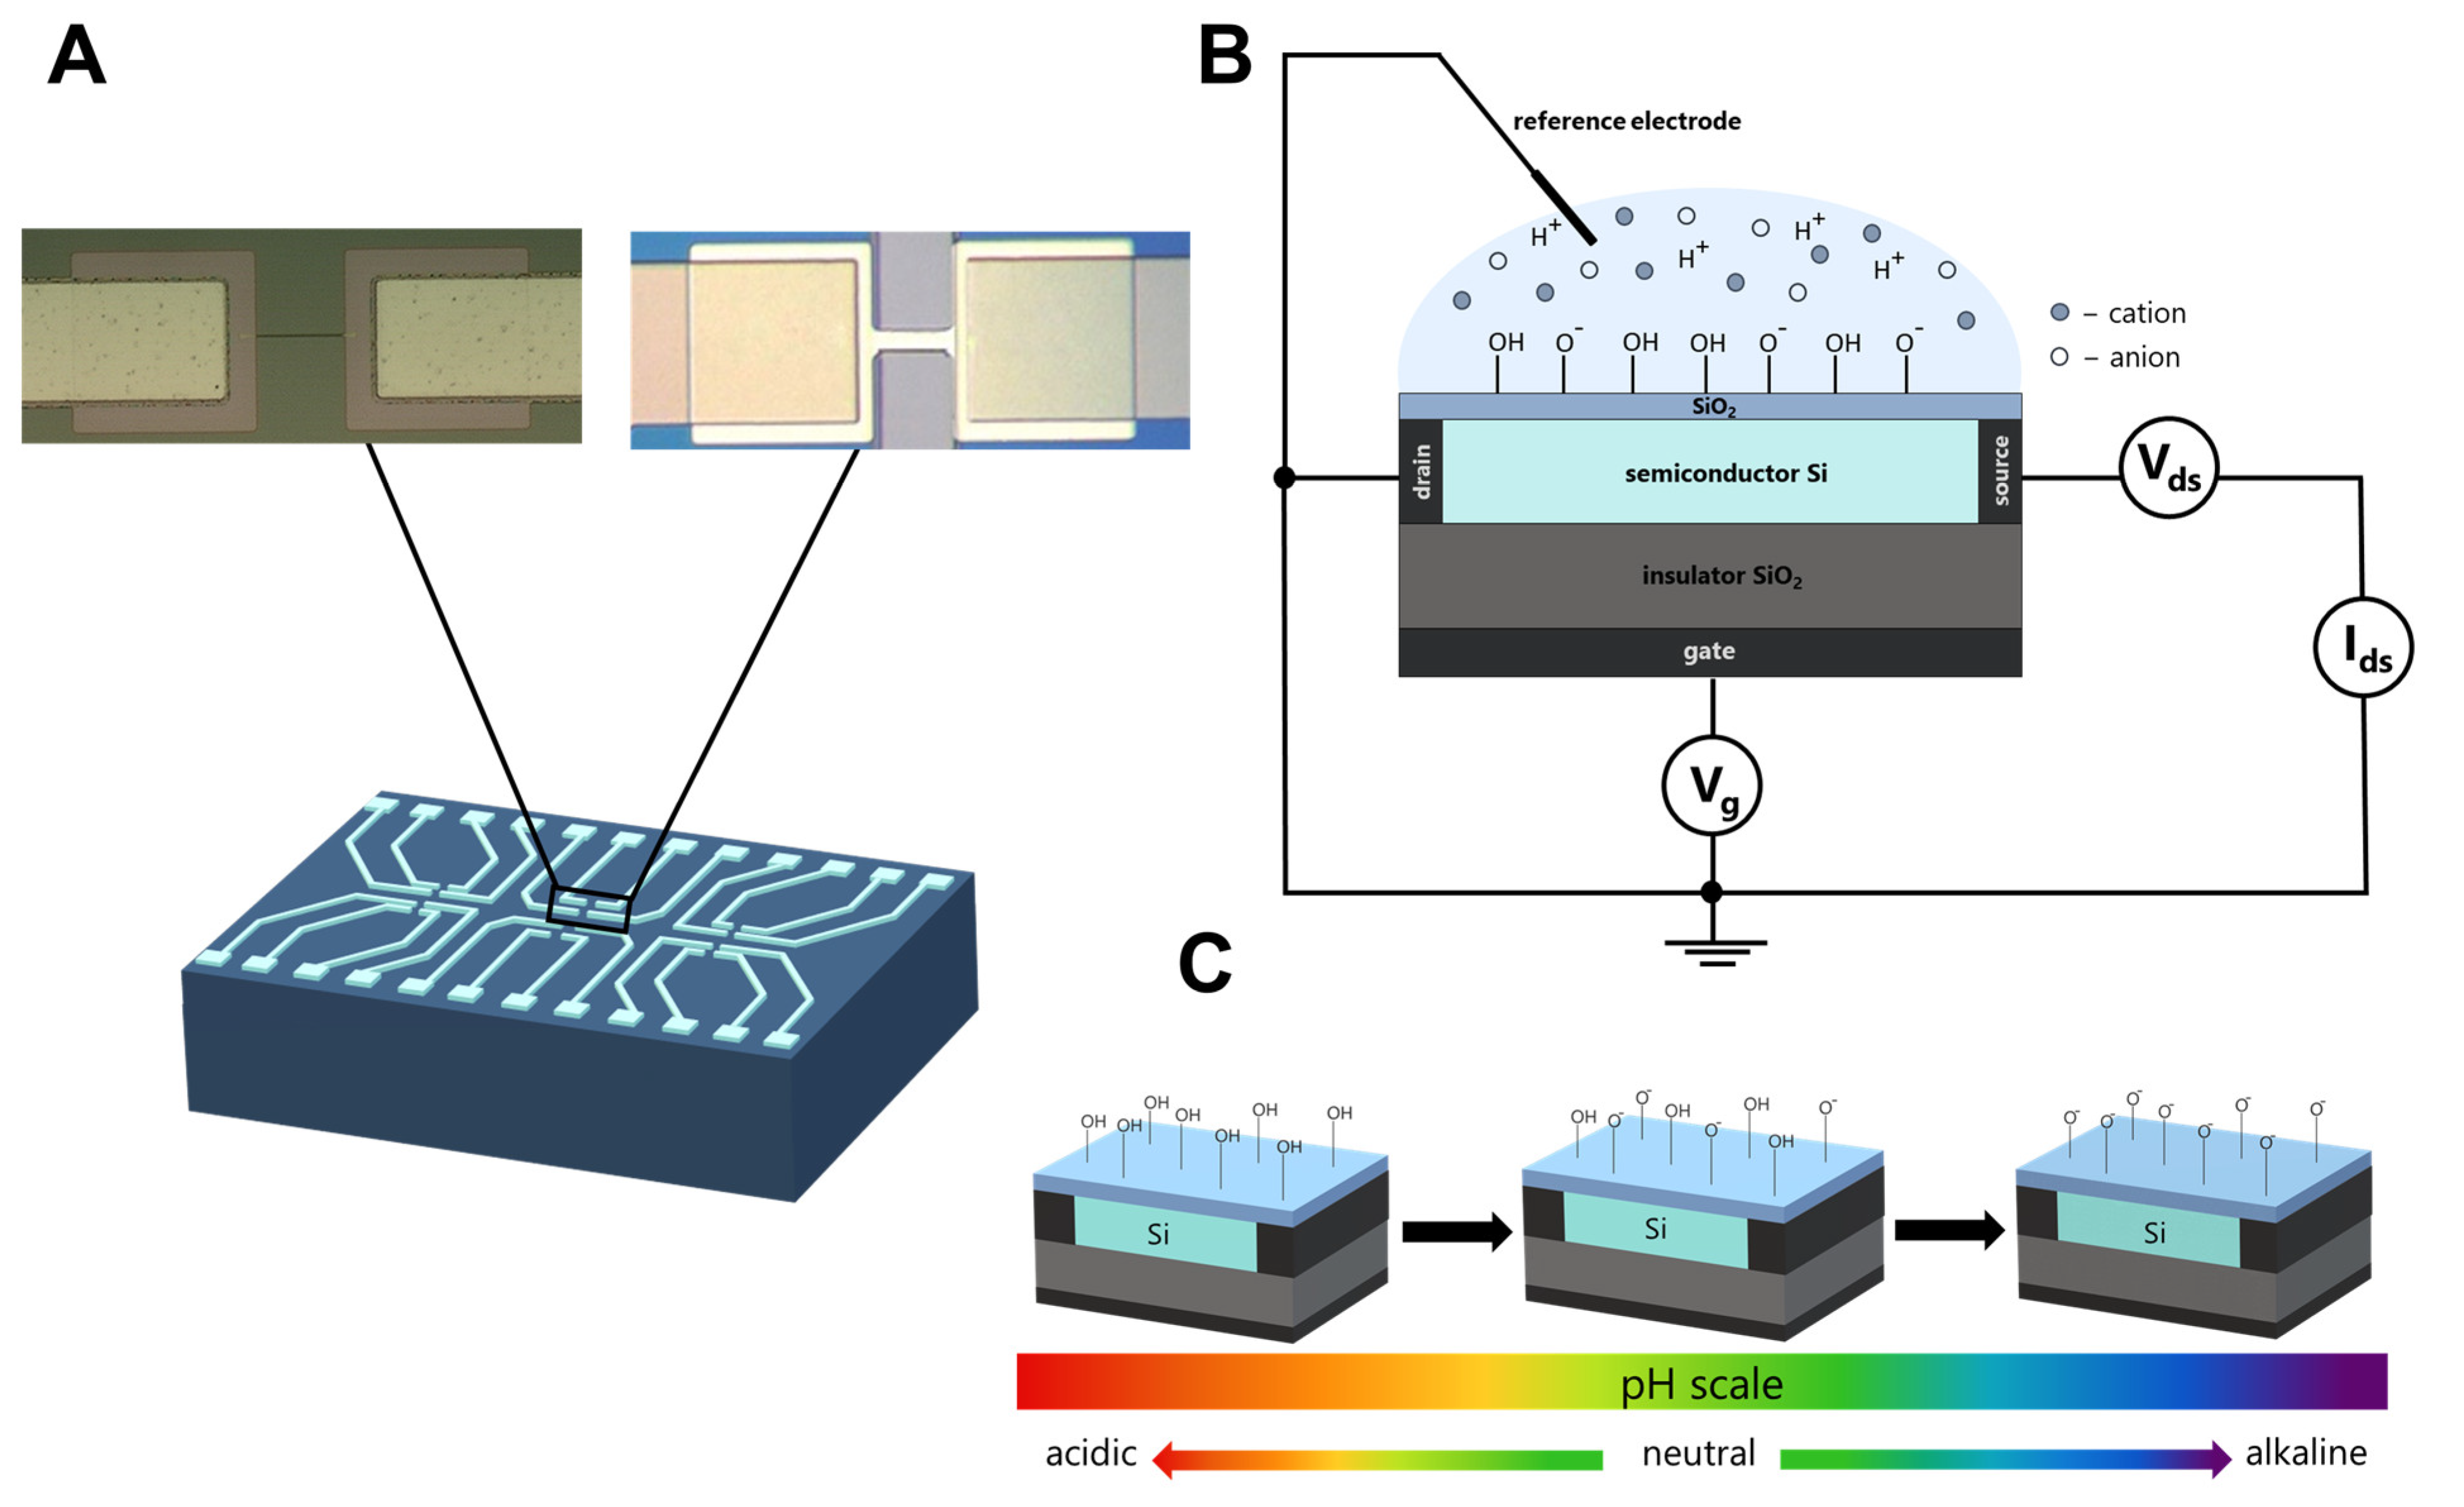
2.2. SOI-FET
2.3. Surface Preparation of SOI-FET Sensors
2.4. Measurement Technique
2.5. Device Calibration
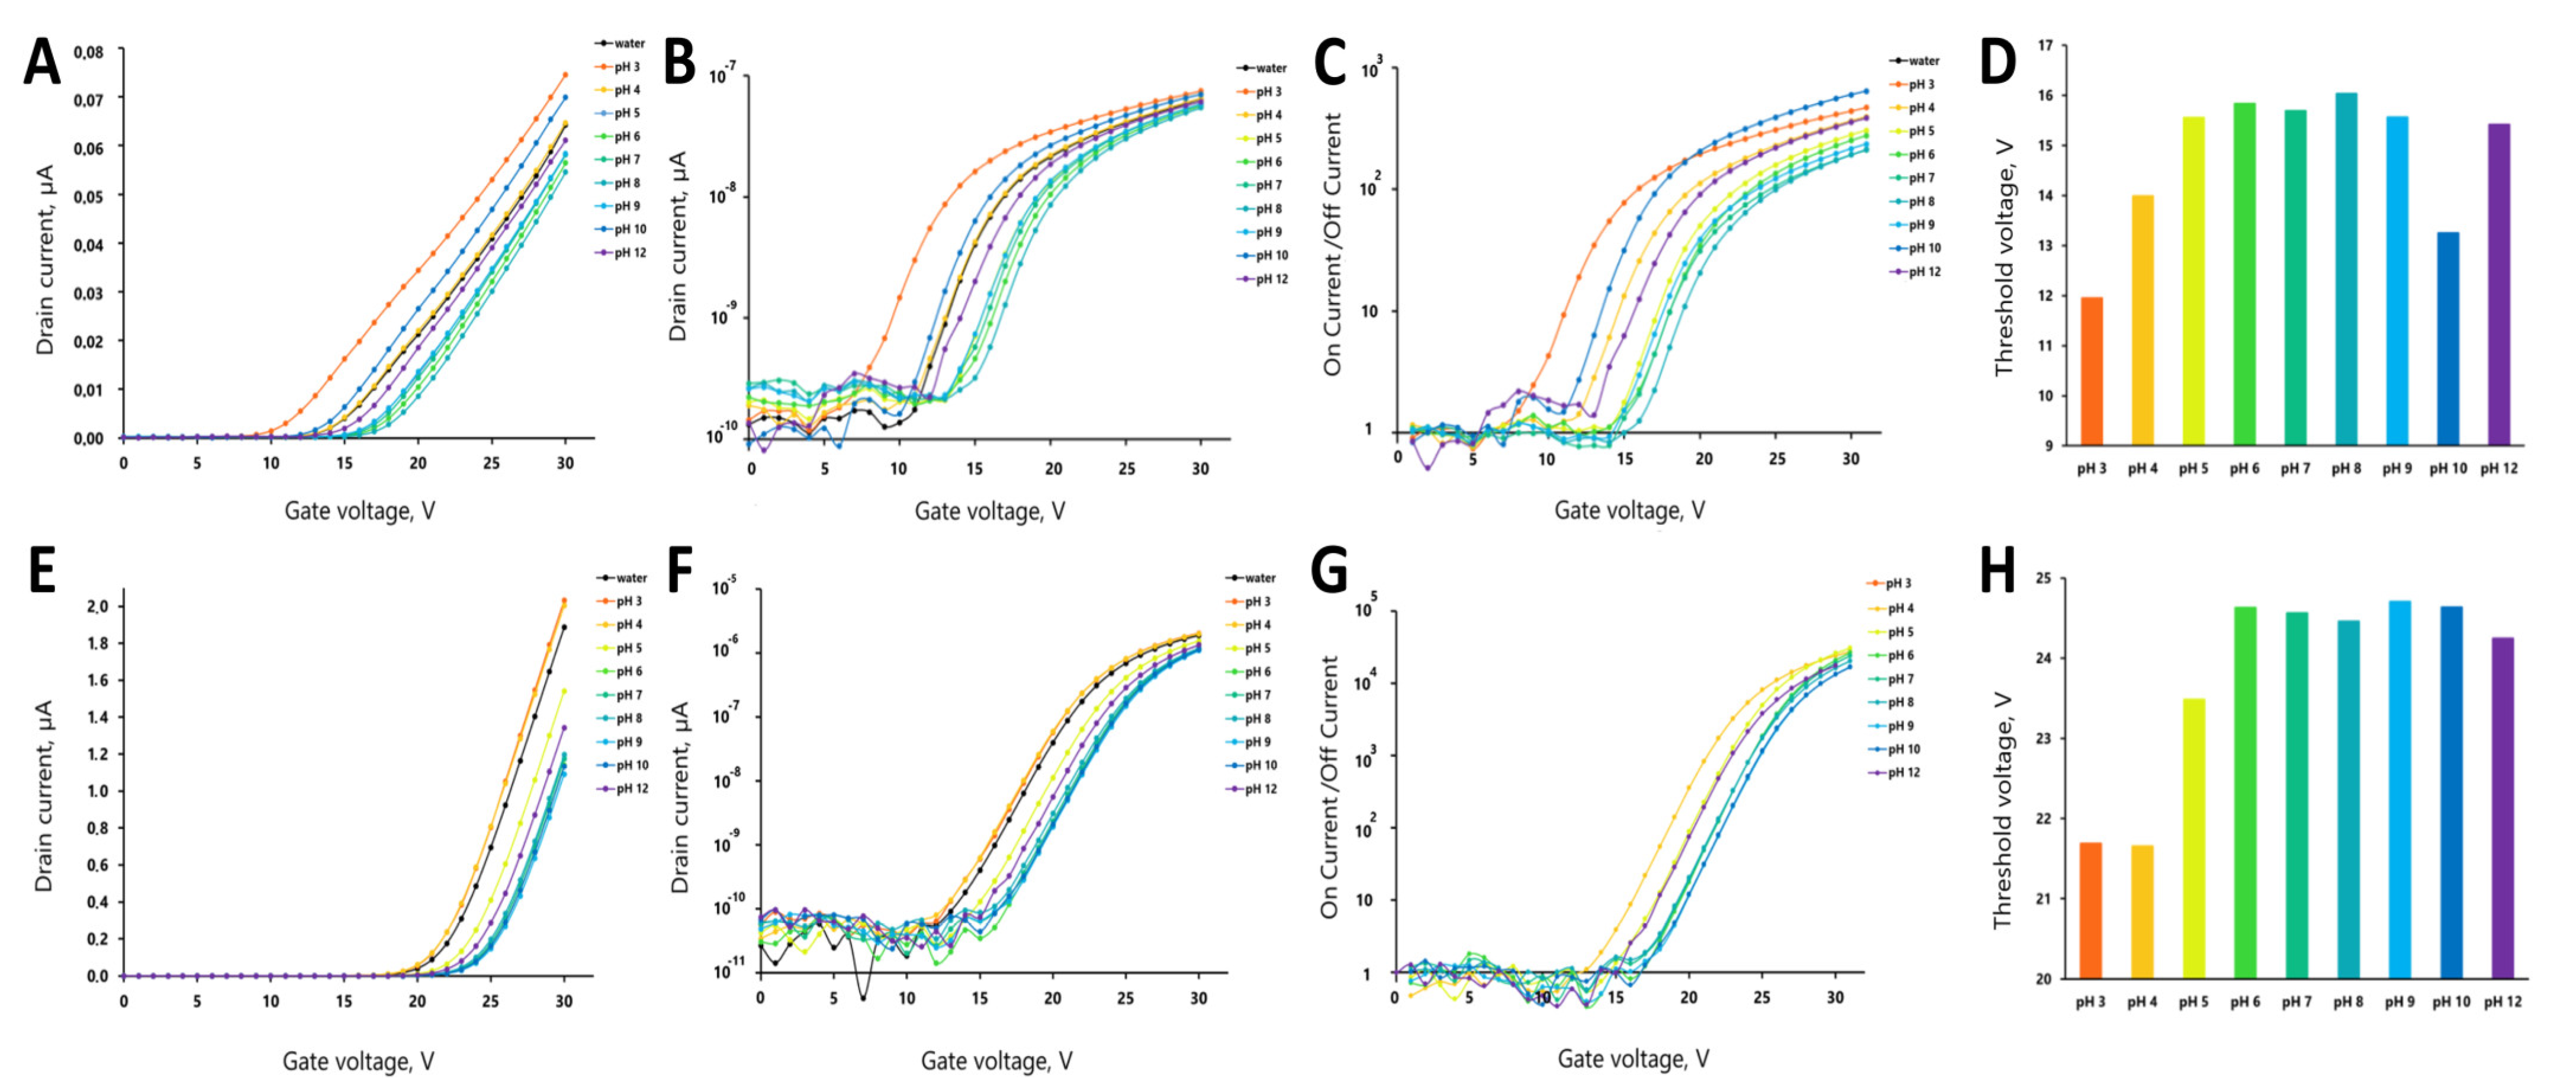
2.6. Investigation of pH Effect on the Sensor Response
3. Results
3.1. Calibration of Source Current Values
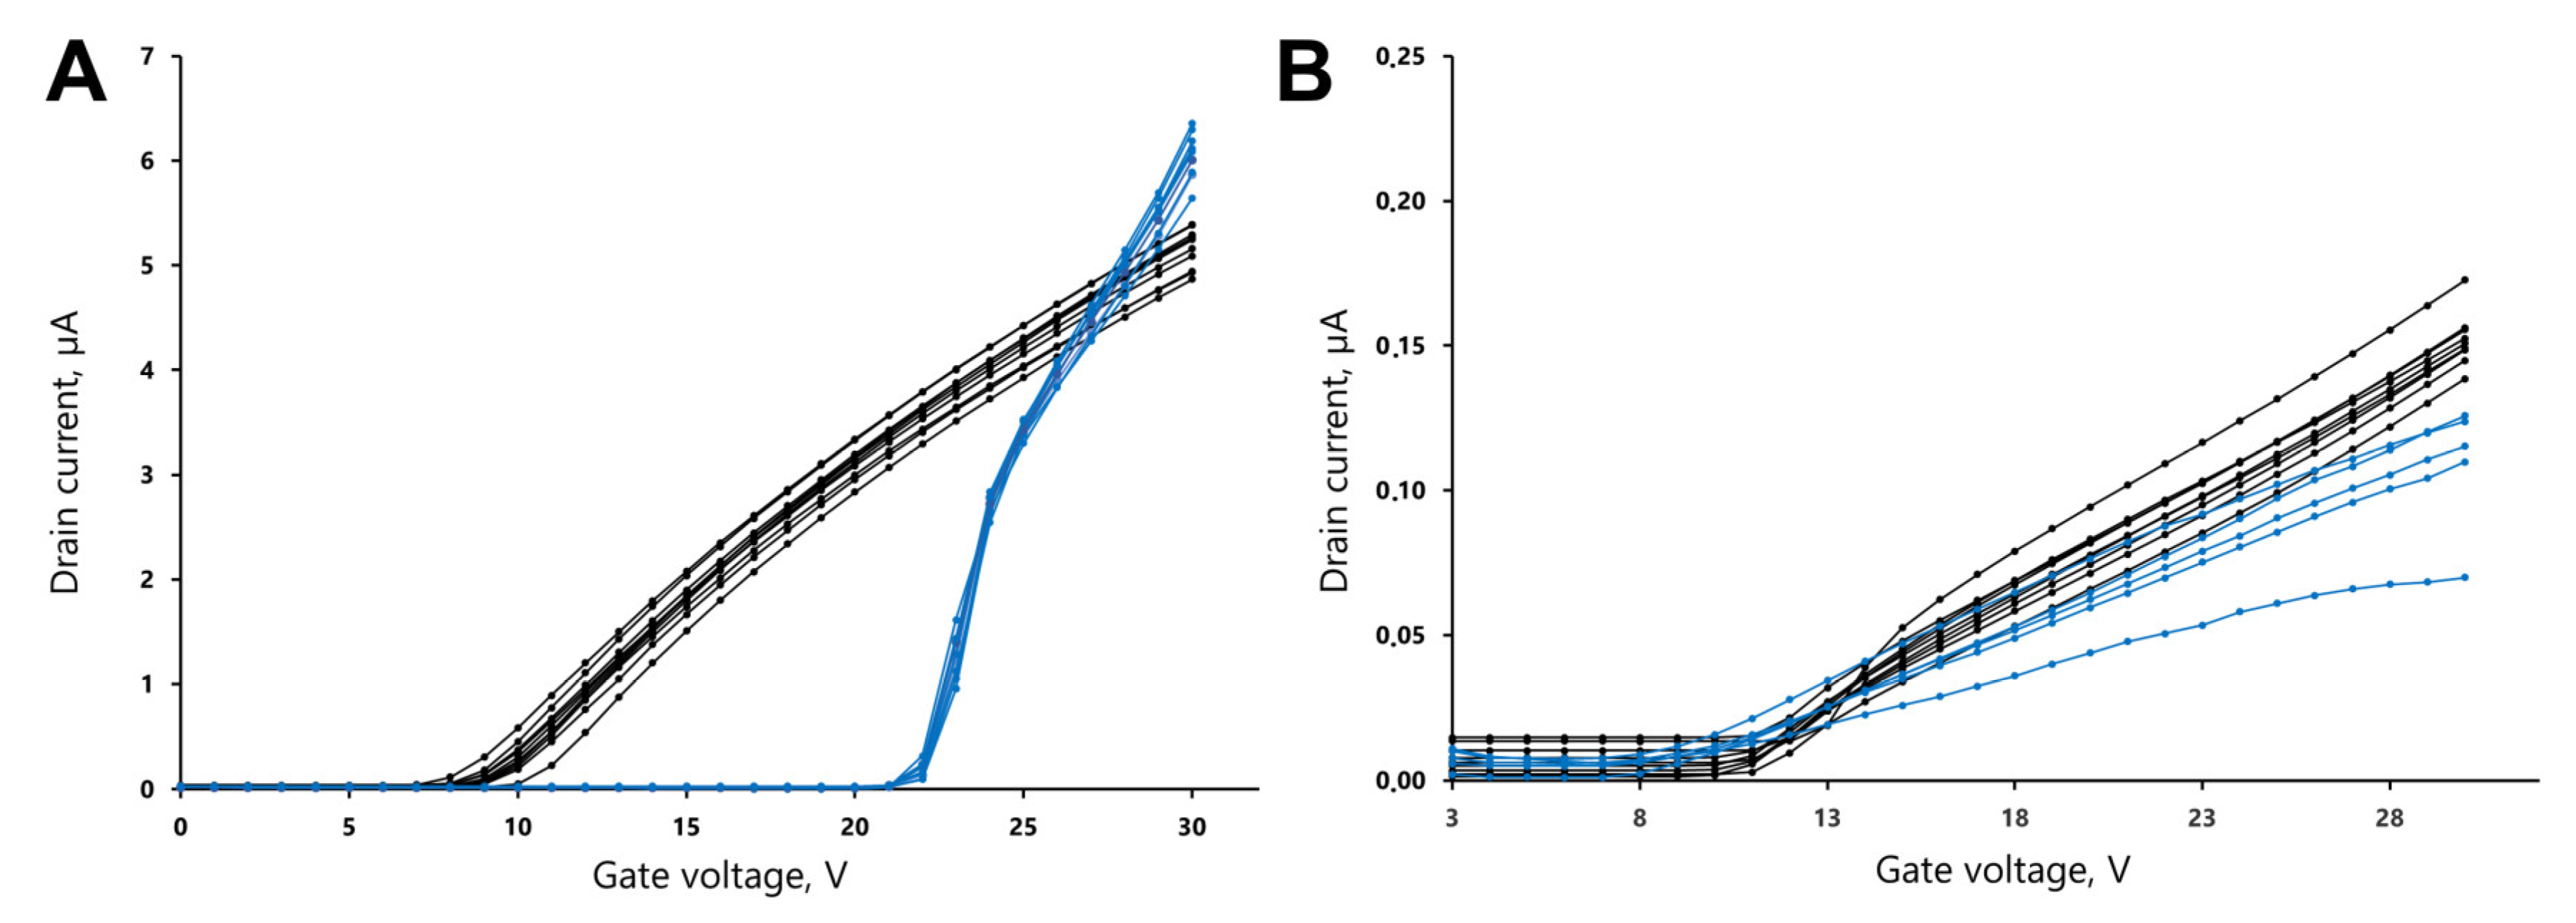
3.2. Reproducibility of the Measurements
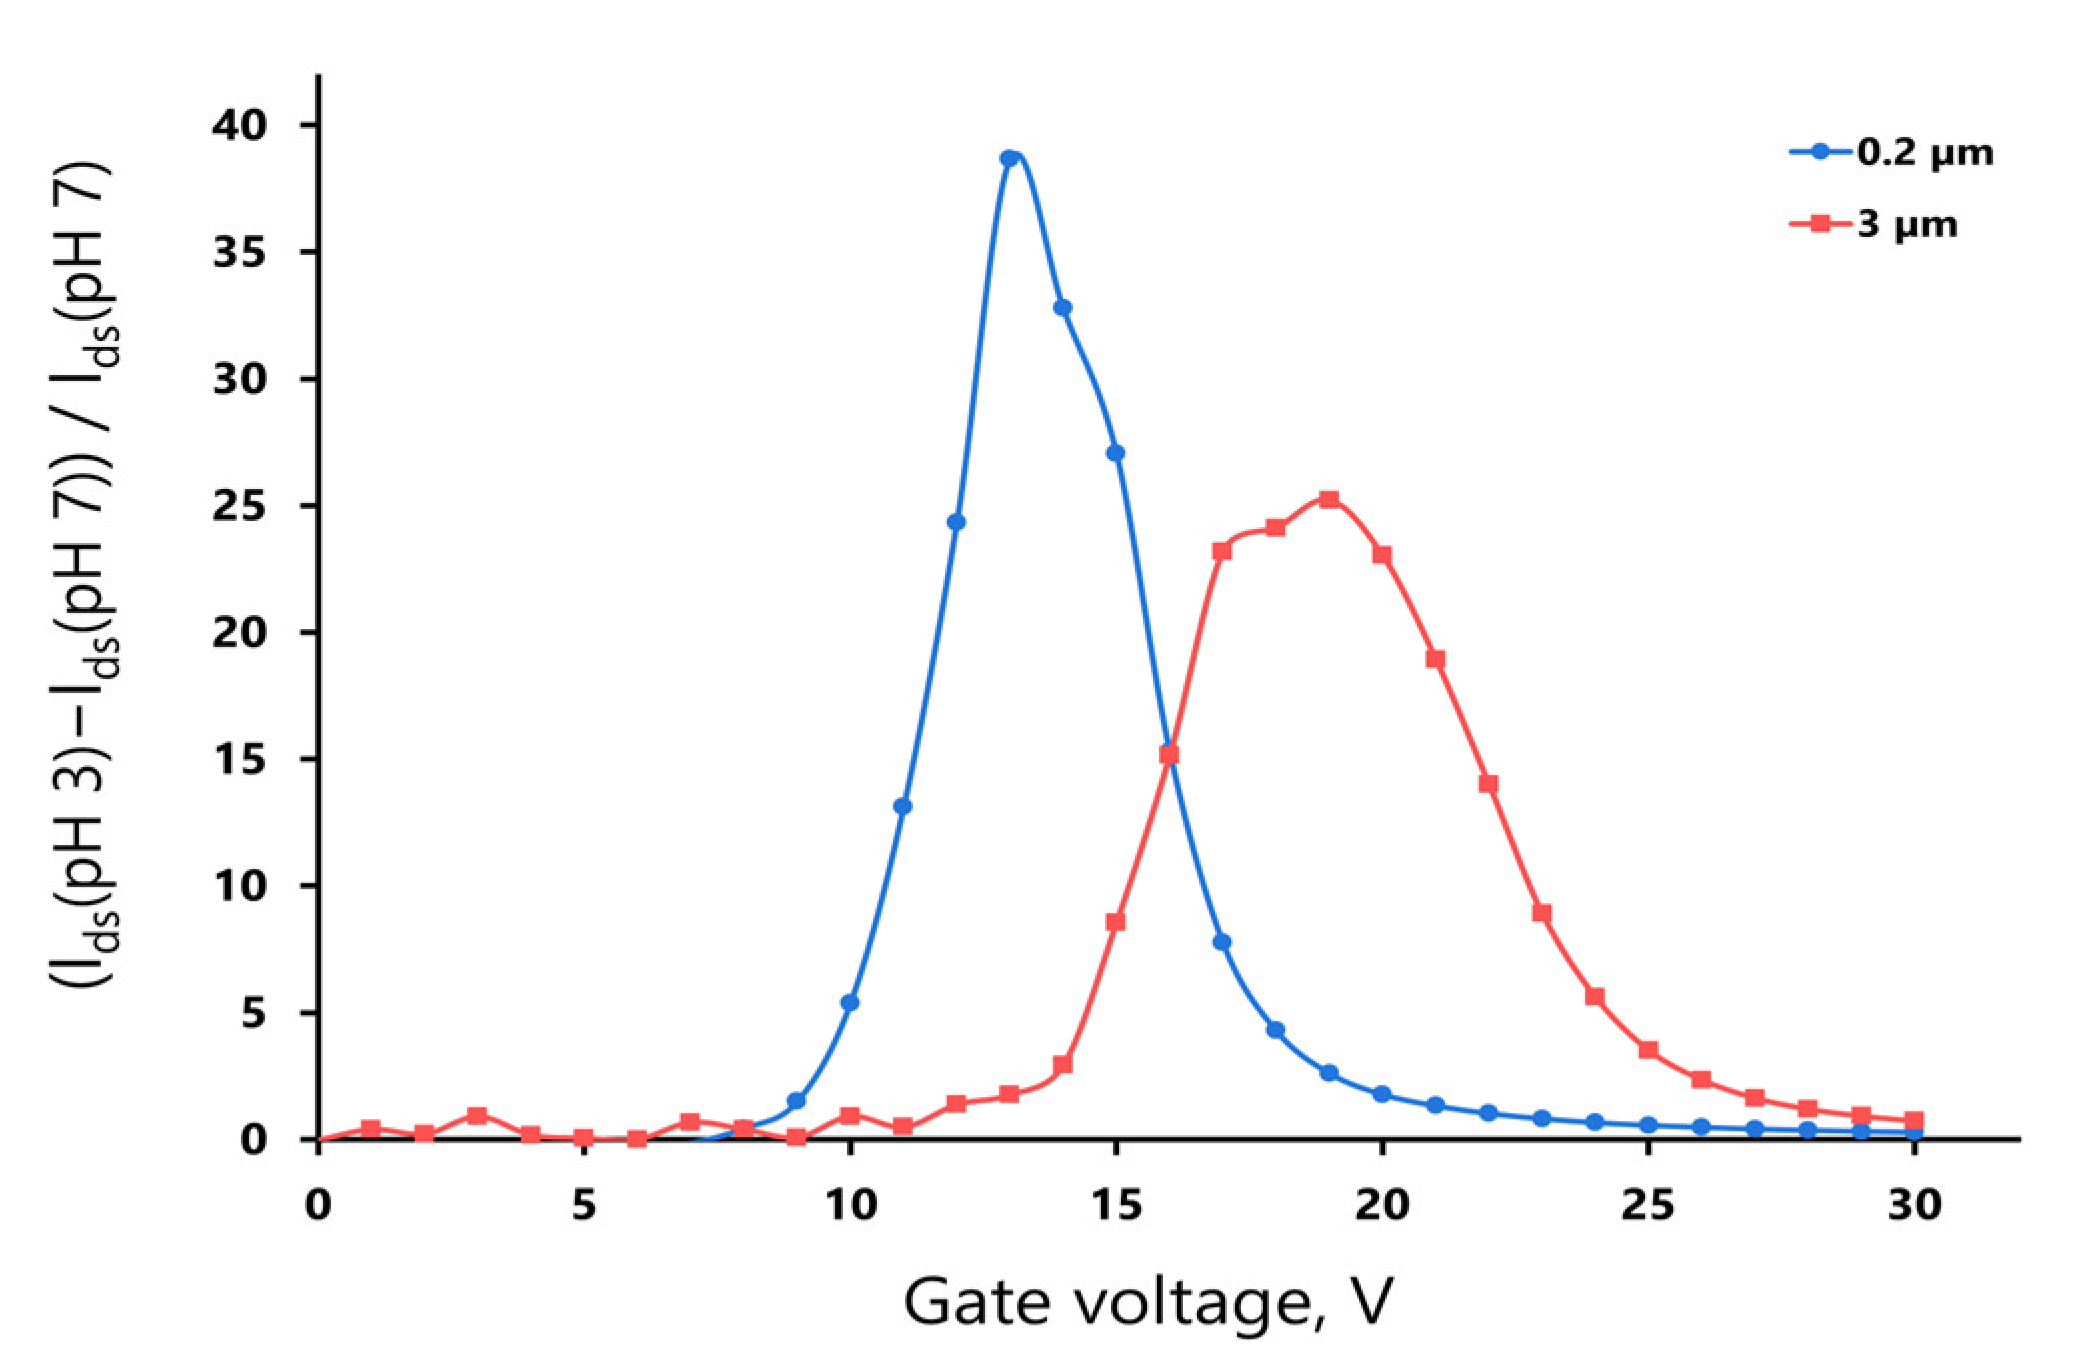
4. Discussion
5. Conclusions
6. Patents
Author Contributions
Funding
Data Availability Statement
Conflicts of Interest
References
- Leung, W.H.; Pang, C.C.; Pang, S.N.; Weng, S.X.; Lin, Y.L.; Chiou, Y.E.; Pang, S.T.; Weng, W.H. High-sensitivity dual-probe detection of urinary mir-141 in cancer patients via a modified screen-printed carbon electrode-based electrochemical biosensor. Sensors 2021, 21, 3183. [Google Scholar] [CrossRef] [PubMed]
- Plasmon, S.; Spr, R.; New, B.A.; Menezes, G.; Alves, C.R.; Pinto, M.A.; Almeida, L.; Leon, A.; Souza-silva, F. Tool Based on the Major HAV Capsid Protein VP1 (SPR-HAVP1). Sensors 2021, 1, 3167. [Google Scholar]
- Stortini, A.M.; Baldo, M.A.; Moro, G.; Polo, F.; Moretto, L.M. Bio-and biomimetic receptors for electrochemical sensing of heavy metal ions. Sensors 2020, 20, 6800. [Google Scholar] [CrossRef] [PubMed]
- Chen, H.; Xiao, M.; He, J.; Zhang, Y.; Liang, Y.; Liu, H.; Zhang, Z. Aptamer-Functionalized Carbon Nanotube Field-Effect Transistor Biosensors for Alzheimer’s Disease Serum Biomarker Detection. ACS Sens. 2022, 7, 2075–2083. [Google Scholar] [CrossRef] [PubMed]
- Manimekala, T.; Sivasubramanian, R.; Dharmalingam, G. Nanomaterial-Based Biosensors using Field-Effect Transistors: A Review. J. Electron. Mater. 2022, 51, 1950–1973. [Google Scholar] [CrossRef]
- Afzal, A.M.; Iqbal, M.Z.; Dastgeer, G.; Nazir, G.; Mumtaz, S.; Usman, M.; Eom, J. WS2/GeSe/WS2Bipolar Transistor-Based Chemical Sensor with Fast Response and Recovery Times. ACS Appl. Mater. Interfaces 2020, 12, 39524–39532. [Google Scholar] [CrossRef]
- Li, D.; Chen, H.; Fan, K.; Labunov, V.; Lazarouk, S.; Yue, X.; Liu, C.; Yang, X.; Dong, L.; Wang, G. A supersensitive silicon nanowire array biosensor for quantitating tumor marker ctDNA. Biosens. Bioelectron. 2021, 181, 113147. [Google Scholar] [CrossRef]
- Dmitrienko, E.; Naumova, O.; Fomin, B.; Kupryushkin, M.; Volkova, A.; Amirkhanov, N.; Semenov, D.; Pyshnaya, I.; Pyshnyi, D. Surface modification of SOI-FET sensors for label-free and specific detection of short RNA analyte. Nanomedicine 2016, 11, 2073–2082. [Google Scholar] [CrossRef]
- Panahi, A.; Sadighbayan, D.; Forouhi, S.; Ghafar-Zadeh, E. Recent advances of field-effect transistor technology for infectious diseases. Biosensors 2021, 11, 103. [Google Scholar] [CrossRef]
- Kim, J.W.; Kim, S.; Jang, Y.; Lim, K.; Lee, W.H. Attomolar detection of virus by liquid coplanar-gate graphene transistor on plastic. Nanotechnology 2022, 30, 34. [Google Scholar] [CrossRef]
- Purwidyantri, A.; Palacio, I.; Moreno, M.; Almudena, N.; Mendieta-moreno, J.I.; Torres-v, B.; García-hern, M.; Luis, V.; Jelínek, P.; L, M.F.; et al. Attomolar detection of hepatitis C virus core protein powered by molecular antenna-like effect in a graphene field-effect aptasensor. Biosens. Bioelectron. 2023, 222, 115006. [Google Scholar] [CrossRef]
- Boyd, E.J.; Brown, S.A. The size dependence of tin oxide atomic cluster nanowire field effect transistors. Nanotechnology 2009, 20, 425201. [Google Scholar] [CrossRef]
- Chen, S.; Kim, S.; Chen, W.; Yuan, J.; Bashir, R.; Lou, J.; Van Der Zande, A.M.; King, W.P. Monolayer MoS2 Nanoribbon Transistors Fabricated by Scanning Probe Lithography. Nano Lett. 2019, 19, 2092–2098. [Google Scholar] [CrossRef]
- Park, C.W.; Ahn, C.G.; Yang, J.H.; Baek, I.B.; Ah, C.S.; Kim, A.; Kim, T.Y.; Sung, G.Y. Control of channel doping concentration for enhancing the sensitivity of “top-down” fabricated Si nanochannel FET biosensors. Nanotechnology 2009, 20, 475501. [Google Scholar] [CrossRef]
- Rejali, N.A.; Ye, F.D.; Zuiter, A.M.; Keller, C.C.; Wittwer, C.T. Nearest-neighbour transition-state analysis for nucleic acid kinetics. Nucleic Acids Res. 2021, 49, 4574–4585. [Google Scholar] [CrossRef]
- Lai, Q.; Chen, W.; Zhang, Y.; Liu, Z. Application strategies of peptide nucleic acids toward electrochemical nucleic acid sensors. Analyst 2021, 146, 5822–5835. [Google Scholar] [CrossRef]
- Nakano, S.I.; Fujimoto, M.; Hara, H.; Sugimoto, N. Nucleic acid duplex stability: Influence of base composition on cation effects. Nucleic Acids Res. 1999, 27, 2957–2965. [Google Scholar] [CrossRef]
- Takahashi, S.; Sugimoto, N. Stability prediction of canonical and non-canonical structures of nucleic acids in various molecular environments and cells. Chem. Soc. Rev. 2020, 49, 8439–8468. [Google Scholar] [CrossRef]
- Golyshev, V.M.; Pyshnyi, D.V.; Lomzov, A.A. Effects of Phosphoryl Guanidine Modification of Phosphate Residues on the Structure and Hybridization of Oligodeoxyribonucleotides. J. Phys. Chem. B 2021, 125, 2841–2855. [Google Scholar] [CrossRef]
- Stern, E.; Wagner, R.; Sigworth, F.J.; Breaker, R.; Fahmy, T.M.; Reed, M.A. Importance of the debye screening length on nanowire field effect transistor sensors. Nano Lett. 2007, 7, 3405–3409. [Google Scholar] [CrossRef]
- Shoorideh, K.; Chui, C.O. On the origin of enhanced sensitivity in nanoscale FET-based biosensors. Proc. Natl. Acad. Sci. USA 2014, 111, 5111–5116. [Google Scholar] [CrossRef] [PubMed]
- Dmitrienko, E.V.; Poryvaeva, A.V.; Naumova, O.V.; Fomin, B.I.; Kupryushkin, M.S.; Pyshnaya, I.A.; Pyshnyi, D.V. Validation of Heterophase RNA Analysis with the Use of a Silicon-on-Insulator Biosensor. Optoelectron. Instrum. Data Process. 2021, 57, 44–50. [Google Scholar] [CrossRef]
- Mirsian, S.; Khodadadian, A.; Hedayati, M.; Manzour-ol-Ajdad, A.; Kalantarinejad, R.; Heitzinger, C. A new method for selective functionalization of silicon nanowire sensors and Bayesian inversion for its parameters. Biosens. Bioelectron. 2019, 142, 111527. [Google Scholar] [CrossRef]
- Cho, S.K.; Cho, W.J. Ultra-high sensitivity pH-sensors using silicon nanowire channel dual-gate field-effect transistors fabricated by electrospun polyvinylpyrrolidone nanofibers pattern template transfer. Sens. Actuators B Chem. 2021, 326, 128835. [Google Scholar] [CrossRef]
- Leung, K.; Nielsen, I.M.B.; Criscenti, L.J. Elucidating the bimodal acid-base behavior of the water-silica interface from first principles. J. Am. Chem. Soc. 2009, 131, 18358–18365. [Google Scholar] [CrossRef]
- Sulpizi, M.; Gaigeot, M.P.; Sprik, M. The silica-water interface: How the silanols determine the surface acidity and modulate the water properties. J. Chem. Theory Comput. 2012, 8, 1037–1047. [Google Scholar] [CrossRef]
- Zafar, S.; D’Emic, C.; Afzali, A.; Fletcher, B.; Zhu, Y.; Ning, T. Optimization of pH sensing using silicon nanowire field effect transistors with HfO2 as the sensing surface. Nanotechnology 2011, 22, 405501. [Google Scholar] [CrossRef]
- Xiao, L.; Li, K.; Liu, B.; Tu, J.; Li, T.; Li, Y.; Zhang, G. A pH-sensitive field-effect transistor for monitoring of cancer cell external acid environment. Talanta 2023, 252, 123764. [Google Scholar] [CrossRef]
- Sinha, S.; Pal, T.; Sharma, P.; Kharbanda, D.; Khanna, P.K.; Tanwar, A.; Sharma, R.; Mukhiya, R. Fabrication, Characterization, and Modeling of an Aluminum Oxide-Gate Ion-Sensitive Field-Effect Transistor-Based pH Sensor. J. Electron. Mater. 2021, 50, 7085–7097. [Google Scholar] [CrossRef]
- Sohn, I.Y.; Kim, D.J.; Jung, J.H.; Yoon, O.J.; Nguyen Thanh, T.; Tran Quang, T.; Lee, N.E. pH sensing characteristics and biosensing application of solution-gated reduced graphene oxide field-effect transistors. Biosens. Bioelectron. 2013, 45, 70–76. [Google Scholar] [CrossRef]
- Park, K.W.; Cho, W.J. Time-Dependent Sensitivity Tunable pH Sensors Based on the Organic-Inorganic Hybrid Electric-Double-Layer Transistor. Int. J. Mol. Sci. 2022, 23, 10842. [Google Scholar] [CrossRef]
- Wu, C.C.; Wang, M.R. Effects of buffer concentration on the sensitivity of silicon nanobelt field-effect transistor sensors. Sensors 2021, 21, 4904. [Google Scholar] [CrossRef]
- Gasparyan, F.; Zadorozhnyi, I.; Khondkaryan, H.; Arakelyan, A.; Vitusevich, S. Photoconductivity, pH Sensitivity, Noise, and Channel Length Effects in Si Nanowire FET Sensors. Nanoscale Res. Lett. 2018, 13, 87. [Google Scholar] [CrossRef]
- Li, G.; Wei, Q.; Wei, S.; Zhang, J.; Jin, Q.; Wang, G.; Hu, J.; Zhu, Y.; Kong, Y.; Zhang, Q.; et al. Acrylamide Hydrogel-Modified Silicon Nanowire Field-Effect Transistors for pH Sensing. Nanomaterials 2022, 12, 2070. [Google Scholar] [CrossRef]
- Naumova, O.V.; Fomin, B.I.; Nasimov, D.A.; Dudchenko, N.V.; Devyatova, S.F.; Zhanaev, E.D.; Popov, V.P.; Latyshev, A.V.; Aseev, A.L.; Ivanov, Y.D.; et al. SOI nanowires as sensors for charge detection. Semicond. Sci. Technol. 2010, 25, 055004. [Google Scholar] [CrossRef]
- Ortiz-Conde, A.; García Sánchez, F.J.; Liou, J.J.; Cerdeira, A.; Estrada, M.; Yue, Y. A review of recent MOSFET threshold voltage extraction methods. Microelectron. Reliab. 2002, 42, 583–596. [Google Scholar] [CrossRef]
- Ivanov, Y.D.; Pleshakova, T.O.; Malsagova, K.A.; Kozlov, A.F.; Archakov, A.I.; Popov, V.P. Method for Automating Parallel Tagless Detection of a Biological Marker and a Device for Its Implementation 2017. RU Patent RU2696114C2, 31 July 2019. [Google Scholar]
- Tang, S.; Yan, J.; Zhang, J.; Wei, S.; Zhang, Q.; Li, J.; Fang, M.; Zhang, S.; Xiong, E.; Wang, Y.; et al. Fabrication of low cost and low temperature poly-silicon nanowire sensor arrays for monolithic three-dimensional integrated circuits applications. Nanomaterials 2020, 10, 2488. [Google Scholar] [CrossRef]
- Kamarozaman, N.S.; Zainal, N.; Rosli, A.B.; Zulkefle, M.A.; Raikhan, N.; Him, N.; Fazlida, W.; Abdullah, H.; Herman, S.H.; Zulkifli, Z. Highly Sensitive and Selective Sol-Gel Spin-Coated Composite TiO2–PANI Thin Films for EGFET-pH Sensor. Gels 2022, 8, 690. [Google Scholar] [CrossRef]
- Wang, Y.; Yang, M.; Wu, C. Design and implementation of a ph sensor for micro solution based on nanostructured ion-sensitive field-effect transistor. Sensors 2020, 20, 6921. [Google Scholar] [CrossRef]
- Ono, T.; Kanai, Y.; Inoue, K.; Watanabe, Y.; Nakakita, S.I.; Kawahara, T.; Suzuki, Y.; Matsumoto, K. Electrical Biosensing at Physiological Ionic Strength Using Graphene Field-Effect Transistor in Femtoliter Microdroplet. Nano Lett. 2019, 19, 4004–4009. [Google Scholar] [CrossRef]
- Elnathan, R.; Kwiat, M.; Pevzner, A.; Engel, Y.; Burstein, L.; Khatchtourints, A.; Lichtenstein, A.; Kantaev, R.; Patolsky, F. Biorecognition Layer Engineering: Overcoming Screening. Nano Lett. 2012, 12, 5245. [Google Scholar] [CrossRef] [PubMed]
- Poghossian, A.; Cherstvy, A.; Ingebrandt, S.; Offenhäusser, A.; Schöning, M.J. Possibilities and limitations of label-free detection of DNA hybridization with field-effect-based devices. Sens. Actuators B Chem. 2005, 111–112, 470–480. [Google Scholar] [CrossRef]
- Patolsky, F.; Zheng, G.; Lieber, C. Nanowire-based biosensors. Anal. Chem. 2006, 78, 4260–4269. [Google Scholar] [CrossRef] [PubMed]


| Nanowire Materials | Gate Type | Buffer Solutions | pH Range | pH Sensitivity | Ref. |
|---|---|---|---|---|---|
| Hydrogel-gated Si nanowire | Top gate | 0.01 M phosphate buffer | 3, 5, 7, 9, 11, 13 | 100 mV/pH | [34] |
| Silicon nanowire | Top gate and back gate | Buffer solution | 6.3, 7, 8.2 | 59.5 mV/pH | [33] |
| Silicon nanowire | Top gate and back gate | Various buffer solutions | 3.07 to 9.87. | 56.3 mV/pH (single gate) znj1438.8 mV/pH (dual gate) | [24] |
| Silicon nanobelt | Back gate | 0.1 x–10 x phosphate-buffered saline | 4 to 8 | 57.2 mV/pH. | [32] |
| Poly-Si nanowire | Top gate and back gate | Different pH buffers | 3, 5, 9, 10, 11 | 178 mV/pH | [37] |
| TiO2—polyaniline composite thin films | Back gate | pH buffer solutions | 2, 4, 7, 10, 12 | 66.1 mV/pH | [38] |
| Solution-gated reduced graphene oxide | Top gate | 0.1 M phosphate buffer | 6 to 9 | 29 mV/pH | [30] |
| Aluminum oxide (Al2O3)-gate | Top gate | pH buffer solutions (Merck) | 4, 7, 10 | 42.1 mV/pH | [29] |
| In2O3 nanobelt | Back gate | Standard commercial pH solutions | 6 to 10 | 88.125 mV/pH | [39] |
Disclaimer/Publisher’s Note: The statements, opinions and data contained in all publications are solely those of the individual author(s) and contributor(s) and not of MDPI and/or the editor(s). MDPI and/or the editor(s) disclaim responsibility for any injury to people or property resulting from any ideas, methods, instructions or products referred to in the content. |
© 2023 by the authors. Licensee MDPI, Basel, Switzerland. This article is an open access article distributed under the terms and conditions of the Creative Commons Attribution (CC BY) license (https://creativecommons.org/licenses/by/4.0/).
Share and Cite
Bulgakova, A.; Berdyugin, A.; Naumova, O.; Fomin, B.; Pyshnyi, D.; Chubarov, A.; Dmitrienko, E.; Lomzov, A. Solution pH Effect on Drain-Gate Characteristics of SOI FET Biosensor. Electronics 2023, 12, 777. https://doi.org/10.3390/electronics12030777
Bulgakova A, Berdyugin A, Naumova O, Fomin B, Pyshnyi D, Chubarov A, Dmitrienko E, Lomzov A. Solution pH Effect on Drain-Gate Characteristics of SOI FET Biosensor. Electronics. 2023; 12(3):777. https://doi.org/10.3390/electronics12030777
Chicago/Turabian StyleBulgakova, Anastasia, Anton Berdyugin, Olga Naumova, Boris Fomin, Dmitrii Pyshnyi, Alexey Chubarov, Elena Dmitrienko, and Alexander Lomzov. 2023. "Solution pH Effect on Drain-Gate Characteristics of SOI FET Biosensor" Electronics 12, no. 3: 777. https://doi.org/10.3390/electronics12030777
APA StyleBulgakova, A., Berdyugin, A., Naumova, O., Fomin, B., Pyshnyi, D., Chubarov, A., Dmitrienko, E., & Lomzov, A. (2023). Solution pH Effect on Drain-Gate Characteristics of SOI FET Biosensor. Electronics, 12(3), 777. https://doi.org/10.3390/electronics12030777