
How to Assess the Measurement Performance of Mobile/Wearable Point-of-Care Testing Devices? A Systematic Review Addressing Sweat Analysis

 ,
,  ,
,  ,
,  ,
,  and
and 
Abstract
:1. Introduction
- Optimal levels of specificity and sensitivity are needed for the early detection of specific disease-related markers [6].
- Repeatability and reproducibility of the methods can ensure reliable results, which must be strictly non-dependent on users/testers or the environmental conditions.
- Stability over time is required to ensure reliable outcomes even when multiple tests need to be performed across a long span of years, as happens, for example, in the monitoring of chronic pathologies.
- Usability aspects (e.g., invasiveness and complexity of the procedures for sample extraction and preparation, user interface, etc.) must be addressed to ensure a wide acceptance of the technology, and also the overall direct and indirect costs of the proposed solutions, which can be assessed in terms of general cost-effectiveness.
2. Search Strategy and Papers Selection
- Application and type of transducing principle: target analyte, transducing principle (amperometric, impedimetric, or potentiometric), and detection protocol (Table 1).
- Sensing (Table 2).
- Validation protocols:
- Electronics design (Table 5).
- Adopted metrological figures, including sensitivity, limit of detection, accuracy, selectivity, repeatability, reproducibility, stability, linear range, response time, and recovery values (Table 6).
3. Standard Parameters for Validation
3.1. Sensitivity
3.2. Limit of Detection and Limit of Quantification
3.3. Error Analysis and Accuracy
3.4. Selectivity
3.5. Repeatability and Reproducibility
3.6. Stability
3.7. Linear Working Range and Linearity
3.8. Response Time
3.9. Recovery Values
4. Validation Procedures
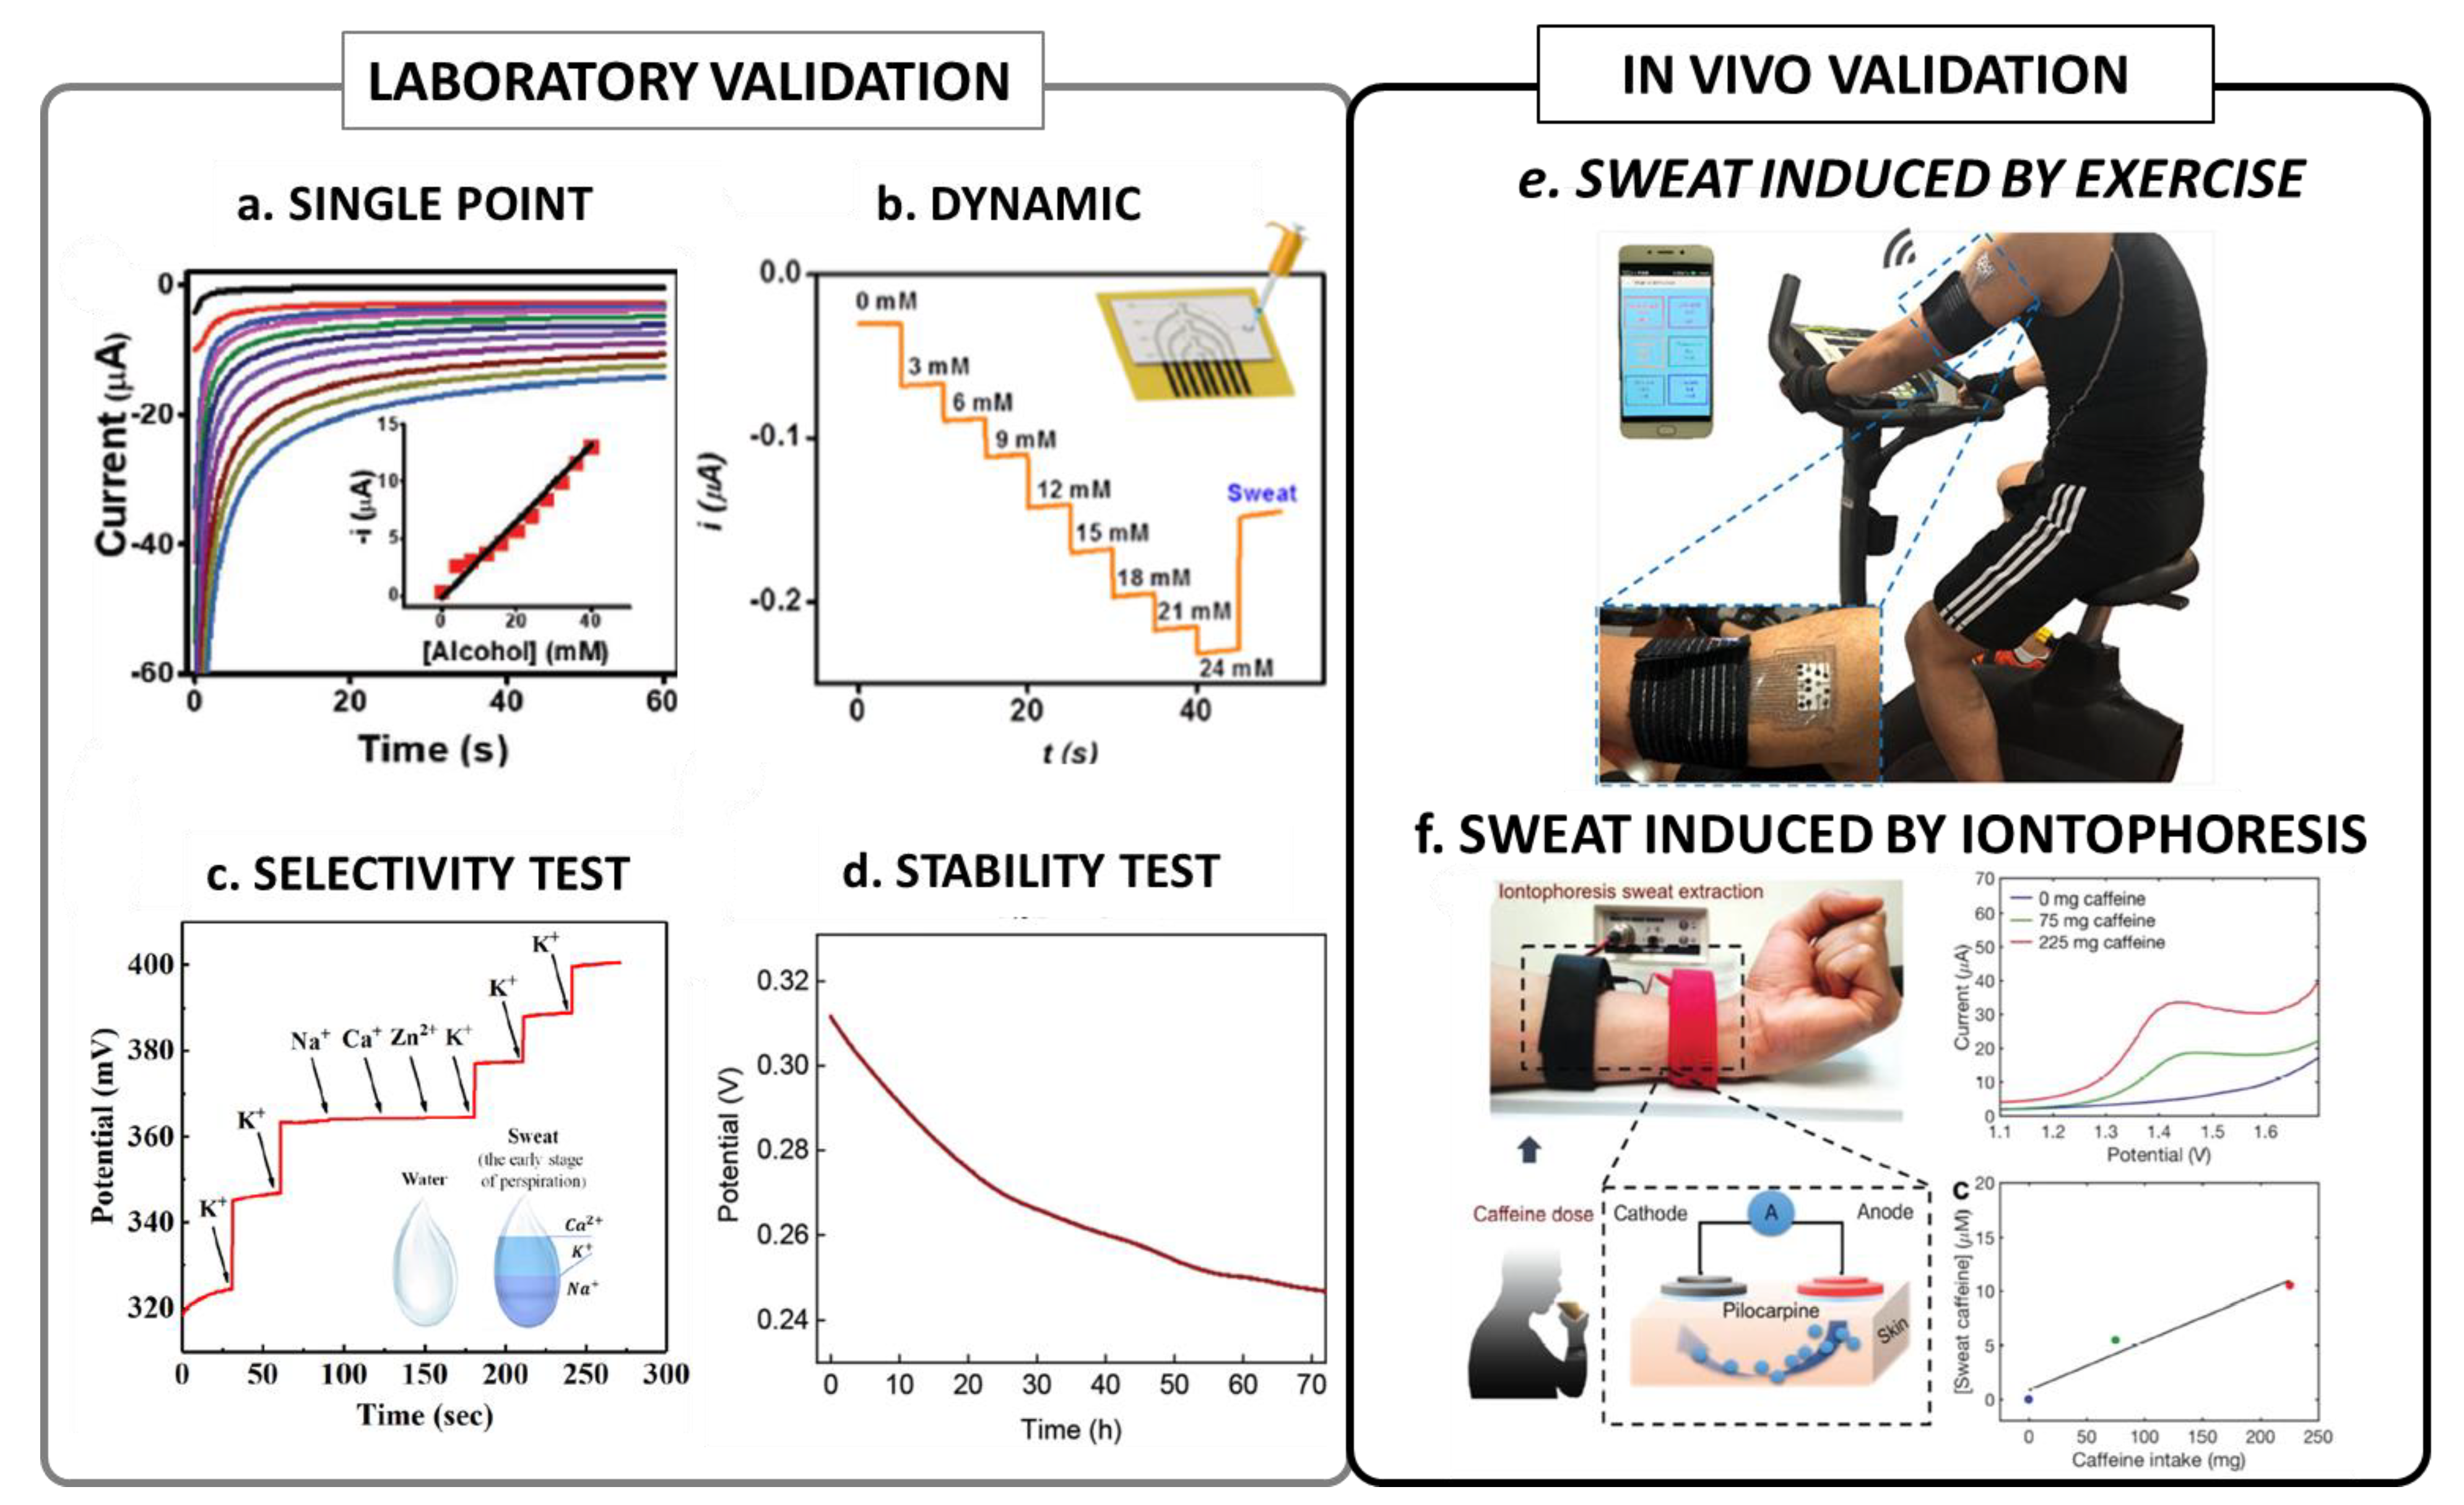
4.1. Laboratory Validation
4.1.1. Validation Tests with Standard Solutions
4.1.2. Validation Tests with Interfering Analytes
4.2. In Vivo/Clinical Validation
4.3. Validation against “Gold Standard” Assays
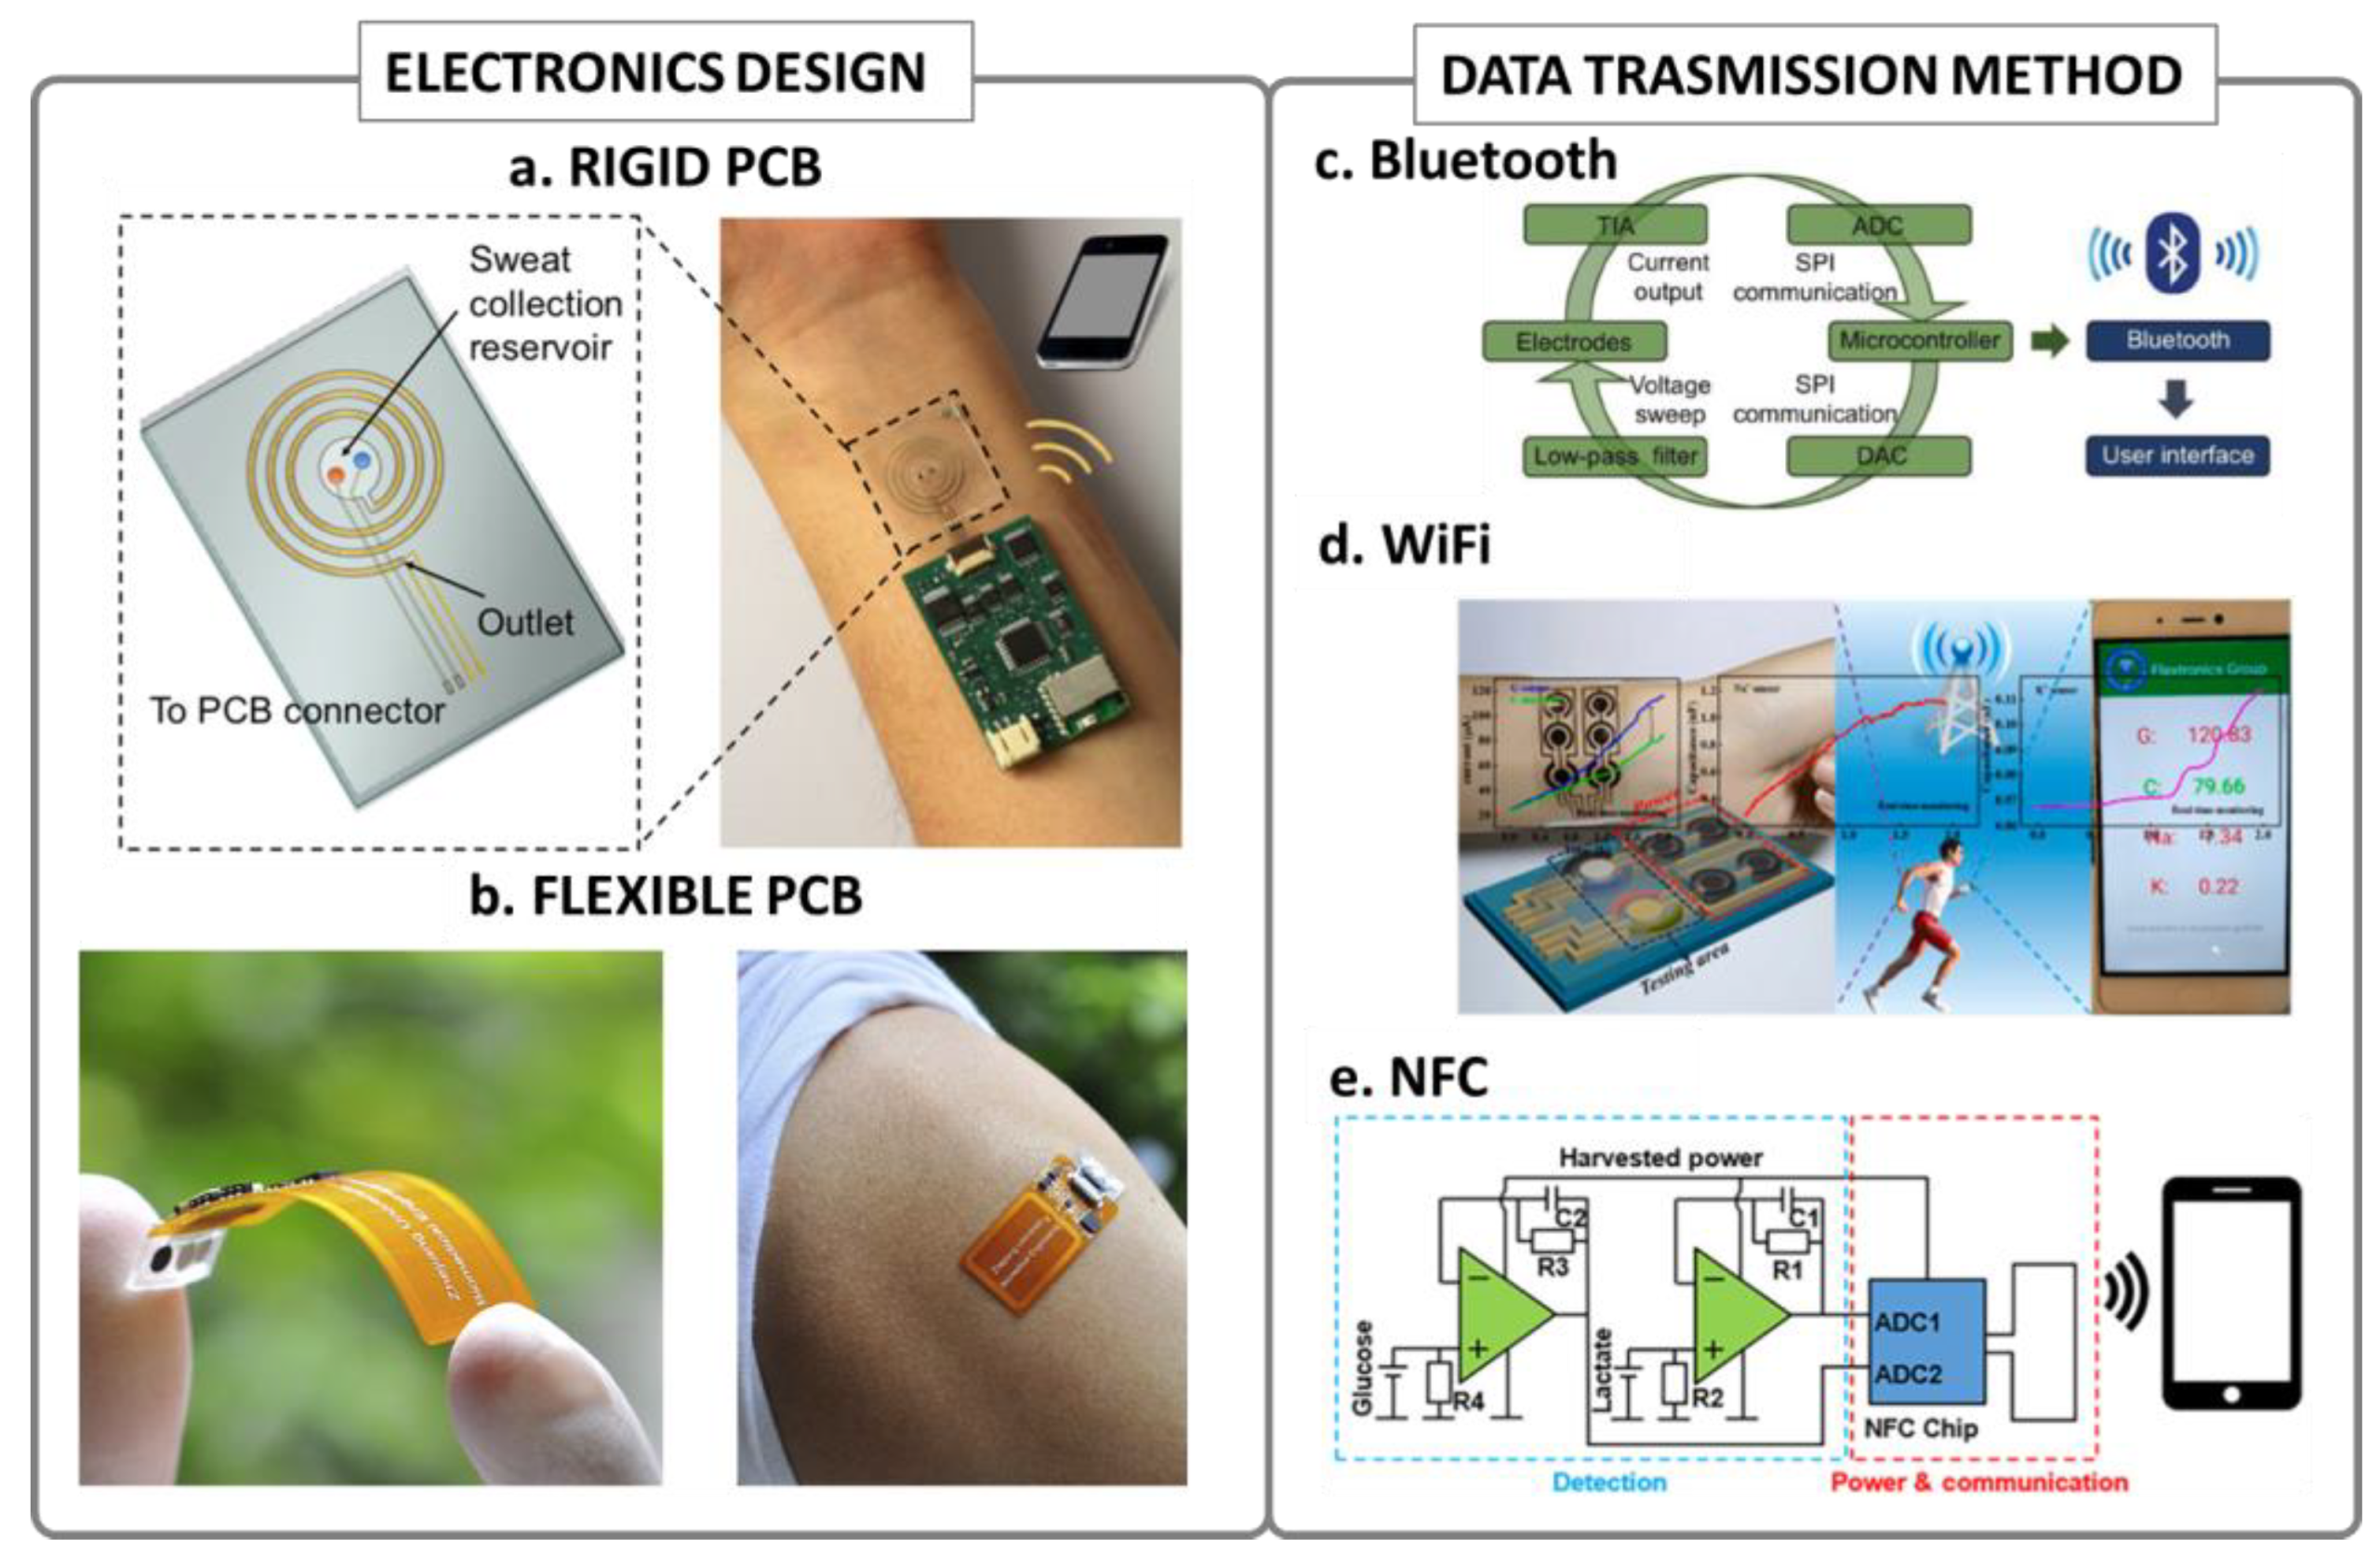
5. Electronics Design Considerations
- Customized high impedance analog front ends to process voltage signals of the two or three electrodes to output stable voltages;
- Built-in analog to digital converters (ADCs) to convert the analog signal into digital signals;
- A micro-controller unit (MCU), usually programmable, that manages all the operations on the board;
- A display [20];
- A transceiver (typically a Bluetooth module) to wirelessly transmit the data provided by the MCU to a user interface for displaying the measurements on a laptop or mobile. Although integrated Bluetooth low energy (BLE) represents the most frequently employed method for wireless transmission from the wearable device to laptops [22,31], or smartphones [31], interesting examples can be found adopting also an NFC-based transmission [29,34]. This recent method can improve miniaturization since the power supply can be harvested from mobile phones via NFC, thus resolving the need for battery integration in the wearable device. As opposed to BLE-based PoCT, the NFC-based solutions need a short distance between the PoCT and the reader and allow single-point measurements.
- A DC-DC converter (or low-dropout voltage regulator, etc.) to realize regulated and stable voltage from one single power supply and suitable for all the electronic sections—the analog front end and the digital components and the transceiver—which can need different voltage supplies [33].
6. Discussion

| REF | Analyte | Mediator | Selective Layer | Transducing Principle |
|---|---|---|---|---|
| Liang 2021 [49] | K+ | none | ion-selective membrane for K+ | potentiometric |
| Zhang 2021 [43] | K+ | none | ion-selective membrane for K+ | potentiometric |
| Vinoth 2021 [42] | Lactate, Na+, K+, and pH | Prussian Blue | lactate oxidase enzyme target-specific ionophores | amperometric potentiometric |
| Wenya 2019 [44] | glucose, lactate, ascorbic acid (AA), uric acid (AU), Na+, and K+ | Pt nanospheres for glucose and lactate; EDOT: PSS for Na+ and K+; none for AA and AU | enzymes for glucose and lactate; ion-selective membranes respectively for K+ and Na+; selectivity ensured by representative oxidation peaks for AA and AU; | amperometric (glucose, lactate), potentiometric (K+ and Na+) voltammetric (AA and AU) |
| Zhang 2019 [34] | pH, Na+, K+, and Ca2+ | none | Al2O3 sensing layer for pH; ion-selective membranes respectively for K+, Ca2+ and Na+; | amperometric ion-sensitive field effect transistors (ISFETs)) |
| Lu 2019 [47] | glucose, Na+, K+ | none | chitosan/NiCo2O4 for glucose; ion-selective membranes respectively for K+, and Na+; | amperometric capacitance sensor |
| Sempionatto 2019 [48] | Na+, K+ | none | ion-selective membranes respectively for K+ and Na+ | potentiometric |
| Bandodkar 2019 [45] | sweat rate, pH, lactate, glucose, and Cl− | Tetrathiafulvalene | pH-sensitive die and silver chloranilate; lactate oxidase trapped in CNT paper; glucose oxidase in Nafion; | colorimetric (rate, pH, Cl−) biofuel cell (Lac and Glu) |
| Xu 2019 [29] | calcium, chloride | none | Ion-solvent polymeric membrane selective for Ca2+; electrodes of Ag/AgCl chlorinated in 3M KCl solution for Cl−. | potentiometric |
| Tai 2018 [33] | caffeine | none | selectivity ensured by representative oxidation peaks for caffeine | voltammetric |
| Nyein 2018 [31] | H+, Na+, K+, Cl− | none | ionophore cocktails coated with selectivity respectively for H+, Na+, K+, Cl− | potentiometric |
| Alizadeh 2018 [35] | Na+ and K+ | none | ion solvent-polymeric membrane selective for Na+ and K+ | potentiometric |
| Kim 2018 [32] | glucose and alcohol | Prussian blue | enzymes | amperometric |
| Gao 2016 [52] | glucose, lactate, sodium, potassium | Prussian blue | enzymes for glucose and lactate ion-selective membranes | amperometric, potentiometric |
| Gamella 2014 [38] | alcohol | ferrocene | alcohol oxidase/horseradish peroxidase | amperometric |
| REF | Sensor Geometry | Electrodes Material | Sensor Substrate Material | Fabrication Technology | Microfluidic Integration |
|---|---|---|---|---|---|
| Liang 2021 [49] | two-electrode layout Circular (2 mm diameter) | WE: carbon + PEDOT:PSS RE: silver/silver chloride blue insulator layer | flexible PET | screen-printing | paper-based microfluidic |
| Zhang 2021 [43] | two-electrode layout Circular | WE: MWCNTs and MXene-Ti3C2TX RE: silver/silver chloride | flexible PET | screen-printing | PDMS microfluidics |
| Vinoth 2021 [42] | two-electrode layout rectangular, parallel electrodes | WE: carbon RE: silver Insulator layer | flexible polyimide sheet | screen-printing | 3D printed microfluidic |
| Wenya 2019 [44] | three-electrode layout for amperometric two-electrode layout for potentiometric, circular (3 mm diameter) | WE and CE: SilkNCT RE: Ag/AgCl | nickel conductive tape and flexible PET | sewed | silk-based porous structure |
| Zhang 2019 [34] | CMOS sensor chip containing five groups of 3D-EMG-ISFET sensors linearly distributed | electrodes: Au passivation layers: Si3N4 and SiO2 WE for pH: Al2O3 quasi reference electrode (QRE): Ag/AgCl | silicon layer | photolithography | cotton-based microfluidic |
| Lu 2019 [47] | two-electrode layout: concentric circular electrode arrays can be divided into power units (micro-supercapacitors, red dots part) and sensor arrays (dark dots part), respectively | Cr (30 nm)/Au (50 nm) electrodes Al2O3 insulation layer. | PET | photolithography; Atomic Layer Deposition; | none |
| Sempionatto 2019 [48] | 2 electrode layout | WE: Carbon RE: Ag/AgCl | PDMS | screen Printing; photolitography; electron beam evaporation; | traditional PDMS/PMMA-based microfluidic pattern realized via photolitography |
| Bandodkar 2019 [45] | two-electrode layout, anode and cathode | current collector: gold LaC anode: carbon nanotube (CNT) paper+ chitosan+ polyvinyl chloride LaCcathode: platinum black + Nafion Glu anode: carbon nanotube (CNT) paper Glu cathode: platinized carbon + Nafion | Polyimide | photolithography drop casting; | paper-based microfluidics and microfluidic pattern via PDMS-based photolithography |
| Xu 2019 [29] | two-electrode layout circular (3 mm diameter) | Ca2+ WE: Carbon + Gold NPs + graphene oxide Cl− WE: Ag/AgCl RE: Ag/AgCl | stretchable PDMS | screen printing | porous sponge directly on top of the three electrodes |
| Tai 2018 [33] | three-electrode layout circular (1 mm diameter) | WE: Silver + Carbon + Carbon Nanotubes immobilized with NafionRE: Ag/AgCl CE: Silver + Carbon Additional insulation layer | PET | roll-to-roll printing | n.a. |
| Nyein 2018 [31] | two-electrode layout for potentiometric, circular (1 mm diameter), two parallel spirals (width 150 μm, separation 100 μm), aligned with microfluidic channel, for sweat rate sensor | circular sensing electrodes: Ag and Gold. spiral electrode: 30/80 nm Cr/Au | PET | photolithography; thermal evaporation. | Spiral-shaped microfluidic channel via PDMS-based photolithography |
| Alizadeh 2018 [35] | two-electrode layout, circular (3 mm diameter) | WE and RE: conducting carbon + PEDOT dielectric insulating layers | PET | screen printing | laminated microfluidics formed from one or more hydrophilically treated plastic films with patterned adhesives |
| Kim 2018 [32] | three-electrode layout with an original design shaped like a panda. Cathode and anode for sweat induction on the two sides in between WEs and CEs. | WE and CE: Prussian blue conductive carbon RE: Ag AgCl insulator to protect tracks | papilio temporary transfer tattoo base paper | screen printing | none since it is a tattoo directly on the skin |
| Gao 2016 [52] | two-electrode layouts, circular (3 mm diameter) | WE: 30 nm Cr/50 nm Au + PEDOT:PSS (for ions)/CNT (for metabolites) RE: Ag/AgCl | Flexible PET | Photolithography, galvanostatic electrochemical polymerization | photolithography-based microfluidics |
| Gamella 2014 [38] | RE (Ag/AgCl) and an auxiliary (Pt), WE cylindrical pellets of bienzyme (HRP, AOD) + ferrocene (mediator) + graphite-Teflon electrode | no, working solution (phosphate buffer 0.05 M pH 7.4) separated from the skin by a PTFE membrane. | none | solid electrodes | none |
| REF | Number of Sensors | In Vitro Diluting Solution Used | Calibration Protocol | Selectivity Test | Stability Test |
|---|---|---|---|---|---|
| Liang 2021 [49] | 5 | Deionized water | Continuous calibration: each sensor subjected to increasing concentration of K+ (non-homogeneous steps from 1 mM to 32 mM). Response time computed from the curve obtained. All measurements performed using an electrochemical workstation. | Change in sensor response measured when selected interfering analytes (Mg2+, Na+, Ca2+, HCO3−, NO3−, SO32−, lactate, Uric Acid, and Glucose) were added in the solution. | Long-term stability of the sensor was evaluated over a period of eight days |
| Zhang 2021 [43] | 5 | PBS | Continuous calibration: each sensor subjected to increasing concentration of K+ (non-homogeneous steps from 1 mM to 32 mM). The repeatability analysis of the sensor evaluated systematically by observing the potential response of two sensors on ten separate occasions. | The selectivity experiment of the sensor carried out by the potential response method with successive addition of 1 mM [K+] (two-fold), followed by electroactive interfering species of 20-μM Zn2+, 4 mM Na+, and 4 mM Ca2+; and finally; 8 mM, 16 mM, and 32 mM [K+] | n.a. |
| Vinoth 2021 [42] | 6 | PBS, distilled water | Combined single point and continuous calibration with increasing concentration steps for lactate sensors. Only continuous calibration with both increasing and decreasing concentration steps for pH, Na and K sensors. | For lactate single chronoamperograms were recorded with 5 mM lactate in the absence and presence of possible interfering species (Na+, K+, UA, AA, Glucose); For ions change in sensor response was measured during a continuous choroamperometry when selected interfering analytes are added to the probing solution (NH4, Ca+, Mg+) | Stability evaluated with repeated measurements over a period of 10 month |
| Wenya 2019 [44] | 5 | 0.1 M PBS (pH 7.0) | Continuous calibration: each sensor subjected to increasing concentrations (low to high) of each target analyte. | Change in sensor response measured when selected interfering analytes are added to the probing solution | Measurement performed each week over a period of 4 weeks |
| Zhang 2019 [34] | n.a. | PBS and Artificial sweat containing 10 mM KCl | Continuous calibration: each sensor subjected to increasing and decreasing concentration/pH step changes (10 mM, 20 mM and 100 mM for [Na+] and 4,5,6,7,8 for pH). | Change in sensor response measured bringing the tested solution to different pH and adding interfering ions | Measurement during time with a dynamic response of the sensor |
| Lu 2019 [47] | n.a. | Not specified | Continuous calibration: increasing concentrations were dropped subsequently on the sensor. Glucose from 10 to 200 μm/[Na+] from 10 to 160 mM/[K+] from 1 to 16 mM. | Change in sensor response measured when lactate solution is added as interfering molecule. | Variation of capacitance stability of MSCs with 20,000 cycles. |
| Sempionatto 2019 [48] | n.a. | Deionized water or artificial sweat (composed of urea, lactic acid, NH4+, Ca2+, Mg2+,uric acid, glucose, Na+ and K+) | Continuous calibration: injected on the sensor through a six-port valve varying concentrations of sodium (0.1 to 200 mM) and potassium (0.1–100 mM) with 10-fold increments. | not performed | Visual examination of the resiliency to mechanical strain: i) skin mounted device and the device under different strain tests: ii)t wisting, iii) bending and iv) stretching. Also, EMF stability of the sensor over several days (tested several days during a week period) for static system using 10 mM ion concentration in water |
| Bandodkar 2019 [45] | 3 | PBS, artificial sweat | Continuous calibration: sensor suspended in a beaker containing buffer on a hot plate with controlled temperature starting from a no-analyte baseline and then adding increasing concentrations of glucose/lactate. | Change in sensor response measured on addition of common interferents (ascorbic acid, uric acid, and glucose) in physiologically relevant concentrations. | Sensors exposed to 10 mM lactate/150 uM glucose solution for 20 min. |
| Xu 2019 [29] | 5 | Deionized water, Artificial serum, Artificial urine, Artificial tear, human sweat samples | Continuous calibration: during a single long potentiometric measurement, sensors subjected to concentration changes of target analyte from low to high and then from high to low. Linearity range and LOD were then calculated from steady-state value of each outstepped step. | Change in sensor response measured when potential positive and negative interfering ions are added to the solution tested, in details: for Cl− sensor using HCO3−, CO3−, OH− and NO3− for Ca2+ sensor using Na+, K+, H+, NH4+ | 72 h potentiometric recording |
| Tai 2018 [33] | n.a. | Acetate buffer solutions; human sweat samples | Single point calibration using standard solutions: caffeine solutions with different concentrations used on different sensors for DPV measurements performed with a commercial potentiometer. Single point calibration using sweat-based solutions: caffeine added to sweat samples in different concentrations. To improve the sensitivity, accumulation of caffeine molecules at negative potential. Commercial potentiostat used for all the measurements. | Change in sensor response measured when selected analytes (urea, glucose, lactic acid, ascorbic acid, pilocarpine) were added in physiologically relevant concentrations to 40 × 10−6 m of caffeine in the acetate buffer solutions. | n.a. |
| Nyein 2018 [31] | n.a. | Deionized water | Combined single point and continuous calibration of Na+ sensor and flow rate sensor: (1) fixing the flow rate, sensing electrodes exposed to three different Na+ concentrations. (2) fixing the Na+ concentration, spiral electrode exposed to three different flow rate values. (3) continuous monitoring of the measurement during time to follow how both sensors respond to step variation in Na+ or flow rate | Not performed | Measurement for 350 s for Na+ sensor and for 1000 s for flow rate sensor |
| Alizadeh 2018 [35] | 3 | Deionized water | Single point calibration with different salt concentrations directly on top of electrodes. Continuous calibration of a Na+ ISE integrated in a patch to various salt solutions (0.1,1,10,100 mM) at a flow rate of 5–10 μL min. All measurements performed with commercial instrumentation and using an in vitro fluidic system for artificial sweat delivery to the patch | Change in sensor response measured when K+ is added in a Na+ environment. | n.a. |
| Kim 2018 [32] | 3 | PBS | Single point calibration: response of the glucose and alcohol biosensor tested in response to increasing ethanol concentrations tested with separate chronoamperometric measurements of 60 s. | Change in sensor response measured when relevant electroactive species (glucose, lactate, creatine, ascorbic acid, and uric acid) were added to 10 × 10−3 m ethanol. | Repetitive measurements of ethanol (left) and glucose (right). |
| Gao 2016 [52] | 8 | PBS, artificial sweat | Continuous calibration: the chronoamperometric responses of the glucose and lactate sensors and the open circuit potential responses of the sodium and potassium sensors to increasing concentrations of the respective analyte solutions in phosphate-buffered saline (PBS) were measured. Additional testing performed to evaluate the influence of mechanical bending and using artificial sweat diluting solution. | Change in sensor response measured when relevant electroactive species are added. Shared solid-state Ag/AgCl or PVB reference electrodes were used respectively for metabolites and ions. Data recording was paused for 30 s for the addition of each analyte. | Repetitive measurements performed over a period of 4 weeks. |
| Gamella 2014 [38] | 10 | PBS | Single point calibration using different concentrations of ethanol in PBS with temperature control. Repeatability tested repeating the same measurement on a single biodevice with 10 different solutions. Reproducibility tested repeating the same measurement on 10 different biodevices | n.a. | Five different biodevices stored for 2 months in PBS and other five biodevices under dry conditions. |
| REF | Number of Subjects | Ex Situ Analysis Protocol | In Situ Analysis Protocol | Data Analysis | Comparison with Other Gold Standard Test Techniques |
|---|---|---|---|---|---|
| Liang 2021 [49] | 1 | n.a. | Task: three different phases, a 5-min warming-up, 20-min cycling, and a 5-min rest. | Real-time analysis was performed on the volunteers during working on a cycle ergometer with the device attached to the forearm area by a transparent adhesive PU membrane with a round hole for sweat evaporation | Only reference to standard K+ level from literature in serum |
| Zhang 2021 [43] | 1 | Ex situ (off-body) measurements from a PBS with known [K+] concentration value samples were employed to verify the accuracy of on-body measurements. | Task: stationary cycling real-time perspiration monitoring on the arm | After properly connecting NFC and pre-installed application, the PC displays the sensor’s real-time output potential. Data are read from the FRAM, with the ADC values and corresponding raw voltages converted and displayed as [K+] concentration values using ex situ pre-calibration. | No comparison with gold standard techniques, but performance comparison with that of alternative sensors detailed in the published scientific literature |
| Vinoth 2021 [42] | 2 | Sweat samples were collected at two different intervals of 15 and 30 min of stationary biking and analyzed using several gold standard techniques. | Task: 30 min stationary biking load is initially increased, then maintained constant for up to ∼23 min, and then decreased. | The sweat secretion and subsequent analysis of the data (real time presented) were started after 8–10 min of exercise activities. Data obtained from in vivo calibrated device were compared with ex situ measurements. | Comparison with results from high-performance liquid chromatography (HPLC), flame atomic absorption spectrometry (FAAS), and a pH meter. |
| Wenya 2019 [44] | 5 | n.a. | Task: 30 min cycling Data acquisition: real-time and simultaneous on-body detection. | The test button was then pressed down to initiate the analysis, and results were displayed on the screen of smartphone after completion of the analysis. | Compared glucose detection with HPLC results |
| Zhang 2019 [34] | 2 | Sweat samples were induced and collected from volunteers, when sitting in a sauna, for off-body evaluation | n.a. | n.a. | A commercial ISE (HORIBA LAQUAtwin-Na-11) to measure Na+ concentration, and a commercial pH meter (HORIBA LAQUAtwinpH-22) to measure pH, |
| Lu 2019 [47] | 1 | n.a. | Task: 2 h of sport. Data acquisition: real time monitoring of glucose/K+ and Na+ in sweat | Only qualitative results and graphs displayed | n.a. |
| Sempionatto 2019 [48] | 3 | n.a. | Task: 50 min cycling Data acquisition: recorded in real-time during a 2000 s exercise activity | Data transmitted and displayed using a laptop and a homemade system control developed in Matlab. Only qualitative graphs of analytes concentration during exercise time. | n.a. |
| Bandodkar 2019 [45] | 3 | n.a. | Task: subjects wear the device for two consecutive days and, on each day, execute a cycling exercise (15 min to 20 min) in the morning in fasting state, followed by another cycling bout 20 min after consuming 150 g of sweetened drink and then again 2 h after lunch in the evening. Data acquisition: real-time data acquisition during each trial occurs either through a compact, short-range reader or an extended, long-range reader that was positioned in the vicinity of the device. | During human trials, the subjects paused to take an image of the device using a smartphone camera, for colorimetric analysis. Mean values extracted from three random points (n = 3) from the colorimetric assays yielded the chloride concentration and pH. Mean concentration values calculated from the data generated by the electrochemical lactate and glucose sensors during the last 1 min (n = 60) of cycling resulted in concentrations. | Analyses using conventional techniques such as commercial blood lactate (Lactate Plus; Nova Biomedical, MA) and blood glucose (Accu-Chek Nano blood glucose meter, Roche Diabetes Care Inc.) meters capture blood lactate and glucose levels before and after each cycling bout, as points of comparison. |
| Xu 2019 [29] | 1 | n.a. | Task: running on the treadmill Data acquisition: 1 per minute, proximity of the smartphone | Real-time data and real-time plots of ion concentrations. The concentrations of Ca2+ and Cl− during the whole exercising process could be calculated thanks to the calibration performed in vitro. | The detection results of the electrochemical patch (N = 5) were compared with laboratory reference method, including atomic absorption spectrophotometer and ion chromatography. |
| Tai 2018 [33] | 2 | Human sweat samples collected thanks to a pilocarpine hydrogel-based iontophoresis from subject wrist for 30 min or from the forehead every 5 min during cycling analyzed ex situ with commercial potentiostat | Task: subjects asked to consume a single-shot espresso (≈75 mg caffeine), then rest for 30 min, and then to begin cycling with the sensor fixed around the subject’s wrist with a PDMS band. Data acquisition: 1 measure every 10 min | Raw data was then transmitted via Bluetooth wirelessly to a user interface (CoolTerm serial-port terminal application), normalized to a common baseline current, and filtered (MATLAB Hampel and Smooth functions) for caffeine level monitoring on a computer. Curve fitting was performed and plotted as the dotted line (MATLAB Weibull function). | n.a. |
| Nyein 2018 [31] | 2 (sweat rate and Na) 1 (sweat rate, K, Cl, pH) | n.a. | Task: cycling on an ergometer, constant power with the patch around the wrist Data acquisition: discrete measurement from Macroduct every 3 min to 4 min, continuous measurements performed with customized electronics with operating frequency 100 kHz | Qualitative comparison between the 2 subjects tested for sweat rate and Na+; qualitative plots for pH, K+, Cl− and sweat rate to show possibility of multiple sensing. Parameters extracted: proportional trends, response time | On-body performance of the sweat rate sensor was validated with the Macroduct which is a standard sweat collection system used in cystic fibrosis diagnosis. No validation for Na+, K+, Ph measurements |
| Alizadeh 2018 [35] | 1 | n.a. | Task: high-intensity exercise on a bicycle or a treadmill with the patch on the subject’s back, adjacent to the spine on the latissimus dorsi muscle and/or thoracolumbar fascia in the region of the upper lumbar vertebra. Data acquisition and transmission: The sweat patch and associated electronics module were monitored remotely via Bluetooth for the duration of the exercise sessions. Sample rate: 100 Hz, then moving averaged at 15 s | All work was carried out under a scope of work that was determined not to be human subject testing (E&I Institutional Review Board). As a result of this process, the data collected during on-body was specifically not calibrated to prevent the generation of physiologic data on the subject, thus all data for on-body testing is presented in the raw form (mV). | n.a. |
| Kim 2018 [32] | 11 | n.a. | Sweat induced with IP with the sensor placed onto the deltoid. Task: initial baseline measurement, subjects sugar-rich food with an alcoholic beverage (12 oz. of beer or 5 oz. of table wine), wait for 15 min, second measurement. The same protocol repeated with varying chronologies of food/alcohol consumption. Data Acquisition: flexible PCB board was connected to the tattoo using magnets to perform discrete measurements every 20 min. | Discrete values acquired compared among the different conditions tested. The correlation blood level and sweat current signal for both glucose and alcohol was quantitatively described using R2 parameter, | Immediately before starting the experiment, blood glucose and alcohol levels were measured using commercial glucose strips (Accu-Chek Aviva Plus) and a commercial FDA-approved breath analyzer (Alcovisor Mars Breathalyzer, Hong Kong) to validate the sensor performance. |
| Gao 2016 [52] | 26 | Ex situ sensor performance conducted by testing sweat samples collected from the subjects’ foreheads. Sweat samples were collected every 2–4 min by scratching cleaned foreheads with microtubes | Task: three trials: constant workload cycle ergometry (14 subj), graded workload cycle Ergometry (7 subj), and outdoor running (12 subj). An ergometer providing real-time monitoring of heart rate, oxygen consumption, pulmonary ventilation and power output was used. The FISAs were packaged inside traditional sweatbands during the indoor and outdoor trials. The sensor arrays were calibrated, and worn on cleaned foreheads and wrists. | Due to differences in absolute potential values for ISEs in the same solution. Therefore, one-point calibration in a standard solution containing 1 mM KCl and 10 mM NaCl was performed for Na+ and K+ sensors before each use. The measured potential of ISEs in the standard solution was then set to zero by the microcontroller. | The accuracy of on-body measurements was verified through the comparison of on-body sensor readings from the forehead with ex situ (off-body) measurements from collected sweat samples, no additional method used. |
| Gamella 2014 [38] | 40 | n.a. | Sweat was induced by an IP system (Macroduct) for 5 min. Task: alcoholic beverage assumption in 5–10 min (gin, rum or whisky mixed with a cola or juice soft drink) then alcohol monitoring following two protocols: continuous mode → biodevice on the skin after sweat generation, continuous measurement from 30 min to 2 h. single measurement mode → placing the biodevice in contact with the skin for 5 min every 15 min. | Data analyzed by computing the correlation between the ethanol content in sweat and in blood by gas chromatography, the correlation between BAC and the current measured in sweat with the biodevice time response and maximum ethanol concentration with respect to blood results. | Reference standard blood analysis using gas chromatography method was performed 30 min after alcohol intake and every 10 min or after the single measurement. |
| REF | Electronics Substrate Material | Electronics Power Supply | Key Element Blocks | Data Transmission Methods | Additional Filtering Circuits Integrated, Processing Algorithm |
|---|---|---|---|---|---|
| Liang 2021 [49] | Flexible PCB | Lithium-polymer rechargeable battery of 50 mAh; measured average current consumption of the entire system during operation is 1–2 mA (depends on the Bluetooth data transmission frequency), which enables prolonged test. | voltage follower circuit with an operational amplifier interface with electrodes; microcontroller; 12-bit ADC; 8-KB RAM;128-KB Flash; I2C interface and a leading RF transceiver was embedded. | Bluetooth Low Energy | The output of the voltage follower circuit is followed by an RC low-pass filter to minimize the noise and interference in the measurements. The potential of the reference electrode, from a voltage divider network, is constant and then digitized and recorded using the ADC. |
| Zhang 2021 [43] | Copper and polyimide flexible film + PDMS cover | Battery-free, power harvested from smartphone thanks to Near Field Communication interface chip | The SD14 module of the integrated NFC chip is a multi-channel sigma-delta analog-to-digital converter with up to 14 bits of resolution integrated into the NFC chip consisting of a programable gain amplifier (PGA) and a sigma-delta analog-to-digital converter (ADC). The output of the [K+] sensor was read through a 14-bit ADC convertor. | Near Field Communication (NFC). The core of an integrated circuit communicates with other modules via a memory data bus and a memory address bus. Instructions and data are sent from the smartphone to the RFID chip through the ISO15693 analog front end and decoded through the ISO15693 decoding module. | The smartphone application was developed based on an Android studio software program that displays the [K+] concentration by reading and calibrating the ADC’s output voltage. |
| Vinoth 2021 [42] | Standard rigid PCB | 200 mAh Li-ion rechargeable battery; output regulated using a low dropout regulator to obtain precisely 3.0 V and stable power for every circuit component. | For chronoamperometry, potential voltage generated by a 16-bits DAC, feedback loop compares its output with reference, a driver circuit controls the potential of the CE and a trans-impedance amplifier (TIA) converts WE current into voltages. For potentiometry, three differential amplifiers built with operational amplifiers with extremely low input bias current (typically 0.5 pA) with rail-to-rail operation, enabling precise and wide-range measurement. Both outputs are sampled and digitized by an ADC integrated in the MCU, that controls all the PCB via serial peripheral interface (SPI). | Bluetooth low energy (BLE) | The real-time data are displayed using a custom-made graphic interface in the host platform. The regional dependence in sweat secretion and its biomarker composition is investigated by performing the sweat analysis at the underarm and upperback locations. |
| Wenya 2019 [44] | Standard rigid PCB | n.a. | Signal transduction, conditioning, processing, I-V inverter; Transimpedance amplifier; Differential amplifier; ADC microcontroller; | Bluetooth low energy (BLE) | Low-pass filter |
| Zhang 2019 [34] | Standard rigid PCB | Battery-free, power harvested from smartphone thanks to Near Field Communication interface chip | Signal transduction obtained with 3D-EMG ISFETs in an application-specific integrated circuit, a 16:1 multiplexer, 12-bit ADC, microcontroller | Near Field Communication (NFC) | n.a. |
| Lu 2019 [47] | Flexible polyethylene (PE) film | n.a. | ADC, RC oscillating circuit, microcontroller | WiFi module provides a way to allow cached data in CPU transmit to Mobile APP. | Signal from compensation electrodes used to reduce noise from unspecific responses |
| Sempionatto 2019 [48] | Flexible PDMS | Li-ion rechargeable battery (3.0 V) with 100 mAh capacitance | Voltage follower circuit, ADC, microcontroller | Bluetooth low energy (BLE) | n.a. |
| Bandodkar 2019 [45] | Copper-on-polyimide | Battery free, power harvested from smartphone thanks to near field communication interface chip; | Simple voltage-follower design, analog front-end independent from voltage supply thanks to zero-crossover operational amplifier, microcontroller and NFC front-end combination, various passive resistor and capacitor components using low-temperature solder paste. | Near Field Communication (NFC) | High-frequency filter that eliminates fluctuations introduced by the electric field of the primary NFC antenna. |
| Xu 2019 [29] | Ultrathin flexible polyimide | Battery-free, power harvested from smartphone thanks to Near Field Communication interface chip; | Analog front ends, voltage stabilizers, 3 ADCs, microcontroller | Near field communication (NFC) | Bias circuits, voltage buffer, and low-pass filter included in the analog front end |
| Tai 2018 [33] | Standard rigid PCB | Single rechargeable lithium-ion polymer battery (3.7 V), to power: the digital component of the circuit and the analog portion of the circuit at 5.0 V, achieved with DC-DC converter to boost up voltage the Bluetooth module at 3.3 V, using only a low-dropout voltage regulator | 16-bit DAC. low-pass transimpedance amplifiers, 16-bit ADC, microcontroller | Bluetooth low energy (BLE) | Fourth-order Sallen-Key low-pass filter |
| Nyein 2018 [31] | Standard rigid PCB | Rechargeable lithium-ion battery (3.7 V) | (1) For impedance measurement high precision impedance converter, on-chip ADC (2) For the open-circuit potential measurement, voltage buffer provides a midrail reference voltage, 16-bit ADC, microcontroller. | Bluetooth low energy (BLE) | Fourth-order Sallen-Key low-pass filter. Discrete Fourier transform (DFT) algorithm is used for impedance calculation. |
| Alizadeh 2018 [35] | Standard rigid PCB enclosed in a flexible material | Li-polymer battery; duration up to 3 h of continuous use | High impedance inputs necessary for open-circuit monitoring -No more details available | Bluetooth low energy (BLE) | An application program interface (API) for Matlab was created which allowed the results to be visualized and processed remotely. |
| Kim 2018 [32] | Polyimide | CR2032 Lithium coin battery, with power levels 30 and 6 mW in iontophoretic and amperometric phases, respectively | Proprietary system-on-chip device: configurable analog front end potentiostat, several DC-DC converters for voltage supply regulations to generate reference potentials, a 3-terminal adjustable current source to provide iontophoretic current | Bluetooth low energy (BLE) | A set of high voltage switches to switch between glucose and alcohol sensing, as well as to enter a high-impedance state during iontophoretic processing. |
| Gao 2016 [52] | Flexible PCB | Rechargeable lithium-ion polymer battery (3.7 V, 105-mAh) | Programmable microcontroller through an in-circuit serial programming interface. The conditioning path for each sensor was implemented in relation to the corresponding sensing mode. In the case of the amperometric-based glucose and lactate sensors, the originally generated signal was in the form of electrical current. | Bluetooth | All the analog signal conditioning paths concluded with a corresponding unity gain four-pole low-pass filter, each with a −3-dB frequency at 1 Hz to minimize the noise and interference in our measurements. A mobile application (the Perspiration Analysis App) was designed to accompany the FISA and to provide a user-friendly interface for data display and aggregation |
| Gamella 2014 [38] | Standard rigid PCB | Battery-powered (V not available), battery life 6–8 h | PCB, high current amplification circuit, I-V current, filtering circuit. AD8542, PIC 16F870, display LCD | Not specified, provided information only about results displayed on LCD | Noise removal |
| REF | Sensitivity | Limit of Detection | Accuracy (Error Analysis) | Selectivity | Repeatability | Reproducibility | Stability | Linearity | Response Time | Recovery Values |
|---|---|---|---|---|---|---|---|---|---|---|
| Liang 2021 [49] | 61.79 mV/dec | n.a. | The final sweat potassium level is similar to the serum one, with a slightly broader range (approximately 2–8 mM). | Negligible interference of other ions and metabolites to the response of the K selective sensor (approximately 1 mV). | n.a. | RSD: 0.38%;however, absolute potential values for sensors differ in the same concentration of a solution, so calibration in standard solution, 1 mM KCl, is necessary before use. | The sensor has a stable sensitivity. | R2 = 0.999 | <5 s when concentration is doubled | n.a. |
| Zhang 2021 [43] | 63 mV/dec, amplified to 173 mV/dec using an NFC amplification | n.a. | Only reported a table comparing output from sensor and from complete system | Excellent | RSD performance of 3.33% (sensor) and 2.67% (system) in four measurements | Good reproducibility | n.a. | Linear range 1–32 mM | 2 s | From 92 to 97 % |
| Vinoth 2021 [42] | 71.4 mV/pH 59.5 and 60.1 mV/dec, respectively for Na and K | n.a. | The HPLC analyses showed higher levels of lactate, which could be due to the accumulation of lactate during sweat collection from the immediate vicinity of the microfluidic sensor. The AAS studies and pH-meter outputs showed minimal variations with respect to the corresponding sensors. | 3% increase in current response compared to the response current; maximum of 3.7% deviation in OCP responses Similarly, the potassium and pH sensors showed selective detection with 3.6% and 2% changes in the sensor responses | Reversibility with a negligible average RSD of 0.28%. Similarly, K-ISE (0.1–10 mM) and pH sensors (pH 5–7) displayed good carryover efficiencies with average RSDs of 0.32 and 0.47%, respectively | RSD=2.1% | All of the sensor performances are observed to be stable for more than 10 months. The sweat-extracting capability is reduced after 6 months due to the decrease in the hydrophilic nature of the fluidic system | Linear range for Na 0.02–200 mM and for K 0.01–100 mM | Around 10 s | n.a. |
| Wenya 2019 [44] | Glu: 6.3 nA/µM Lac: 174.0 nA/mM AA: 22.7 nA/µM UA: 196.6 nA/µM Na+:51.8 mV/decade K+:31.8 mV/decade | Glu: 5 µM Lac: 0.5 mM AA: 1 µM UA: 0.1 µM Na+:1 mM K+:0.5 mM | n.a. | Compared with the signal of the targeted molecule, no noticeable interference signals were detected, implying the good selectivity of each sensor, which is beneficial to the construction of a multiplex sensing system. | n.a. | RSDs are 3.6% for glucose, 4.2% for lactate, 2.8% for AA, 3.9% for UA, 8.2% for Na+, and 7.5% for K+ | Negligible changes over 4 weeks with RSDs of 6.4% for glucose, 5.4% for lactate, 0.8% for AA, 3.4% for UA, 2.9% for Na+, and 1.8% for K+ | Glu: from 25 to 300 µM Lac: from 5 to 35 mM AA: from 20 to 300 µM UA: from 2.5 to 115 µM Na+: 5 to 100 mM K+: 1.25 to 40 mM | n.a. | n.a. |
| Zhang 2019 [34] | Na+:−56.9 mV/decX K+: −48.1 mV/decX Ca2+: −25.7 mV/ decX | n.a. | Compared to commercial Na+ meter and pH meter maximum deviation of maximum 12% and 2.3%, respectively. | Selectivity reported as cross-sensitivities in mV/decX: for Na+ 2.7 vs. H, 2.3 vs. K+, 2.8 vs. Ca+; for K+ 6.4 vs. H, 8.6 vs. Na+, 0.8 vs. Ca2+; for Ca2+ 0.3 vs. H, −2.4 vs. Na+,−6.3 vs. K+ | n.a. | RSD 9.3% for our Na+ sensors, and 2.3% for our pH sensors | Maximum time-dependent standard deviation of 1.95% in 3D-EMG-Na+ sensor, and 1.36% in the 3D-EMG-pH sensor, with respect to their average value | n.a. | Fast response (<5 s). | n.a. |
| Lu 2019 [47] | Glu: 0.5 μA/μM () Na+:2.25 μA/mM (0.031 nF/mM capacitive mode) K+: 4.25 μA/mM (0.056 nF/mM capacitive mode) | Glu: 10 μM | n.a. | n.a. | n.a. | n.a. | Stable potential windows between 0 and 1 V; after 20,000 cycles, the capacitance retention still retained about 96.6% of its initial value, suggesting good cycling stability | The response currents rise up linearly with the increase in [Na+] from 10 to 160 mM and of [K+] from 1 mM to 16 mM Glu from 5–25 mM | n.a. | n.a. |
| Sempionatto 2019 [48] | K+: slope 60 ± 12 mV Na+: slope 46 ± 7 mV | n.a. | n.a. | Negligible interference from potential co-existing ions (Ca2+ and Mg2+). | Response to 10 mM ion concentration in water using 10 repetitive flow injections provided similar results | n.a. | After a week change of 23% for Na+ and of 19% for K+ | linearity of r = 0.96 for K+ r = 0.98 for Na+ | It takes over 5 min for the reservoir to be filled with sweat, during which only the background signal is recorded. | n.a. |
| Bandodkar 2019 [45] | Lac: 124 mV/(mM*cm2) Glu: 5.4 mV/(mM*cm2) | Lac: 2.1 mM Glu: 43 µM | Qualitative comparison between outputs from proposed sensor and conventional technique | Increment in signal due to interferents ~4% → Lac ~12% → Glu Interference of pH changes: Lac: SD 1 mV, maximum error of ~1.3 mM Glu: | Maximum RSD ~6% for Lac ~4% for Glu | maximum RSD, ~5.5% | The data reveal stable sensor response throughout the first 6 days (maximum RSD of 1.9 and 4.4% for glucose and lactate sensors, respectively) and a ~13 and ~23% Signal decrement for glucose and lactate sensors, respectively, by 8 days. | The output voltage of the biofuel cell-based sensors increases linearly with increasing load. | Glu: signal stabilizes within 10 to 20 s. Lac: signal stabilizes within 300 s | n.a. |
| Xu 2019 [29] | Ca2+: 29.24 mV/decade Cl−: −51.02 mV/decade | Ca2+: LLOD 5μM ULOD 0.5 M Cl−: LLOD 500 μM ULOD > 1 M | Relative errors between the average sensor readings and the real values acquired by AAS in serum, urine, sweat, and tear (1.57%, 3.58%, 4.91%, and 1.32%, respectively for Ca2+ and 1.33%, 1.43%, 1.53%, and 1.15%, for Cl−) | “Good selectivity” stated from negligible response to other anions or cations tested | Ca2+ sensors: RSD= 7.8%. Cl− sensors: RSD = 13.8% | n.a. | Ca2+: average decreasing rate of 0.90 mV/h Cl−: average decreasing rate of 1.50 mV/h during the first ten hours. Then, the output became stable and decreased to 2.15 mV during the rest sixty-two hours | Ca2+: R2 of 0.99832 linear range: 10−5 to 10−1 M Cl−: R2 of 0.99983 linear range: from 10−2 to 1 M | Ca2+: 20 sCl−: 30 s | n.a. |
| Tai 2018 [33] | Sensitivity of 110 nA/uM; sensitivity of correlation between sweat caffeine concentration and caffeine intake of 45 × 10−6 M/g | LOD 3 × 10⁻⁶ M | Peak current variations within 20% | The results of selectivity test show that the change in sensor response due to potential interferents falls within 9.2%. | n.a. | n.a. | n.a. | The correlation between sweat caffeine concentration and caffeine intake is highly linear with Pearson’s correlation coefficient of 0.98 | n.a. | n.a. |
| Nyein 2018 [31] | Na+: 56 mV/decade | n.a. | Error at each flow rate varies between 6% and 11%. No accuracy data for Na+ measurements. | n.a. | n.a. | n.a. | n.a. | n.a. | Na+ sensor: 12 min after the trial begins Sweat rate: 22 min after the trial begins | n.a. |
| Alizadeh 2018 [35] | 54.8 ± 5.8 mV per log aNa+ per decade Na+ 53.9 ± 5.0 mV per log aK+ per decade K+ | n.a. | n.a. | K+ ISE shows no response to Na+ ions in the concentration range of 1 × 10⁻⁴–1 × 10⁻¹ M, while its sensitivity to potassium ions is retained in an environment with more than onecationic species present. | n.a. | n.a. | n.a. | Linear relationship in static calibration, R2 = 0.9979 | Around 15 min from sweat induction | n.a. |
| Kim 2018 [32] | n.a. | n.a. | n.a. | Highly selective response to glucose/alcohol concentrations in the presence of relevant electroactive interference | <5% variation performing 10 repetitions of the same measurement | n.a. | Stability not evaluated during time but to repetitive measurements performed in time (<5% variation) | (1) Observed signal in static calibration resulted in a highly linear response (2) linear correlation with R2 = 0.998 between blood and sweat glucose and R2 = 0.999 blood-alcohol level and sweat-alcohol using the same subject. | No response time evaluated: waited at least 5 min after the analyte intake to be sure to record steady state values | n.a. |
| Gao 2016 [52] | Glu: 2.35 nA/μM Lac:220 nA/mM Na+: 64.2 mV/dec K+: 61.3 mV/dec | n.a. | Similar results recorded ex situ and in situ | The presence of nontarget electrolytes and metabolites causes negligible interference to the response of each sensor | n.a. | RSD of ~1% in sensitivity for ion sensors RSD of ~5% in sensitivity for metabolites sensors. | Metabolites sensors 5% uncertainty over 4 weeks. Ion sensors non stable, one point calibration required before each use. | A linear relationship between current/potential and analyte Concentrations could be observed | The responses of both sensors showed drift initially but stabilized within 1 min of the data recording | n.a. |
| Gamella 2014 [38] | (1.6 ± 0.1)A g−1 L, r = 0.934, intercept = (0.02 ± 0.02) A g−1 L (after 5 min) | 0.0005 (in vivo, 40 volunteers) | n.a. | n.a. | RSD: 9.1% | RSD: 10.5% | 30 days in PBS, 2 months if dry stored. | 0.0005–0.6 g L−1 (in vivo, 40 volunteers) | Baseline: in 2–6 min. signal appearance: 2–5 s. Steady state: 2–4 min (depends on ethanol content) | n.a. |
7. Conclusions
Author Contributions
Funding
Institutional Review Board Statement
Informed Consent Statement
Conflicts of Interest
References
- Sardini, E.; Serpelloni, M.; Tonello, S. Printed electrochemical biosensors: Opportunities and metrological challenges. Biosensors 2020, 10, 11. [Google Scholar] [CrossRef] [PubMed]
- Criscuolo, F.; Hanitra, I.N.; Aiassa, S.; Taurino, I.; Oliva, N.; Carrara, S.; De Micheli, G. Wearable multifunctional sweat-sensing system for efficient healthcare monitoring. Sens. Actuators B Chem. 2021, 328, 129017. [Google Scholar] [CrossRef]
- Shrivastava, S.; Trung, T.Q.; Lee, N.-E. Recent progress, challenges, and prospects of fully integrated mobile and wearable point-of-care testing systems for self-testing. Chem. Soc. Rev. 2020, 49, 1812–1866. [Google Scholar] [CrossRef] [PubMed]
- Tyler, J.; Choi, S.W.; Tewari, M. Real-time, personalized medicine through wearable sensors and dynamic predictive modeling: A new paradigm for clinical medicine. Curr. Opin. Syst. Biol. 2020, 20, 17–25. [Google Scholar] [CrossRef] [PubMed]
- Islam, T.; Mukhopadhayay, S.C. Wearable sensors for physiological parameters measurement: Physics, characteristics, design and applications. In Wearable Sensors: Applications Design and Implementation; IOP Publishing: Bristol, UK, 2017; pp. 1–31. [Google Scholar]
- Tonello, S.; Serpelloni, M.; Lopomo, N.F.; Sardini, E.; Abate, G.; Uberti, D.L. Preliminary study of a low-cost point-of-care testing system using screen-printed biosensors: For early biomarkers detection related to Alzheimer Disease. In Proceedings of the IEEE International Symposium on Medical Measurements and Applications (MeMeA), Benevento, Italy, 15–18 May 2016; pp. 1–6. [Google Scholar]
- Rezabakhsh, A.; Rahbarghazi, R.; Fathi, F. Surface plasmon resonance biosensors for detection of Alzheimer’s biomarkers; an effective step in early and accurate diagnosis. Biosens. Bioelectron. 2020, 167, 112511. [Google Scholar] [CrossRef]
- Sharma, S.; Kumari, R.; Varshney, S.K.; Lahiri, B. Optical biosensing with electromagnetic nanostructures. Rev. Phys. 2020, 5, 100044. [Google Scholar] [CrossRef]
- Méjard, R.; Griesser, H.J.; Thierry, B. Optical biosensing for label-free cellular studies. TrAC Trends Anal. Chem. 2014, 53, 178–186. [Google Scholar] [CrossRef]
- Yu, H.L.L.; Maslova, A.; Hsing, I.-M. Rational design of electrochemical DNA biosensors for point-of-care applications. ChemElectroChem 2017, 4, 795–805. [Google Scholar] [CrossRef]
- Kanitthamniyom, P.; Zhou, A.; Feng, S.; Liu, A.; Vasoo, S.; Zhang, Y. A 3D-printed modular magnetic digital microfluidic architecture for on-demand bioanalysis. Microsyst. Nanoeng. 2020, 6, 1. [Google Scholar] [CrossRef]
- Solhi, E.; Hasanzadeh, M.; Babai, P. Electrochemical paper-based analytical devices (ePADs) toward biosensing: Recent advances and challenges in bioanalysis. Anal. Methods 2020, 12, 1398–1414. [Google Scholar] [CrossRef]
- Kit-Anan, W.; Olarnwanich, A.; Sriprachuabwong, C.; Karuwan, C.; Tuantranont, A.; Wisitsoraat, A.; Srituravanich, W.; Pimpin, A. Disposable paper-based electrochemical sensor utilizing inkjet-printed Polyaniline modified screen-printed carbon electrode for Ascorbic acid detection. J. Electroanal. Chem. 2012, 685, 72–78. [Google Scholar] [CrossRef]
- Tonello, S.; Lopomo, N.F.; Serpelloni, M.; Serzanti, M.; Dell’Era, P.; Sardini, E. Preliminary study of inkjet printed sensors for monitoring cell cultures. Procedia Eng. 2016, 168, 578–581. [Google Scholar] [CrossRef]
- Tonello, S.; Stradolini, F.; Abate, G.; Uberti, D.; Serpelloni, M.; Carrara, S.; Sardini, E. Electrochemical detection of different p53 conformations by using nanostructured surfaces. Sci. Rep. 2019, 9, 17347. [Google Scholar] [CrossRef]
- Han, Y.; Dong, J. Electrohydrodynamic printing for advanced micro/nanomanufacturing: Current progresses, opportunities, and challenges. J. Micro Nano-Manuf. 2018, 6, 4. [Google Scholar] [CrossRef]
- Menon, S.; Mathew, M.R.; Sam, S.; Keerthi, K.; Kumar, K.G. Recent advances and challenges in electrochemical biosensors for emerging and re-emerging infectious diseases. J. Electroanal. Chem. 2020, 878, 114596. [Google Scholar] [CrossRef]
- Lee, H.; Song, C.; Hong, Y.S.; Kim, M.S.; Cho, H.R.; Kang, T.; Shin, K.; Choi, S.H.; Hyeon, T.; Kim, D.-H. Wearable/disposable sweat-based glucose monitoring device with multistage transdermal drug delivery module. Sci. Adv. 2022, 3, e1601314. [Google Scholar] [CrossRef] [PubMed] [Green Version]
- Cinti, S.; de Lellis, B.; Moscone, D.; Arduini, F. Sustainable monitoring of Zn(II) in biological fluids using office paper. Sens. Actuators B Chem. 2017, 253, 1199–1206. [Google Scholar] [CrossRef] [Green Version]
- Sun, A.; Venkatesh, A.G.; Hall, D.A. A multi-technique reconfigurable electrochemical biosensor: Enabling personal health monitoring in mobile devices. IEEE Trans. Biomed. Circuits Syst. 2016, 10, 945–954. [Google Scholar] [CrossRef]
- Zhang, M.; Guo, S.; Weller, D.; Hao, Y.; Wang, X.; Ding, C.; Chai, K.; Zou, B.; Liu, R. CdSSe nanowire-chip based wearable sweat sensor. J. Nanobiotechnol. 2019, 17, 42. [Google Scholar] [CrossRef] [PubMed]
- Anastasova, S.; Crewther, B.; Bembnowicz, P.; Curto, V.; Ip, H.M.; Rosa, B.; Yang, G. Zwearable multisensing patch for continuous sweat monitoring. Biosens. Bioelectron. 2017, 93, 139–145. [Google Scholar] [CrossRef] [PubMed]
- Martín, A.; Kim, J.; Kurniawan, J.F.; Sempionatto, J.R.; Moreto, J.R.; Tang, G.; Campbell, A.C.; Shin, A.; Lee, M.Y.; Liu, X.; et al. Epidermal microfluidic electrochemical detection system: Enhanced sweat sampling and metabolite detection. ACS Sens. 2017, 2, 1860–1868. [Google Scholar] [CrossRef]
- Currano, L.J.; Sage, F.C.; Hagedon, M.; Hamilton, L.; Patrone, J.; Gerasopoulos, K. Wearable sensor system for detection of lactate in sweat. Sci. Rep. 2018, 8, 15890. [Google Scholar] [CrossRef] [PubMed] [Green Version]
- Garcia, S.O.; Ulyanova, Y.V.; Figueroa-Teran, R.; Bhatt, K.H.; Singhal, S.; Atanassov, P. Wearable sensor system powered by a biofuel cell for detection of lactate levels in sweat. ECS J. Solid State Sci. Technol. 2016, 5, M3075–M3081. [Google Scholar] [CrossRef] [Green Version]
- Ouzzani, M.; Hammady, H.; Fedorowicz, Z.; Elmagarmid, A. Rayyan—A web and mobile app for systematic reviews. Syst. Rev. 2016, 5, 210. [Google Scholar] [CrossRef] [Green Version]
- Lavín, Á.; Vicente, J.D.; Holgado, M.; Laguna, M.F.; Casquel, R.; Santamaría, B.; Maiger, M.V.; Hernandez, A.L.; Ramirez, Y. On the determination of uncertainty and limit of detection in label-free biosensors. Sensors 2018, 18, 7. [Google Scholar] [CrossRef] [PubMed] [Green Version]
- Armbruster, D.A.; Pry, T. Limit of blank, limit of detection and limit of quantitation. Clin. Biochem. Rev. 2008, 29, S49–S52. [Google Scholar]
- Xu, G.; Cheng, C.; Yuan, W.; Liu, Z.; Zhu, L.; Li, X.; Lu, Y.; Chen, Z.; Liu, J.; Cui, Z.; et al. Smartphone-based battery-free and flexible electrochemical patch for calcium and chloride ions detections in biofluids. Sens. Actuators B Chem. 2019, 297, 126743. [Google Scholar] [CrossRef]
- Gauglitz, G. Analytical evaluation of sensor measurements. Anal. Bioanal. Chem. 2018, 410, 5–13. [Google Scholar] [CrossRef] [PubMed] [Green Version]
- Nyein, H.Y.Y.; Tai, L.C.; Ngo, Q.P.; Chao, M.; Zhang, G.B.; Gao, W.A.; Bariya, M.; Billock, J.; Kim, H.; Fahad, H.H.; et al. Wearable microfluidic sensing patch for dynamic sweat secretion analysis. ACS Sens. 2018, 3, 944–952. [Google Scholar] [CrossRef]
- Kim, J.; Sempionatto, J.R.; Imani, S.; Hartel, M.C.; Barfidokht, A.; Tang, G.; Campbell, A.S.; Mercier, P.P.; Wang, J. Simultaneous monitoring of sweat and interstitial fluid using a single wearable biosensor platform. Adv. Sci. 2018, 5, 1800880. [Google Scholar] [CrossRef] [Green Version]
- Tai, L.C.; Gao, W.; Chao, M.; Bariya, M.; Ngo, Q.P.; Shahpar, Z.; Hnin, Y.Y.N.; Park, H.; Sun, J.; Jung, Y.; et al. Methylxanthine drug monitoring with wearable sweat sensors. Adv. Mater. 2018, 30, 1707442. [Google Scholar] [CrossRef] [PubMed]
- Zhang, J.; Rupakula, M.; Bellando, F.; Garcia Cordero, E.; Longo, J.; Wildhaber, F.; Hermet, G.; Guerin, H.; Ionescu, A.M. Sweat biomarker sensor incorporating picowatt, three-dimensional extended metal gate ion sensitive field effect transistors. ACS Sens. 2019, 4, 2039–2047. [Google Scholar] [CrossRef] [PubMed]
- Alizadeh, A.; Burns, A.; Lenigk, R.; Gettings, R.; Ashe, J.; Porter, A.; McCaul, M.; Berrett, R.; Diamond, D.; White, P.; et al. Wearable patch for continuous monitoring of sweat electrolytes during exertion. Lab. Chip 2018, 18, 2632–2641. [Google Scholar] [CrossRef] [PubMed]
- Ang, L.F.; Por, L.Y.; Yam, M.F. Study on different molecular weights of chitosan as an immobilization matrix for a glucose biosensor. PLoS ONE 2013, 8, e70597. [Google Scholar] [CrossRef] [PubMed] [Green Version]
- Karnes, H.T.; Shiu, G.; Shah, V. Validation of bioanalytical methods. Pharm. Res. 1991, 8, 421–426. [Google Scholar] [CrossRef]
- Gamella, M.; Campuzano, S.; Manso, J.; de Rivera, G.G.; López-Colino, F.; Reviejo, A.J.; Pingarron, J.M. A novel non-invasive electrochemical biosensing device for in situ determination of the alcohol content in blood by monitoring ethanol in sweat. Anal. Chim. Acta 2014, 806, 1–7. [Google Scholar] [CrossRef] [PubMed]
- Gibson, T. Biosensors: The stability problem. Analysis 1999, 27, 630–638. [Google Scholar] [CrossRef] [Green Version]
- Andreasson, U.; Perret-Liaudet, A.; van Waalwijk van Doorn, L.J.; Blennow, K.; Chiasserini, D.; Engelborghs, S.; Fladby, T.; Genc, S.; Kruse, N.; Kuiperij, H.B. A practical guide to immunoassay method validation. Front. Neurol. 2015, 6, 179. [Google Scholar] [CrossRef] [PubMed]
- Suydam, L.A.; Rulis, A.M. Guidance for industry. Bioanalytical method validation. Fed. Regist. 2001, 66, 28526–28527. [Google Scholar]
- Vinoth, R.; Nakagawa, T.; Mathiyarasu, J.; Mohan, A.M.V. Fully printed wearable microfluidic devices for high-throughput sweat sampling and multiplexed electrochemical analysis. ACS Sens. 2021, 6, 1174–1186. [Google Scholar] [CrossRef]
- Zhang, S.; Zahed, M.A.; Sharifuzzaman, M.; Yoon, S.; Hui, X.; Barman, S.C.; Sharma, S.; Yoon, H.Y.; Park, C.; Park, J.Y. A wearable battery-free wireless and skin-interfaced microfluidics integrated electrochemical sensing patch for on-site biomarkers monitoring in human perspiration. Biosens. Bioelectron. 2021, 175, 112844. [Google Scholar] [CrossRef] [PubMed]
- He, W.; Wang, C.; Wang, H.; Jian, M.; Lu, W.; Liang, X.; Zhang, X.; Yang, F.; Zhang, Y. Integrated textile sensor patch for real-time and multiplex sweat analysis. Sci. Adv. 2019, 5, eaax0649. [Google Scholar] [CrossRef] [PubMed] [Green Version]
- Bandodkar, A.J.; Gutruf, P.; Choi, J.; Lee, K.; Sekine, Y.; Reeder, J.T.; Jeang, W.J.; Aranyosi, A.J.; Lee, S.P.; Model, J.B.; et al. Battery-free, skin-interfaced microfluidic/electronic systems for simultaneous electrochemical, colorimetric, and volumetric analysis of sweat. Sci. Adv. 2019, 5, eaav3294. [Google Scholar] [CrossRef] [Green Version]
- Moonen, E.; Haakma, J.; Peri, E.; Pelssers, E.; Mischi, M.; Toonder, J. Wearable sweat sensing for prolonged, semicontinuous, and nonobtrusive health monitoring. View 2020, 1, 20200077. [Google Scholar] [CrossRef]
- Lu, Y.; Jiang, K.; Chen, D.; Shen, G. Wearable sweat monitoring system with integrated micro-supercapacitors. Nano Energy 2019, 58, 624–632. [Google Scholar] [CrossRef]
- Martin, A.; García-Carmona, L.; Barfidokht, A.; Kurniawan, J.F.; Moreto, J.R.; Tang, G.; Shin, A.; Liu, X.; Escarpa, A.; Wnag, J. Skin-worn soft microfluidic potentiometric detection system. Electroanalysis 2019, 31, 239–245. [Google Scholar]
- Liang, B.; Cao, Q.; Mao, X.; Pan, W.; Tu, T.; Fang, L.; Ye, X. An integrated paper-based microfluidic device for real-time sweat potassium monitoring. IEEE Sens. J. 2021, 21, 9642–9648. [Google Scholar] [CrossRef]
- Purohit, B.; Vernekar, R.; Shetti, N.; Chandra, P. Biosensor nanoengineering: Design, operation, and implementation for biomolecular analysis. Sens. Int. 2020, 1, 100040. [Google Scholar] [CrossRef]
- Migliozzi, D.; Guibentif, T. Assessing the Potential deployment of biosensors for point-of-care diagnostics in developing countries: Technological, economic and regulatory aspects. Biosensors 2018, 8, 119. [Google Scholar] [CrossRef] [PubMed] [Green Version]
- Gao, W.; Emaminejad, S.; Nyein HY, Y.; Challa, S.; Chen, K.; Peck, A.; Fahad, H.M.; Ota, H.; Shiraki, H.; Kiriya, D.; et al. Fully integrated wearable sensor arrays for multiplexed in situ perspiration analysis. Nature 2016, 529, 509–514. [Google Scholar] [CrossRef] [Green Version]
- May, E.E.; Harper, J.C.; Brozik, S.M. Computational biosensors: Molecules, algorithms, and detection platforms. Model. Methodol. Tools Mol. Nano-Scale Commun. 2016, 9, 541–577. [Google Scholar]
Publisher’s Note: MDPI stays neutral with regard to jurisdictional claims in published maps and institutional affiliations. |
© 2022 by the authors. Licensee MDPI, Basel, Switzerland. This article is an open access article distributed under the terms and conditions of the Creative Commons Attribution (CC BY) license (https://creativecommons.org/licenses/by/4.0/).
Share and Cite
Tonello, S.; Abate, G.; Borghetti, M.; Lopomo, N.F.; Serpelloni, M.; Sardini, E. How to Assess the Measurement Performance of Mobile/Wearable Point-of-Care Testing Devices? A Systematic Review Addressing Sweat Analysis. Electronics 2022, 11, 761. https://doi.org/10.3390/electronics11050761
Tonello S, Abate G, Borghetti M, Lopomo NF, Serpelloni M, Sardini E. How to Assess the Measurement Performance of Mobile/Wearable Point-of-Care Testing Devices? A Systematic Review Addressing Sweat Analysis. Electronics. 2022; 11(5):761. https://doi.org/10.3390/electronics11050761
Chicago/Turabian StyleTonello, Sarah, Giulia Abate, Michela Borghetti, Nicola Francesco Lopomo, Mauro Serpelloni, and Emilio Sardini. 2022. "How to Assess the Measurement Performance of Mobile/Wearable Point-of-Care Testing Devices? A Systematic Review Addressing Sweat Analysis" Electronics 11, no. 5: 761. https://doi.org/10.3390/electronics11050761
APA StyleTonello, S., Abate, G., Borghetti, M., Lopomo, N. F., Serpelloni, M., & Sardini, E. (2022). How to Assess the Measurement Performance of Mobile/Wearable Point-of-Care Testing Devices? A Systematic Review Addressing Sweat Analysis. Electronics, 11(5), 761. https://doi.org/10.3390/electronics11050761