Abstract
In recent decades, the everyday working environment has increasingly shifted into the digital realm. Accordingly, the assessment of human working performance has become strongly influenced by the level, frequency, and mode of interaction with the digital environment. This paper presents a system-level comparative analysis of human–computer interactions in 2D versus 3D digital environments, focusing on human behavior in different environments and interfaces. For the purposes of this analysis, a new methodology is proposed—inspired by a set of new concepts and metrics—that can be used to evaluate digital interfaces based on the number and complexity of user operations. Beyond the use of objective indicators, the study was supplemented by a user survey of 52 people to map the congruence of digital systems and user requirements. According to the research results, in 3D virtual work environments, users perform at least 30 percent fewer elementary operations. The Information Access Cost is 54 percent less in immersive VR than in classical 2D user interfaces. Based on these figures, we conclude that the development trends behind 3D VR-based working environments coincide with the intention to extend human cognitive capabilities.
1. Introduction
Since the appearance of computers in the workplace, users’ everyday work experience has undergone significant changes in multiple phases. With every digital paradigm shift, the development of human–computer interaction (HCI) has been significantly impacted. In the late 1980s and early 1990s, character-based user interfaces (e.g., MS-DOS) were replaced by graphical user interfaces (e.g., Lisa, then Windows and MacOS platforms); similarly, starting from the second half of the 2010s, a growing number of 3-dimensional virtual reality platforms have appeared. Today’s trends are marked by the transition from 2D to 3D, which has gained a new impetus in 2021 with the highly publicized vision of a new three-dimensional Internet (Metaverse). This development direction offers three-dimensional online worlds where people can connect to each other and with virtual reality (VR) in the same way as they would in real life [1,2].
In an increasing number of areas—workplaces, education, healthcare, industry, manufacturing, business, marketing, society, as well as military applications—digital developments are leading to the realization that through the maturation of VR/AR/XR technologies, spatial digital content will become more and more widespread, and that such 3D content could gradually integrate 2D layouts and eventual supersede the role of 2D digital content. In parallel, as the relative benefits of user effectiveness became clear following the transition from character-based to 2D GUI-based interactions, it can be expected that even greater relative benefits can be identified as a result of the transition from 2D to 3D [3].
However, some research results show that untrained people struggle with the use of these VR/AR tools, leading to a high variance within the measured performance. For example, in their study, Aschenbrenner et al. showed that students found AR-assisted task solving too difficult, while 2D paper instructions performed significantly best on all factors [4]. A recent result showed that, although the AR-remote support results in significantly faster identification of machine components, standard assembly, and disassembly tasks are executed faster with the commonly used paper-based instructions [5]. It can be seen that there are situations where routine and the familiar digital environment are preferable for the user rather than using a new, innovative environment. However, technological progress, information dumping, and complexity are indications for the development of new solutions.
The complexity of digital working processes is increased by collaboration, remote (human–human and human–machine) interconnections, real-time monitoring, sensor-tracking, user behavior analysis, Industry 4.0 solutions, and digitization of processes, which result in greater operational complexity. The digital developments of Big Data, and of 3D VR solutions supported by artificial intelligence, are all aimed at decreasing the information pressure faced by users. Recent developments in human–machine interaction offer several approaches to interacting with 3D environments. At the same time, new abilities and skills are also developed on the human side, which have a role in shaping user thinking and capabilities, and lead to efficiency improvements [6,7]. Accordingly, the efficiency prediction of digital work processes can support users in making decisions about the choice of optimal digital workspaces, and in evaluating the impact on the cognitive load of operations performed in digital environments. Cognitive load is defined as the relative demand imposed by a given task in terms of the necessary mental resources [8].
To select the optimal digital platform for the user, it is necessary to assess and compare the HCI capabilities of the software. In this context, the complexity and number of user operations that need to be carried out for any given task can serve as objective (measurable and calculable) factors in support of such decision-making. If the digital workspace and the HCI supporting the execution of operations are well designed, we can expect a lower human cognitive load and better user performance during the workflow. In other words, our working hypothesis is that the level of complexity should be well-correlated with user performance.
The paper is structured as follows. Section 2 presents the research background. The following Section 3 defines key terms and metrics that give the basic foundation of the analysis. In Section 4, the framework and methods for this paper, then in Section 5, the research results are summarized. In Section 6, the reasons for the evolution of operational complexity in 2D and 3D virtual work environments are discussed. Finally, in Section 7, we conclude and summarize the aims, methods, and main results of the paper.
2. Research Background
2.1. Human–Machine Coevolution from CogInfoCom and cVR Perspective
The topic of human working performance and digital workflows closely relates to the scientific field of cognitive infocommunications (CogInfoCom). This interdisciplinary research field aims to facilitate the synergy between infocommunications and cognitive sciences, by examining and developing effective communication and interaction between humans and computers. CogInfoCom also aims to expand human cognitive capabilities with the help of different infocommunication devices and technologies. Furthermore, it seeks to provide a systematic research field for examining the co-evolution of infocommunication devices and human cognitive functions [9,10].
Another key research field in this topic is the cVR (Cognitive Aspects of Virtual Reality) [3]. cVR investigates how human cognitive capabilities can be augmented and extended by using different technologies in a 3D spatial context. A 3D context means a virtual reality system that is considered an infocommunication device, therefore it can be the basis of the effectiveness and efficiency of human performance, as it can radically improve the method of information organizing and handling. For example, information can be organized based on its relative importance or position within a workflow. Furthermore, this large amount of information can be shared and used collaboratively. Virtual reality can also be used to integrate other developments [3].
2.2. Virtual Realities as Virtual Workplaces
As a system, virtual reality can foster the transition from command-based interactions to the use of dynamic interfaces. In an optimal dynamic interface, user command could be replaced by collaboration between the human user and the computer. To reach this goal, cognitive science has a great role in understanding human behavior in these situations. Different characteristics of VR and human cognition allow reaching a more optimized virtual working environment in virtual reality than in 2D interfaces. These defining characteristics include three-dimensionality, gestures, affordance, and a sense of presence.
First, the use of the third dimension itself allows for a greater degree of organization of information and content. This arrangement and the structured overview of contents can be the basis of effective task performance. In addition, 3D space is a natural setting for human users, therefore spatial arrangements and metaphors can help robust understanding. In other words, the desktop VR system allows collective visualization and observations, which has enabled knowledge or information sharing [11].
The use of gestures also relies on the power of everyday actions. In other words, human–computer interaction can be more effective if users can express their goals through natural gestures and movements. This allows for a more direct expression of intentions, less dependence of the user experience on possible input devices, and more direct control of the virtual environment.
The collaboration on these interfaces could be based on affordance, which means that the appearance of an object tells something about its function. For example, the location of the handle on a refrigerator: if the handle is on the left-hand side, it affords a left-hand reach-and-grasp movement. Thus, it is defined in cognitive psychology as the ease with which the action possibilities of an item or system can be discerned [12]. In other words, the self-explaining design should be a priority instead of user guides [13]. Beyond object affordances, there is also a role for affordances in the perception of virtual reality [14].
Presence is the sense of being inside a virtual environment. A recent unified definition summarized it as the extent to which something (environment, person, object, or any other stimulus) appears to exist in the same physical world as the observer [15]. Presence is the subjective component that users experience thanks to the characteristics mentioned above of VR. With all these aspects of virtual realities, the users perceive that they work directly with the contents in a similar way as in the physical world.
Virtual reality can involve a range of technological solutions. In the present paper, the focus is on desktop virtual reality and immersive VR. In the latter case, the display device is an HMD, while in the former case the 3D environment is displayed on a simple monitor. Desktop virtual realities are popular due to their technical and financial accessibility and the lack of simulator sickness.
2.3. Operational Complexity
The paradigm shifts in the digital world, the emergence of globalization at the physical and virtual level, and the increasing information pressure have changed the structure and dynamics of information flows and led to a steady increase in the operational complexity of organizations. As organizations become complex systems, the structure of information flow has also become complex. It is, therefore, necessary to identify information resources that could be used more effectively to increase information productivity [16].
Much of the literature on operational complexity in work processes also deals with the analysis of the “system” itself, i.e., the working environment, and the capabilities of the system concerning human operational complexity analysis. Li [17] makes a distinction between the concepts of perceived complexity and objective complexity, thus referring to the important role of human cognitive factors in the field of operational complexity [17].
In a departure from the usual scenarios, modeling related to the representation of performance at the skill, rule, and knowledge levels is presented in Rasmussen’s paper. The author gives an overview of the different ways in which information is perceived at these different levels in the form of signs, punctuation marks, and symbols [18]. The presentation of the various possible ways of representing system properties in system-level analyses highlights the human behaviors (skill-based, rule-based, and knowledge-based) that occur in different environments and situations and the human performance associated with different behaviors that can be characterized at multiple levels of abstraction—from physical form to functional representation to intention or goal representation.
Operational optimization and control for industrial processes are of increasing importance and have attracted the attention of many researchers [19,20,21,22]. Thus, among the studies of operational complexity, it is worth mentioning the complexity of industrial operations and processes. Many Industry 4.0 innovations involve increased machine intelligence. These properties make socio-technical work in Industry 4.0 applications inherently more complex [23].
The complexity of human–machine interfaces poses cognitive and ergonomic changes, which makes it a challenge in industrial operations as well, such as layout design or assembly support.
The level and frequency of interactions with the environment affect the evolution of human performance. The classic and often used way to define performance is the number of tasks (operations) that can be performed per unit of time, or the time required to complete a task in a given system [24,25]. From the perspective of analyzing the cognitive aspects of virtual reality, it is worth contrasting the digital operation execution capabilities of traditional 2D interfaces with those of 3D VR to highlight how the HCI capability of digital environments evolves with the advent of 3D. The results of qualitative studies in the literature are promising. A previous analysis by Horváth and Sudár showed that 3D desktop VR provides a 30 percent improvement in the number of elementary operations to be performed and an 80 percent improvement in the number of machine operations to be performed compared to 2D alternatives [26].
2.4. Human–Computer Interaction in Digital Work Environments
Computer systems are now widely used to make daily life more effective and less stressful. However, digital workflows are becoming increasingly complex, which on the human side results in elevated cognitive load when using and shifting between these systems. Human–computer interaction (HCI) is considered the most important activity in the design process of any computer system [27], as it aims to study, implement, develop and evaluate the interaction between humans and computers. It aims to enable efficient and smooth communication. HCI uses knowledge from social and cognitive psychology, linguistics, communication theory, and graphic and industrial design [28].
For an effective interaction, it is inevitably essential to understand both agents. Török [13] enhanced four areas of understanding the human user: human behavior, human limits, human needs, and human cognition. Understanding human behavior means that the system can infer the motivation behind human actions. Extensive activity tracking in different aspects could provide more accurate and context-dependent information on the intention of the human user. This information could help to reduce the command-based interaction and increase the possibility of real collaboration between human and artificial agents. Most current interfaces require the user to explain their intent, and then explain their will also in a way that the computer can understand. However, human cognition did not evolve as a command-based interface, rather it relies more on recognizing environmental cues, affordances, and gestures. In recent years, several gesture-based interactions are developed. These are very easy to understand, thus people involuntarily prefer to use them. A common example is the turn-to-mute action of mobile phones [13].
Human–computer interaction has four elementary components: affordance, collaboration, respect of limits, and dynamic interface [29]. Török emphasized the interdependency of these four key elements. The collaboration facilitates the understanding of human limits. Thus, it can help to pave the way to more dynamic interfaces. The efficient interfaces naturally rely on affordance, which further promotes smooth collaboration [13].
With the continuously growing amount of information, that users should or aim to handle, screen size became an impediment to effective work. Furthermore, these are fragmented into different windows and tabs. Thus, the user has to switch back and forth between activities or software windows [30]. As a consequence, the user has to keep in mind, all the necessary parts of the working process, because, there are no visual cues that can help them. For example, most systems require assigning names or formal codes for all groups of documents. In everyday life, however, this is not the case; we place piles of related documents and know which group it is from the visual appearance, even if we have not given it a computer-interpretable name [31].
The information displaying capacity of such a productivity system is also a key factor. Users prefer to have an overview. It is also observed in the case of large-scale high-resolution displays, where users preferred to stand up or sit back at a distance to have a view of the entire display at once [32].
Virtual workspaces often include different options for collaboration between users. Real-time collaboration could include online communication services such as audio or video conferencing and instant messages. Furthermore, collaborative editing functions on documents are also becoming widespread. Integrating the session-centric and document-centric collaboration tools into one system was an early aim of virtual workspace design [33].
Another aspect of human limits and cognition is the focus during a working process. A well-designed interface should help the user to maintain the focus, and keep the user in the context of her reasoning process. Direct manipulation and interaction with the information help stay in the task’s cognitive zone, or workflow. Pull-down menus, and any type of menus, take the user out of this cognitive zone, as it requires reading and thinking about each item [34].
The present paper aims to analyze the working processes, human behaviors, and operations to achieve a more ergonomic design. For this, these are separated into manageable chunks, elementary functions, and logical sequences, which allows us to compare different systems based on these definitions.
3. Definitions and Metrics
In this section, we define key terms and properties that clearly define the complexity of user actions and the number of actions to be performed in various 2D and 3D digital working environments. The presented framework builds on the assumptions that by examining a system’s operational complexity it becomes comparable to other digital interfaces, as these are objective indicators. To determine the efficiency of a system, it is not enough just to reduce the number of operations to be performed to a uniform number of so-called elementary operations and analyze their relation to each other, but it is also important to focus on the investment in information access, the so-called information access cost.
The definitions presented here are based on the definitions published in 2018 in Horváth and Sudár’s paper [26]. However, rapid technological development has justified the revision of the previously presented definitions and their adaptation to new virtual working environments.
Section 3.1, Section 3.2, Section 3.3, Section 3.4, Section 3.5 and Section 3.6 present the complexity of the user operations specified in the definitions and the method of converting them to elementary operations, which carry the cognitive load weights in the values defined for the changes.
3.1. Elementary Operation—EO
An elementary operation is a simple interaction from the user that triggers the execution of a pre-defined process from the machine [26].
Single selection—select the digital item with a single click/tap or touch. The most common selection function usage aims at activation of digital content—transfer of control.
Double click/tap, touch—start a digital item, display full size, and activate a special function.
Key press—on a real or virtual device.
Press/push—long press of a key, a mouse button, or a controller—e.g., to maintain an operation.
Scroll up/down operation.
Swipe—on a touchpad, touchscreen, or virtual interface.
Head, -hand, -foot, -other body part movement.
From here on, each of these elementary operations will be regarded as having a complexity of 1 EO.
3.2. Complex Operation—CO
A complex operation is one that consists of more than 1, but at most 3 EOs that are performed in coordination.
For example, copying through the “Ctrl+C” key combination requires a click (to select) and pressing two keys to copy and paste. Similarly, the well-known drag-and-drop operation consists of a select EO, a push, and an inverse click or release both in 2D and 3D digital spaces.
Based on these examples, we propose to set up an equivalence between the metrics 1 CO and 3 EO.
3.3. Navigation-Based Elementary Operation—NBEO
An elementary operation is navigation-based if it is performed not with a keyboard but with a mouse, touchpad, touch screen, on-screen visualization (e.g., virtual keyboard), and hand- or other body part movement. In a 3D VR environment, this includes orbiting, rotation, positioning, changing direction, etc. For example, in the 2D operating system, file selection actions from the file manager involve moving the cursor to the appropriate location and then performing the other actions—so the sequence of actions is initiated by navigation. A good example is in 3D taking a position in preparation for the manipulation of the digital twin.
For the investigations in this paper, navigation-based elementary operations (NBEO) are considered to be a complexity of 1.5 elementary operations, where 1 NBEO = 1.5 EO.
3.4. Ordering Operation—OO
An ordering operation is a sequence of elementary and complex operations performed to improve the comprehensibility of digital content and users’ ability to navigate and comprehend it. An example of an ordering operation is when users arrange multiple windows on different parts of their screen to be able to shift their attention between them. Doing this consists of repositioning and resizing each window (the repositioning operation itself consists of dragging the window to the intended location, while the resizing operation consists of dragging at the corner of the window at least once and stretching both sides of the window to their final horizontal position). Thus, the complexity of such an operation would be at least 1 EO + 1 NBEO + 2 NBEO = 5.5 EO per window, though in practice it often reaches the complexity of 7 EO, as users often chose to stretch the window on all four sides, and/or may have to iteratively improve on the entire ordering operation. In 3D, there is reordering available digital content into an order of use. For operations in 3D, 2 EO (head and hand movement) 1 EO selection/grasp 1 navigation operation (1.5 EO), and 1 EO placement/release.
Motivated by the above example, we adopt the equivalence of 1 OO = 5.5 EO in this paper.
3.5. High Distraction Operations—HDO
Operations that are initiated by users through an EO or CO, but which also incur a period of waiting time, are considered high-distraction operations due to the iteration of inhibition and update associated with waiting and the frequent switching operations. Examples in 2D of such operations include file downloads, file opening operations in specific applications, file compression, etc., or 3D, simulation start-up, evaluation, interference with the operation of the digital twin, etc. The weight of the cognitive load associated with an operation is assumed to be 2.5, based on the time required to perform the operation and user feedback (see Section 5.3), we adopt the equivalence 1 HDO = 2.5 EO.
3.6. High Alternation Operations—HAO
High alternation operations require the user to switch back and forth between multiple windows to perform the necessary digital workflow. However, it is essential to note that HAO involves a complete change of the screen content, which results in a significant cognitive load. Related to this are the executive functions: inhibition (inhibiting dominant, prepotent responses), switching (detaching from an irrelevant task set and switching to a task set relevant to the current goals), and refreshing (updating the content of working memory).
This fact alone motivates using the 1 HAO metric by adopting the equivalence of 1 HAO = 5 EO.
The ranking of the above-mentioned operations (Section 3.1, Section 3.2, Section 3.3, Section 3.4, Section 3.5 and Section 3.6) taken to the value of elementary operations are shown in Figure 1.
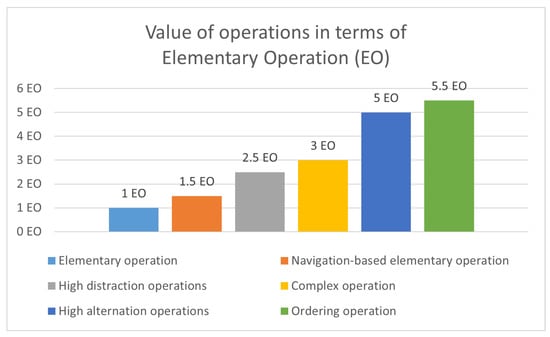
Figure 1.
Comparison of the value of operations in terms of elementary operations.
3.7. Information Availability—IA
This indicates what percentage of the information (digital content) needed to execute a workflow is available in the digital work environment when executing up to 1.5 EO (1NBEO).
Remark: e.g., 100 percent, if all the information required to execute the workflow is available and can be accessed by a navigation operation.
3.8. Information Access Cost—IAC
The weighted sum of the time spent accessing information for each type of operation, where the weights are the number of elementary operations corresponding to that type of operation.
Remark: this metric is high even when complex operations are performed in the same amount of time and when simple operations are performed for a long time. This includes the complexity of the operation and the user’s ability.
3.9. Information Validity—IV
This indicates the percentage of the information presented in the digital work environment that is directly required for task execution.
IV = Number of Valid Information Units/Summa necessary information units number.
Remark: To determine the percentage of information validity, it is necessary to determine exactly what and how many digital information units are needed to perform the task, e.g., relevant documents, tables data, diagrams, timeline, etc. Next, a content analysis of the digital working environment is performed concerning existing and missing digital content. E.g., if the total number of digital content units required is 10, but only 4 of them are present in the working environment, then the value of IV is 40%.
IV is 100% if the digital work environment contains only the information needed to perform the task and all of it. IV is 0% if the digital work environment does not provide any relevant information to perform the task.
3.10. Confuse Information Content—CIC
This indicates the percentage of the total information content in the workflow that is confusing (irrelevant) to task performance. Remark: IV + CIC = 100 percent, i.e., IV and CIC are disjoint sets.
3.11. Personalized Workflow Order Ability—PWO
This is an indicator of the facility of the digital work environment to provide users with the ability to arrange digital content in their own way. The value is 0 if the option is not provided, 1 if the users can set the layout themselves, and 2 if the optimal layout is automated with AI support.
3.12. Personalized Information Overview—PIO
Indicates the ability of the digital work environment to provide users with the ability to set personalized information overview. The value is 0 if the option is not given, 1 if the users can set the layout themselves, and 2 if it is automated with AI support.
3.13. Task Execution Tools—TET
The number of hardware tools needed to perform a task—shows how many independent tools the user needs to perform the task. The system is optimal when TET goes to 1.
For example, to perform an immersive VR task, you may need some accessories, e.g., a computer, VR glasses, two controllers, a wireless adapter, or a headset cable, so the value of TET is 5; or for a 2D working environment, the summa value of one computer, one keyboard, one mouse, one monitor the TET is 4.
If one laptop, tablet, or smartphone is enough to run the working environment, the value will be 1.
3.14. Degree of Interaction—DI
A measure of the ability of the digital work environment to provide interaction. The interaction can be human–human, human–machine (e.g., Digital Twin), and human–AI. The value of the metric is determined by the presence or absence of the following factors:
- Interaction with co-users;
- 2D digital content management;
- Real-time content management and change tracking;
- Navigation (2D interface or 3D space);
- Interaction with 3D objects;
- Interaction with digital twins;
- Simulation management;
- Adding and removing simulations;
- Interaction with AI with human initiation;
- Interaction with AI with both sides (AI and human) of the initiation.
Remark: DI is determined by the weighting assigned to each component. The validation of the metric requires further research methods related to the actual task, such as a questionnaire survey to determine reference values and validation of values.
The presented metrics aim to provide objective measurability and predictability to determine the optimal operational complexity with the lowest possible cognitive load.
4. Materials and Methods
The analysis presented in this article is based on three main pillars. First, the complexity of the operations used in digital workflows in 3 selected digital work environments was investigated. Based on the definitions and metrics presented in Section 3.1, Section 3.2, Section 3.3, Section 3.4, Section 3.5 and Section 3.6, a procedure was applied to compare the complexity of user operations. The second pillar was the HCI side analysis of the selected work environments, based on the methodology described in Section 3.7, Section 3.8, Section 3.9, Section 3.10, Section 3.11, Section 3.12, Section 3.13 and Section 3.14. Finally, a questionnaire survey and an in-depth interview were used to analyze the consistency of user needs and HCI services.
4.1. Operation Complexity
This analysis compares the user operations required for a given workflow in three productivity systems. In the comparative analysis, we investigate the use of applications running on a classic 2D operating system, a desktop VR and an immersive VR solution. In the detailed comparison, aspects of operational complexity and cognitive load are considered.
In all three platforms, the digital contents are the same in batch. These are frequently used communication interfaces (e-mail client, online meeting platform) and interfaces supporting operational work (document editor, spreadsheet for computational operations, internet browser). In the three analyzed systems, all of these are available as part of the digital working environment. In the present analysis, online document editors were used (Office 365). Therefore, the real-time content edition and tracking were also possible.
These digital contents are considered to be one project. Office and business tasks are usually grouped around a project. It can contain different digital content, and a group of people who are actors in the project. These digital contents also need to be prepared, and participants must be invited (by setting appropriate permissions). The methods of creating and setting up projects are not included in this analysis. Furthermore, the number of operations carried out in the various user programs; such as document creation, and spreadsheet management; are not included in the analysis, as these user operations and workload are platform-independently part of the substantive work.
Therefore, the baseline is that the digital contents related to the project are already placed in the 2D interface/virtual space, the appropriate user permissions are set, and the staff member(s) can start the substantive work.
4.1.1. 2D—Windows Operation System
The Windows operating system was chosen to evaluate the 2D interface. In this case, one display was available to the user to perform the task. There are several options for starting programs in the 2D Windows operating system. For the analysis, we have chosen the version available with the lower elementary operation—program launching from desktop icons.
4.1.2. Desktop VR—MaxWhere
As a desktop virtual reality system, the MaxWhere platform is used in the present analysis [35]. MaxWhere 5, and later versions 6 and 7, are available on the website and can be downloaded for free. There is a fundamental difference between version 5 and later versions in terms of HCI solutions, therefore versions 5 and 7 are included in the analysis. These VR platforms offer various predesigned spaces, containing several so-called smartboards, which are built-in screens that can display different digital and online contents, such as webpages, offline documents (PDF), images, video files, and so on. These fully-fledged web browsers allow using of these spaces as 3D virtual offices. Different spatial layouts are available. Users can navigate with the help of a mouse, touchpad, or touchscreen inside this virtual environment. Furthermore, guided tours are also available, where the participant can move through a predefined path with the help of the keyboard arrows.
This desktop virtual reality offers a solution for keeping the digital contents of a project together, through its smartboard sharing platform. Here, the user can create a project for a specified virtual environment, where the contents of the smartboards can be saved, and easily shared with anyone, through the virtual environment.
The Collaboration Large space was used, and a working table with five smartboards was selected to display the previously mentioned digital contents necessary for completing the workflow. As MaxWhere spaces and their design can be easily customized and optimized for each workflow, the authors have set up the space equipment for the study to be as optimal as possible. Thus, the space is free of distracting information, distracting 3D objects, avatars, or other components. The equipment of the space consists of 5 monitors for the 5 required digital contents. The layout is presented in Figure 2.
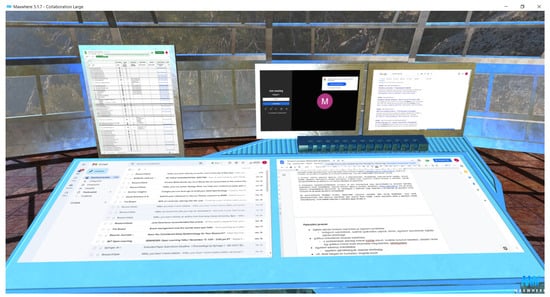
Figure 2.
Screenshot of the MaxWhere virtual reality. The five digital contents are displayed on the five smartboards of the virtual table. There is a spreadsheet on the upper left part of the workstation, then there is a smartboard for the online meeting, and next to it, there is a web browser. On the horizontal part of the table, the e-mail client and a shared document are displayed according to the users’ requirements.
4.1.3. Immersive VR—Immersed
As an immersive virtual reality, the Immersed VR [36], was chosen for this study. This virtual reality is available on the Meta Quest 2, Meta Quest Pro, and HTC Vibe Focus 3. This virtual reality offers private or collaborative virtual office solutions for its users. It can display up to five virtual monitors from the user’s computer. The snap grid contains five grouped screens. These can be flat or curved, based on user preference. Besides controllers, hand tracking is also included, which enables users to manipulate objects with hand gestures. Furthermore, other input peripheries such as a keyboard can be tracked, or for other types, a passthrough can be set, helping effective work. For collaborative work, multi-screen sharing is enabled alongside remote whiteboarding. The use of avatars helps to maintain a social presence.
4.2. General Workflow
In the present section, the general workflow is presented, which was used in the operation complexity analysis of the present study. This general workflow aims to represent some typical tasks of online collaborative working. Since the workflow order may vary from person to person, depending on previously established habits and information acquisition preferences [37]. For this reason, taking into account the personalized reordering of digital content, we included the operation of flipping two windows in the comparative analysis.
- 1.
- Positioning: Finding a position to have an optimal overview for the task.
- 2.
- Personalization: Swapping two program windows/displays.
- 3.
- Teamwork: online meeting, editing documents together.
- (a)
- Online meeting for discussing the tasks.
- (b)
- Making a note of what was discussed in the document.
- (c)
- Back-and-forth switching between spreadsheet and document.
- 4.
- E-mail: Sending an e-mail to an external person who is not involved in this project.
- 5.
- Browser:
- (a)
- Search for information.
- (b)
- Transfer information to the document.
- 6.
- Closing the interface.
4.3. HCI Analysis
The HCI analysis presented in this paper covers the comparison of objective metrics introduced in the definitions (Section 3.7, Section 3.8, Section 3.9, Section 3.10, Section 3.11, Section 3.12, Section 3.13, Section 3.14) and the comparison of skill-, rule- and knowledge-based operations on 2D and 3D interfaces. This threefold grouping of operations is based on Rasmussen’s model [18], but is updated and used for current interfaces in this paper. The original hierarchy of operator performance is here understood as a hierarchy of cognitive efficiency. Without being exhaustive, the basic operations were classified as follows: skill-based (click, mouse movement, hand raising, pointing, swipe), rule-based (finger touching, pinching, use of menus, icon usage, turn on/off head movement tracking, turn on/off hand movement tracking), and knowledge-based (moving, manipulating devices such as reordering and resizing monitors, juxtaposing windows, transferring contents). These three levels (skill-, rule- and knowledge-based operations), in this order, indicate the increasing amount of mental resources required by the human user for the operation of the given level. Accordingly, the analysis will include findings on how the different interfaces support the transition between these levels of operation.
4.4. Questionnaire on User Needs and Preferences
Beyond objective indicators, user requirements also influence the definition and selection of the optimal working environment. Therefore, a questionnaire survey was conducted with 52 participants to explore the basic HCI services and user needs. The questionnaire survey was designed to determine whether the HCI capabilities of digital work environments align with user expectations and whether the presence or absence of certain capabilities can influence users’ choice of software. The questions were designed to explore digital working habits, find out expectations about user interfaces and services, and gain insights into collaborative working experiences. The questionnaire survey was complemented by an in-depth interview to discuss user expectations in more detail. Written informed consent to participate in the study was provided by the participants.
Participant Recruitment
Participants were recruited from among full-time and part-time students of Electrical Engineering at the University of Pécs. Participants were volunteers. Consenting participants made assertions that they have no known neurological or psychiatric disorders. They declared that their vision and hearing are intact or corrected to normal. I have no dyslexia, dysgraphia, or other learning difficulties.
The participants were informed in detail about the research’s purpose, conditions, and background via e-mail. This detailed information was: “The aim of the study is to investigate the operational complexity of digital workflows based on human cognitive aspects. The task is to complete an online questionnaire. The test above has no adverse consequences. The test takes approximately 10 min. The study can be stopped at any time without consequences, in which case the data already recorded will not be evaluated”.
5. Results
This chapter presents the results of the three studies. Section 5.1 presents the results of the operations complexity study, Section 5.2 presents the results of the HCI analysis of the working environments included in the study, and Section 5.3 presents the results of the user feedback analysis.
5.1. Results of Operations Complexity Analysis
5.1.1. Operations in 2D Platform
- Positioning: Finding a position to have an optimal overview for the task.
- (a)
- Open online meeting—1 NBEO = 1.5 EO
- (b)
- Minimize down to taskbar—1 NBEO = 1.5 EO
- (c)
- Open the document—1 NBEO = 1.5 EO
- (d)
- Minimize down to taskbar—1 NBEO = 1.5 EO
- (e)
- Open e-mail client—1 NBEO = 1.5 EO
- (f)
- Minimize down to taskbar—1 NBEO = 1.5 EO
- (g)
- Open browser—1 NBEO = 1.5 EO
- (h)
- Minimize down to taskbar—1 NBEO = 1.5 EO
- (i)
- Open spreadsheet—1 NBEO = 1.5 EO
- Personalization: Swapping two program windows/displays.—1 OO = 5.5 EO
- Teamwork: online meeting, editing documents together.
- (a)
- Online meeting for discussing the tasks.
- i.
- Select online meeting to participate—1 NBEO = 1.5 EO
- (b)
- Making a note of what was discussed in the document.
- i.
- Alternating between document and online meeting—1 HAO = 5 EO
- (c)
- Back-and-forth switching between spreadsheet and document.
- i.
- Loading the document—1 NBEO = 1.5 EO
- ii.
- Loading the spreadsheet—1 NBEO = 1.5 EO
- E-mail: Sending an e-mail.—1 NBEO = 1.5 EO
- Browser:
- (a)
- Search for information.—1 NBEO = 1.5 EO
- (b)
- Transfer information to the document.—1 CO = 3 EO
- Closing the applications.—5 × 1 NBEO = 7.5 EO
Total: 42 EO
5.1.2. Operations in 3D Desktop VR Platform
Operations in MaxWhere desktop virtual reality.
- Positioning: Finding a position to have an optimal overview for the task.
- (a)
- Loading space by click on link.—1 NBEO = 1.5 EO
- (b)
- Positioning with mouse.—1 NBEO = 1.5 EO
- Personalization: Swapping two program windows/displays.
- (a)
- In MaxWhere version 5.1.7: reloading two content, no real window moving
- Smartboard selection by one click.—1 EO
- Copy browser address.—1 CO = 3 EO
- Click on other smartboard.—1 EO
- Paste browser address.—1 CO = 3 EO
- (b)
- In MaxWhere version 7.0.2: moving two smartboards
- Right mouse click to display menu.—1 EO
- Activate the editor interface by clicking on the icon.—1 NBEO = 1.5 EO
- Move the first window.—1 OO = 5.5 EO
- Click on the second window.—1 NBEO = 1.5 EO
- Move the second window to position.—1 OO = 5.5 EO
- Move the first window to position.—1 OO = 5.5 EO
- Close the menu.—1 NBEO = 1.5 EO
- Teamwork: online meeting, editing documents together.
- (a)
- Online meeting for discussing the tasks.
- i.
- Click to enter the meeting.—1 EO
- (b)
- Making a note of what was discussed in the document.
- i.
- Select the note.—1 HAO = 5 EO
- (c)
- Back-and-forth switching between spreadsheet and document.
- Loading the document—1 EO
- Loading the spreadsheet—1 EO
- E-mail: Sending an e-mail.
- (a)
- Click on e-mail window.—1 EO
- Browser:
- (a)
- Search for information.
- Double click for better visibility and activation.—1 EO
- (b)
- Transfer information to the document.
- Copy and paste the information to the document.—1 CO = 3 EO
- Click on fullsize button to return to the original position.—1 EO
- Closing the interface.—1 NBEO = 1.5 EO
Total in MaxWhere 5.1.7: 26.5 EO
Total in MaxWhere 7.0.2: 40.5 EO
5.1.3. Operations in Immersed VR Platform
- Positioning: Finding a position to have an optimal overview for the task.
- (a)
- Opening VR space.—1 NBEO = 1.5 EO
- (b)
- Switch on VR headset.—1 NBEO = 1.5 EO
- (c)
- Enable head tracking (unlock screen).
- Raising the left hand.—1 EO
- Button press.—1 NBEO = 1.5 EO
- (d)
- Enable hand tracking: pinch ring finger and thumb together—1 EO
- Personalization: Swapping two program windows/displays.
- By default, the monitors are grouped together in a snap grid.
- (a)
- Ungroup the monitors.—1 EO
- (b)
- Grab the selected monitor (pointing to the monitor by touching index finger and thumb together), and move/navigate with fingers together - move the arm out of “snap gird” and move to the new position.—1 CO = 3 EO
- (c)
- Select the second monitor and mot to a new position. 1 CO = 3 EO
- (d)
- Lock the screen.—1 EO
- Teamwork: online meeting, editing documents together.
- (a)
- Online meeting for discussing the tasks.
- Click to enter the meeting.—1 EO
- (b)
- Making a note of what was discussed in the document.
- Select the note.—1 HAO = 5 EO
- (c)
- Back-and-forth switching between spreadsheet and document.
- Loading the document—1 EO
- Loading the spreadsheet—1 EO
- E-mail: Sending an e-mail.
- (a)
- Click on e-mail window.—1 EO
- Browser:
- (a)
- Search for information.
- Double click for better visibility and activation.—1 EO
- (b)
- Transfer information to the document.—1 CO = 3 EO
- Closing the interface.—1 NBEO = 1.5 EO
Total: 29 EO
The number of elementary operations required to execute a workflow in different systems are summarized in the following figure.
5.2. Results of HCI Analysis
The HCI analysis was performed based on the objective metrics introduced in the definitions (Section 3.7, Section 3.8, Section 3.9, Section 3.10, Section 3.11, Section 3.12, Section 3.13 and Section 3.14). The results of the comparison in terms of information availability, information access cost, information validity, confusing information content, personalized workflow order ability, personalized information overview, task execution tools, and degree of interaction, are presented in Table 1.

Table 1.
HCI analysis results based on the definitions presented in Section 3.7, Section 3.8, Section 3.9, Section 3.10, Section 3.11, Section 3.12, Section 3.13 and Section 3.14.
We measured two versions of the desktop virtual reality. The previously used icons were changed to the menu in the later version. The information access cost (IAC) differs as the interface of the two desktop VR is different.
In the case of Immersed VR, the figure related to the information validity (IV) and CIC (confused information content) analysis shows that system information is also displayed in the two smaller menus in addition to the content windows (Figure 3). This system information is not directly related to the task solution, and is also redundant and therefore reduces the value of IV.
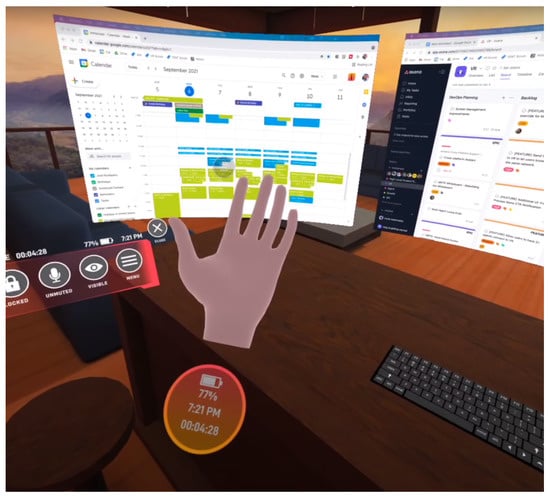
Figure 3.
Different screens and menus in the immersed virtual reality. A small menu on the wrist shows the time and charge, and the same information is also shown in the menu on the left side of the picture. This additional information is useful for using the system, but has no direct role in the work. For this reason, the Information Validity (IV) value is lower in the analysis.
Figure 4 presents the number of elementary operations required to execute a workflow, and also it shows the information access cost for each of the measured systems.
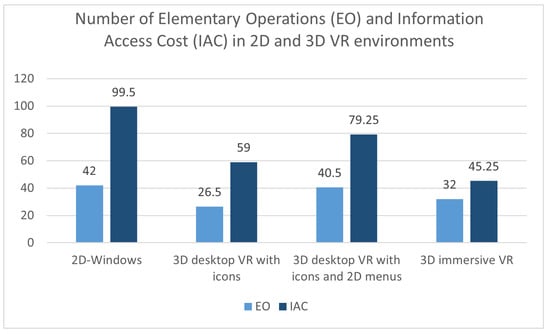
Figure 4.
Diagram presenting the number of Elementary Operations (EO) and Information Access Costs (IAC) in the analyzed productivity systems.
5.3. User Feedback Analysis
The online questionnaire was completed by 52 people (32 males, 17 females, and 2 non-respondents). One person’s answers could not be evaluated because of an error in using the 10-point Likert scale. Thirty-four participants belong to Generation Z (mean age: 20.82, SD: 2.22), 17 to older generations (mean age: 38.5, SD: 11.1). Almost half of the respondents have used some form of virtual reality before. The detailed proportion of VR users is shown in Figure 5.
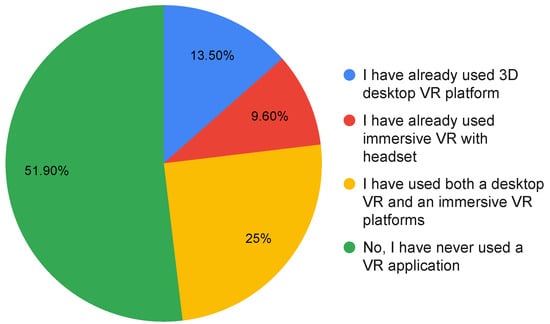
Figure 5.
Proportion of the respondents previous experiences with VR systems either desktop or immersive.
No significant difference was found for either gender or age group responses. However, 33 percent of Generation Z students and 77 percent of older generation students have used a VR application. This proportion is because the majority of students in correspondence courses work in IT or engineering. The average number of digital contents that respondents were comfortable using was four. On average, respondents said they could work comfortably with five people on an online task. Nearly three-quarters of users (73.1%) preferred graphical menu interfaces to text menus.
The following order of importance for user interface features was identified by respondents (Figure 6). Scores were given by participants completing a 10-point Likert scale. One means not at all important, and ten means totally important. In terms of user requirements for digital working environments, the most important aspects are information overview (Mean: 9.31, SD: 1.104) and ease of use (Mean: 9.31, SD: 1.157). The direct accessibility of the information to perform tasks is also the decisive factor in the choice of the working environment. At the same time, respondents are concerned about the support of artificial intelligence, so this service is at the bottom of the list.
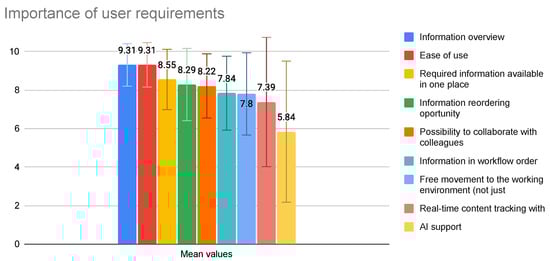
Figure 6.
Importance of user requirements.
Regarding the requirement to have the necessary information at their disposal, users highlighted that this is useful for them when they find the information in the workspace ready to use. They found the loading and start-up time annoying, making it 2 to 3 times more tedious than normal work. Therefore, the cognitive load mapping of HDO operations was adopted as 2.5.
6. Discussion
Today’s digital paradigm shift has resulted in the co-existence of traditional 2D graphical working platforms and 3D workspaces. Users still stick to traditional 2D digital working, due to habit or cost factors, but are increasingly recognizing the potential of 3D. The VR applications presented in this article aim to meet this user demand in this “transition” phase. Both the chosen desktop and immersive VR platforms can integrate traditional 2D office digital interfaces. The present study compared the execution of a general workflow in three different systems.
A typical 2D Windows interface is based on overlapping windows and contains 2D graphical icons and textual menus. Most commonly, these are used with a physical keyboard, mouse, touchpad, or even touchscreen. The basic movements and selections require following specific rules, but decades of use have developed a skill-based usage. In the early days, when 2D interfaces and icons first appeared, the use of the mouse, for example, had to be taught in separate lessons, but now it is a natural part of everyday life, requiring no special training, just as the swipe on a touch screen or touchpad is now a skill. The personalization and organization of the user interface requires knowledge-based operation execution, which is even more cognitively demanding for users than rule-based operations.
Desktop virtual reality is the transition between 2D computer interfaces and immersive VR. In a 3D environment displayed on simple monitors, browser-based windows appear in fixed locations. In most cases, they can be used with a physical keyboard, mouse, touchpad, or touch screen. Moreover, hand-tracking input is also available in some cases, allowing a much more natural gesture control. In this example of the MaxWhere desktop VR application [35], the so-called cognitive navigation technology [38] supports context-based navigation and manipulation in 3D space, but hand-tracking and gesture control are not available.
The navigation and manipulation operations in immersive VR systems are adapted to perform actions that we often use in our daily lives, such as moving our head, raising our hands, grasping, and walking. Therefore, the skill-level operations that come from natural behavior greatly reduce the cognitive load and enable a rapid transition from rule-based to skill-based execution of user actions. To predict the effectiveness of workflows in different digital environments, the authors identified key factors. The metrics introduced in this paper include weighting due to cognitive load.
In light of the results of the study, the following conclusions can be drawn: The Task Execution Tools (TET) value shows that, while traditional 2D systems and 3D desktop VR applications require only one IT device (PC, laptop, tablet) to operate, the use of immersive VR applications requires additional devices (headset, hand tracking, etc.), which is a major cost driver. The user experience is strongly influenced by the number of interaction possibilities, which for both types of 3D VR solutions is 2.25 times higher than the 2D platform.
In terms of user cognitive load, information availability provides feedback on the speed and ease of access to information, which is 100 percent only in 3D systems (desktop VR and immersive VR). Two-dimensional operating systems perform poorly in this category, only being able to provide access to one digital content with a maximum of 1.5 elementary operations. This higher score of information availability helps the users to manipulate the information more directly, and allows them to stay in their reasoning process, that is a requirement of a well-designed interface according to [34]. Although, the results of the questionnaire survey show that one of the strongest user demands for digital environments is the ease of use.
Another revealed user preference is the requirement for information overview. This result is in line with a previous study, that showed a similar tendency of users to have an overview of an entire display [32]. Unlike traditional 2D systems, both types of 3D VR applications provided 100 percent of the information users need. We examined the ratio of Valid to Confuse information regarding the actual workflow. In terms of workflow, the Desktop VR application included in the study gives the best result: 100 percent of Valid information. The immersive VR application displays some information about the system (charge, time), which is considered to be confusing information as it is not directly related to the workflow. This confusing information is a burden on the users’ divided attention or they have to be excluded by an inhibiting cognitive function during task execution. There are many possibilities in virtual realities, although the realization of all these possibilities may be disadvantageous, as human users may be distracted. While well-designed content in 3D (2D applications, 3D objects, digital twins, etc.) can greatly support understanding, in productivity systems, maintaining the balance between focused task completion and the right amount of immersive features has a crucial role. The present research focused on the necessary user operations in a strictly objective manner. In the future, the following studies should explore human behavior during a similar workflow. An eye-tracking study could reveal additional significant details about user behavior, particularly about attentional processes and cognitive load. However, when designing interfaces, knowledge of user behavior and usage patterns is of paramount importance.
A comparison of the number of elementary operations in each system is a good indicator of user workload. In this respect, 3D desktop VR with icons requires 37 percent fewer elementary operations; and immersive VR 31 percent fewer elementary operations than 2D systems. This result corresponds with the previous findings on the difference between elementary operations in 3D and 2D interfaces [26]. It should be noted here, however, that in the desktop VR with the icons-only version, no actual rearrangement of the working environment was possible. Only fixed monitors could be used to swap the originally loaded 2D digital content. This is a fundamentally different operation. However, it is also observable that the number of elementary operations increases when 2D menus are used in addition to graphical menus in the same 3D desktop VR system. In this case, only four percent fewer elementary operations are required for the 3D VR space than for a traditional 2D system using mainly menus. Based on the above, it can be concluded that using 2D (text-based) menus as an HCI tool imposes a depressing workload on the user.
The survey also suggests that, in the case of graphical icons, the use of buttons with irregular borders—whose size, color, and location—helps users to navigate and recall the operation from memory. Icons with irregularly shaped icons of different colors are more effective HCI tools than menu buttons of the same color, regular shape, or text menus, which are significantly more cognitively demanding.
It is not enough to base decisions on the number of elementary operations alone to predict the workflow performance of each system. It is also essential to pay attention to the information access cost, as this indicator includes the time required for each operation. The information access cost value also indicates the ability of the HCI to operate easily in the given work environment. The time requirement of the operations is also an indication of the skill-rule or knowledge-based nature of the task since the lowest information access cost is always associated with skill-level operations. Skill-level execution does not require long thinking time, so it is considered to be the operation with the lowest cognitive load among the three types. From the information access cost values obtained in this study, it can be seen that currently, immersive 3D VR provides the best user support. Compared to 2D systems, there is an improvement of 54.6 percent. In second place is the desktop VR solution using icons, again showing a significant improvement of 41 percent compared to Windows. However, the use of menus has also been shown to degrade the capabilities of 3D VR in this metric, with a 20.8 percent lowering compared to the HCI interface using icons only.
It should be noted that the population included in the survey can be expanded in number and age. The study has a robust professional focus because all participants are electrical engineering students, so their basic knowledge of computer science is of high quality, so the population included in the research can affect the results obtained from a study, mainly the user preferences study.
7. Conclusions
The purpose of the paper is to investigate the Operational Complexity of Digital Workflows in the light of human cognitive load. The study is based on a system-level comparative analysis of human–computer interactions in 2D versus 3D digital environments, focusing on human behavior in different environments and interfaces. A new methodology, metrics, and definitions were presented that evaluated the interfaces under study based on the number and complexity of user operations in different digital environments. The objective measurement was supplemented by an empirical, explorative questionnaire survey. Fifty-two volunteers participated in the questionnaire survey. The conclusions were based on data analysis and statistical analysis. The results demonstrate that in a 3D immersive virtual work environment, users perform 31 percent fewer elementary operations. The information access cost is 54 percent less in immersive VR than in classical 2D Windows systems. In the case of desktop VR with icons, the number of elementary operations was 37 percent, and the IAC was 41 percent less than in the 2D operation system. In the menu plus icon-based desktop VR, these values were four and twenty-one percent lower, respectively, compared to the 2D operation system. The difference in the results of the desktop VR systems included in the study can be attributed to differences in the HCI used—pure graphical icons versus 2D menu and icons together—and differences in the applications.
As an extension of this research, the authors intend to conduct a more detailed study in the future with a wider age range and a wider range of several professional users. Future research will also extend the analysis to some industrial operations such as design, assembly, or inspection, as these operations are now often supported by 3D visualization AR applications in addition to 2D paper-based aids.
Author Contributions
Conceptualization, I.H. and B.B.; methodology, I.H.; formal analysis, I.H.; investigation, I.H.; resources, I.H.; data curation, I.H.; writing—original draft preparation, I.H. and B.B.; writing—review and editing, I.H. and B.B.; visualization, I.H. and B.B. All authors have read and agreed to the published version of the manuscript.
Funding
This research received no external funding.
Data Availability Statement
Not applicable.
Acknowledgments
The research presented in this paper was supported by the ELKH-SZE Research Group for Cognitive Mapping of Decision Support Systems.
Conflicts of Interest
The authors declare no conflict of interest.
Abbreviations
The following abbreviations are used in this manuscript:
| EO | Elementary operation |
| CO | Complex operation |
| NBEO | Navigation-based elementary operation |
| OO | Ordering operations |
| HDO | High distraction operations |
| HAO | High alternation operations |
| IA | Information availability |
| IAC | Information access cost |
| IV | Information Validity |
| CIC | Confuse information content |
| PWO | Personalized workflow order ability |
| PIO | Personalized information overview |
| TET | Task execution tools |
| DI | Degree of interaction |
References
- Lanier, J.; Biocca, F. An insider’s view of the future of virtual reality. J. Commun. 1992, 42, 150–172. [Google Scholar] [CrossRef]
- Wohlgenannt, I.; Simons, A.; Stieglitz, S. Virtual Reality. Bus. Inf. Syst. Eng. 2020, 62, 455–461. [Google Scholar] [CrossRef]
- Horváth, I.; Csapó, Á.B.; Berki, B.; Sudár, A.; Baranyi, P. Definition, Background and Research Perspectives Behind ‘Cognitive Aspects of Virtual Reality’ (cVR). Infocommun. J. 2022, 14, 10–16. [Google Scholar]
- Aschenbrenner, D.; Leutert, F.; Çençen, A.; Verlinden, J.; Schilling, K.; Latoschik, M.; Lukosch, S. Comparing Human Factors for Augmented Reality Supported Single-User and Collaborative Repair Operations of Industrial Robots. Front. Robot. AI 2019, 6, 37. [Google Scholar] [CrossRef] [PubMed]
- Obermair, F.; Althaler, J.; Seiler, U.; Zeilinger, P.; Lechner, A.; Pfaffeneder, L.; Richter, M.; Wolfartsberger, J. Maintenance with Augmented Reality Remote Support in Comparison to Paper-Based Instructions: Experiment and Analysis. In Proceedings of the 2020 IEEE 7th International Conference on Industrial Engineering and Applications (ICIEA), Bangkok, Thailand, 16–21 April 2020; IEEE: Piscataway, NJ, USA, 2020. [Google Scholar] [CrossRef]
- Botella, C.; Riva, G.; Gaggioli, A.; Wiederhold, B.K.; Alcaniz, M.; Baños, R.M. The Present and Future of Positive Technologies. Cyberpsychol. Behav. Soc. Netw. 2012, 15, 78–84. [Google Scholar] [CrossRef]
- Won, A.S.; Bailenson, J.; Lee, J.; Lanier, J. Homuncular Flexibility in Virtual Reality. J. Comput.-Mediat. Commun. 2015, 20, 241–259. [Google Scholar] [CrossRef]
- Cognitive Load. Available online: https://dictionary.apa.org/cognitive-load (accessed on 28 November 2022).
- Baranyi, P.; Csapo, A. Definition and synergies of cognitive infocommunications. Acta Polytech. Hung. 2012, 9, 67–83. [Google Scholar]
- Baranyi, P.; Csapo, A.; Sallai, G. Cognitive Infocommunications (CogInfoCom); Springer International Publishing: Cham, Switzerland, 2015. [Google Scholar] [CrossRef]
- Li, J.R.; Khoo, L.P.; Tor, S.B. Desktop virtual reality for maintenance training: An object oriented prototype system (V-REALISM). Comput. Ind. 2003, 52, 109–125. [Google Scholar] [CrossRef]
- American Psychological Association. Affordance. Available online: https://dictionary.apa.org/affordance (accessed on 26 November 2022).
- Torok, A. From human-computer interaction to cognitive infocommunications: A cognitive science perspective. In Proceedings of the 2016 7th IEEE International Conference on Cognitive Infocommunications (CogInfoCom), Wroclaw, Poland, 16–18 October 2016; IEEE: Piscataway, NJ, USA, 2016; pp. 433–438. [Google Scholar] [CrossRef]
- Bhargava, A.; Lucaites, K.M.; Hartman, L.S.; Solini, H.; Bertrand, J.W.; Robb, A.C.; Pagano, C.C.; Babu, S.V. Revisiting affordance perception in contemporary virtual reality. Virtual Real. 2020, 24, 713–724. [Google Scholar] [CrossRef]
- Felton, W.M.; Jackson, R.E. Presence: A Review. Int. J. Hum.—Comput. Interact. 2021, 38, 1–18. [Google Scholar] [CrossRef]
- Cekuls, A. The Impact of Complexity to Collaboration and Ability of Businesses to Share Information Across Teams. In Proceedings of the 21st International Multidisciplinary Scientific GeoConference SGEM 2021, Albena, Bulgaria, 16–22 August 2021; STEF92 Technology: Sofia, Bulgaria, 2021. [Google Scholar] [CrossRef]
- Li, K.; Wieringa, P. Structured Operation Environment And Perceived Complexity In Human Supervisory Control. Asian J. Control 2001, 3, 181–189. [Google Scholar] [CrossRef]
- Rasmussen, J. Skills, rules, and knowledge; signals, signs, and symbols, and other distinctions in human performance models. IEEE Trans. Syst. Man Cybern. 1983, SMC-13, 257–266. [Google Scholar] [CrossRef]
- Chai, T.; Qin, S.J.; Wang, H. Optimal operational control for complex industrial processes. Annu. Rev. Control 2014, 38, 81–92. [Google Scholar] [CrossRef]
- Adetola, V.; Guay, M. Integration of real-time optimization and model predictive control. J. Process. Control 2010, 20, 125–133. [Google Scholar] [CrossRef]
- Alvarez, L.; Odloak, D. Robust integration of real time optimization with linear model predictive control. Comput. Chem. Eng. 2010, 34, 1937–1944. [Google Scholar] [CrossRef]
- Darby, M.; Nikolaou, M.; Jones, J.; Nicholson, D. RTO: An overview and assessment of current practice. J. Process. Control 2011, 21, 874–884. [Google Scholar] [CrossRef]
- Adriaensen, A.; Decré, W.; Pintelon, L. Can Complexity-Thinking Methods Contribute to Improving Occupational Safety in Industry 4.0? A Review of Safety Analysis Methods and Their Concepts. Safety 2019, 5, 65. [Google Scholar] [CrossRef]
- Zhang, Y.; Li, Z.; Wu, B.; Wu, S. A spaceflight operation complexity measure and its experimental validation. Int. J. Ind. Ergon. 2009, 39, 756–765. [Google Scholar] [CrossRef]
- Fritzsche, L.; Jendrusch, R.; Leidholdt, W.; Bauer, S.; Jäckel, T.; Pirger, A. Introducing ema (Editor for Manual Work Activities)—A New Tool for Enhancing Accuracy and Efficiency of Human Simulations in Digital Production Planning. In Digital Human Modeling; Springer: Berlin/Heidelberg, Germany, 2011; pp. 272–281. [Google Scholar] [CrossRef]
- Horváth, I.; Sudár, A. Factors contributing to the enhanced performance of the MaxWhere 3D VR platform in the distribution of digital information. Acta Polytech. Hung. 2018, 15, 149–173. [Google Scholar] [CrossRef]
- Kocsis, D. A conceptual foundation of design and implementation research in accounting information systems. Int. J. Account. Inf. Syst. 2019, 34, 100420. [Google Scholar] [CrossRef]
- Card, S.K.; Moran, T.P.; Newell, A. The Psychology of Human-Computer Interaction; CRC Press: Boca Raton, FL, USA, 1983. [Google Scholar] [CrossRef]
- Shneiderman, B.; Plaisant, C.; Cohen, M.; Jacobs, S.; Elmqvist, N. Designing the User Interface Strategies for Effective Human-Computer Interaction; Pearson Higher Education & Professional Group: New York City, NY, USA, 2017; p. 624. [Google Scholar]
- Card, S.; Henderson, D.A., Jr. A multiple, virtual-workspace interface to support user task switching. In Proceedings of the CHI’87 Human Factors in Computing Systems Conference, Toronto, ON, Canada, 5–9 April 1987; ACM Press: New York, NY, USA, 1987. [Google Scholar] [CrossRef]
- Henderson, D.A., Jr.; Card, S. Rooms: The use of multiple virtual workspaces to reduce space contention in a window-based graphical user interface. ACM Trans. Graph. 1986, 5, 211–243. [Google Scholar] [CrossRef]
- Endert, A.; Bradel, L.; Zeitz, J.; Andrews, C.; North, C. Designing large high-resolution display workspaces. In Proceedings of the International Working Conference on Advanced Visual Interfaces—AVI’12, Capri Island, Italy, 21–25 May 2012; ACM Press: New York, NY, USA, 2012; pp. 58–65. [Google Scholar] [CrossRef]
- Spellman, P.J.; Mosier, J.N.; Deus, L.M.; Carlson, J.A. Collaborative Virtual Workspace. In Proceedings of the International ACM SIGGROUP Conference on Supporting Group Work: The Integration Challenge the Integration Challenge—GROUP ’97, Phoenix, AZ, USA, 16–19 November 1997; ACM Press: New York, NY, USA, 1997; pp. 197–203. [Google Scholar] [CrossRef]
- Green, T.M.; Ribarsky, W.; Fisher, B. Building and Applying a Human Cognition Model for Visual Analytics. Inf. Vis. 2009, 8, 1–13. [Google Scholar] [CrossRef]
- MaxWhere. Available online: https://www.maxwhere.com/ (accessed on 29 November 2022).
- Immersed. Available online: https://immersed.com/ (accessed on 26 November 2022).
- Horváth, I. An Analysis of Personalized Learning Opportunities in 3D VR. Front. Comput. Sci. 2021, 3, 673826. [Google Scholar] [CrossRef]
- Baranyi, P.; Galambos, P.; Csapó, Á.; Jaloveczki, L. Cognitive Navigation and Manipulation (CogiNav) Method. U.S. Patent 2018/0032128 A1, 1 February 2018. [Google Scholar]


Disclaimer/Publisher’s Note: The statements, opinions and data contained in all publications are solely those of the individual author(s) and contributor(s) and not of MDPI and/or the editor(s). MDPI and/or the editor(s) disclaim responsibility for any injury to people or property resulting from any ideas, methods, instructions or products referred to in the content. |
© 2023 by the authors. Licensee MDPI, Basel, Switzerland. This article is an open access article distributed under the terms and conditions of the Creative Commons Attribution (CC BY) license (https://creativecommons.org/licenses/by/4.0/).