Article

Radar Signal Recognition Based on Bagging SVM

School of Information Engineering, China Jiliang University, Hangzhou 310018, China
*
Author to whom correspondence should be addressed.
Electronics 2023, 12(24), 4981; https://doi.org/10.3390/electronics12244981
Submission received: 10 November 2023 / Revised: 2 December 2023 / Accepted: 10 December 2023 / Published: 12 December 2023

Abstract

:
Radar signal recognition under low signal-to-noise ratio (SNR) conditions is a critical issue in modern electronic reconnaissance systems, which face significant challenges in recognition accuracy due to signal diversity. A novel method for radar signal detection based on the bagging support vector machine (SVM) is proposed in this paper.This method firstly utilizes the Choi–Williams distribution (CWD) and the smooth pseudo Wigner-Ville distribution (SPWVD) to obtain different time–frequency images of radar signals, which effectively leverages CWD’s strong time–frequency aggregation and SPWVD’s robust cross-interference resistance. Moreover, histograms of oriented gradient (HOG) features are extracted from time–frequency images to train multiple SVM classifiers by bootstrap sampling. Finally, the performance of each SVM classifier is aggregated using plurality voting to reduce the risk of model overfitting and improve recognition accuracy. We evaluate the effectiveness of the proposed method using 12 different types of radar signals. The experimental results demonstrate that its overall identification rate reaches around 79% at an SNR of −10 dB, and it improves the recognition rate by 5% compared with a single classifier.

1. Introduction

Radar signal modulation recognition is a critical component of electronic warfare [1]. The electromagnetic environment has become increasingly complicated in recent years due to the rapid growth of electronic technology, with diverse electromagnetic signals interweaving across the spectrum [2]. In this complex electromagnetic environment, traditional radar systems face significant challenges and are unable to meet the requirements of modern electronic reconnaissance. To adapt to the complex modern electromagnetic environment, exploring radar signal recognition techniques with high identification rates and strong robustness is crucial for enhancing the perception and recognition capabilities of radar systems [3].
Radar signal recognition traditionally relied on identifying the carrier frequency, pulse width, pulse amplitude, direction of arrival, and time of arrival of radar signals [4,5]. However, traditional methods are no longer capable of addressing the needs of current electronic warfare due to the variety and complexity of radar signal modulation. Consequently, there has been growing focus on analyzing the intra-pulse characteristics of radar signals [6,7,8]. Guo et al. [9] employed a Cascade of Short Time Fourier Transform (STFT) and a naive Bayesian model to differentiate radar signals exhibiting various frequency or phase modulation techniques. Yang et al. [10] proposed a KNN-based recognition system for electromagnetic signals that uses typical parameter matching and a KNN classifier to determine the signal modulation type. Guo et al. [11] proposed a radar signal recognition method for low probability of intercept (LPI) signals based on a stacked autoencoder combined with support vector machines (SVMs). Li et al. [12] extracted textural features from the Choi–Williams distribution (CWD) and the ambiguity function using the gray-level co-occurrence matrix (GLCM), and then applied them to the SVM for recognition. Quan et al. [13] proposed a radar signal recognition algorithm based on multiple simultaneous compression (MSST) time–frequency transform and histogram of orientation gradient (HOG) features.
Deep learning has made amazing advances in recent years and has found widespread applications in the field of signal processing [14,15]. Compared with traditional machine learning methods, deep learning offers several advantages, including automatic feature extraction and the capacity to handle large-scale data processing [16]. For example, Marta et al. [17] used continuous wavelet transform (CWT) to extract transient information about the amplitude, frequency, and phase shift of modulated signals and employed a convolutional neural network (CNN) to achieve signal classification. For the modulation recognition problem of LPI radar signals, Cheng et al. [18] extracted time–frequency information using the AlexNet neural network and proposed a modulation recognition algorithm based on SVM. Thien et al. [19] proposed LPI-Net, a deep CNN that utilizes multiple cascade processing modules for learning highly discriminative features across multiple scales for recognizing signals, improving feature diversity, and minimizing the vanishing gradient issue. Si et al. [20] proposed a novel multi-class learning framework to identify eight types of randomly overlapping dual-component radar signals based on a deep convolutional neural network.
While deep-learning-based methods often show higher recognition accuracy in signal recognition tasks compared with traditional machine learning methods, they require a large amount of prior data for training and have high requirements for storage and computing resources. These resource-intensive demands can hinder its application in resource-constrained environments. Therefore, traditional machine learning methods show some advantages in these scenarios if they can achieve a competitive performance in radar signal recognition. In this paper, we propose a radar signal recognition method based on bagging SVM. The proposed method uses the bagging ensemble learning strategy to fuse the two time-frequency analysis features of CWD and the smooth pseudo Wigner–Ville distribution (SPWVD). The method involves an ensemble learning model with SVM as the base classifier, which alleviates the problems of a low generalization performance and large bias error of individual classifiers, and improves the recognition accuracy of radar signals. The following are the primary contributions of this work:
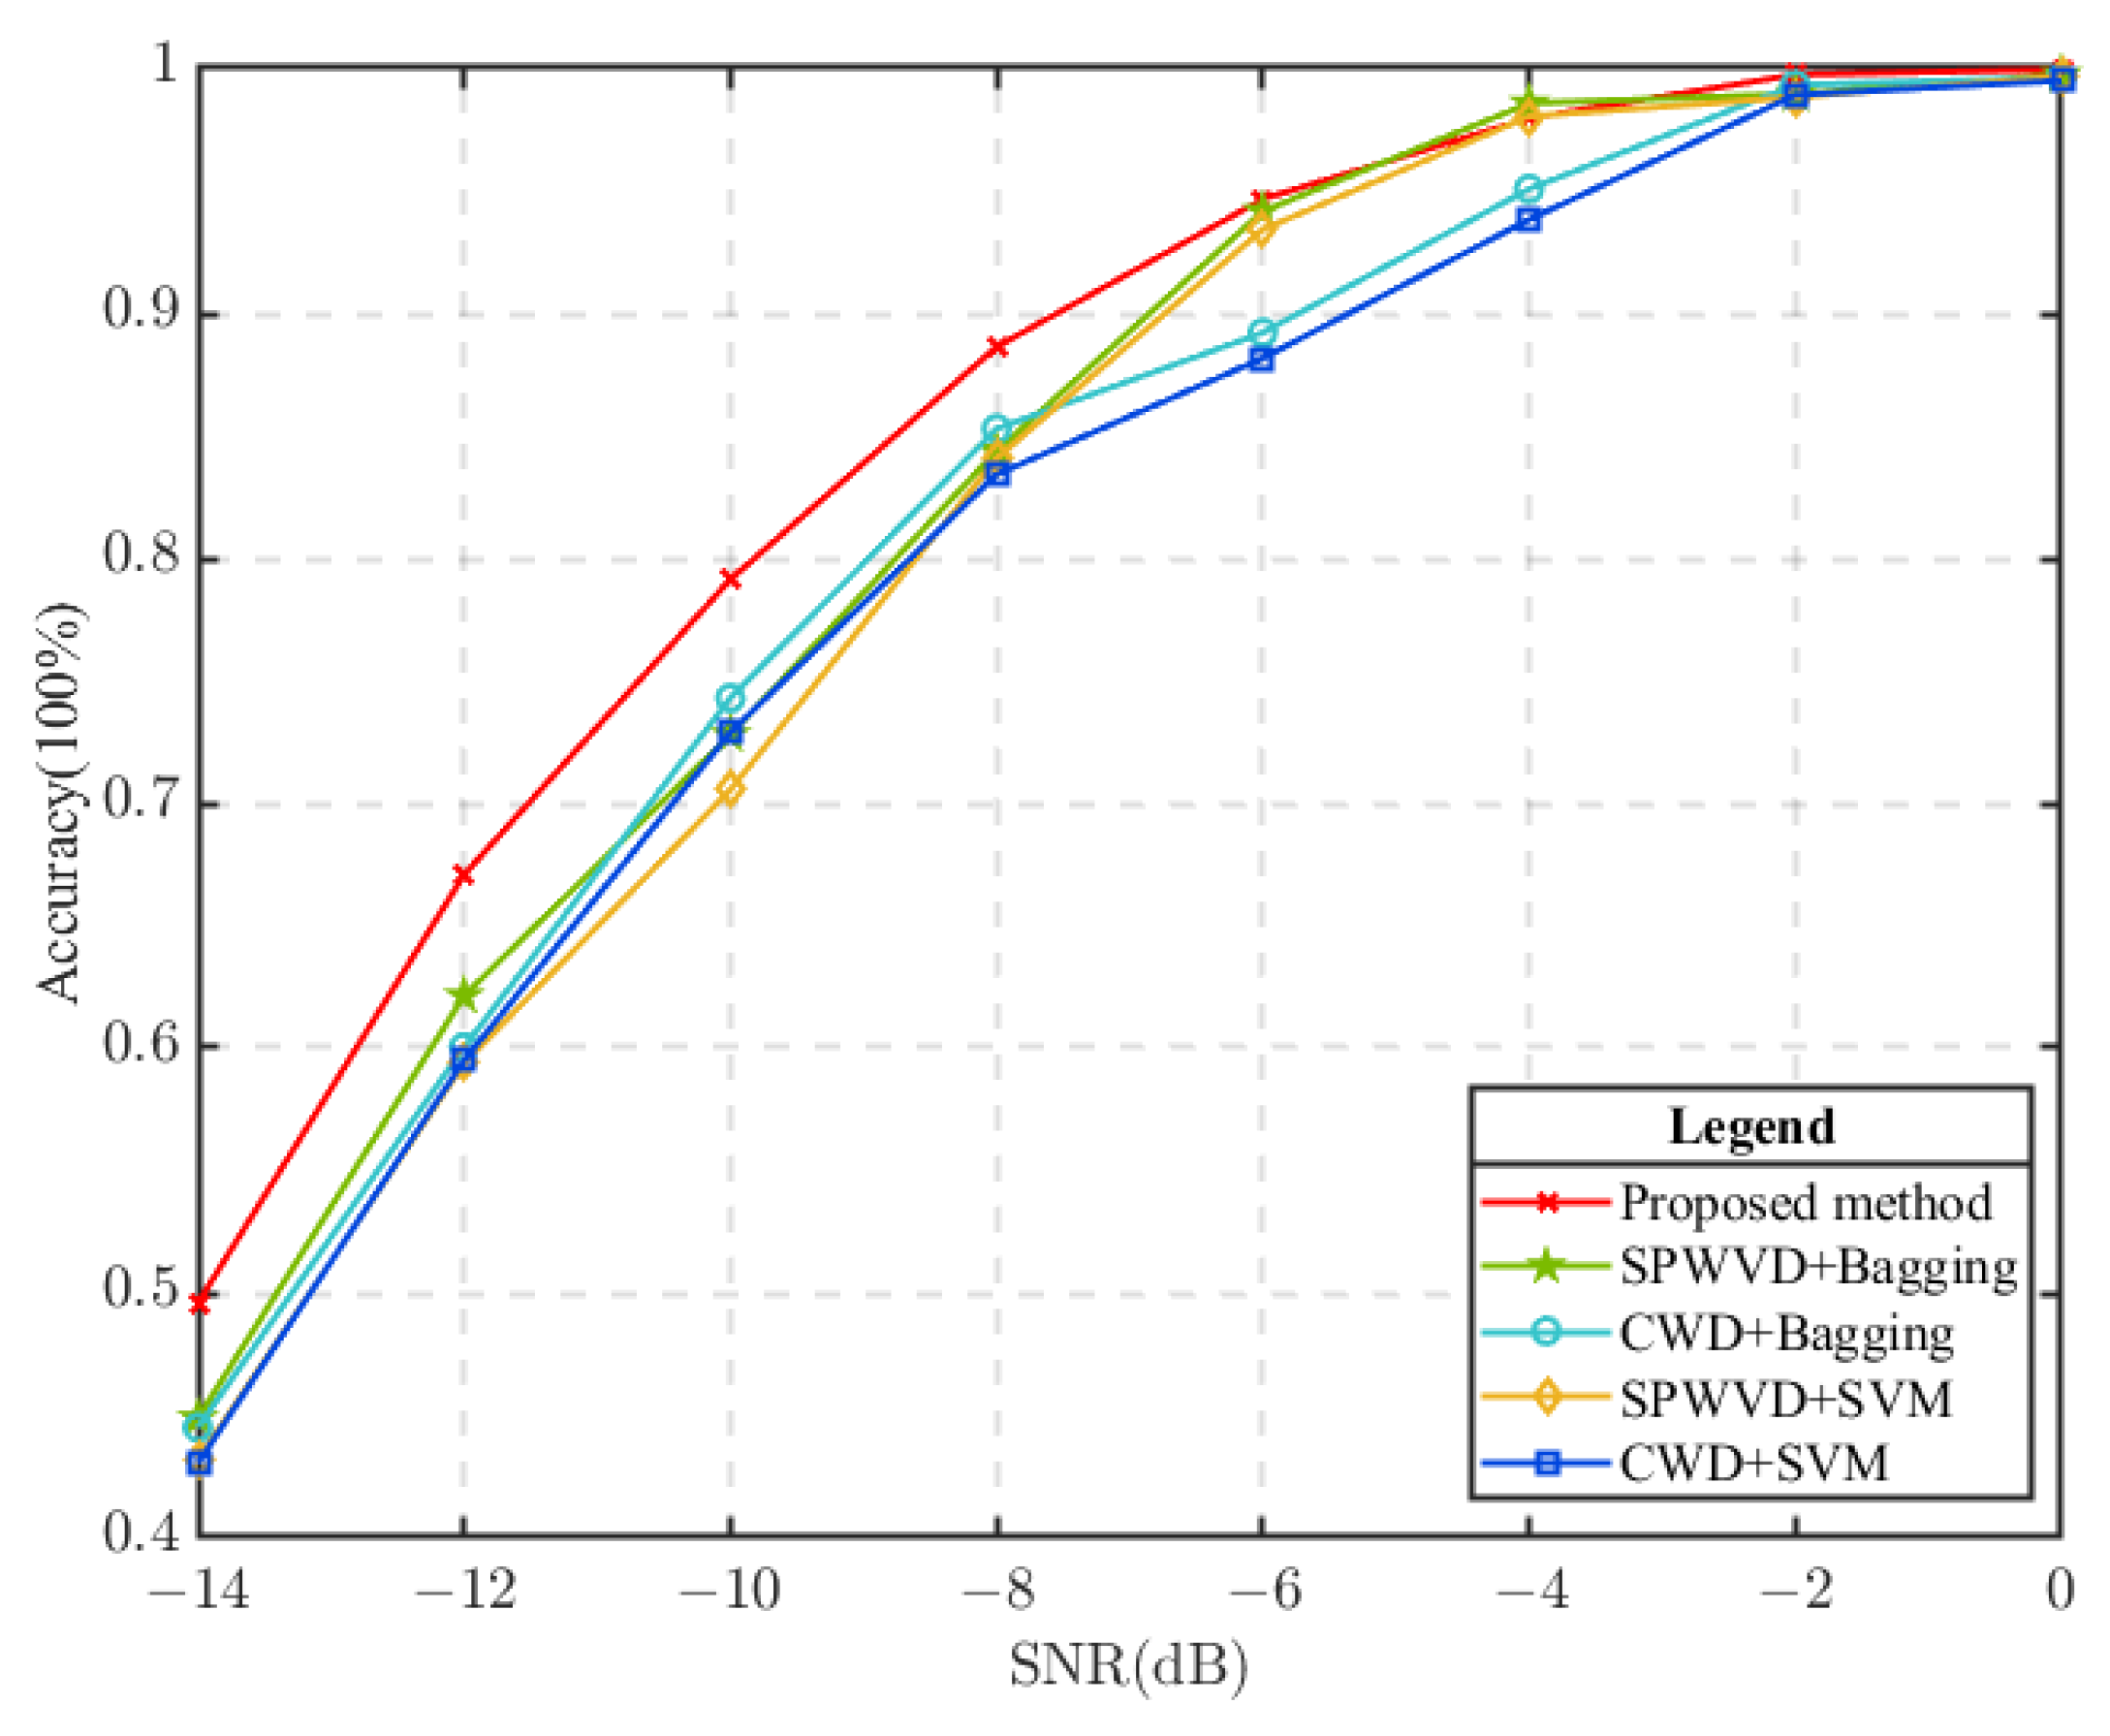
  • We present a new method for radar signal recognition by exploiting bagging SVMs, which improves the predictive performance of a single classifier and achieves a higher overall accuracy;
  • The high time–frequency aggregation of CWD and the crosstalk resistance of SPWVD are combined to effectively improve the accuracy and robustness of the radar signal recognition;
  • Extensive experiments on 12 types of radar signals demonstrate the proposed method significantly outperforms other traditional methods and achieves competitive recognition accuracy over several deep learning methods.
The rest of this paper is organized as follows. Section 2 introduces the proposed method. In Section 3, we present extensive experiments to verify the effectiveness of the proposed method. Section 4 provides the related conclusions.

2. The Proposed Method

In this section, we present our approach for radar signal recognition based on bagging SVM. The proposed method is composed of three major components: time–frequency transformation, feature extraction, and radar signal recognition. We first converted the radar signals into radar time–frequency images using two time–frequency transforms, CWD and SPWVD. Then, we utilized the HOG feature extractor to capture feature information from the preprocessed time–frequency images. Finally, we designed a bagging SVM model to perform signal recognition tasks based on the extracted HOG features. The overall architecture of the proposed method is shown in Figure 1.

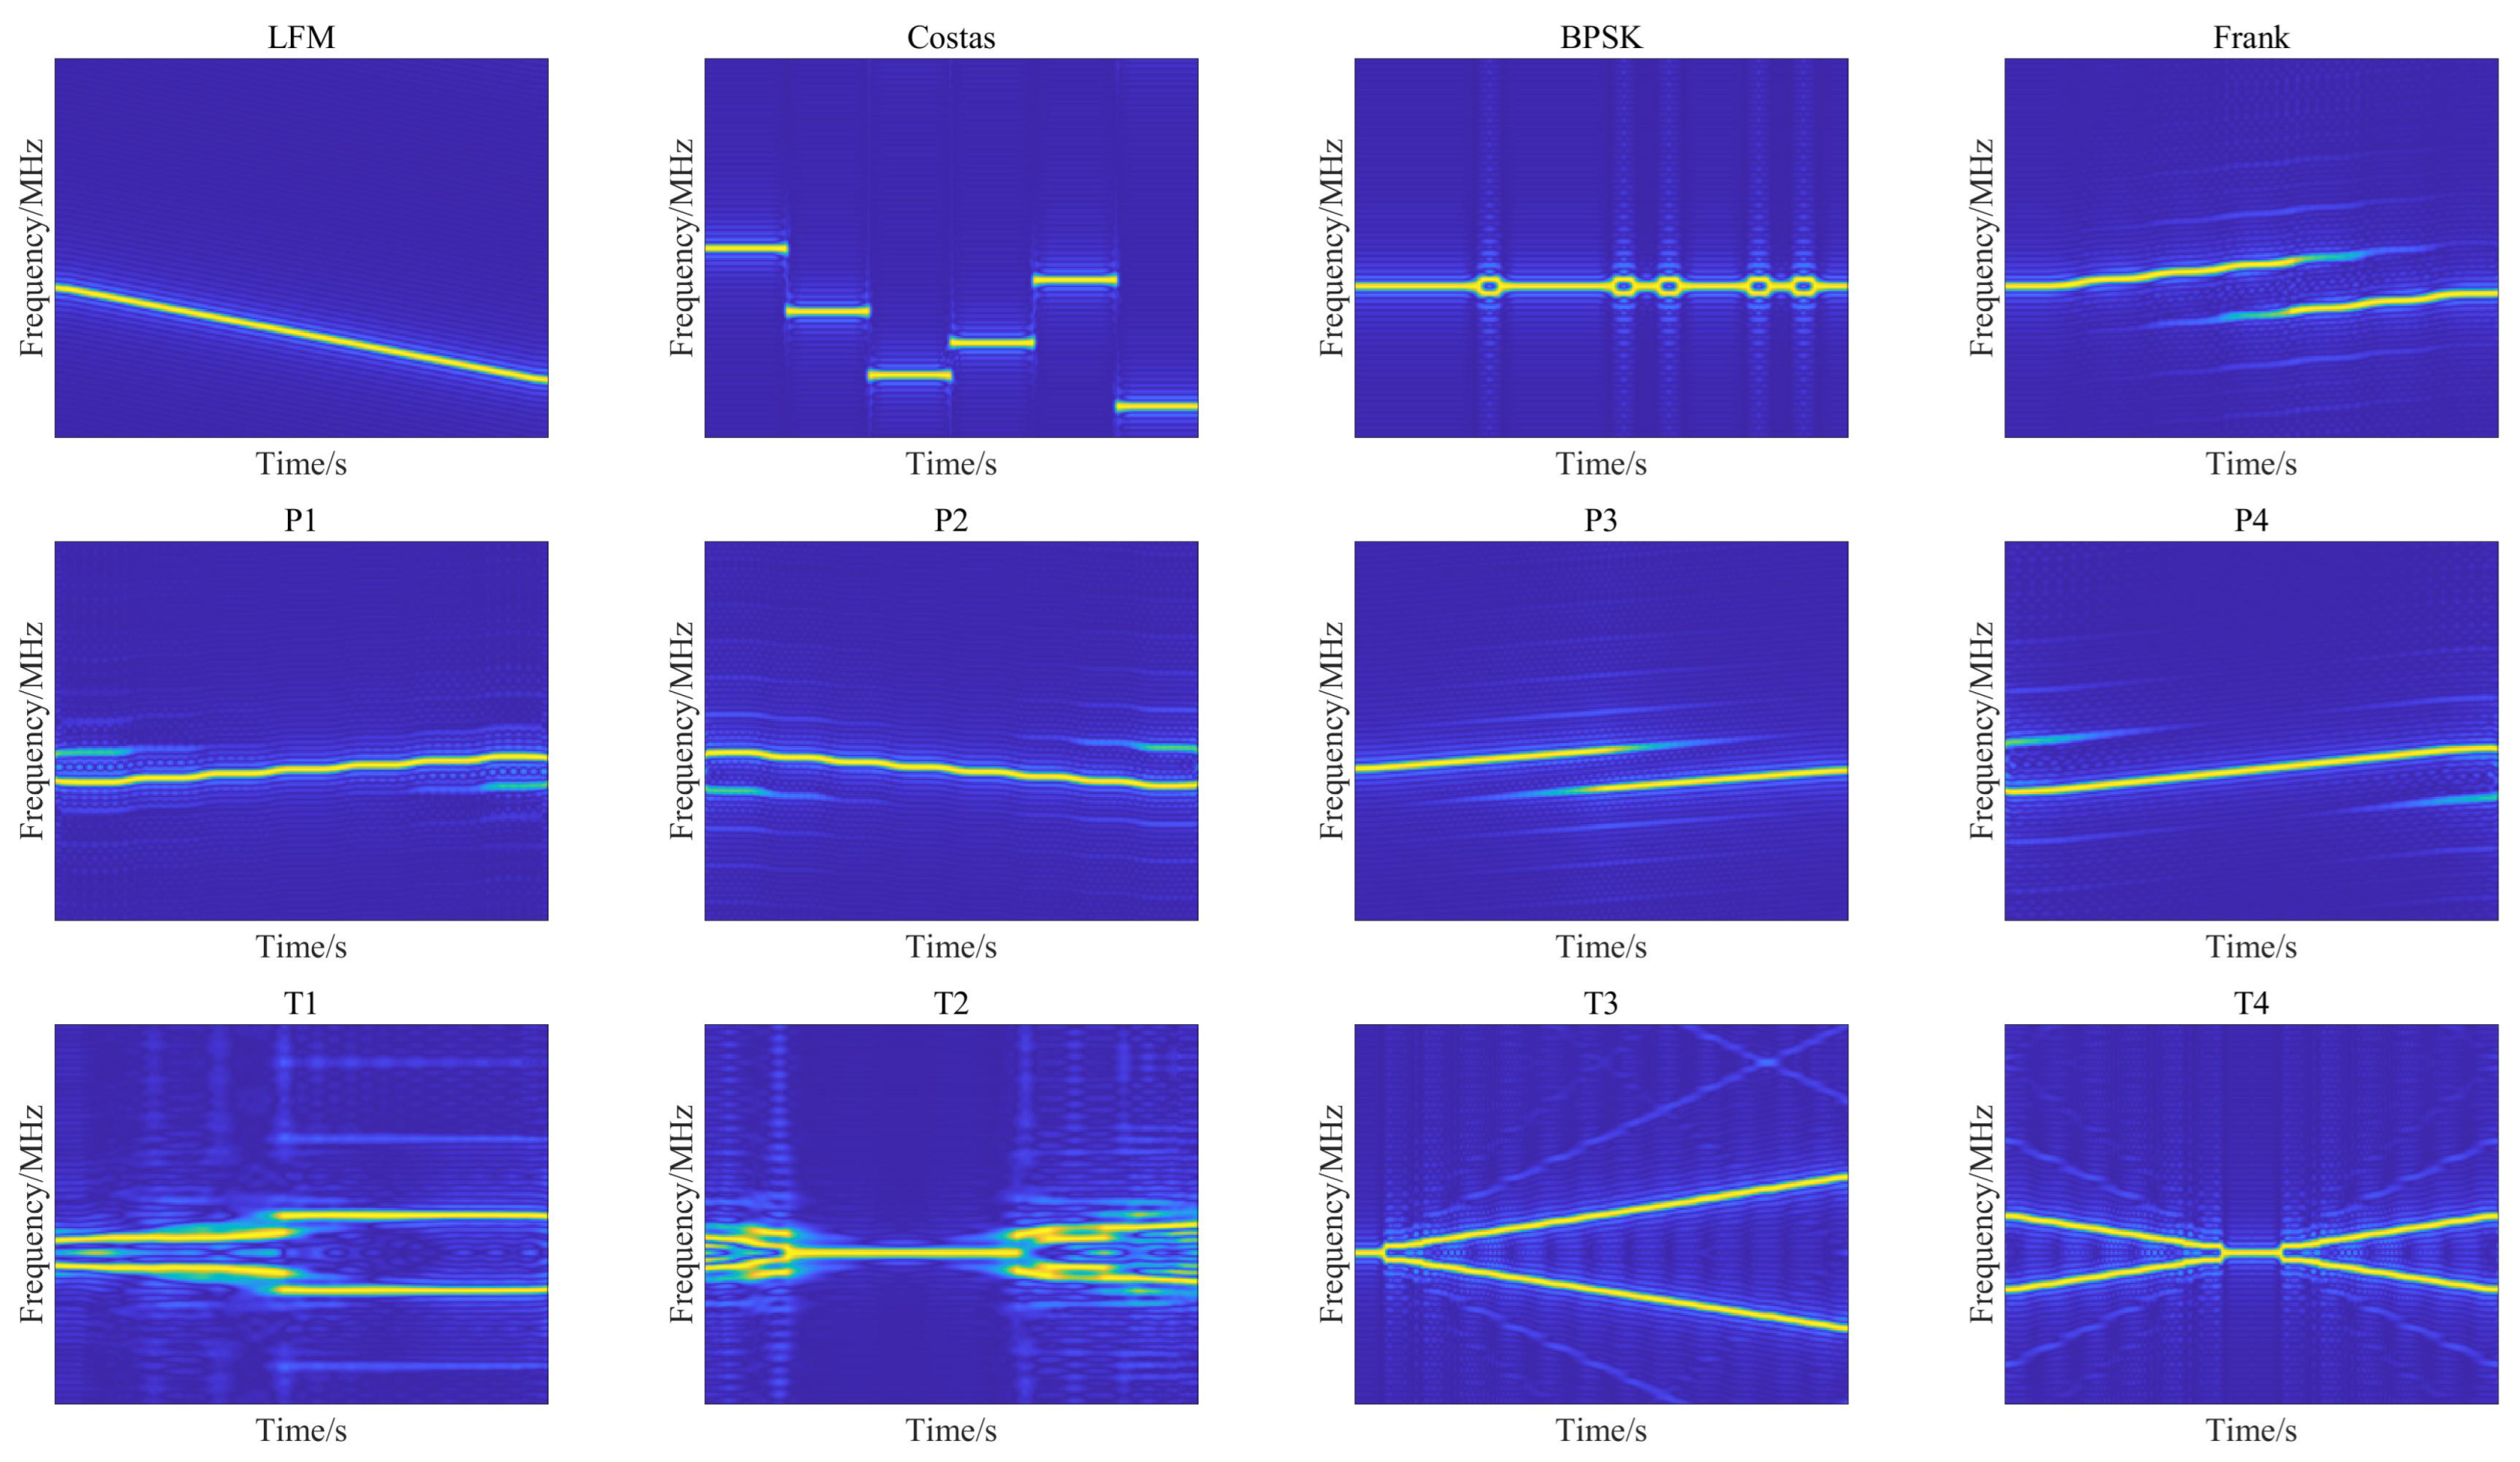
2.1. Time–Frequency Transformation

In order to obtain more complete and accurate time–frequency information on radar signals, we adopted two time–frequency transformation methods, CWD and SPWVD. CWD analyzes the signals by using the wavelet analysis method, providing accurate time–frequency information and an excellent time–frequency aggregation performance. SPWVD, on the other hand, smooths WVD, effectively suppresses cross-term interference, and reduces noise effects to improve the stability and accuracy of the time–frequency analysis. This time–frequency transformation process combining CWD and SPWVD helps describe the time–frequency characteristics of radar signals more comprehensively and improves the quality and accuracy of signal analysis.

2.1.1. Choi–Williams Distribution

Before introducing Choi–Williams distribution (CWD), we will first provide the definition of the Cohen-like time–frequency distribution, it can be expressed as [21]:
C f ( t , ω , ϕ ) = 1 2 π e j ( ξ μ τ ω ξ t , τ ) ϕ ( ξ , τ ) A ( μ , τ ) d μ d τ d ξ
where ϕ ( ξ , τ ) is the kernel function, and A ( μ , τ ) is denoted as follows:
A ( μ , τ ) = x μ + τ 2 x * μ τ 2
where x ( μ ) is the time signal and x * ( μ ) is its complex conjugate.
When ϕ ( ξ , τ ) = 1 in the Cohen distribution, it is called the Wigner–Ville distribution (WVD), and when ϕ ( ξ , τ ) is in its exponentially weighted form, it is called the Cohen distribution. The kernel function ϕ ( ξ , τ ) is calculated as follows:
ϕ ( ξ , τ ) = e ξ 2 τ 2 / σ
where σ σ > 0 is the scaling factor. Equation (3) is useful for reducing the cross terms. The CWD of the continuous form of the signal x t is as follows:
C W D x ( t , ω ) = τ = e j ω r μ = σ 4 π τ 2 G ( μ , τ ) A ( μ , τ ) d μ d τ
where t is the time variable, ω = 2 π f is the angular frequency, σ is the scaling factor for positive values, and the kernel function G μ , τ is calculated as follows:
G μ , τ = e σ μ t 2 / 4 τ 2
The discrete form of CWD can be formulated as follows:
C W D x ( l , ω ) = 2 τ = e j 2 ω τ μ = σ 4 π τ 2 e σ ( μ l ) 2 / 4 τ 2 x ( μ + τ ) x * ( μ τ )
CWD uses the exponential kernel of the bilinear generalized time–frequency distribution, which has excellent aggregation and can better reflect the characteristics of the signals in the time–frequency domain. It is suitable for LPI radar signals under low SNR conditions [22]. As shown in Figure 2, the CWD time–frequency images of radar signals have good aggregation and can clearly distinguish the type of intra-pulse modulation. Nevertheless, CWD inevitably generates cross-phase interference for complex modulated signals.

2.1.2. Smoothed Pseudo Wigner–Ville Distribution

SPWVD is a modified WVD algorithm that optimizes the time–frequency distribution by changing two window functions in the time and frequency domains. It is mathematically expressed as follows:
S P W V D z ( t , f ) = g ( ξ ) h ( τ ) z t ξ + τ 2 · z t ξ τ 2 e j 2 π f τ d ξ d τ
where the window functions g ξ and h τ are used to suppress the cross term in the time and frequency domains, respectively. Let z t = i = 1 p z i t , i = 1 , 2 , p , then
S P W V D z ( t , f ) = g ( ξ ) h ( τ ) i = 1 p z i t ξ + τ 2 · j = 1 p z j t ξ τ 2 e j 2 π f τ d ξ d τ = i = 1 p S P W V D z i ( t , f ) + i , j = 1 ; i j p S P W V D z i , z j ( t , f )
where i , j = 1 ; i j p S P W V D z i , z j ( t , f ) is the multi-component signal’s mutual SPWVD. Because the SPWVD algorithm slides in the time and frequency domains using the window functions g ξ and h τ , the cross terms created by WVD can be considerably suppressed, but the aggregation characteristics and resolution of the time–frequency distribution are reduced. Figure 3 shows the time–frequency images of 12 different radar signals after SPWVD transform.It can be observed that the cross terms in the time–frequency images after SPWVD transformation are effectively suppressed.

2.2. HOG Feature Extraction

The HOG feature detection algorithm essentially analyzes the statistical distribution of the gradient in images. In order to extract informative gradient features, we preprocessed the time–frequency images by grayscale scaling, bicubic interpolation, and binarization. This preprocessing process reduced the noise interference while enhancing the contour information of the signals. Subsequently, the statistical distribution of gradient information was analyzed in the preprocessed time–frequency images. Gradient information effectively characterized the shape, texture, and edges of an object; thus, the HOG feature had unique advantages over other feature representations in the field of image analysis [23]. The particular process of the HOG feature extraction on time–frequency images included gradient calculation, gradient direction histogram construction, and histogram normalization.

2.2.1. Gradient Calculation

Gradient calculation refers to calculating the gradient of each pixel of a time–frequency image in both horizontal and vertical directions. Therefore, the gradient strength and direction for each pixel position could be obtained, and the texture and contour features of each pixel could be extracted from its gradient. The horizontal gradient and vertical gradient in the direction of the pixel point x , y were calculated by formulas (9) and (10).
G x x , y = H x + 1 , y H x 1 , y
G y x , y = H x , y + 1 H x , y 1
where H x , y is the grayscale of the image. The gradient magnitude and gradient direction at the pixel point x , y are shown in formulas (11) and (12).
G x , y = G x x , y 2 + G y x , y 2
α x , y = tan 1 G y x , y G x x , y

2.2.2. Gradient Direction Histogram Construction

The gradient image stores the gradient vectors for each pixel resulting from the gradient calculations. To compute the directional gradient distribution in a local area or cell, the optimal outcomes are attained by considering a 180° directional angle range separated into 9 quantized directions. When calculating the directional gradient histogram, each gradient contributes its magnitude to the corresponding quantization direction according to its angle, resulting in a vector with a dimension of 9. To minimize the impact of quantization aliasing, we performed bilinear interpolation between adjacent statistical directions and spatial intervals with respect to the direction and position of the cell centers, while computing the histogram’s contribution for each pixel gradient [24].

2.2.3. Histogram Normalization of Overlapping Blocks

To prevent the gradient intensity from fluctuating greatly due to the contrast change between the target region and the background region, it is necessary to normalize the feature vector corresponding to each block. This normalization is formulated as:
L 2 norm , v v v 2 2 + ε 2
where, v represents the feature vector before normalization, which contains all the histogram information of a given interval, v k represents the k-order norm of v, and ε is a minimal normalization constant to avoid the numerator being zero.
The normalization method used in this paper is L 2 Hys , which was obtained by initially performing L 2 norm , followed by clipping the results to a specific range (between v 0.2 v ) and, finally, re-normalizing the values. This normalization enables HOG features to maintain stability under varying conditions, reducing the effect of noise. Additionally, it ensures that features from different blocks or cells have consistent scale and contrast, thereby improving overall performance.

2.3. Signal Recognition via Bagging SVM

After extracting the HOG features from the time–frequency images corresponding to the radar signals, we designed a bagging learning model with SVM (bagging SVM) to achieve this recognition task. Bagging SVM incorporates the benefits of bootstrap and aggregating techniques to create individuals for its ensemble by training each SVM classifier on a random subset of the training set, which is beneficial to improve the accuracy and stability of radar signal detection, thereby reducing the variance of the results to reduce the overfitting problem [25]. For a given training dataset, k training subsets are first randomly generated by bootstrap sampling to train k SVM classifiers. Then, k prediction results obtained from independently trained SVMs are combined with the plurality voting method to obtain the final estimation. The overall framework of bagging-SVM is shown in Figure 4.

3. Experiments

To evaluate the effectiveness of the proposed method, in this section, we conducted extensive experiments on 12 kinds of radar signals, including comparison with baselines, performance analysis, model efficiency comparison, and ablation study. The proposed method was run on a hardware platform using an 11th Gen Intel(R) Core(TM) i5-11400 @ 2.60 GHz 2.59 GHz which is and 32.0 GB RAM. Intel Corporation, the manufacturer of the processor, is headquartered in Santa Clara, CA, USA. And the experiment was conducted in a Windows 10 Professional environment.

3.1. Dataset Description

In this work, we selected 12 typical radar signals for experiments, including LFM, Costas, BPSK, Frank, P1, P2, P3, P4, T1, T2, T3, and T4. In our experiments, SNR ranged from −14 dB to 10 dB with a step size of 2 dB. For each signal at each SNR, 1000 samples were generated, with 800 samples utilized for training and the remaining 200 samples used for testing. Therefore, the training set included a total of 105,600 samples and the testing set included 26,400 samples generated from 12 kinds of signals. Moreover, in our experiments, each signal was mixed with Gaussian white noise. The specific parameter settings are shown in Table 1. The dataset is available at Github accessed on 3 December 2023 (https://github.com/stu-cjlu-sp/rsrc-for-pub).

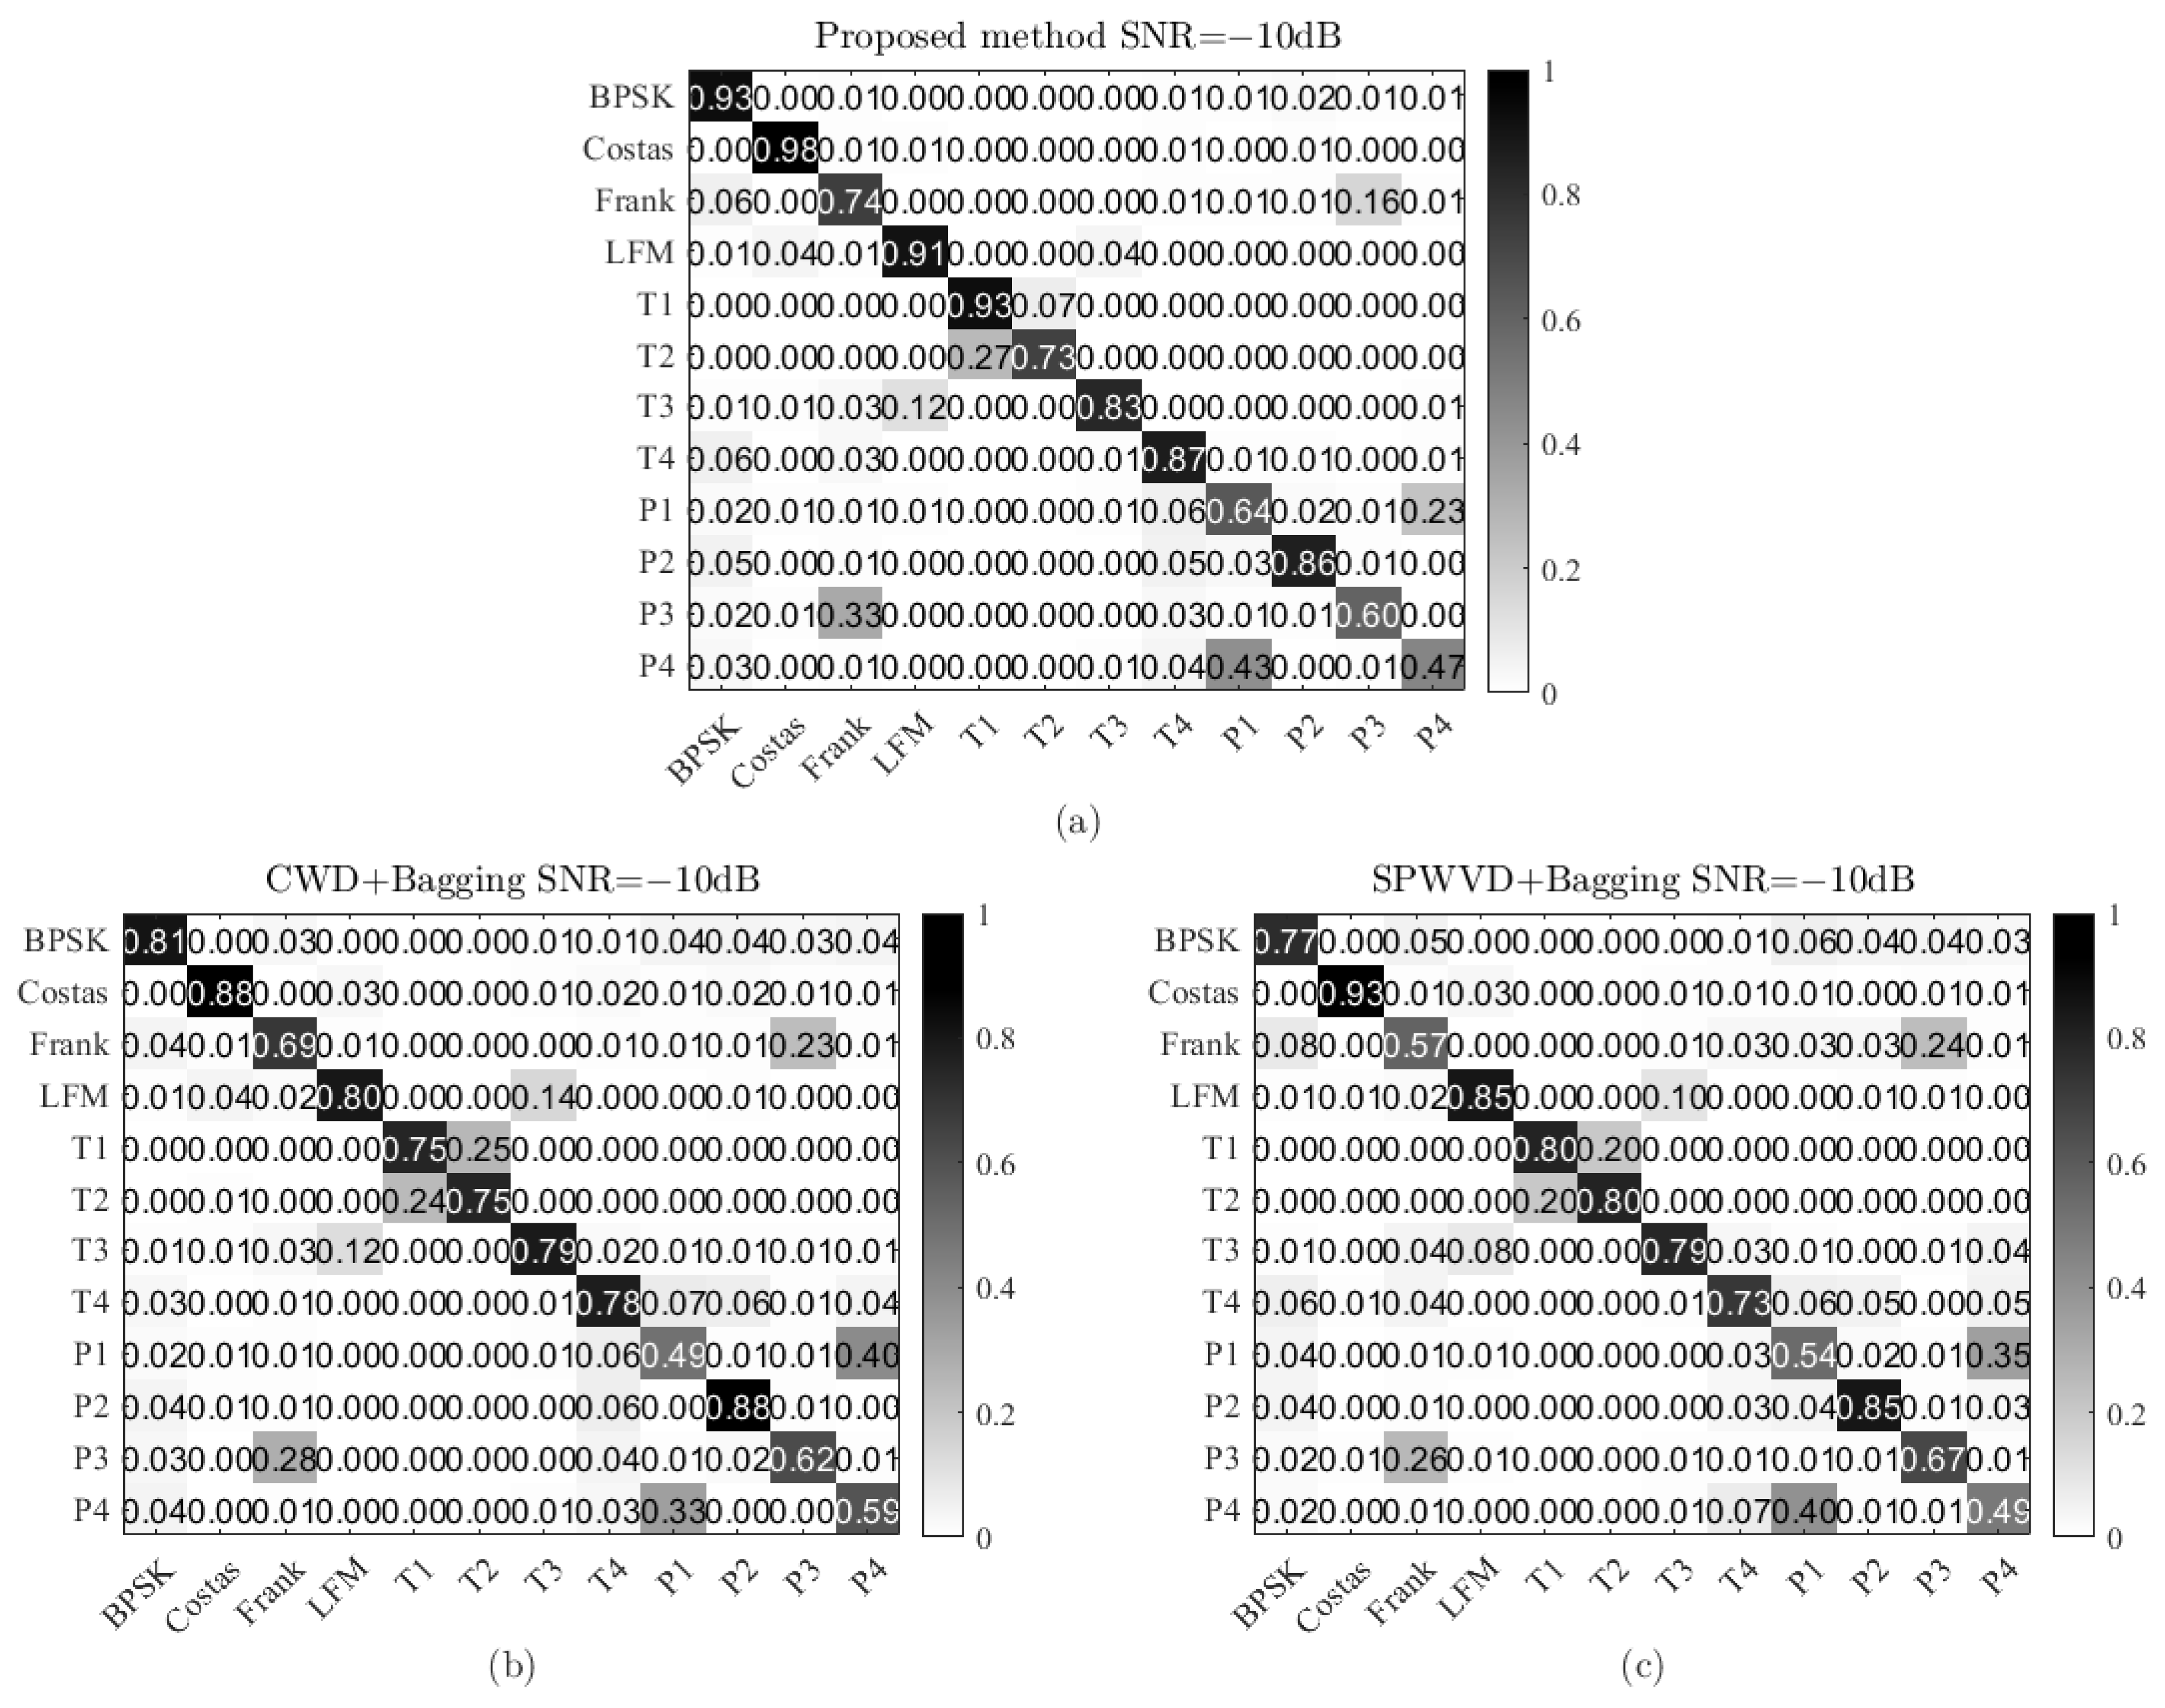
3.2. Performance Comparison and Analysis

In order to verify the performance of the proposed algorithm in this paper, we first compared it with several traditional methods (GLCM+SVM [12] and MSST+SVM [13]) and deep-learning-based methods (CWT+CNN [17], Alexnet+SVM [18], and LPI-net [19]). The experimental results in terms of the average recognition accuracy on 12 kinds of radar signals are shown in Figure 5. It can be seen that the proposed method demonstrated a superior recognition accuracy compared with most methods, particularly under low SNR conditions.
As the SNR decreased, the radar signals gradually became progressively obscured by noise, resulting in a decline in the quality of the time–frequency images. As shown in Figure 5, the GLCM [12] was susceptible to noise interference at a low SNR, which hindered effectively capturing some of the image texture features, directly impacting the accuracy of the image recognition. However, the HOG features used in this paper had good noise immunity and could better extract texture and edge features in the radar time–frequency images, even at low SNRs. The MSST used in the literature [13] necessitated a relatively high SNR to ensure accurate signal identification because of its reliance on clean data. In contrast, some other time–frequency transform methods may have lower SNR requirements. The algorithm in the literature [17] achieved a high recognition accuracy at an SNR greater than 0 dB, but its average recognition rate decreased sharply when the SNR fell below −2 dB, mainly due to CWT’s sensitivity to noise interference. This paper combined two time–frequency transformation methods, CWD and SPWVD, which are characterized by a high aggregation and high resistance to cross-talk, respectively. This combination mitigated the impact of noise on recognition accuracy to a certain extent. Consequently, the proposed method had a higher recognition accuracy in radar signal recognition compared with other machine learning approaches.
Furthermore, the proposed method demonstrated a competitive performance when compared with deep-learning-based approaches. In [18], Alexnet’s local awareness and weight-sharing advantages were utilized to extract the signal features for classification. Meanwhile, LPI-Net in [19] employed multiple cascade processing modules to improve feature diversity and avoid the gradient vanishing problem. As shown in Figure 5, deep learning has been proven to be effective in radar signal recognition and outperformed traditional machine learning methods significantly. However, this paper enhanced radar signal recognition accuracy by ensemble learning with SVM, achieving results comparable to deep learning methods.
Figure 6 shows the recognition accuracy of the proposed model for 12 different radar signals. It can be seen that its recognition accuracy generally increases as the SNR rises. In the low SNR environments, our method exhibits excellent performance on certain signal waveforms, including BPSK, Costas, and T1, with recognition accuracies exceeding 90% even at −10 dB. It is worth noting that, for both BPSK and Costas signals, a 100% correct recognition rate is achieved at −8 dB. This high accuracy is due to the fact that their time-frequency images are more distinguishable and recognizable compared to other signal waveforms.
Finally, we provided a more detailed analysis of the recognition accuracy at individual SNR levels using the confusion matrix. As shown in Figure 7, the confusion matrix illustrated the recognition accuracies of 12 different radar signals at an SNR of −8 dB. It can be seen that the proposed method achieved an average accuracy of 88.63%, where many radar signals were recognized with an accuracy greater than 90%. It is worth noting that the recognition rate reached 98% for some radar signals, such as BPSK, Costas, T4, and P2, while confusion cases were observed in P1, P3, and P4 (e.g., 20% confusion with P4, 29% with Frank, and 34% with P1).

3.3. Model Efficiency Comparison

In this subsection, we comprehensively evaluated the efficiency of the proposed method with two key metrics, namely test duration and accuracy. First, under the same experimental environment, we compared the computational efficiency of the proposed method with three deep-learning-based methods (CWT+CNN [17], Alexnet+SVM [18], and LPI-net [19]). We performed quantitative analysis by recording the real-time test time of each method. In the experiment, we selected all radar signals under one SNR, a total of 2400 time–frequency images, for system testing. In the experiment, we tested 12 radar signals under a single SNR, comprising a total of 2400 time–frequency images. The comparative results are shown in Table 2. It can be seen that compared with the CWT+CNN method, our method necessitated a longer testing time. This can be attributed to the fact that CWT+CNN adopts a simpler network structure. However, the proposed method exhibited a significant advantage over the other two deep-learning-based methods, Alexnet+SVM and LPI-net, in terms of test time. This indicates that the method proposed not only demonstrated a higher computational efficiency, but also required relatively lower computing resources.
Additionally, we further evaluated the recognition accuracy of the method on training sets of varying sizes and compared it with other methods. Figure 8 displays the relationship between classification accuracy and the scale of training sets for the four methods at −6 dB. The results in Figure 8 clearly show that our method still improved the accuracy despite reducing the size of the training set data. This improvement can be attributed to the mechanism of bagging learning. In contrast, the recognition accuracy of the three methods based on deep learning decreased significantly as the number of training sets decreased. This trend mainly arose from the requirement of training deep learning models on large-scale data to ensure the effective learning of complex features in the data. When the size of the training sets was reduced, these models struggled to accurately capture key features in the signal, consequently diminishing the model’s generalization ability, especially in terms of recognition accuracy when encountering new data. This indicates that our method exhibited significant advantages on small-scale datasets. While reducing the size of training sets may increase the risk of model overfitting, ensemble models from different training subsets can introduce more diversity to improve the model’s generalization ability.

3.4. Ablation Experiment

As mentioned above, the proposed method employed two time–frequency transforms and an ensemble learning technique. In this subsection, we assess the effectiveness of model components by ablation experiments. Specifically, we defined four variants for the proposed method: (a) CWD+SVM: the proposed method variation that does not include the SPWVD channel and ensemble learning strategy. (b) SPWVD+SVM: the proposed method variation that does not include the CWD channel and ensemble learning strategy. (c) CWD+bagging: the proposed method variation that does not include the SPWVD channel. (d) SPWVD+bagging: the proposed method variation that does not include the CWD channel. The comparison results of the proposed method with its variants are shown in Figure 9.
It can be seen that the overall recognition accuracy of CWD+bagging and SPWVD+bagging showed an obvious improvement compared with CWD+SVM and SPWVD+SVM. This indicates that the bagging learning strategy contributed to improving the performance of the radar signal recognition task. Nevertheless, the two variants achieved certain improvements, but there was not a significant difference under low SNR conditions. This is because of the fact that different time–frequency analysis methods showed distinct advantages in characterizing time–frequency features. Furthermore, by comparing the proposed method with CWD+bagging and SPWVD+bagging, our method achieved significant improvements in recognition accuracy under low SNR conditions while the same ensemble learning strategy was applied. Specifically, the overall accuracy was improved by about 5% compared with the other variants. The main reason is that we combined the two time–frequency transforms in the proposed method. It implies that the two time–frequency transformations complemented each other in the signal recognition process.
In order to further study the performance improvement effect of the proposed method on radar signals, we used a confusion matrix to analyze the interactions among different radar signal types. Figure 10 shows the confusion matrices of the proposed method, CWD+bagging, and SPWVD+bagging at an SNR of −10 dB. The performance differences between the different signal types can be clearly observed from the confusion matrix in the figure. Compared with SPWVD+bagging, CWD+bagging performed better in identifying the four signal types, including Costas, LFM, T2, and P2, but showed a poor performance in the identification of four signal types: Frank, T4, P1, and P4. However, compared with CWD+bagging and SPWVD+bagging, the proposed method demonstrated a superior recognition performance for most signal types, which demonstrates the robust generalization performance of the proposed method.

4. Conclusions

In this paper, a radar signal recognition method based on bagging SVM is proposed. The method utilizes CWD and SPWVD to obtain different time–frequency images of radar signals, effectively leveraging CWD’s strong time–frequency aggregation and SPWVD’s robust cross-interference resistance. By utilizing a bagging learning model based on SVM, this method overcomes the issue of a poor generalization performance of individual classifiers caused by overfitting, thereby enhancing the recognition performance in radar signal recognition tasks. The results of the experiment show that the proposed method provides a high classification accuracy even in low SNR situations. In future work, we will deeply explore and broadly apply the integrated learning approach to unknown radar signal recognition to improve the robustness and fault tolerance of the overall model.

Author Contributions

Conceptualization, D.Q.; methodology, K.Y.; software, K.Y.; validation, L.S.; investigation, Y.Q. and X.W.; data curation, L.S.; writing—original draft preparation, K.Y.; writing—review and editing, X.W.; visualization, X.W.; supervision, Y.Q.; project administration, D.Q.; funding acquisition, D.Z. All authors have read and agreed to the published version of the manuscript.

Funding

This research was supported by Key Research and Development Projects in Zhejiang Province (No. 2022C01144).

Data Availability Statement

Data are contained within the article.

Acknowledgments

The authors wish to express their appreciation to the editors for their rigorous and efficient work and the reviewers for their helpful suggestions, which greatly improved the presentation of this paper.

Conflicts of Interest

The authors declare no conflict of interest.

Sample Availability

The code for the radar signal dataset used in this article has been made public in the article.

References

  1. Golden, A., Jr. Radar Electronic Warfare; American Institute of Aeronautics and Astronautics, Inc.: Reston, VA, USA, 1988. [Google Scholar]
  2. Baseghi, B. Characterizing radar emissions using a robust countermeasure receiver. IEEE Trans. Aerosp. Electron. Syst. 1992, 28, 741–755. [Google Scholar] [CrossRef]
  3. Jäntti, J.; Chaudhari, S.; Koivunen, V. Detection and classification of OFDM waveforms using cepstral analysis. IEEE Trans. Signal Process. 2015, 63, 4284–4299. [Google Scholar] [CrossRef]
  4. Lin, A.; Ling, H. Doppler and direction-of-arrival (DDOA) radar for multiple-mover sensing. IEEE Trans. Aerosp. Electron. Syst. 2007, 43, 1496–1509. [Google Scholar] [CrossRef]
  5. Li, X.; Liu, Z.; Huang, Z. Deinterleaving of pulse streams with denoising autoencoders. IEEE Trans. Aerosp. Electron. Syst. 2020, 56, 4767–4778. [Google Scholar] [CrossRef]
  6. Dudczyk, J. A method of feature selection in the aspect of specific identification of radar signals. Bull. Pol. Acad. Sci. Tech. Sci. 2017, 65, 113–119. [Google Scholar] [CrossRef]
  7. Guo, Q.; Nan, P.; Wan, J. Signal classification method based on data mining for multi-mode radar. J. Syst. Eng. Electron. 2016, 27, 1010–1017. [Google Scholar] [CrossRef]
  8. Gao, J.; Lu, Y.; Qi, J.; Shen, L. A radar signal recognition system based on non-negative matrix factorization network and improved artificial bee colony algorithm. IEEE Access 2019, 7, 117612–117626. [Google Scholar] [CrossRef]
  9. Guo, Y.; Zhang, X. Radar signal classification based on cascade of STFT, PCA and naïve Bayes. In Proceedings of the 2016 7th International Conference on Intelligent Systems, Modelling and Simulation (ISMS), Bangkok, Thailand, 25–27 January 2016; IEEE: Piscataway, NJ, USA, 2016; pp. 191–196. [Google Scholar]
  10. Yang, B.; Hong, T.; Ma, L.; Jiang, W. A Recognition Algorithm for Complex Spatial Electromagnetic Signal Perception Based on KNN. In Proceedings of the 2022 International Conference on Microwave and Millimeter Wave Technology (ICMMT), Harbin, China, 12–15 August 2022; IEEE: Piscataway, NJ, USA, 2022; pp. 1–3. [Google Scholar]
  11. Guo, Q.; Yu, X.; Ruan, G. LPI radar waveform recognition based on deep convolutional neural network transfer learning. Symmetry 2019, 11, 540. [Google Scholar] [CrossRef]
  12. Li, S.; Quan, D.; Wang, X.; Jin, X. LPI Radar signal modulation recognition with feature fusion based on time-frequency transforms. In Proceedings of the 2021 13th International Conference on Wireless Communications and Signal Processing (WCSP), Virtual, 20–22 October 2021; IEEE: Piscataway, NJ, USA, 2021; pp. 1–6. [Google Scholar]
  13. Daying, Q.; Zeyu, T.; Yun, C.; Weizhong, L.; Xiaofeng, W.; Dongping, Z. Radar emitter signal recognition based on MSST and HOG feature extraction. J. Beijing Univ. Aeronaut. Astronaut. 2022, 49, 538–547. [Google Scholar]
  14. Kong, S.H.; Kim, M.; Hoang, L.M.; Kim, E. Automatic LPI radar waveform recognition using CNN. IEEE Access 2018, 6, 4207–4219. [Google Scholar] [CrossRef]
  15. Han, H.; Yi, Z.; Zhu, Z.; Li, L.; Gong, S.; Li, B.; Wang, M. Automatic Modulation Recognition Based on Deep-Learning Features Fusion of Signal and Constellation Diagram. Electronics 2023, 12, 552. [Google Scholar] [CrossRef]
  16. Jing, L.; Tian, Y. Self-supervised visual feature learning with deep neural networks: A survey. IEEE Trans. Pattern Anal. Mach. Intell. 2020, 43, 4037–4058. [Google Scholar] [CrossRef] [PubMed]
  17. Walenczykowska, M.; Kawalec, A. Radar signal recognition using Wavelet Transform and Machine Learning. In Proceedings of the 2022 23rd International Radar Symposium (IRS), Gdansk, Poland, 12–14 September 2022; IEEE: Piscataway, NJ, USA, 2022; pp. 492–495. [Google Scholar]
  18. Cheng, Y.; Guo, M.; Guo, L. Radar signal recognition exploiting information geometry and support vector machine. IET Signal Process. 2023, 17, e12167. [Google Scholar] [CrossRef]
  19. Huynh-The, T.; Doan, V.S.; Hua, C.H.; Pham, Q.V.; Nguyen, T.V.; Kim, D.S. Accurate LPI radar waveform recognition with CWD-TFA for deep convolutional network. IEEE Wirel. Commun. Lett. 2021, 10, 1638–1642. [Google Scholar] [CrossRef]
  20. Si, W.; Wan, C.; Deng, Z. Intra-pulse modulation recognition of dual-component radar signals based on deep convolutional neural network. IEEE Commun. Lett. 2021, 25, 3305–3309. [Google Scholar] [CrossRef]
  21. Feng, Z.; Liang, M.; Chu, F. Recent advances in time–frequency analysis methods for machinery fault diagnosis: A review with application examples. Mech. Syst. Signal Process. 2013, 38, 165–205. [Google Scholar] [CrossRef]
  22. Liu, Y.; Xiao, P.; Wu, H.; Xiao, W. LPI radar signal detection based on radial integration of Choi-Williams time-frequency image. J. Syst. Eng. Electron. 2015, 26, 973–981. [Google Scholar] [CrossRef]
  23. Dadi, H.S.; Pillutla, G.M. Improved face recognition rate using HOG features and SVM classifier. IOSR J. Electron. Commun. Eng. 2016, 11, 34–44. [Google Scholar] [CrossRef]
  24. Shu, C.; Ding, X.; Fang, C. Histogram of the oriented gradient for face recognition. Tsinghua Sci. Technol. 2011, 16, 216–224. [Google Scholar] [CrossRef]
  25. Lin, J.; Chen, H.; Li, S.; Liu, Y.; Li, X.; Yu, B. Accurate prediction of potential druggable proteins based on genetic algorithm and Bagging-SVM ensemble classifier. Artif. Intell. Med. 2019, 98, 35–47. [Google Scholar] [CrossRef] [PubMed]
Figure 1. The overall architecture of the proposed method.
Electronics 12 04981 g001
Figure 2. CWD time–frequency images of 12 kinds of radar signals.
Electronics 12 04981 g002
Figure 3. SPWVD time–frequency images of 12 kinds of radar signals.
Electronics 12 04981 g003
Figure 4. The architecture of the Bagging-SVM.
Electronics 12 04981 g004
Figure 5. Comparison of recognition results of different algorithms.
Electronics 12 04981 g005
Figure 6. Recognition results on 12 types of radar signal modulation.
Electronics 12 04981 g006
Figure 7. Confusion matrix at SNR of −8 dB.
Electronics 12 04981 g007
Figure 8. Comparison of accuracy under different training set sizes.
Electronics 12 04981 g008
Figure 9. Comparison with different types and numbers of SVM classifier combinations.
Electronics 12 04981 g009
Figure 10. Confusion matrix for different ensemble methods: (a) proposed method; (b) CWD+ bagging; (c) SPWVD+bagging.
Electronics 12 04981 g010
Table 1. Simulation parameter setting.
Radar WaveformSimulation ParameterRange
AllSampling frequency (fs)100 MHz
Center frequencyU(fs/6, fs/5)
LFMBandwidthU(fs/20, fs/16)
COSTAFundament frequencyU(fs/30, fs/24)
Code length[3, 4, 5, 6]
BPSKCode length[7, 11, 13]
FRANKCycles per phase code[3, 4, 5]
Number of frequency steps[6, 7, 8]
P1Cycles per phase code[3, 4, 5]
Number of frequency steps[6, 7, 8]
P2Cycles per phase code[3, 4, 5]
Number of frequency steps[6, 8]
P3Cycles per phase code[3, 4, 5]
Number of sub-codes[36, 49, 64]
P4Cycles per phase code[3, 4, 5]
Number of sub-codes[36, 49, 64]
T1Number of segments[4, 5, 6]
T2Number of phase states2
T3BandwidthU(fs/20, fs/10)
Number of segments[4, 5, 6]
T4BandwidthU(fs/20, fs/10)
Number of segments[4, 5, 6]
Table 2. Test duration comparison.
MethodTest Duration (s)
Proposed method63
CWT+CNN36
Alexnet+SVM174
LPI-net181
Disclaimer/Publisher’s Note: The statements, opinions and data contained in all publications are solely those of the individual author(s) and contributor(s) and not of MDPI and/or the editor(s). MDPI and/or the editor(s) disclaim responsibility for any injury to people or property resulting from any ideas, methods, instructions or products referred to in the content.

