Article

Two-Stage Progressive Learning for Vehicle Re-Identification in Variable Illumination Conditions

1
School of Intelligent Systems Engineering, Sun Yat-sen University, Shenzhen 518107, China
2
Shenzhen Campus of Sun Yat-sen University, Shenzhen 518107, China
3
Guangdong Provincial Key Laboratory of Intelligent Transportation System, Shenzhen 518107, China
4
Guangdong Provincial Key Laboratory of Fire Science and Technology, Shenzhen 518107, China
*
Author to whom correspondence should be addressed.
Electronics 2023, 12(24), 4950; https://doi.org/10.3390/electronics12244950
Submission received: 9 November 2023 / Revised: 1 December 2023 / Accepted: 7 December 2023 / Published: 9 December 2023
(This article belongs to the Special Issue Applications of Computer Vision, Volume II)

Abstract

:
Vehicle matching in variable illumination environments can be challenging due to the heavy dependence of vehicle appearance on lighting conditions. To address this issue, we propose a two-stage progressive learning (TSPL) framework. In the first stage, illumination-aware metric learning is enforced using a two-branch network via two illumination-specific feature spaces, used to explicitly model differences in lighting. In the second stage, discriminative feature learning is introduced to extract distinguishing features from a given vehicle. This process consists of a local feature extraction attention module, a local constraint, and a balanced sampling strategy. During the metric learning phase, the model expresses the union of local features, extracted from the attention module, with illumination-specific global features to form joint vehicle features. As part of the study, we construct a large-scale dataset, termed VERI-DAN (vehicle re-identification across day and night), to address the current lack of vehicle datasets exhibiting variable lighting conditions. This set is composed of 200,004 images from 16,654 vehicles, collected in various natural illumination environments. Validation experiments conducted with the VERI-DAN and Vehicle-1M datasets demonstrated that our proposed methodology effectively improved vehicle re-identification Rank-1 accuracy.

1. Introduction

Vehicle re-identification (re-ID) aims to match a target vehicle across multiple non-overlapping surveillance cameras with varying viewpoints, illumination, and resolution. The proliferation of surveillance cameras in urban areas has led to a significant increase in the demand for vision-based re-ID techniques, which could facilitate the management of smart cities [1,2,3]. While the development of deep learning and existing annotated datasets have greatly facilitated vehicle re-ID research, vision-based vehicle re-ID still suffers from low resolution, blurred motion, and extreme weather conditions, such as fog, rain, and snow. Meanwhile, variations in viewpoint, illumination, and background can pose significant challenges for vehicle re-ID. Specifically, illumination presents a major challenge, as vehicle appearance can depend heavily on subtle changes in light intensity. Existing models have been trained primarily using datasets that exhibit limited lighting variability, while also ignoring the obstruction of notable visual cues caused by dramatic fluctuations in illumination. Furthermore, the conventional approach of collecting images in a single-feature space also underestimates the challenges posed by inconsistent lighting. As shown in Figure 1, two vehicles of the same model in similar lighting conditions (Figure 1a) may appear to be more similar than the same vehicle observed under different lighting (Figure 1b). In addition, lower lighting levels may obstruct visual cues, such as logos, stickers, and body features, as seen in Figure 1c. One possible solution to this problem is to enhance images featuring poor illumination. Although low-light enhancement techniques have been successful in improving visual quality for classification tasks [4,5,6,7,8], extreme variations in illumination still pose significant challenges. As part of this study, experiments were conducted using images enhanced by a state-of-the-art (SOTA) method [6]. The results are summarized in Table 1, which indicates that re-ID accuracy experience a significant drop-off when images undergo enhancement. We suggest that some distinguishing details, which are essential for differentiating similar vehicles, may have been lost during enhancement. In addition, images containing unnatural noise may have further reduced re-ID accuracy.
Inspired by the manual process of recognizing vehicles, we propose to address this problem by using a two-stage progressive learning (TSPL) strategy, consisting of an illumination-aware metric-learning stage and a detail-aware discriminative feature-learning stage. In the first phase, we used coarse-grained labels to describe the illumination of each image (i.e., “daytime” and “nighttime”). Samples with the same illumination label were then assigned as S-IL image pairs, and samples with different illumination labels were assigned as D-IL image pairs, as illustrated in Figure 1. Two separate deep metrics were then learned for the S-IL and D-IL images in the two illumination-specific feature spaces. Specifically, we measured the similarity of images with the same illumination label in the S-IL feature space and images with different illumination labels in the D-IL feature space. The within-space and cross-space constraints were then enforced to explicitly learn robust visual representations against variations in lighting. In the second stage, we designed a detail-aware discriminative feature learning process, which was learned with the guidance of a local constraint, to extract distinguishing features among similar types of vehicles (as shown in Figure 2). Specifically, a local feature extraction module was introduced to generate local features, and a triplet loss, optimized by triplets of the same model, was designed to enforce the local constraint. Experiments confirmed that both stages were critical for improving re-ID accuracy (see Section 5.4.1).
As part of the study, we constructed a comprehensive, large-scale dataset termed VERI-DAN (vehicle re-identification across day and night) to address the lack of re-ID datasets exhibiting significant changes in illumination across samples. VERI-DAN included 200,004 images from 16,654 vehicles, each of which was photographed at least 4 times in variable lighting conditions using real-world cameras. The primary contributions of this study can be summarized as follows:
  • A large-scale dataset termed VERI-DAN is developed to facilitate vehicle re-ID in various illumination conditions. VERI-DAN is the first dataset of its type to represent changes in lighting on this scale. As such, it simulated a relatively challenging scenario (matching D-IL pairs), which is both common and useful in real-world scenes.
  • A two-stage progressive learning strategy is proposed for vehicle re-ID with variable illumination. In Stage I, we introduced an illumination-aware network, which significantly improved the learning of robust visual representations in extreme lighting conditions. In Stage II, we developed a discriminative local feature learning process, which facilitated the ability to distinguish among vehicles with a similar appearance.
  • We assessed the effectiveness of this approach using two datasets involving obvious lighting changes (VERI-DAN and Vehicle-1M). Despite only 12% of the training set being usable in Vehicle-1M (due to insufficient lighting variability), the proposed technique achieved SOTA performance for the original testing set.

2. Related Works

2.1. Vehicle Re-ID Methods

Vehicle re-ID, a variation of person re-ID [9], has received increasing attention in recent years, as its viability continues to improve. Zapletal and Herout [10] were the first to collect a large-scale dataset for this purpose, conducting a vision-based study by utilizing color and oriented gradient histograms. Liu et al. [11] combined traditional hand-crafted features with CNN-based deep features, thereby demonstrating that deep features were more discriminative. Liu et al. [12] proposed “PROVID” and made progress with the use of license plate information. Other studies [13,14] have shown that spatial and temporal information from vehicle images have contributed to improving vehicle re-ID performance. For example, PROVID [12] re-ranks vehicles using spatio-temporal properties based on a simple from-near-distant principle. Wang et al. [15] achieved spatio-temporal regularization for vehicle re-ID by considering the delay time between cameras. These techniques, however, are limited in their application because they require complex spatio-temporal labels.
Several studies have described vehicle re-ID as a metric learning problem and have introduced a series of metric losses to obtain better vehicle representations. Specifically, triplet loss has achieved great success in person re-ID0 [16,17,18] and has been adopted in vehicle re-ID. Zhang et al. [12] combined classification loss with triplet loss, providing further benefit. Yan et al. [19] proposed a multi-grain ranking loss to discriminate vehicles with a similar appearance. Studies have also shown that attributes, such as color, brand, and wheel pattern, can further improve re-ID efficacy [1,20,21,22]. Other strategies [20,21,23,24,25,26,27] have exploited the indirect attributes of a vehicle, such as camera perspective information and background information, making considerable improvements. These techniques, however, have overlooked valuable information present in the image beyond the vehicle itself, such as lighting conditions. In this study, we have suggested that the significance of an image extends beyond its perceptible features. By incorporating less apparent elements, such as illumination, the proposed deep learning model can produce more robust representations in a variety of lighting conditions. Table 2 summarizes related work on vehicle re-ID.

2.2. Vehicle Re-ID Datasets

Re-ID algorithms that have been applied to public datasets, such as VehicleID [28], VeRi-776 [12], VERI-Wild [29], and Vehicle-1M [30], have conventionally underestimated the importance of illumination. These conditions are limited in existing datasets, as the lighting in each image is typically consistent. For example, all of the samples in VeRi-776 were collected between 4:00 p.m. and 5:00 p.m. We inspected vehicle images in these public datasets and counted the number of samples collected during both the daytime and nighttime. This preliminary evaluation suggested that 90% of samples in VehicleID, 94% of samples in VERI-Wild, and 70% of samples in Vehicle-1M exhibited little variation in background luminance. In this paper, we propose a large-scale vehicle re-ID dataset termed VERI-DAN, which provides a more challenging classification task because each vehicle appears several times in different lighting conditions. The set contains 482 refined vehicle models (e.g., MG3-2016) with highly similar features. As such, this set was more suitable for evaluating the performance of vehicle re-ID methods in challenging scenarios.

3. Methodology

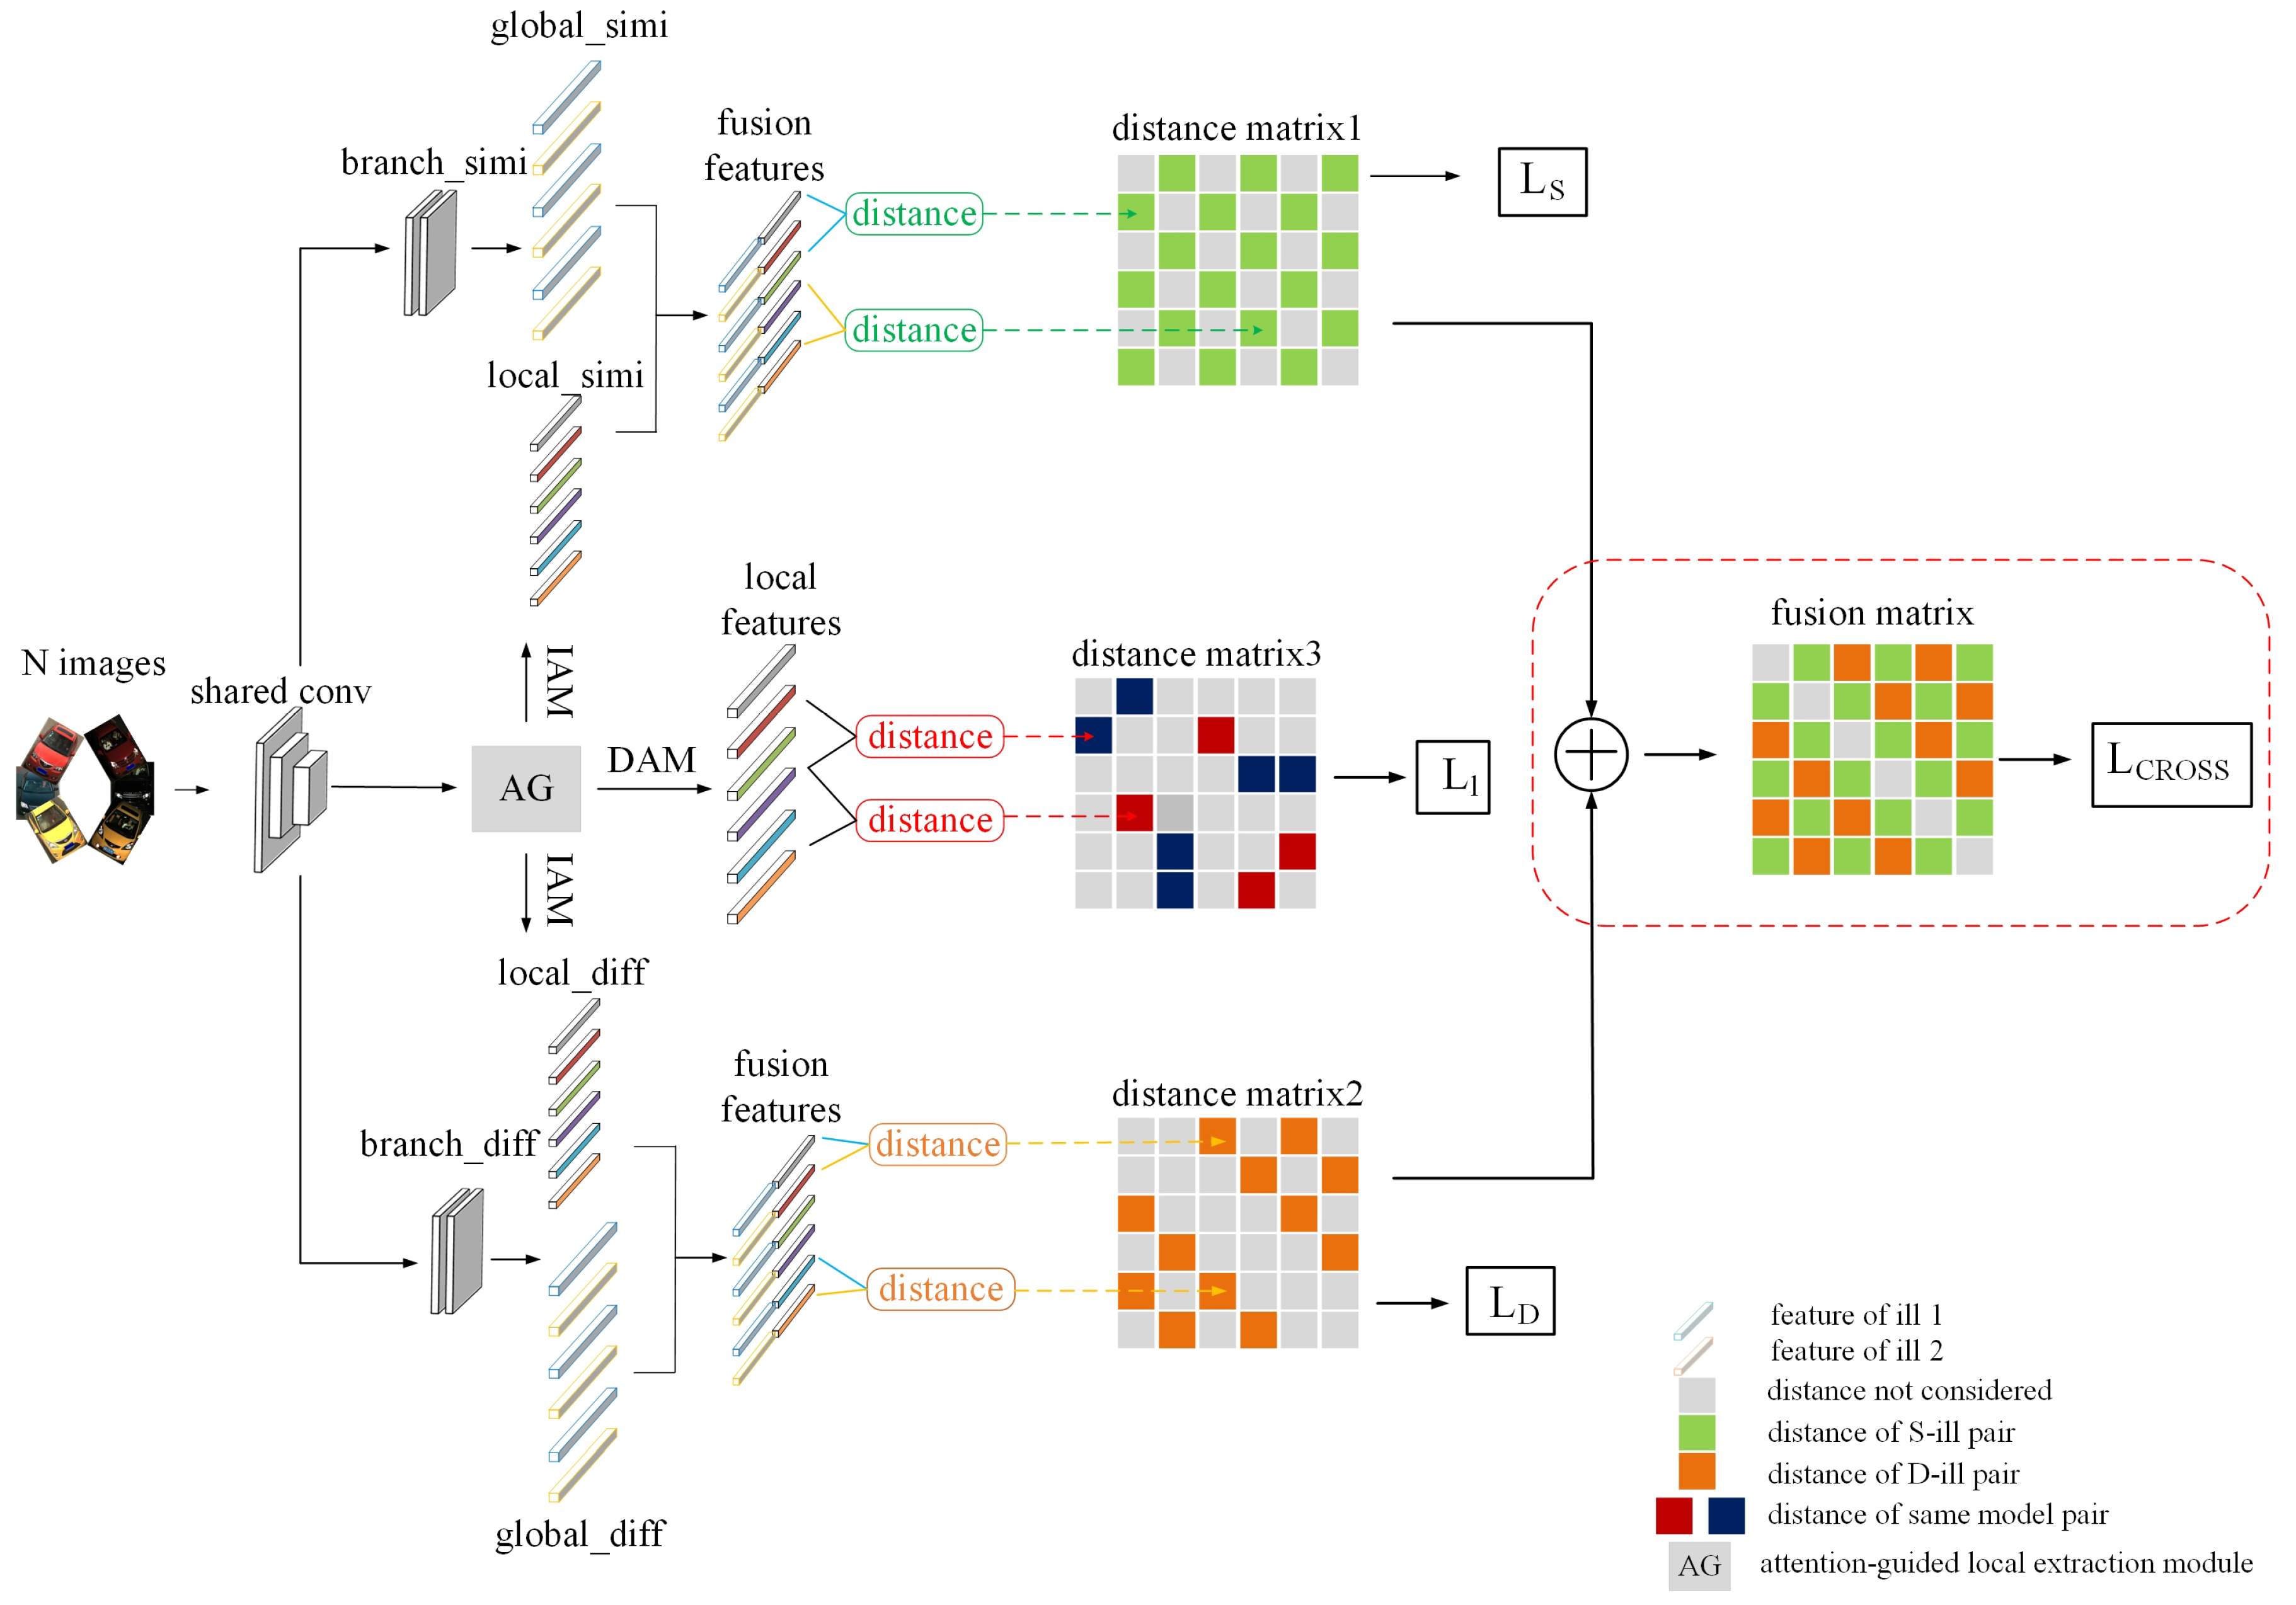
The network architecture for the proposed algorithm is illustrated in Figure 3. This framework constituted a two-stage progressive deep learning process involving illumination conditions and vehicle attributes. During the first stage (Section 3.2), we established an illumination-aware network (IANet) consisting of two branches with identical structures and applied it to both S-IL and D-IL image pairs. This two-branch network leveraged the coarse-grained illumination labels to supervise the learning of illumination-specific features. The Stage I model (IANet) then enabled the retrieval of samples under different lighting conditions. During the second stage (Section 3.3), we introduced a guided local feature extraction process to generate local features. This process included an illumination-aware local feature extraction module (IAM) and a detail-aware local feature extraction module (DAM). This attention mechanism facilitated the learning of distinguishing features among different vehicles with similar appearances, under the supervision of fine-grained model labels. The Stage II model was specifically designed to extract discriminative features from local areas to distinguish among similar types of vehicles. We adopted triplet loss as a learning baseline metric, as discussed in Section 3.1.

3.1. Metric Learning Baseline

We adopted triplet loss to construct a metric learning baseline. Given an image pair P = ( x i , x j ) , distances were calculated using D ( P ) = D ( x i , x j ) = f ( x i ) f ( x j ) 2 , where x i and x j represent images from the dataset X and D denotes the Euclidean distance between features. The function f then mapped raw images to their respective features. An example is provided given three samples: x, x + , and x , where x and x + belong to the same class (i.e., the same vehicle ID), while x and x belong to different classes. A positive pair P + = ( x , x + ) and a negative pair P = ( x , x ) can then be formed, for which the triplet loss is defined as follows:
L T r i ( x , x + , x ) = max { D ( P + ) D ( P ) + α , 0 } ,
where α is a margin enforced between positive and negative pairs. Equation (1) aims to minimize the distance between samples with the same ID while maximizing the distance between samples with different IDs.

3.2. Illumination-Aware Metric Learning

Inspired by previous work [
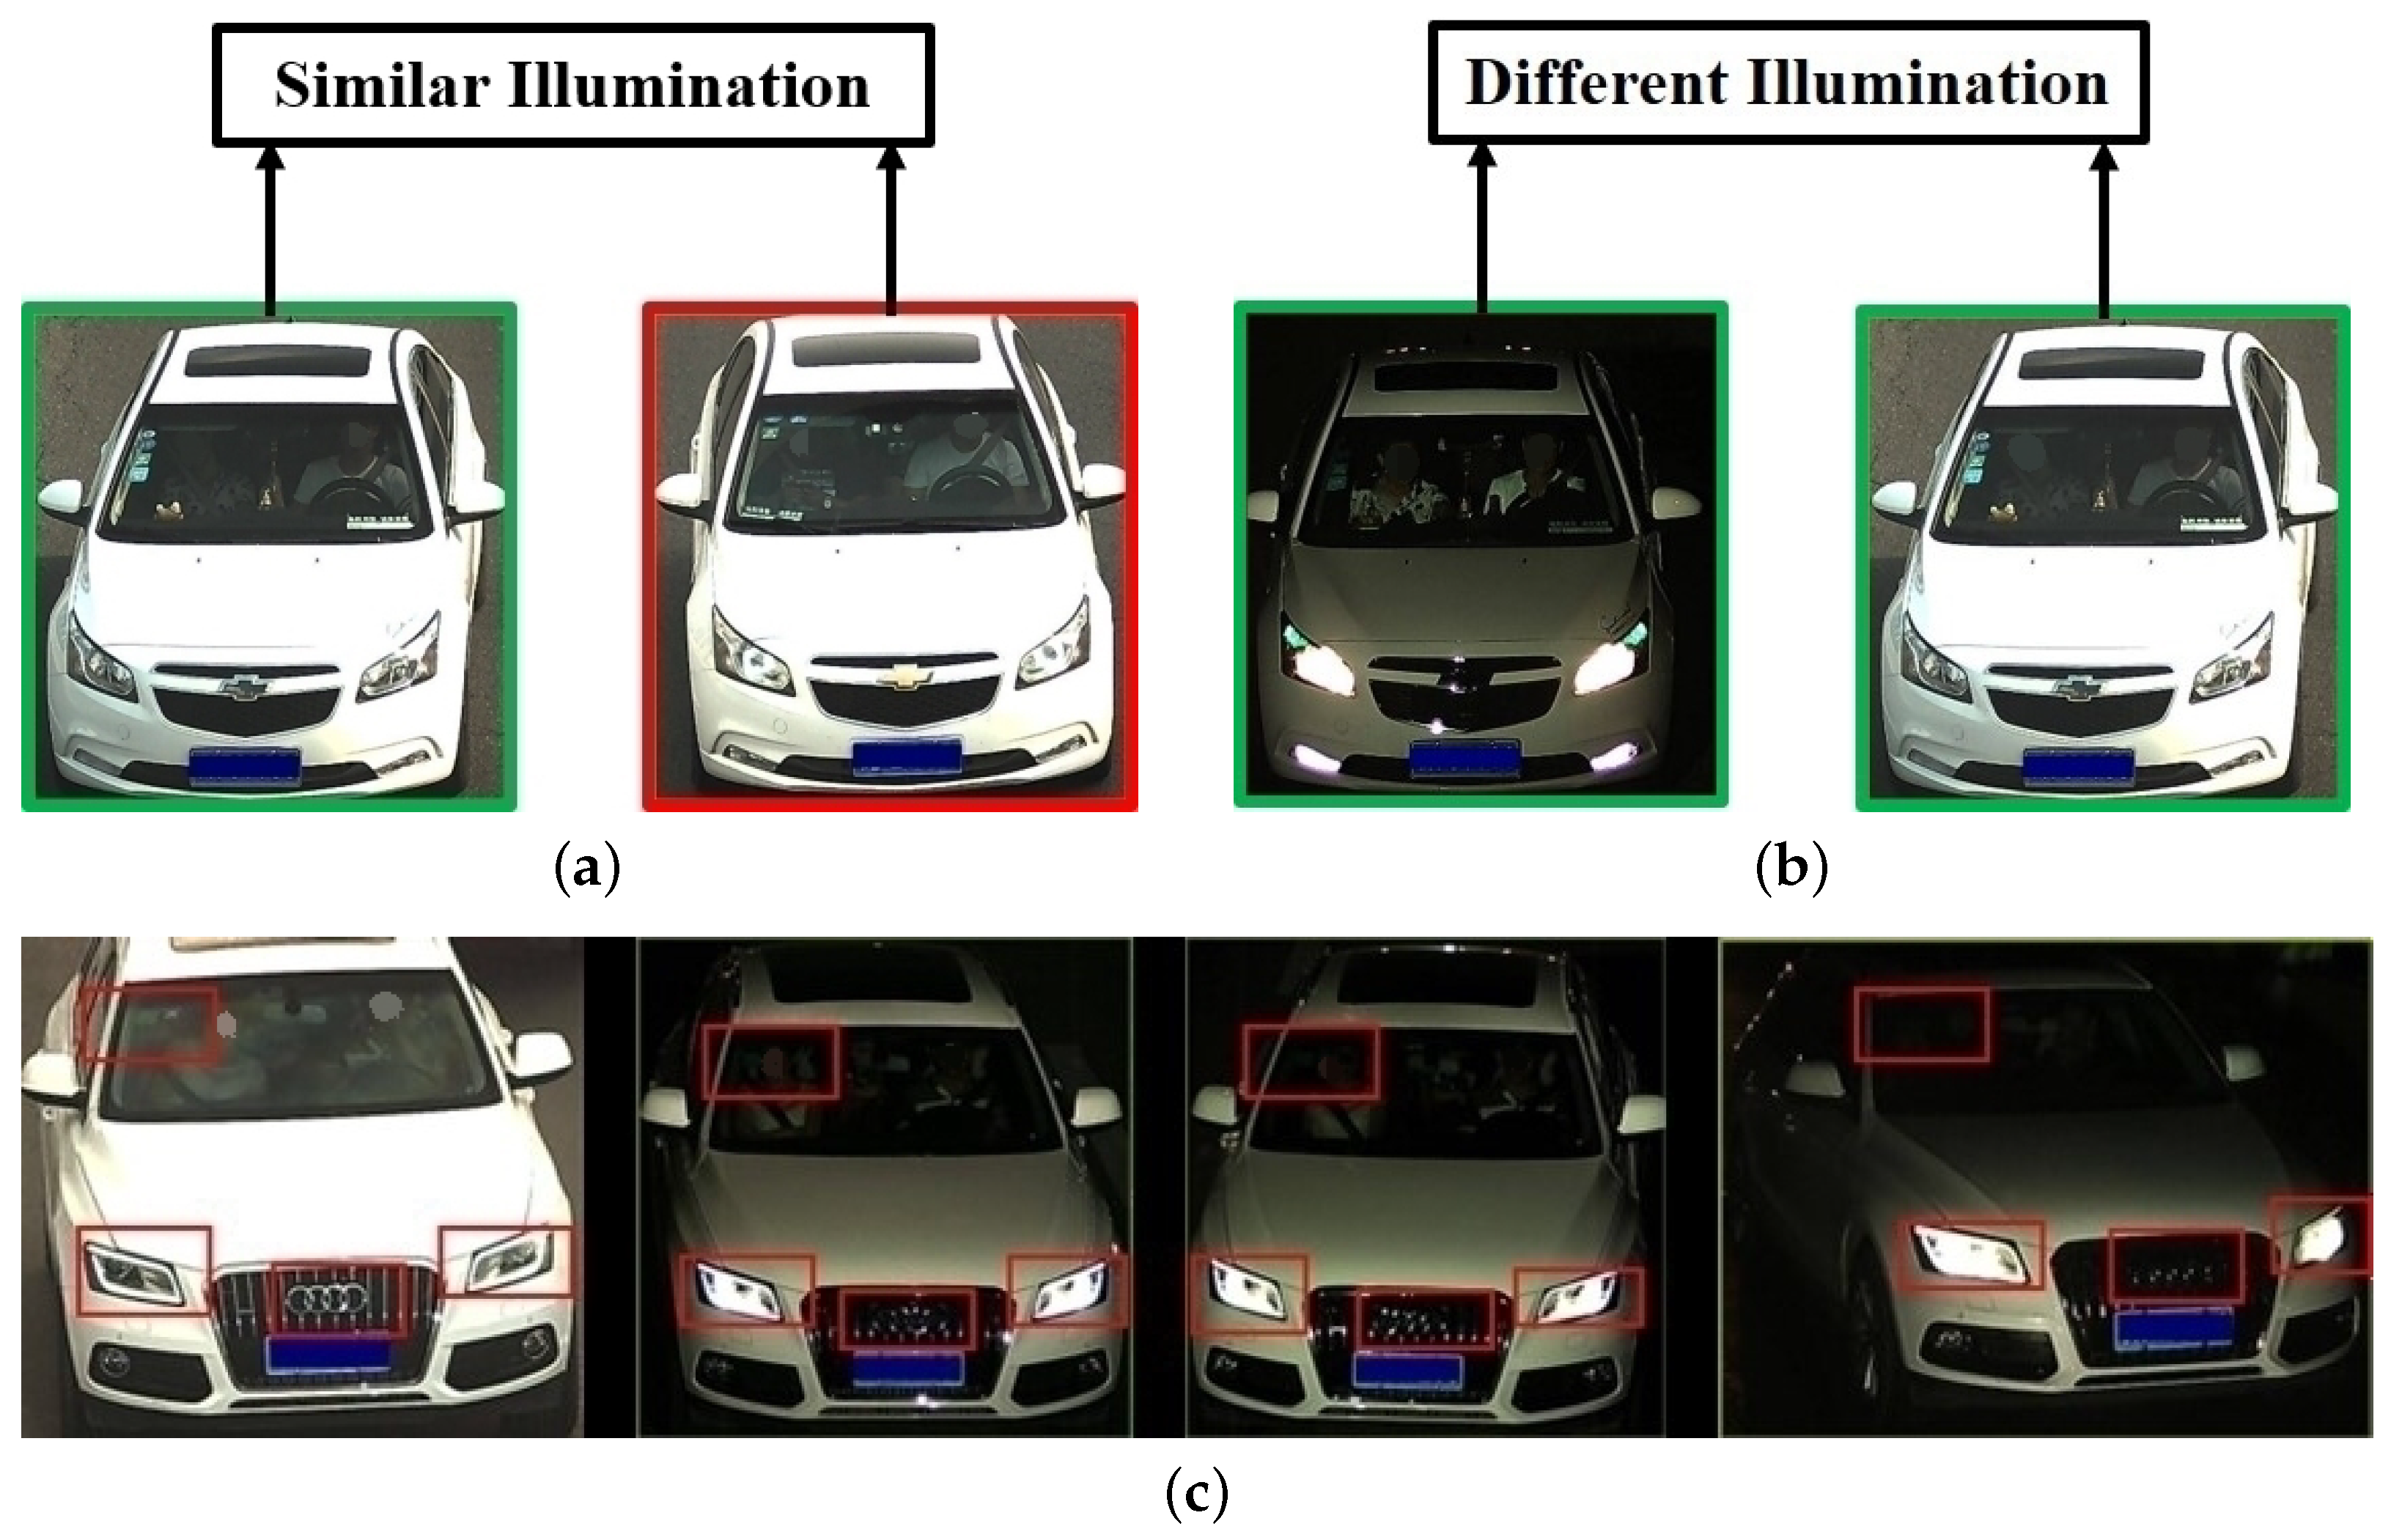
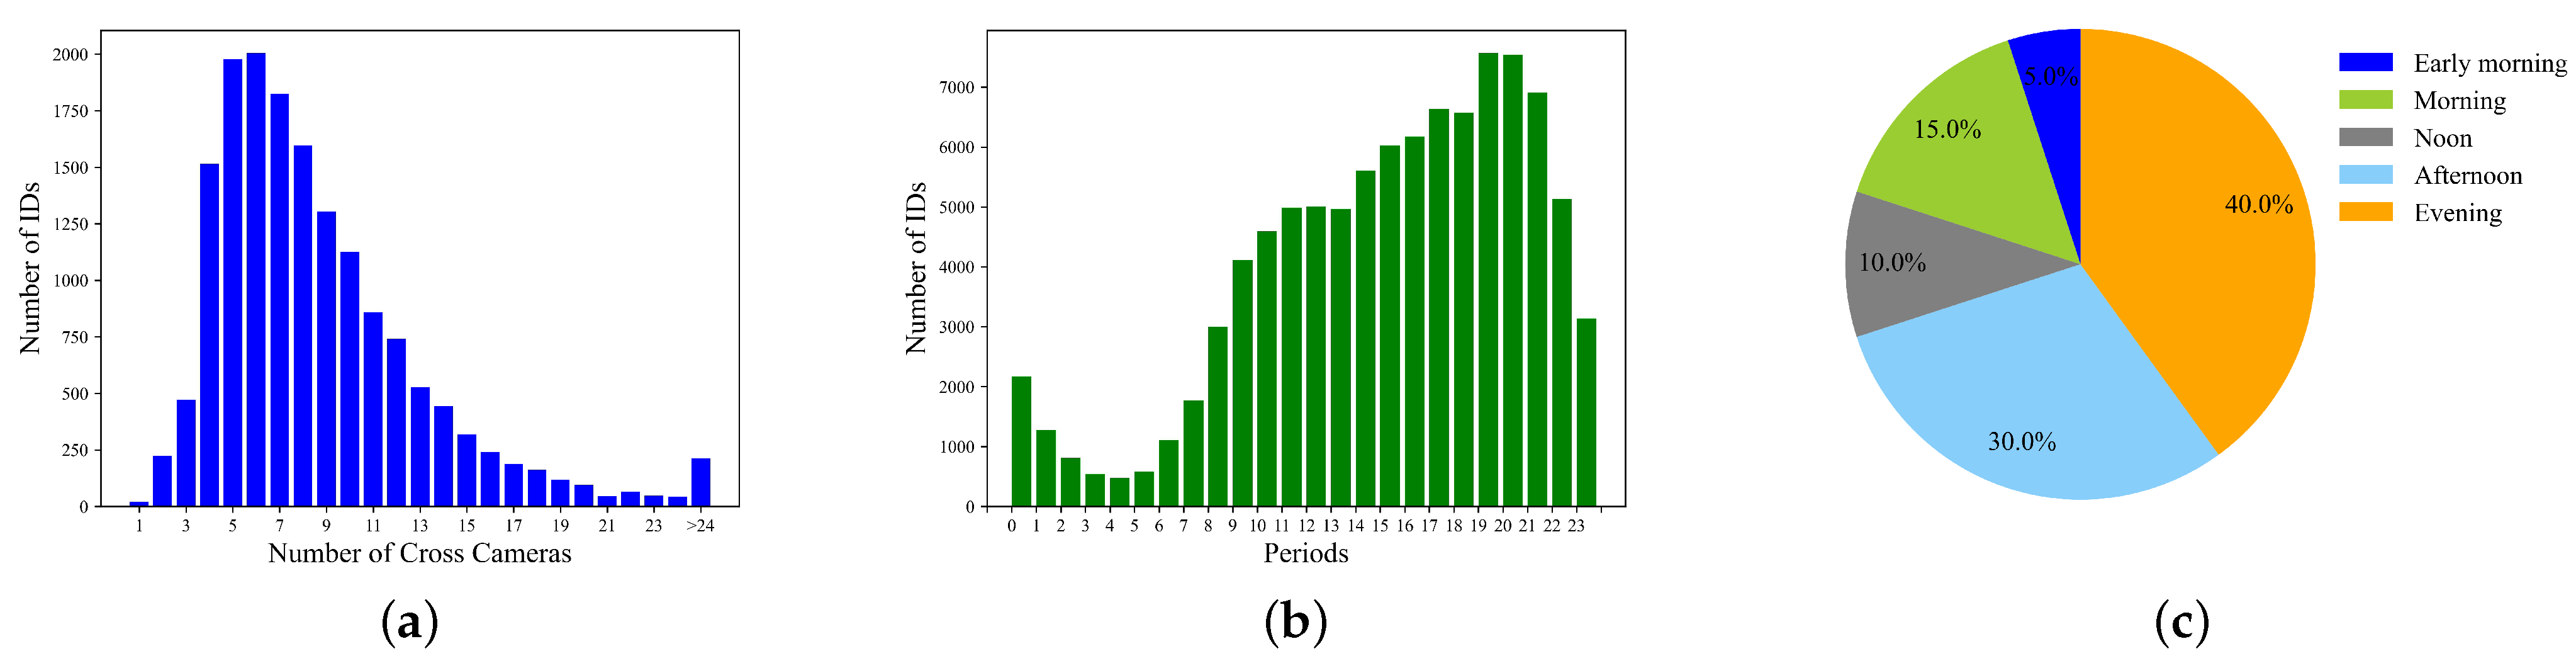
25], we propose an illumination-aware network that learns two separate deep metrics for S-IL and D-IL samples. A coarse-grained classification was included to divide the images into two distinct illumination types. We then employed IANet to learn illumination-specific metrics via the explicitly modeling of lighting conditions. Since it is difficult to manually annotate real-world environments with fine-grained labels, coarse-grained labels were assigned to the images (i.e., daytime and nighttime). Images including annotated timestamps ranging from 06:00 to 18:00 were labeled daytime, and those spanning from 18:00 to 06:00 were labeled nighttime. Datasets lacking a timestamp were categorized using an illumination predictor trained on VERI-DAN samples. Images with the same illumination label were denoted as S-IL pairs, and those with different labels were denoted as D-IL pairs. This convention produced four types of image pairs: P s + (S-IL positive), P d + (D-IL positive), P s (S-IL negative), and P d (D-IL negative).
Images were mapped into two distinct illumination-specific feature spaces using two convolutional branches with identical structures, which did not share any parameters. Each branch layer could be viewed as a function for illumination-specific feature extraction (i.e., f s and f d ). For each image in a mini-batch, IANet generated two distinct features using b r a n c h _ s i m i and b r a n c h _ d i f f , as illustrated in Figure 3. Pair-wise distances in the S-IL feature space were then calculated from D S ( P ) = | | f s ( x i ) f s ( x j ) | | 2 , and distances in the D-IL feature space were determined by D d ( P ) = | | f d ( x i ) f d ( x j ) | | 2 . Equation (1) was decomposed into two types of constraints: within-space and cross-space constraints. The within-space constraints expect D s ( P s + ) to be smaller than D s ( P s ) in the S-IL feature space, and D d ( P d + ) to be smaller than D d ( P d ) in the D-IL feature space. The cross-space constraints expect D d ( P d + ) to be smaller than D s ( P s ) , and D s ( P s + ) to be smaller than D d ( P d ) .
Within-space constraints: Two triplet loss terms were introduced, one in each of the S-IL and D-IL feature spaces, to ensure that positive samples were closer to each other than negative samples. Triplet loss in the S-IL feature space was defined as follows:
L s = max { D s ( P s + ) D s ( P s ) + α , 0 } ,
and in the D-IL feature space as follows:
L d = max { D d ( P d + ) D d ( P d ) + α , 0 } .
Within-space constraints were then implemented through a summation of L s and L d as follows:
L w i t h i n = L s + L d .
Within each illumination-specific feature domain, the correlating loss function operated solely on illumination-specific samples. In other words, we used only S-IL pairs to calculate L s , while L d was optimized solely by D-IL pairs.
Cross-space constraints: Focusing solely on single-feature spaces runs the risk of underestimating the complex issue of illumination variability, which in turn could limit re-ID accuracy. As such, we further proposed cross-space constraints between ( P s , P d + ) and ( P s + , P d ), which were implemented using the following triplet loss function:
L c r o s s = max { D d ( P d + ) D s ( P s ) + α , 0 } + max { D s ( P s + ) D d ( P d ) + α , 0 } .
Loss functions in the Stage I model: The total triplet loss enforced in the first stage can then be expressed as follows:
L = L w i t h i n + L c r o s s .

3.3. Detail-Aware Discriminative Feature Learning

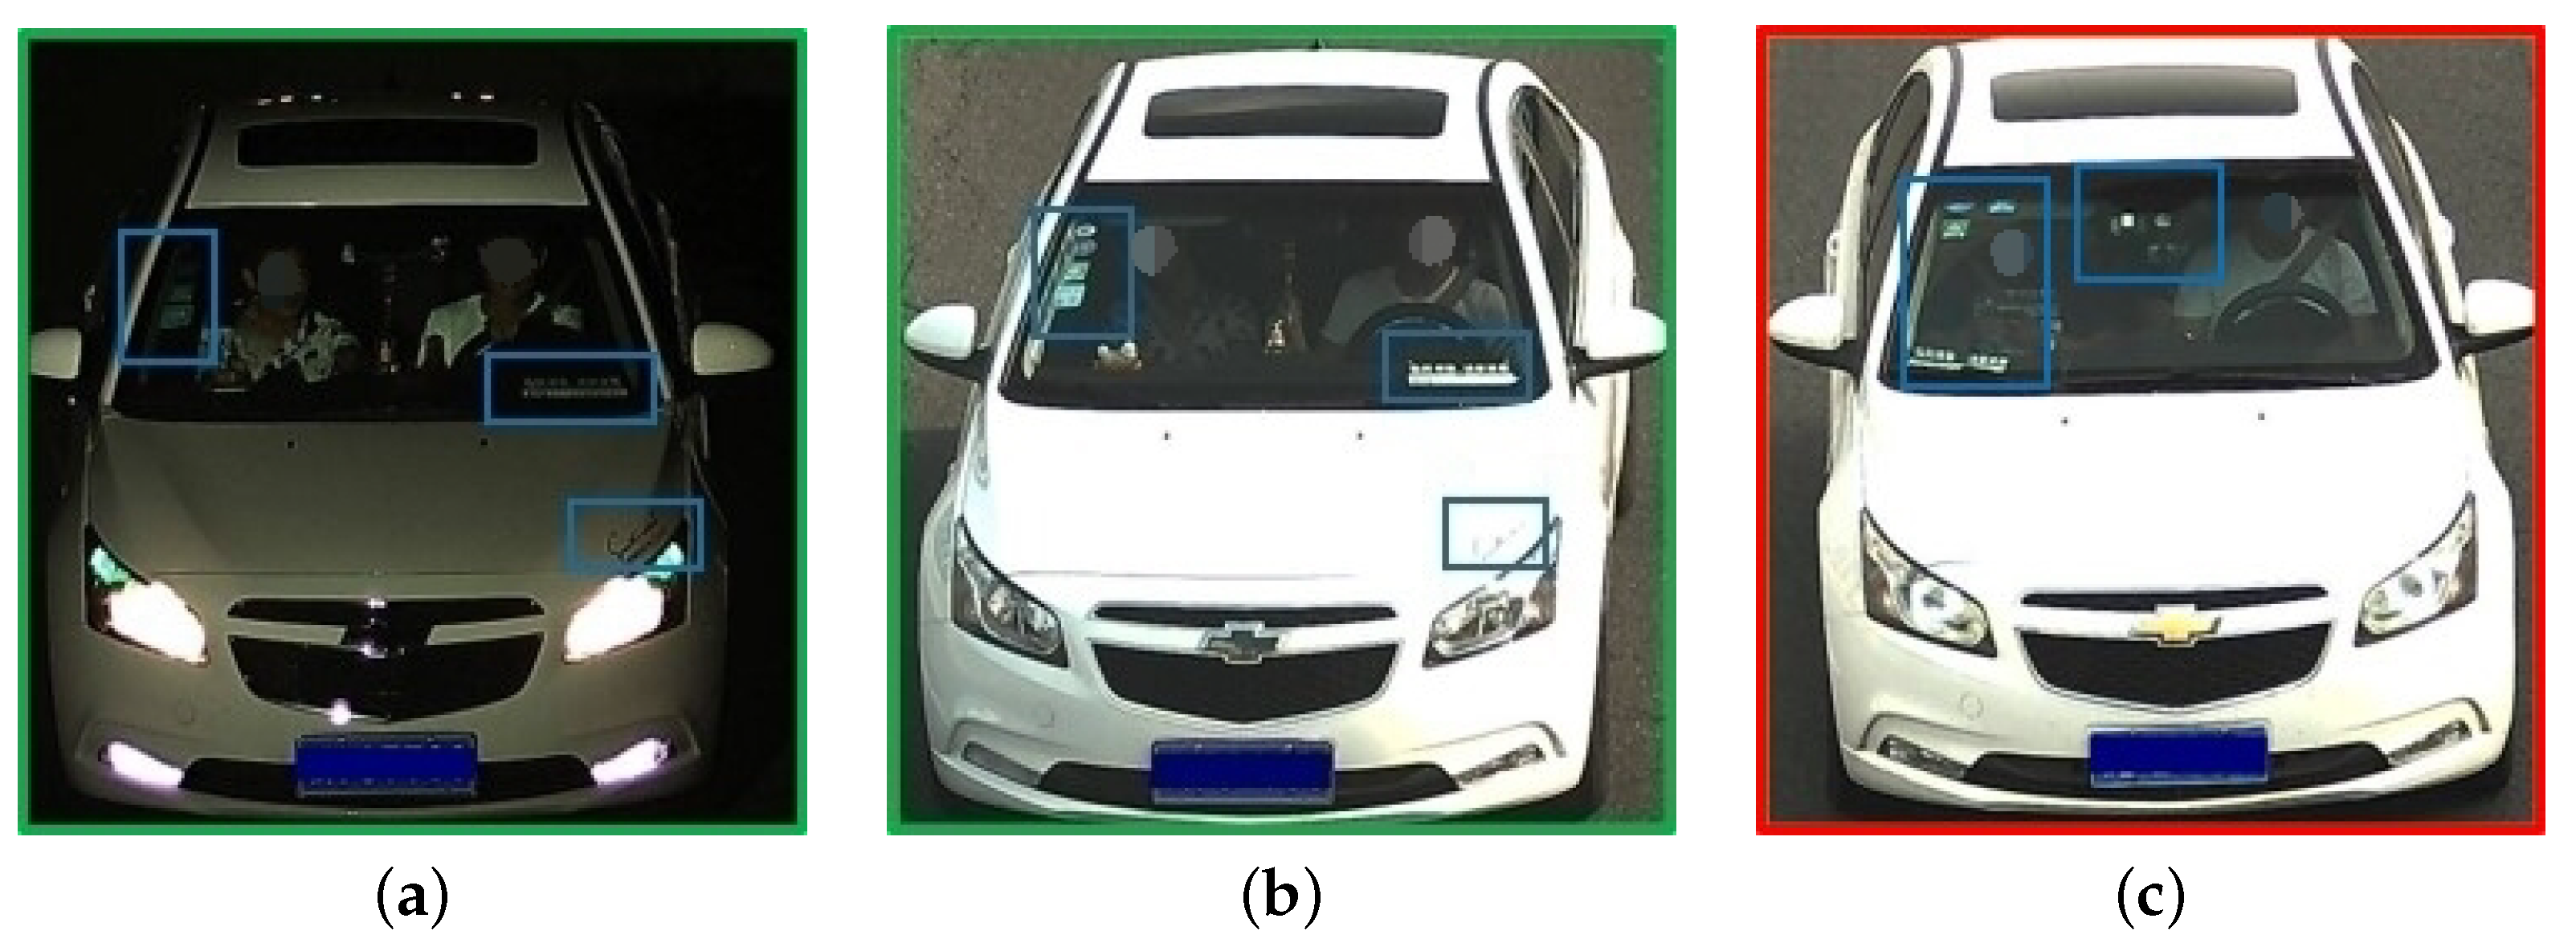
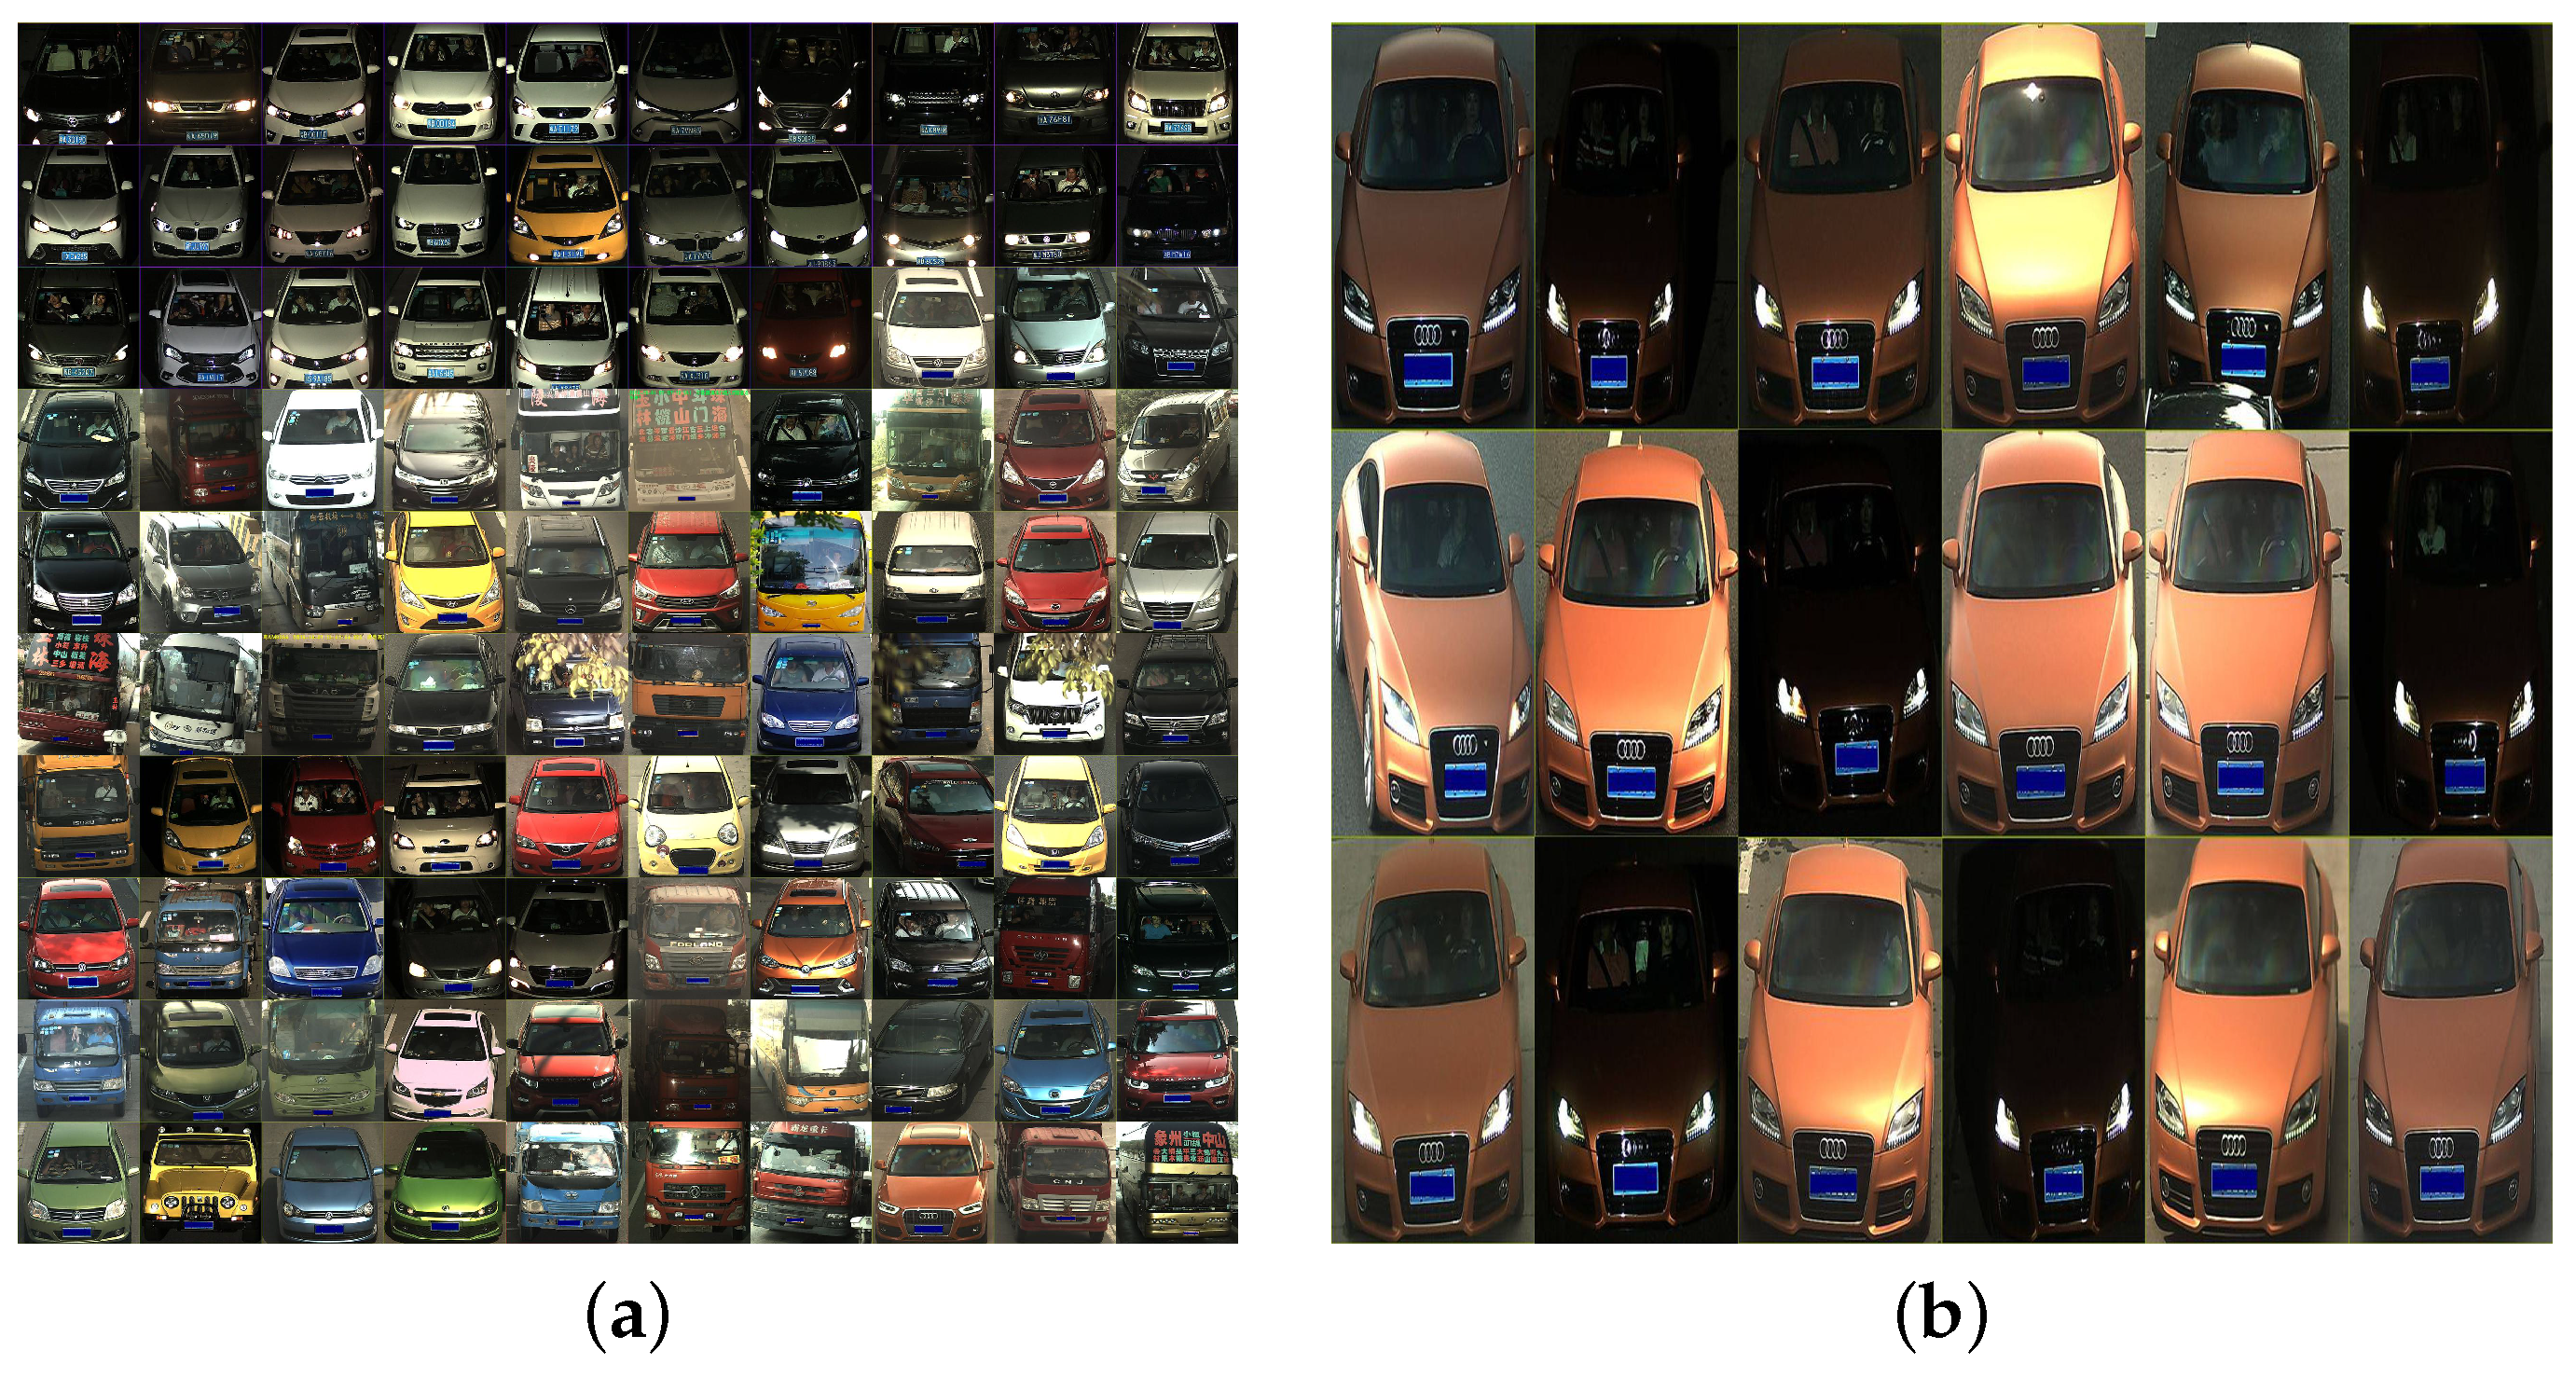
We observed that vehicles with similar appearances often exhibited differences in localized regions, such as windshield decorations, as depicted in Figure 2. Thus, we suggested that re-ID accuracy could be improved by enhancing an algorithm’s capacity to capture these distinctive local details in the second stage. The neural network encoded images in a progressive process [31,32], beginning with fine-grained details and gradually expanding to local and global information. Thus, mid-level features from the middle layers of the network facilitated the extraction of local area features for the vehicle. As such, based on this approach, we proposed a detail-aware discriminative feature learning process for vehicle re-ID. This process incorporated a local feature extraction module with attention mechanisms included to extract local features. Local constraints were then introduced to guide the generation of these features and devise an illumination-balanced sampling strategy to optimize local constraints.
Attention-guided local feature extraction module (AG): Different vehicle parts play varying roles in distinguishing among vehicles that are similar in appearance. Specifically, areas such as a car logo or windshield, for which marked dissimilarities exist between individual vehicles, are more important than common features, such as doors and hoods. To this end, we introduced an attention mechanism to learn from these distinctive areas. This attention-guided process consisted of a detail-aware local feature extraction module (DAM) and an illumination-aware local feature extraction module (IAM), as illustrated in Figure 4.
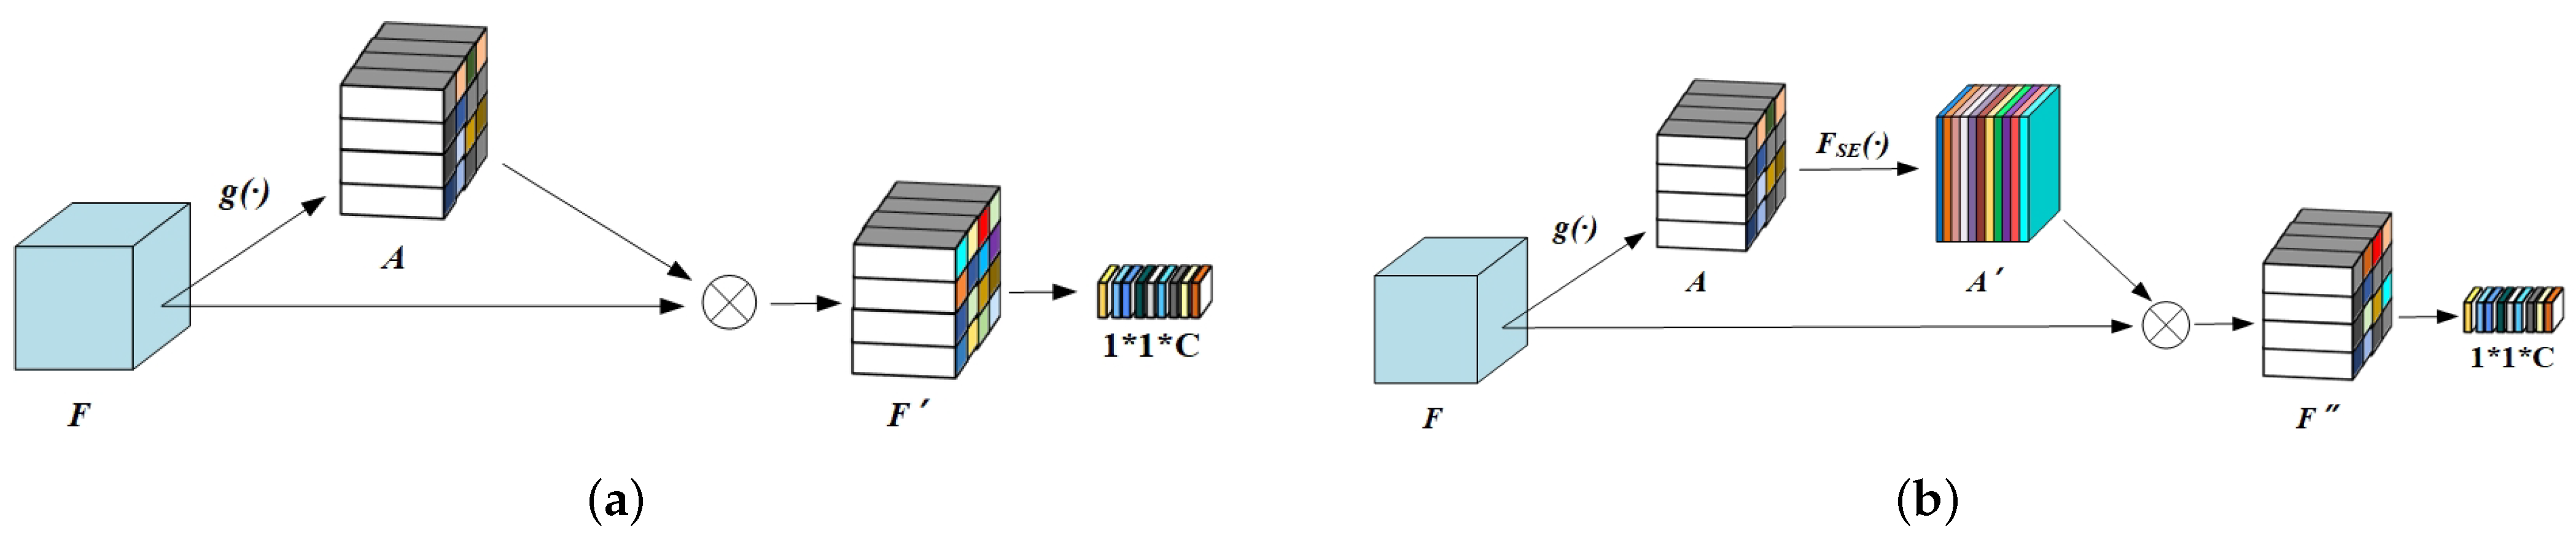
The DAM generated detail-aware discriminative local features to enforce local constraints, as shown in Figure 4a. Mid-level features are denoted in the figure by F, with dimensions H × W × C , where H, W, and C represent the height, width, and number of channels in the feature layer, respectively. The attention local feature map F was then generated with the following equation:
F = A F = σ ( g ( F ) F ) ,
where g ( · ) is a convolution kernel, σ is the sigmoid function, and ⊗ denotes element-wise multiplication between two tensors. Global maximum pooling was then applied to F to produce the final local feature vector (i.e., l o c a l f e a t u r e s in Figure 3). Each channel in F represents a specific vehicle region, and spatial points within the vector indicate the significance of each region. In this way, the incorporated attention map was able to guide the network’s focus toward the significant areas of each vehicle.
As demonstrated in Figure 4b, IAM generated two different types of local features that were discriminative in S-IL and D-IL feature spaces, respectively. The appearance of certain distinguishing areas, such as headlights, differed significantly as the illumination changed. In other words, specific visual cues may become more or less significant in different feature spaces. To this end, we further introduced squeeze and excitation modules [33] to identify illumination-specific local features for the S-IL and D-IL space. The corresponding feature map F is obtained as follows:
F = A F = F S E ( A ) F = σ ( F S E ( g ( F ) ) F ) ,
where F S E denotes the squeeze-and-excitation block. Consequently, we obtained two different local features from IAM (i.e., l o c a l _ s i m i and l o c a l _ d i f f ), as shown in Figure 3. We then employed the union of illumination-specific local features with global features (extracted from the branch network) to enforce within-space and cross-space constraints. This process was distinguished from the formulation defined in Section 3.2 by using L S , L D , and L C R O S S to denote corresponding loss terms calculated from the fusion features.
Detail-aware local constraints: In real-world scenarios, differences between vehicles of the same model were concentrated primarily in regions such as inspection marks and personalized decorations. As such, training a triplet loss function using hard negatives from the same vehicle model served as a guiding mechanism that directed network attention toward relevant discriminative local regions. In the following notation, x m denotes a vehicle belonging to model m. A typical triplet in the local constraints is denoted by ( x m , x m + , x m ), where x m and x m + exhibit the same ID, while x m has a different ID but shares a model type with x m and x m + . Following these definitions, P m + (same-model positive pair) and P m (same-model negative pair) are denoted as ( x m , x m + ) and ( x m , x m ), respectively. Formally, local constraints were enforced through triplet loss as follows:
L l = L l ( x m , x m + , x m ) = max { D ( P m + ) D ( P m ) + β , 0 } ,
where β is a margin enforced between positive and negative pairs. All negative samples in the proposed local constraints shared a model type with the anchor, which was conducive to guiding the generation of discriminative local features. Note that L _ l is an advanced version of L _ c r o s s , since different vehicles of the same model were prone to generate the hardest negatives in S-IL and D-IL feature spaces. Thus, we removed L C R O S S from the final model after introducing local constraints.
Loss functions in the Stage II model: The total triplet loss function in the Stage II model can be expressed as follows:
L = L S + L D + L l .
Illumination-balanced sampling strategy: Maintaining a balance between S-IL and D-IL pairs is necessary in a mini-batch to train an illumination-aware network against variations in lighting. However, in most cases, the number of daytime images in each mini-batch is much larger than that of the nighttime images. As a result, the network may tend to learn from images captured in the daytime and may not be able to identify a robust correlation among samples with different illumination. To address this issue, we designed a function to ensure that each vehicle provided an equal number of images for both types of lighting. Specifically, the algorithm selected N daytime images and N nighttime images for each vehicle ID in a minibatch. If a vehicle ID exhibited fewer than N daytime images, the algorithm duplicated these samples to produce N images. The effectiveness of this balanced sampling strategy will be illustrated in Section 5.4.2.

3.4. Training and Inference

TSPL expressed the fusion of local features with global features extracted from “branch_conv” as joint vehicle features, as demonstrated in Figure 3. During training, “branch_conv” output dual global features for each image in different feature spaces (i.e., g l o b a l _ s i m i in S-IL and g l o b a l _ d i f f in D-IL). In contrast, IAM output dual illumination-specific local features to form joint representation with global features (i.e., l o c a l _ s i m i and l o c a l _ d i f f ). DAM then output detail-aware local features to optimize the local constraints. Given N input images, TSPL generated two illumination-specific distance matrices containing N × N distance value elements (i.e., matrix1 and matrix2). Only D s ( P s ) and D d ( P d ) (denoted by the green and brown cells in Figure 3) contributed to L S and L D loss, respectively. TSPL also generated a local distance matrix containing N × N distance value elements calculated from local features. Distances from the same model (denoted by the colored cells in matrix3) were then used to calculate the triplet loss L l and to enforce detail-aware local constraints.
Note that L C R O S S was not incorporated into the final model but was a component of the ablation study. The generation of L C R O S S was illustrated by the red dashed line box shown in Figure 3. In the f u s i o n m a t r i x , the green cells were related to S-IL pair distance values in matrix1, while the brown cells were related to D-IL distance values in matrix2. During the testing phase, a specific procedure was followed based on the illumination conditions of query and gallery images. If these images were identified as a S-IL pair, their distance was calculated by D s ( P s ) using a S-IL branch; otherwise, D d ( P d ) was employed through a D-IL branch. Distances were also calculated from local features and the union of these results provided joint distances between the query and gallery images.

4. The VERI-DAN Dataset

Existing re-ID datasets either exhibit limited illumination variability or lack annotations to quantify luminance. Therefore, we carefully constructed the VERI-DAN dataset to provide a variety of lighting conditions for each vehicle. The set included 200,004 total images from 16,654 vehicles, collected by 120 cameras in a large urban district in natural environments. Statistics for this dataset are provided in Figure 5 and sample images are shown in Figure 6a. Table 3 presents a comparison of VehicleID [28], VeRI-776 [12], VERI-Wild [29], Vehicle-1M [30], and VERI-DAN. The distinctive properties of VERI-DAN can be summarized as follows:
Balanced illumination conditions: VERI-DAN was generated from 120 × 24 × 8 = 23,040 h of video footage collected in various illumination conditions. Specifically, every vehicle appeared multiple times in both daytime and nighttime settings, as shown in Figure 6b.
Refined model information: We meticulously annotated each image with one of 482 refined vehicle classes, denoting the make, model, color, and year (e.g., “Audi-A6-2013”). VERI-DAN included many similar vehicles of the same model, which facilitated the training of a network to differentiate hard negative samples.
Spatio-temporal geographic coordinate information (S-T): Details such as camera ID, timestamp, and geodetic coordinates were provided to facilitate research based on camera networks [34,35,36].

5. Experiments

5.1. Datasets

We evaluated the proposed method using the VERI-DAN and Vehicle-1M datasets, both of which included vehicles exhibiting significant illumination changes. Following a common practice [28], we divided VERI-DAN into a training set (141,470 images from 13,454 vehicles) and a test set, which contained the remaining 58,534 images from 4800 vehicles. We further divided the test set into three subsets, denoted Small, Medium, and Large, as shown in Table 4.

5.2. Evaluation Protocols

During evaluation, we followed the protocol proposed by Liu et al. [12,28], in which mean average precision (mAP) and cumulative matching characteristics (CMC) were used as performance metrics. CMC estimates the probability of finding a correct match in the top K returned results, while MAP is a comprehensive index that considers both the precision and recall of the results. The final CMC and mAP values were averaged over 10 iterations.

5.3. Implementation Details

We adopted the InceptionV3 [37] network as the backbone model. All layers preceding the Inception (7a) module were implemented as “share conv”, and layers ranging from Inception (7a) to the global average pooling layer were appended as “branch conv”. Since mid-level features facilitated the extraction of discriminative local vehicle features, we added an attention module to the Inception (5d) layers to generate local feature maps of dimensions 35 × 35 × 288 . The input images were then resized to 299 × 299 without augmentation, using processes such as color jitter and horizontal flip. The model was trained for 120 epochs using the Adam optimizer with a momentum of 0.9 and a weight decay of 0.05. The learning rate was initialized to 0.001, and decreased by a factor of 0.1 every 20 epochs. The margins α and β were both set to 1.0. Each mini-batch contained 128 images (32 IDS, each with 4 images) on VERI-DAN as well as on Vehicle-1M. We adopted a batch hard-mining strategy to reduce the triplet loss.
The illumination predictor was trained using cross-entropy based on InceptionV3. We coarsely categorized all images into two illumination classes: daytime and nighttime. The daytime—daytime and nighttime—nighttime samples were then defined as the S-IL pairs, and the daytime—nighttime samples were defined as the D-IL pairs. In addition to triplet loss, we incorporated cross-entropy loss into the model to learn differences between the individual vehicle models, drawing inspiration from several existing re-ID methods [1,25,38]. Specifically, we appended the model classifier into the feature-embedding layer. The classifier was then implemented with a fully connected layer and a softmax layer. The output of the softmax was supervised by the model labels applied to the training images, and optimized by the cross-entropy loss step.

5.4. Ablation Study

We conducted ablation studies on the two large-scale datasets to validate the effectiveness of the proposed strategies both quantitatively and qualitatively. We provided a detailed analysis of the impacts arising from constraints in Section 5.4.1 and the sampling strategy in Section 5.4.2, respectively.

5.4.1. Constraint Influence

We conducted a series of comparison experiments to validate the effectiveness of the included illumination-aware metric learning and detail-aware discriminative feature learning. Specifically, we performed comprehensive ablation studies on combinations of L l with L w i t h i n and L c r o s s . This was carried out to verify the benefits of fusing global and local features, as demonstrated in Table 5. Note that T S P L 3 and T S P L 3 used the same model to generate features, although T S P L 3 did not consider local features when calculating distances. It is evident from the table that our proposed strategy significantly improved vehicle re-ID performance over the baseline method.
IANet produced significant improvements despite relatively coarse-grained illumination classification. Comparing IANet with the single-branch baseline demonstrated Rank-1 accuracy improvements of +6.74% for Vehicle-1M and +2.57% for VERI-DAN. Consistent performance improvements across both datasets confirmed the effectiveness of a multi-branch network following the proposed progressive strategy.
Local constraints provide significant benefits for vehicle re-ID. Every variation of IANet, with the introduction of local constraints (i.e., TSPL1, TSPL2, and TSPL3) produced considerable improvements over IANet. Specifically, compared with IANet, local constraints yielded Rank-1 accuracy improvements of +3.69% for Vehicle-1M and +0.72% for VERI-DAN. In addition, combining either L w i t h i n or L c r o s s with L l o c a l resulted in better performance than the combination of within-space and cross-space constraints. Combining cross-space constraints and local constraints resulted in Rank-1 accuracy increases of +2.91% for Vehicle-1M and +0.57% for VERI-DAN. The joint optimization of within-space and local constraints produced similar results, that is, +4.37% for Vehicle-1M and +0.71% for VERI-DAN. T S P L 3 achieved the best performance, while T S P L 3 outperformed IANet by ∼1.8% (Rank-1 accuracy), even when local features were not involved in distance matrix calculations during testing. This result suggested that local constraints, which focus on extracting and leveraging local fine-grained visual cues, are also well suited for processing the variations and challenges introduced by illumination.
Within-space constraints are critical for re-ID. We observed a performance degradation when comparing T S P L 2 with T S P L 1 (−0.78% Rank-1 accuracy for Vehicle-1M and −0.15% Rank-1 accuracy for VERI-DAN.) In contrast, either T S P L 3 or T S P L 3 achieved better performance than T S P L 2 and T S P L 1 . This was reasonable because without within-space constraints, TSPL was not able to learn from two relatively common scenarios: both the positive pairs and the negative pairs are observed under S-IL (or D-IL). We thus inferred that within-space constraints played a critical role in enhancing the retrieval capacity.

5.4.2. Sampling Strategy Influence

We developed a special test set to validate the importance of maintaining a balance between S-IL and D-IL pairs during training. All query and gallery samples were D-IL pairs, as summarized in Table 6. For each individual in a mini-batch, a ratio of 1:3 indicated that one image was captured during the daytime, while the other three images were taken during the nighttime. As demonstrated in Table 6, both the baseline and IANet achieved the best performance when this ratio was 2:2. This outcome suggested that maintaining an illumination-balanced sampling strategy was beneficial for query retrieval from the D-IL gallery.

5.5. Comparison with SOTA Methods

We compared the proposed method with a variety of SOTA vehicle re-ID methods on VERI-DAN and Vehicle-1M. We used InceptionV3 [37] as our baseline model, which was pretrained on ImageNet [39]. C2F-Rank [30] designed a multi-grain ranking loss to efficiently learn feature embedding with a coarse-to-fine structure. GSTN [40] automatically located vehicles and performed division for regional features to produce robust part-based features for re-ID. DFR-ST [13] involved appearance and spatio-temporal information to build robust features in the embedding space. DSN [41] utilized a cross-region attention to enhance spatial awareness of local features. The comparison results on the two datasets are detailed in Section 5.5.1 and Section 5.5.2, respectively.

5.5.1. Evaluation with VERI-DAN

We verified the effectiveness of the proposed methodology in the presence of significant illumination changes by conducting comprehensive validation experiments using the VERI-DAN dataset, while also drawing comparisons among the InceptionV3 [37], IANet, and TSPL. As shown in Table 7, TSPL achieved significant improvements in Rank-1 accuracy and mAP over the baseline. The superiority of TSPL was evident through visual inspection as well, as illustrated in Figure 7. When compared with the baseline, we observed that TSPL could identify more correct matches among retrieved ranking lists in which the correct matches had lower rank values.

5.5.2. Evaluation with Vehicle-1M

We selected a group of 6448 (out of 50,000) vehicles in Vehicle-1M, whose images involved a variety of illumination conditions, as the training set. TSPL was compared with a variety of SOTA methods developed in recent years, including C2F-Rank [30], GSTN [40], DFR-ST [13], and DSN [41], as shown in Table 8. Despite the limited utilization of training samples, TSPL achieved remarkably competitive performance without any modified training strategies or additional detection modules. Specifically, compared with the second-place method, TSPL achieved +1.83%, +1.46%, and +1.66% Rank-1 improvements for the small, medium, and large test sets, respectively. This outcome demonstrated the superiority of the proposed two-stage progressive learning framework. Re-ranking and data augmentation may further improve performance.

6. Conclusions

To address the challenging problem posed by dramatic changes in illumination, we proposed a novel two stage-progressive learning (TSPL) strategy for vehicle re-identification. This technique consisted of illumination-aware metric learning and detail-aware discriminative feature learning. Unlike existing methods that only learn a single metric for all types of lighting conditions, Stage I of TSPL aimed to learn proper vehicle representations under different illumination conditions using a two-branch network called IANet, which learned two separate metrics for images with similar and differing illumination conditions. By enforcing corresponding constraints (i.e., within-space constraints and cross-space constraints), IANet improved re-ID accuracy when retrieving D-IL images. Stage II in TSPL enabled the network to learn discriminative local features through an attention guided local feature extraction module (AG), which was optimized by local constraints. The proposed attention module not only facilitated the distinguishing of vehicles with similar appearances but also increased the associated robustness against variations in illumination. Additionally, the large-scale VERI-DAN was developed as part of the study, to provide images with significant changes in lighting. VERI-DAN is expected to facilitate the development of new re-ID methods by suppressing the distractions introduced by variable illumination. The implementation of each proposed metric learning strategy consistently improved re-ID performance with both VERI-DAN and Vehicle-1M, which further verified the effectiveness of TSPL. Despite the limited number of training samples in Vehicle-1M, TSPL achieved SOTA Rank-1 accuracy for the original test set, thereby demonstrating the superiority of this approach.

Author Contributions

Conceptualization, Z.W., Z.J. and X.L.; methodology, Z.W., Z.J. and X.L.; software, Z.W.; validation, Z.W., Z.J. and X.L.; formal analysis, Z.W.; investigation, Z.W.; resources, X.L.; data curation, Z.W.; writing—original draft preparation, Z.W.; writing—review and editing, Z.W., Z.J. and X.L.; visualization, Z.W.; supervision, Z.J. and X.L.; project administration, Z.J. and X.L.; funding acquisition, X.L. All authors have read and agreed to the published version of the manuscript.

Funding

This research was funded by the National Natural Science Foundation of China (grant No. U21B2090) and Natural Science Foundation of Guangdong Province, China (grant No. 2022A1515010361).

Data Availability Statement

The data presented in this study are available in the article. VERI-DAN is available at http://www.openits.cn/openData4/825.jhtml (accessed on 8 November 2023).

Conflicts of Interest

The authors declare no conflict of interest.

Abbreviations

The following abbreviations are used in this manuscript:
P = ( x i , x j ) An image pair consists of image x i and x j
D ( x i , x j ) Euclidean distance between x i and x j
x, x + , and x x and x + share the same vehicle ID, while x and x have different vehicle ID
S-ILSimilar-illumination
D-ILDifferent-illumination
P s + S-IL positive
P d + D-IL positive
P s S-IL negative
P d D-IL negative
P m + same-model positive pair
P m same-model negative pair
AGAttention-guided local feature extraction module
CMCCumulative matching characteristics
DAMDetail-aware local feature extraction module
IAMIllumination-aware local feature extraction module
IANetIllumination-aware network
mAPMean average precision
re-IDRe-identification
SOTAState-of-the-art
S-TSpatio-temporal geographic coordinate information
TSPLTwo-stage progressive learning
VERI-DANVehicle re-identification across day and night

References

  1. Tang, Z.; Naphade, M.; Liu, M.-Y.; Yang, X.; Birchfield, S.; Wang, S.; Kumar, R.; Anastasiu, D.; Hwang, J.-N. CityFlow: A city-scale benchmark for multi-target multi-camera vehicle tracking and re-identification. In Proceedings of the 2019 IEEE/CVF Conference on Computer Vision and Pattern Recognition (CVPR), Long Beach, CA, USA, 15–20 June 2019; IEEE: New York, NY, USA, 2019; pp. 8789–8798. [Google Scholar]
  2. Yang, H.; Cai, J.; Zhu, M.; Liu, C.; Wang, Y. Traffic-informed multi-camera sensing (TIMS) system based on vehicle re-identification. IEEE Trans. Intell. Transp. Syst. 2022, 23, 17189–17200. [Google Scholar] [CrossRef]
  3. Chen, X.; Yu, H.; Zhao, F.; Hu, Y.; Li, Z. Global-local discriminative representation learning network for viewpoint-aware vehicle re-identification in intelligent transportation. IEEE Trans. Instrum. Meas. 2023, 72, 1–13. [Google Scholar] [CrossRef]
  4. Lore, K.G.; Akintayo, A.; Sarkar, S. LLNet: A deep autoencoder approach to natural low-light image enhancement. Pattern Recognit. 2017, 61, 650–662. [Google Scholar] [CrossRef]
  5. Jiang, Y.; Gong, X.; Liu, D.; Cheng, Y.; Fang, C.; Shen, X.; Yang, J.; Zhou, P.; Wang, Z. EnlightenGAN: Deep light enhancement without paired supervision. IEEE Trans. Image Process. 2021, 30, 2340–2349. [Google Scholar] [CrossRef]
  6. Guo, C.; Li, C.; Guo, J.; Loy, C.C.; Hou, J.; Kwong, S.; Cong, R. Zero-reference deep curve estimation for low-light image enhancement. In Proceedings of the 2020 IEEE/CVF Conference on Computer Vision and Pattern Recognition (CVPR), Seattle, WA, USA, 13–19 June 2020; IEEE: New York, NY, USA, 2020; pp. 1777–1786. [Google Scholar]
  7. Liu, Z.; Wang, K.; Wang, Z.; Lu, H.; Yuan, L. PatchNet: A tiny low-light image enhancement net. J. Electron. Imaging 2021, 30, 033023. [Google Scholar] [CrossRef]
  8. Chen, Y.; Xia, R.; Zou, K.; Yang, K. FFTI: Image inpainting algorithm via features fusion and two-steps inpainting. J. Vis. Commun. Image Represent. 2023, 91, 103776. [Google Scholar] [CrossRef]
  9. Watson, G.; Bhalerao, A. Person re-identification using deep foreground appearance modeling. J. Electron. Imaging 2018, 27, 1. [Google Scholar] [CrossRef]
  10. Zapletal, D.; Herout, A. Vehicle re-identification for automatic video traffic surveillance. In Proceedings of the 2016 IEEE Conference on Computer Vision and Pattern Recognition Workshops (CVPRW), Las Vegas, NV, USA, 26 June–1 July 2016; IEEE: New York, NY, USA, 2016; pp. 1568–1574. [Google Scholar]
  11. Liu, X.; Liu, W.; Ma, H.; Fu, H. Large-scale vehicle re-identification in urban surveillance videos. In Proceedings of the 2016 IEEE International Conference on Multimedia and Expo (ICME), Seattle, WA, USA, 11–15 July 2016; IEEE: New York, NY, USA, 2016; pp. 1–6. [Google Scholar]
  12. Liu, X.; Liu, W.; Mei, T.; Ma, H. A deep learning-based approach to progressive vehicle re-identification for urban surveillance. In Proceedings of the Computer Vision—ECCV 2016, Amsterdam, The Netherlands, 11–14 October 2016; Leibe, B., Matas, J., Sebe, N., Welling, M., Eds.; Springer: Cham, Switzerland, 2016; Volume 9906, pp. 869–884. [Google Scholar]
  13. Tu, J.; Chen, C.; Huang, X.; He, J.; Guan, X. DFR-ST: Discriminative feature representation with spatio-temporal cues for vehicle re-identification. Pattern Recognit. 2022, 131, 108887. [Google Scholar] [CrossRef]
  14. Huang, W.; Zhong, X.; Jia, X.; Liu, W.; Feng, M.; Wang, Z.; Satoh, S. Vehicle re-identification with spatio-temporal model leveraging by pose view embedding. Electronics 2022, 11, 1354. [Google Scholar] [CrossRef]
  15. Wang, Z.; Tang, L.; Liu, X.; Yao, Z.; Yi, S.; Shao, J.; Yan, J.; Wang, S.; Li, H.; Wang, X. Orientation invariant feature embedding and spatial temporal regularization for vehicle re-identification. In Proceedings of the 2017 IEEE International Conference on Computer Vision (ICCV), Venice, Italy, 22–29 October 2017; IEEE: New York, NY, USA, 2017; pp. 379–387. [Google Scholar]
  16. Hermans, A.; Beyer, L.; Leibe, B. In defense of the triplet loss for person re-identification. arXiv 2017, arXiv:1703.07737. [Google Scholar]
  17. Zheng, Z.; Zheng, L.; Garrett, M.; Yang, Y.; Xu, M.; Shen, Y.-D. Dual-path convolutional image-text embeddings with instance loss. ACM Trans. Multimed. Comput. Commun. Appl. 2020, 16, 1–23. [Google Scholar] [CrossRef]
  18. Ding, Y.; Fan, H.; Xu, M.; Yang, Y. Adaptive exploration for unsupervised person re-identification. ACM Trans. Multimed. Comput. Commun. Appl. 2020, 16, 1–19. [Google Scholar] [CrossRef]
  19. Yan, K.; Tian, Y.; Wang, Y.; Zeng, W.; Huang, T. Exploiting multi-grain ranking constraints for precisely searching visually-similar vehicles. In Proceedings of the 2017 IEEE International Conference on Computer Vision (ICCV), Venice, Italy, 22–29 October 2017; pp. 562–570. [Google Scholar]
  20. Lin, Y.; Zheng, L.; Zheng, Z.; Wu, Y.; Hu, Z.; Yan, C.; Yang, Y. Improving person re-identification by attribute and identity learning. Pattern Recognit. 2019, 95, 151–161. [Google Scholar] [CrossRef]
  21. Wang, J.; Zhu, X.; Gong, S.; Li, W. Transferable joint attribute-identity deep learning for unsupervised person re-identification. In Proceedings of the 2018 IEEE/CVF Conference on Computer Vision and Pattern Recognition, Salt Lake City, UT, USA, 18–23 June 2018; IEEE: New York, NY, USA, 2018; pp. 2275–2284. [Google Scholar]
  22. Li, H.; Li, C.; Zheng, A.; Tang, J.; Luo, B. Attribute and state guided structural embedding network for vehicle re-identification. IEEE Trans. Image Process. 2022, 31, 5949–5962. [Google Scholar] [CrossRef]
  23. Zhou, Y.; Shao, L. Viewpoint-aware attentive multi-view inference for vehicle re-identification. In Proceedings of the 2018 IEEE/CVF Conference on Computer Vision and Pattern Recognition, Salt Lake City, UT, USA, 18–23 June 2018; IEEE: New York, NY, USA, 2018; pp. 6489–6498. [Google Scholar]
  24. Zhou, Y.; Shao, L. Cross-view GAN based vehicle generation for re-identification. In Proceedings of the British Machine Vision Conference 2017, London, UK, 4–7 September 2017; British Machine Vision Association: London, UK, 2017; p. 186. [Google Scholar]
  25. Chu, R.; Sun, Y.; Li, Y.; Liu, Z.; Zhang, C.; Wei, Y. Vehicle re-identification with viewpoint-aware metric learning. In Proceedings of the 2019 IEEE/CVF International Conference on Computer Vision (ICCV), Seoul, Republic of Korea, 27 October–2 November 2019; IEEE: New York, NY, USA, 2019; pp. 8281–8290. [Google Scholar]
  26. Lu, Z.; Lin, R.; Lou, X.; Zheng, L.; Hu, H. Identity-unrelated information decoupling model for vehicle re-identification. IEEE Trans. Intell. Transp. Syst. 2022, 23, 19001–19015. [Google Scholar] [CrossRef]
  27. Wang, S.; Wang, Q.; Min, W.; Han, Q.; Gai, D.; Luo, H. Trade-off background joint learning for unsupervised vehicle re-identification. Vis. Comput. 2023, 39, 3823–3835. [Google Scholar] [CrossRef]
  28. Liu, H.; Tian, Y.; Wang, Y.; Pang, L.; Huang, T. Deep relative distance learning: Tell the difference between similar vehicles. In Proceedings of the 2016 IEEE Conference on Computer Vision and Pattern Recognition (CVPR), Las Vegas, NV, USA, 27–30 June 2016; IEEE: New York, NY, USA, 2016; pp. 2167–2175. [Google Scholar]
  29. Lou, Y.; Bai, Y.; Liu, J.; Wang, S.; Duan, L. VERI-wild: A large dataset and a new method for vehicle re-identification in the wild. In Proceedings of the 2019 IEEE/CVF Conference on Computer Vision and Pattern Recognition (CVPR), Long Beach, CA, USA, 15–20 June 2019; IEEE: New York, NY, USA, 2019; pp. 3230–3238. [Google Scholar]
  30. Guo, H.; Zhao, C.; Liu, Z.; Wang, J.; Lu, H. Learning coarse-to-fine structured feature embedding for vehicle re-identification. Proc. AAAI Conf. Artif. Intell. 2018, 32, 1. [Google Scholar] [CrossRef]
  31. Lin, G.; Milan, A.; Shen, C.; Reid, I. RefineNet: Multi-path refinement networks for high-resolution semantic segmentation. In Proceedings of the 2017 IEEE Conference on Computer Vision and Pattern Recognition (CVPR), Honolulu, HI, USA, 21–26 July 2017; IEEE: New York, NY, USA, 2017; pp. 5168–5177. [Google Scholar]
  32. Yosinski, J.; Clune, J.; Nguyen, A.; Fuchs, T.; Lipson, H. Understanding neural networks through deep visualization. arXiv 2015, arXiv:1506.06579. [Google Scholar]
  33. Hu, J.; Shen, L.; Sun, G. Squeeze-and-excitation networks. In Proceedings of the 2018 IEEE/CVF Conference on Computer Vision and Pattern Recognition, Salt Lake City, UT, USA, 18–23 June 2018; IEEE: New York, NY, USA, 2018; pp. 7132–7141. [Google Scholar]
  34. Morris, B.T.; Trivedi, M.M. Learning, modeling, and classification of vehicle track patterns from live video. IEEE Trans. Intell. Transp. Syst. 2008, 9, 425–437. [Google Scholar] [CrossRef]
  35. Javed, O.; Shafique, K.; Rasheed, Z.; Shah, M. Modeling inter-camera space–time and appearance relationships for tracking across non-overlapping views. Comput. Vis. Image Underst. 2008, 109, 146–162. [Google Scholar] [CrossRef]
  36. Xu, J.; Jagadeesh, V.; Ni, Z.; Sunderrajan, S.; Manjunath, B.S. Graph-based topic-focused retrieval in distributed camera network. IEEE Trans. Multimed. 2013, 15, 2046–2057. [Google Scholar] [CrossRef]
  37. Szegedy, C.; Vanhoucke, V.; Ioffe, S.; Shlens, J.; Wojna, Z. Rethinking the inception architecture for computer vision. In Proceedings of the 2016 IEEE Conference on Computer Vision and Pattern Recognition (CVPR), Las Vegas, NV, USA, 27–30 June 2016; IEEE: New York, NY, USA, 2016; pp. 2818–2826. [Google Scholar]
  38. Redmon, J.; Farhadi, A. YOLOv3: An incremental improvement. arXiv 2018, arXiv:1804.02767. [Google Scholar]
  39. Krizhevsky, A.; Sutskever, I.; Hinton, G.E. ImageNet Classification with Deep Convolutional Neural Networks. In Proceedings of the Advances in Neural Information Processing Systems 25 (NIPS 2012), Lake Tahoe, NV, USA, 3–6 December 2012. [Google Scholar]
  40. Ma, X.; Zhu, K.; Guo, H.; Wang, J.; Huang, M.; Miao, Q. Vehicle re-identification with refined part model. In Proceedings of the 2019 IEEE International Conference on Multimedia & Expo Workshops (ICMEW), Shanghai, China, 8–12 July 2019; IEEE: New York, NY, USA, 2019; pp. 603–606. [Google Scholar]
  41. Zhu, W.; Wang, Z.; Wang, X.; Hu, R.; Liu, H.; Liu, C.; Wang, C.; Li, D. A dual self-attention mechanism for vehicle re-identification. Pattern Recognit. 2023, 137, 109258. [Google Scholar] [CrossRef]
Figure 1. Challenges posed by variations in illumination. (a) Two different vehicles may appear to be similar under consistent lighting, especially when they are of the same model. (b) In contrast, images of the same vehicle may appear to be quite different if the illumination varies drastically. (c) Dramatic changes in lighting may also alter distinctive visual cues, such as inspection marks on windshields, headlights, and car logos.
Electronics 12 04950 g001
Figure 2. Visual markers that could be used to distinguish similar vehicles under varying illumination, especially when the negative sample includes the same model with a positive sample under similar illumination. Personalized decorations on the windshield were of particular importance, as shown in the blue boxes. (a) Anchor. (b) Positive. (c) Negative.
Electronics 12 04950 g002
Figure 3. The TSPL architecture. The “branch_simi” and “branch_diff” modules accept the output of “shared conv” and transform N images into 2 N features (i.e., g l o b a l _ s i m i and g l o b a l _ d i f f ). TSPL then appends an attention process to the “shared conv” to generate 3 N local features (i.e., l o c a l _ s i m i , l o c a l _ d i f f , and l o c a l f e a t u r e s ). In the illumination-specific feature space, TSPL expresses the fusion of local features extracted from the I A M (with global features extracted from the b r a n c h ) as joint vehicle features. TSPL also generates an N × N distance matrix using the local features and two N × N distance matrices from the fusion features (i.e., matrix3, matrix1, and matrix2). In matrix3, TSPL only uses distances from same-model pairs to calculate the loss function L l . In matrix1 (matrix2), TSPL only uses the green cells (brown cells) to compute the loss function L S ( L D ). In addition, TSPL incorporates matrix1 and matrix2 into the fusion matrix to calculate L C R O S S .
Electronics 12 04950 g003
Figure 4. The attention-guided local feature extraction module (AG). (a) The detail-aware local feature extraction module (DAM). (b) The illumination-aware local feature extraction module (IAM).
Electronics 12 04950 g004
Figure 5. VERI-DAN dataset statistics. (a) The number of identities collected by camera (i.e., 1–120). (b) The number of IDs captured by hour. (c) The distribution of captured images by time of day.
Electronics 12 04950 g005
Figure 6. An overview of the VERI-DAN dataset, including (a) sample images and (b) examples of changes in illumination.
Electronics 12 04950 g006
Figure 7. A visual comparison of baseline (top) and TSPL (bottom) performance. Images with blue contours show query vehicles, and images with green and red contours indicate correct and incorrect predictions, respectively.
Electronics 12 04950 g007
Table 1. Re-ID performance with augmented images. Origin denotes the weight offered by the author. Retrain denotes a weight retrained on VERI-DAN. The best results are given in bold.
SettingAugmentOriginRetrain
QueryGalleryRank-1Rank-5mAPRank-1Rank-5mAP
Baseline××88.994.456.588.994.456.5
×75.887.048.775.585.241.4
×72.883.647.664.879.034.9
84.091.052.181.190.247.2
Table 2. Summary of related works on vehicle re-ID.
Classification BasisMethod TypeReferencesAdvantageLimitation
Feature representation
approaches
Hand-craftedRefs. [10,11]Highly interpretableHigh time complexity; low recognition accuracy
Deep learningRefs. [1,11,12,13,14,15,19,20,21,22,23,24,25,26,27]High recognition accuracyHigh cost; poor interpretability 2
Key aspectsSpatio-temporal information basedRefs. [12,13,14]Works well for hard samplesNeed extra complex spatio-temporal labels
Metrics learning basedRefs. [12,19]High recognition accuracyHigh cost
Multidimensional information basedRefs. [1,20,21,22,23,24,25,26,27]Sensitivity to the special appearance of vehiclesVulnerable to variations in viewpoints and illuminations
Table 3. A comparison of re-ID datasets. S-T, spatio-temporal geographic coordinate information; ID-DL, ID with diverse lighting.
DatasetVehicleIDVehicle-1MVERI-WildVERI-DAN
Images221,763936,051416,314200,004
Identities26,26755,52740,67116,654
Models250400153482
S-T××
ID-DL (%)10.3%29.9%6.3%100%
Table 4. Division of the training and testing sets (IDs/Images).
DatasetTrainTest
SmallMediumLarge
Vehicle-1M6448/525,8081000/16,1232000/32,5393000/49,259
VERI-DAN13,454/141,470800/97231600/19,3382400/29,473
Table 5. Evaluation results for the small VERI-DAN and Vehicle-1M test sets (%). The best results are shown in bold.
Method L within L cross L local VERI-DANVehicle-1M
Rank-1Rank-5Rank-1Rank-5
( a ) B a s e l i n e ---96.2699.2385.8696.67
( b ) I A N e t 98.8399.7092.6098.53
( c ) T S P L 1 99.5599.9396.2999.13
( d ) T S P L 2 99.4099.9495.5198.65
( e ) T S P L 3 99.5299.9596.5999.18
( f ) T S P L 3 99.5499.9596.9799.18
Table 6. The effect of sampling strategy (%).
Method Daytime:
Nighttime
Test Size = 800
Rank-1Rank-5mAP
BaselineRandom89.4598.0389.99
1:388.897.8388.54
2:292.0598.0391.27
3:189.6097.5889.93
IANetRandom96.3099.2096.16
1:396.3799.3595.41
2:296.8299.4095.82
3:196.1599.2395.02
Table 7. Performance with the VERI-DAN dataset (%). The best results are shown in bold.
MethodSmallMediumLarge
Rank-1mAPRank-1mAPRank-1mAP
InceptionV3 [37]96.2693.5993.2789.2591.1085.36
IANet98.8397.6598.4296.3198.0395.35
TSPL99.5498.9199.5198.4199.3397.80
Table 8. A comparison with SOTA algorithms applied to Vehicle-1M (%). The best results are shown in bold.
MethodBackboneTraining SetSmallMediumLarge
IDSImagesRank-1mAPRank-1mAPRank-1mAP
C2F-Rank (2018)GoogLeNet50,000844,57167.187.162.079.852.874.7
GSTN (2019)ResNet1850,000844,57195.1496.2992.7994.5890.7592.88
DFR-ST (2022)ResNet5050,000844,57193.0496.7090.6094.2891.2487.25
DSN (2023)ResNet5050,000844,57192.993.791.892.790.491.5
TSPL (Ours)InceptionV36448525,80896.9795.4094.2592.3992.9090.49
Disclaimer/Publisher’s Note: The statements, opinions and data contained in all publications are solely those of the individual author(s) and contributor(s) and not of MDPI and/or the editor(s). MDPI and/or the editor(s) disclaim responsibility for any injury to people or property resulting from any ideas, methods, instructions or products referred to in the content.

