Article

Lane Detection Based on Adaptive Cross-Scale Region of Interest Fusion

1
School of Computer Science and Technology, Zhengzhou University of Light Industry, Zhengzhou 450002, China
2
Songshan Laboratory, Zhengzhou 450046, China
*
Author to whom correspondence should be addressed.
Electronics 2023, 12(24), 4911; https://doi.org/10.3390/electronics12244911
Submission received: 12 October 2023 / Revised: 17 November 2023 / Accepted: 3 December 2023 / Published: 6 December 2023
(This article belongs to the Section Artificial Intelligence)

Abstract

:
Lane detection, a crucial component of autonomous driving systems, is in charge of precise lane location to ensure that cars navigate lanes appropriately. However, in challenging conditions like shadows and extreme lighting, lanes may become obstructed or blurred, posing a significant challenge to the lane-detection task as the model struggles to extract sufficient visual information from the image. The current anchor-based lane-detection network detects lanes in complex scenes by mapping anchors to images to extract features and calculating the relationship between each anchor and other anchors for feature fusion. However, it is insufficient for anchors to extract subtle features from images, and there is no guarantee that the information carried by each anchor is valid. Therefore, this study proposes the adaptive cross-scale ROI fusion network (ACSNet) to fully extract the features in the image so that the anchor carries more useful information. ACSNet selects important anchors in an adaptive manner and fuses these important anchors with the original anchors across scales. Through this feature extraction method, the features of different field-of-view ranges under complex road surfaces can be learned, and diversified features can be integrated to ensure that lanes can be well detected under complex road surfaces such as shadows and extreme lighting. Furthermore, due to the slender structure of lane lines, there are relatively few useful features in the images. Therefore, this study also proposes a Three-dimensional Coordinate Attention Mechanism (TDCA) to enhance image features. The Three-dimensional Coordinate Attention Mechanism extensively explores relationships among features in the row, column, and spatial dimensions. It calculates feature weights for each of these dimensions and ultimately performs element-wise multiplication with the entire feature map. Experimental results demonstrate that our network achieves excellent performance on the existing public datasets, CULane and Tusimple.

1. Introduction

Lane detection, as a perception module in autonomous driving systems, aims to analyze images captured by the car’s front camera, identify and locate lanes in the driving area, and assist the vehicle in navigation, path planning, and lane keeping. With the development of deep learning in the field of artificial intelligence, neural networks have been applied to lane-detection models, and their performance has surpassed traditional methods. However, the current lane-detection network based on deep learning still faces many challenges, mainly including the following: (1) Owing to road structures like guardrails and pavement markings that bear a resemblance to lanes, the detection model may occasionally misinterpret lanes as pavement markings, guardrails, and the like. (2) As lane detection necessitates repetitive execution, the importance of a rapid lane-detection strategy with parallel processing becomes evident. In traditional methods, parallel processing of fast lane detection has been performed very well, and models based on deep learning can learn from the ideas in traditional methods. For example, Chinthaka Premachandra et al. applied parallel processors to image detection and studied a Hough transform suitable for parallel processing to achieve fast lane detection [1]. (3) Amidst challenging conditions like shadows and extreme lighting, the scarcity of adequate visual cues renders lane detection a formidable task. This study aims to solve the problem of difficult lane detection under complex road surfaces such as shadows and extreme lighting.
The most crucial aspect of lane detection is to ensure accurate lane detection under various conditions. This is essential for enhancing road safety and reducing the burden on drivers. Nevertheless, lane detection becomes a challenging task under complex road conditions, particularly in the presence of factors such as shadows and extreme lighting. This difficulty can be attributed to the following reasons. (1) Contrast reduction: Under shadow conditions, the image exhibits lower contrast, with minimal differences in color and brightness between the lane and the surrounding road, making it challenging to separate the lane from the background. (2) Non-uniform lighting: Under complex road conditions such as shadows and extreme lighting, the road’s brightness distribution is non-uniform. This non-uniform lighting blurs the lane edges, making accurate detection difficult. (3) Occlusion: Objects such as vehicles, buildings, or trees may cast shadows and obstruct parts or the entire lane, making it impossible for the model to extract sufficient visual evidence from the image. Traditional lane detection solves the above problems by first using grayscale transformation, spatial domain filtering, and other technologies to enhance the image, and then using edge detection operators (Sobel operator and Canny operator) to detect the lane edge area and finally combining algorithms such as Hough transform and RANSAC for lane detection. Nevertheless, this approach depends on manually crafted features and rules, rendering it susceptible to environmental variations and noise [2,3,4].
Subsequently, the advent of deep learning technology empowered the end-to-end neural network model to extract lane feature representations from the original image directly, surpassing the performance of traditional methods by a considerable margin. Presently, anchor-based lane-detection solutions have demonstrated exceptional results. In contrast to classical lane-detection models like SCNN [5] and RESA [6], anchor-based lane-detection approaches tackle the lane-detection task from a novel perspective by employing pre-set anchors as references for point regression and classification. SCNN [5] proposed a message-passing mechanism that can capture the spatial relationships of pixels in each row and column of the image, addressing the issue of no visual information under challenging conditions such as shadows and extreme lighting. However, SCNN’s message-delivery mechanism occurs sequentially, demanding a significant amount of time, and long-distance propagation can result in information loss as well. RESA [6] made improvements upon SCNN by adopting a parallel information transmission approach, reducing the time cost. Furthermore, in RESA, information is propagated using varying step sizes, where one pixel overlaps with another pixel multiple times. This approach prevents the loss of long-distance information while enabling each pixel to gather global information effectively. RESA relies on this method and achieves very good detection results. Nevertheless, RESA treats the lane-detection task as a segmentation task, necessitating pixel-wise classification of the image at the end, resulting in a considerable time overhead. On the other hand, Li X et al. [7] proposed a lane-detection approach based on line anchors, performing point regression with pre-defined line anchors to ensure both real-time performance and accuracy. LaneATT [8] proposed an anchor-based attention mechanism that calculates the correlation between each anchor and other anchors in parallel to aggregate global information. It shows advanced results and efficiency on multiple data sets. However, LaneATT also relies on pre-defined anchors as references for point regression, which introduces a degree of inflexibility. This limitation makes it challenging to effectively handle curved lanes and complex road surfaces. UFLDv2 [9] uses a hybrid anchor method for lane detection, which treats lane detection as selecting cells containing lane marks based on rows and columns. It solves the problem of the difficult detection of lanes on curves and complex road surfaces using hybrid anchor methods. CLRNet [10] proposes a cross-layer refinement network that combines high-level semantic information and low-level semantic information to detect lanes and continuously optimizes the position of anchors to cope with harsh conditions such as shadows and extreme lighting. However, CLRNet does not guarantee that each anchor is forward optimized and carries effective information. There is still room for improvement in extracting subtle features from images.
Therefore, to comprehensively extract subtle features in complex scenes, including shadows and extreme lighting conditions, enhancing the information carried by each anchor for effective forward optimization, this study introduces the ACSNet lane detection framework based on adaptive cross-scale region of interest fusion. This strategy is inspired by adaptive algorithms and CrossFormer [11]. Unlike other cross-scale fusion methods [12], we adaptively select important anchors and perform large-scale feature extraction on these anchors during the subsequent anchor optimization process, followed by fusion with all anchors. In this way, the features of different visual ranges under complex road surfaces can be learned, and diversified features can be integrated. Additionally, due to the slender structure of the lanes, the image contains fewer useful features. Therefore, this study proposes a Three-dimensional Coordinate Attention Mechanism (TDCA) to enhance features and offer additional valuable information to subsequent modules. The TDCA embeds positional information into channel attention and takes long-range dependencies into account in spatial attention. The TDCA first calculates weight coefficients in the row, column, and spatial directions and then performs weighted summation with the feature map. Experimental results demonstrate that our approach achieved excellent performance on two public datasets. The main contributions of this study are as follows:
  • In this study, we propose the ACSF_ROI module, which is aimed at addressing the issue of lane detection with no visual cues in complex road conditions such as shadows and extreme lighting. ACSF_ROI enhances global context information by adaptively selecting crucial anchors for cross-scale fusion, thereby improving the accuracy of lane positioning;
  • We propose the Three-dimensional Coordinate Attention Mechanism (TDCA), which calculates weight coefficients from multiple dimensions of feature maps to enhance feature representation. TDCA, as a lightweight attention mechanism, can be transferred to other networks to improve model performance;
  • In this study, we present the ACSNet lane-detection model, which has demonstrated excellent performance on the CULane and Tusimple datasets. Furthermore, it has achieved significant improvements in the shadow and dazzle categories of the CULane dataset.
This study’s remaining chapters are arranged in the order shown below. In Section 2, we delve into a comprehensive review of related work in lane detection based on deep learning. In Section 3, we will provide a detailed overview of the model’s overall architecture and its individual components. In Section 4, we substantiate the effectiveness of the model proposed in this study as well as each individual module through extensive experiments. Section 5 offers a comprehensive summary of the entire study.

2. Related Works

Traditional lane-detection methods are based on classic computer vision. They usually perform edge detection first and then apply the Hough transform to perform lane detection. This type of method detects lanes very quickly and meets real-time requirements. However, traditional methods are difficult to deal with complex scenes, and curve detection is also difficult [1,2,4,13]. In recent years, with the development of deep learning technology in the field of artificial intelligence, models built using neural networks have been proven to have better performance than traditional methods and can bring better detection results to the model [5,6,14,15]. Therefore, this study primarily elaborates on lane-detection models established using deep learning. Lane-detection models established using deep learning can be categorized into three types: segmentation-based lane detection, attention-based lane detection, and anchor-based lane detection.
A.
Segmentation-based Lane Detection
This approach involves the pixel-wise classification of images captured by the front camera, followed by determining whether each pixel belongs to a lane. SCNN [5] proposed a message-passing mechanism to address long continuous shapes or large objects, enabling information exchange between rows and columns in space, thereby solving the problem of no visual cues in complex road conditions. Experiments have proven that SCNN is effective, but the message-passing mechanism of SCNN is executed sequentially. Transferring information between adjacent rows and columns requires multiple iterations, takes a lot of time, and information is easily lost during long-distance propagation. RESA [6] continues the idea of SCNN and proposes a real-time feature transfer aggregator to deliver messages on slices in parallel. It circumvents the problems of SCNN, resulting in slow inference speed and loss of information during long-distance propagation due to the sequential transmission of information. CurveLane-NAS [16] utilizes Neural Architecture Search (NAS) to discover a superior network architecture for extracting more valuable information. While this approach has achieved excellent performance, its cost is very high and requires significant GPU time. In general, due to the slim and lengthy structure of lanes, the proportion of lane-related pixels in the entire image is minimal, making these pixel-wise prediction segmentation methods time-consuming [17,18,19].
B.
Attention-based Lane Detection
SAD [20] introduced a self-attention distillation mechanism, enabling the model to self-learn attention maps for enriching contextual information, resulting in significant improvements while maintaining real-time performance. However, in the SAD module, knowledge distillation occurs from deep layers to shallow layers, facilitating inter-layer communication only within the lane region and not providing additional supervision signals for occlusions, which results in limitations when handling complex road conditions. Minhyeok Lee et al. [21] proposed lane detection based on the expanded attention mechanism, computing lane confidence associated with occlusion depth through the expanded attention mechanism. By utilizing lane confidence, the model can enhance learning in areas with occlusion, darkness, and more, enabling effective lane detection even in scenarios without visual cues. LSTR [22] introduces the Transformer into the model and uses it to enhance the capture of the lane’s slender structure and the learning of global context information to cope with complex road surfaces such as shadows and extreme lighting. LSTR builds a lane shape model based on the road structure and camera attitude and directly outputs the shape model parameters corresponding to N lanes for curve fitting, which is very fast. However, it is sensitive to parameters. Even if the high-order coefficients predicted by the model have small errors, it will affect the overall detection effect. To ensure real-time performance, most attention-based lane-detection methods adopt lightweight frameworks, which results in a sacrifice of a certain degree of accuracy.
C.
Anchor-based Lane Detection
This approach involves designing anchor shapes in advance, followed by regressing the offset between sampled points and the pre-set anchors. Finally, non-maximum suppression (NMS) [23] is employed to select lanes with higher confidence. Anchor-based lane detection, compared to segmentation-based methods, does not require pixel-wise classification, thus maintaining real-time performance. Unlike attention-based detection methods, it does not sacrifice accuracy due to the adoption of a lightweight framework. LaneATT [8] proposed an anchor-based attention mechanism, computing weight coefficients between each anchor and other anchors in parallel. It then performs a weighted sum to enhance the features of each anchor and imbue them with global information, addressing the problem of no visual information under complex road conditions. Experiments have proven that LaneATT has performed excellently on multiple data sets, ensuring both performance and efficiency. However, LaneATT’s pre-set anchors are unchanged and lack flexibility, making it difficult to handle curves and complex road surfaces. In addition, there are some methods to detect lanes using row anchors; UFLD [24] is one of them. UFLD grids the input image, treats lane detection as a row-based selection problem, uses global features to predict cells containing lane markings row by row, and constrains the overall line shape through the position of each row. Although UFLD is simple and fast, there is still room for improvement in detection accuracy. A conditional lane-detection method consisting of conditional convolution and row anchor formula is introduced by CondLaneNet [25]. The model first detects the starting points of each instance and then dynamically predicts the lane shape for each instance. Since the starting point is difficult to predict in some complex scenes, this will make it difficult for the model to detect lanes in complex scenes. CLRNet [10] proposes a refined network structure that fuses high semantic information and low semantic information, and by continuously optimizing the position of the anchor, it finds an anchor line suitable for complex scenes and performs a regression of sampling points on the final anchor line. CLRNet has also achieved excellent performance on multiple data sets, but CLRNet cannot guarantee that the optimization of each anchor is positive and that the information it carries is effective. There is still room for improvement in extracting features from images.
In order to fully extract subtle features from images under complex road surfaces, such as shadows and extreme lighting, so that each anchor carries more effective information, this study proposes a lane-detection model based on adaptive cross-scale ROI fusion. The model adaptively selects important anchors and reuses the information carried by these important anchors, extracts features through large-scale convolution, and performs cross-scale fusion with the original anchors. By employing this method, features in the image are comprehensively extracted, enabling each anchor to convey more effective information and facilitating the positive optimization of anchors. Additionally, to enhance image features and provide more valuable information to the model, this study introduces a lightweight attention mechanism embedded into the network model.

3. Method

3.1. Representation of Lanes and Anchors

The goal of lane detection is to recognize the lanes, denoted as L = { l 1 , l 2 , , l N } , within an input image, where N represents the total number of lanes. Each lane is represented by k coordinates ( x , y ) , for example, lane l 1 = { ( x 1 , y 1 ) , , ( x k , y k ) } . Coordinate x represents the horizontal position of points on each lane, while coordinate y divides the image height H into K equal parts, for example: y k = H K 1 k . Therefore, each coordinate y k Y on each lane corresponds uniquely to a coordinate x k . Anchor boxes used in object detection are not suitable for the slender structure of lanes; previous work has employed line anchors to detect lanes. In this study, the anchors used for lane detection consist of four components: (1) The probability that the anchor belongs to the background and the lane. (2) The anchor’s starting coordinates x, y, and the angle θ with the x-axis. (3) The length of the lane. (4) The offset of the k coordinates on the anchor relative to the true lane.

3.2. Network Architecture

Figure 1 illustrates the complete ACSNet design proposed in this study. We employ the backbone network ResNet [26] and the Feature Pyramid Network (FPN) [27] to learn multi-level visual representations of an input image I R C × H × W captured by the front camera. Due to the narrow structure of lanes, there is relatively little useful information in the images. To enhance the feature representation, this study proposes a Three-dimensional Coordinate Attention Mechanism (TDCA) used between the backbone network and the feature pyramid. The TDCA enhances important information and suppresses noise by computing the weights of features in the row, column, and channel directions, providing more valuable information for subsequent modules (details in Section 3.3). The feature maps from each layer of FPN are input into the ACSF_ROI module proposed in this study, as depicted in Figure 2. In the ACSF_ROI module, two sampling methods are applied to the feature map. The first method is to perform bilinear interpolation sampling on the simplified points of all anchors, while the second method selects important anchors based on a threshold for full-point ROI extraction. Convolution is used to enhance the local feature correlation between the ROI feature maps obtained using the two sampling methods. For the feature maps obtained using the first sampling method, small convolution kernels are used for convolution, while for the feature maps obtained using the second sampling method, large convolution kernels are used for convolution. By convolving with different sizes of convolution kernels, the model can collect pixel information from different ranges, thereby using this information to enhance the occupied parts [28]. In addition, to enrich contextual information, ACSF_ROI calculates the correlation between different ROI feature maps and the entire feature map first and then performs weighted summation. Finally, the fused features are fed into fully connected layers for classification and regression. The results of the first two layers of ACSF_ROI are used for anchor refinement.

3.3. Three-Dimensional Coordinate Attention Mechanism

Separating the slender structure of lanes from a single image requires the full utilization of visual information. Inspired by CBAM [29] and CA [30], this study proposes the Three-dimensional Coordinate Attention Mechanism (TDCA) to enhance features. Previous work has already demonstrated that information in both channel and spatial dimensions of feature maps is highly significant [31]. CBAM combines the channel attention mechanism and spatial attention mechanism for the first time. It first performs global average pooling and global max pooling to calculate weights corresponding to each channel and then computes spatial direction weights through channel pooling. While CBAM can easily integrate with various convolutional neural networks, possessing good generality and scalability, it overlooks positional information and does not fully explore the relationships between rows and columns in feature maps. The CA embeds positional information into channel attention, performing attention calculations along the horizontal and vertical directions of feature maps to aggregate information between the rows and columns of the feature map. While CA also considers both channel and spatial dimensions, its work in the spatial dimension is insufficient, leading to shortcomings in capturing long-range dependencies. Therefore, this study proposes the Three-dimensional Coordinate Attention Mechanism (TDCA), as shown in Figure 3, which not only considers positional information but also incorporates long-range dependencies. The comparison of TDCA’s parameters and variables with CBAM and CA is presented in Table 1.
The TDCA proposed in this study takes a feature map X f C × H × W as input and performs both spatial attention calculations and channel attention calculations on the feature map. In channel attention, the feature map is divided into the horizontal direction (where the rows H of the feature map are considered as coordinates x) and the vertical direction (where the columns W of the feature map are considered coordinates y). Performing average pooling and max pooling in the horizontal direction results in the vector V h C × 1 × W , while in the vertical direction, average pooling and max pooling yield the vector V w C × H × 1 . Subsequently, the two vectors are concatenated and subjected to convolution, activation, and other operations to correlate internal information. Finally, the feature vectors are separated and convolved to obtain the ultimate attention weights W h C × 1 × W and W w C × H × 1 . The channel attention mechanism divides the feature map into two directions and performs corresponding operations in both directions to correlate the X and Y coordinates. In spatial attention, the channel direction is regarded as the Z-axis. Initially, channel pooling is performed on the feature map, followed by convolution and activation on the resulting vector to obtain the attention weights in the spatial dimension, represented as W c 1 × H × W . This approach is employed to relate long-range dependencies. The weighted vectors corresponding to the channel attention mechanism and spatial attention mechanism are element-wise multiplied with the original features to obtain the enhanced feature map X R e w e i g h t f C × H × W . The calculation formula for the TDCA is as follows:
X R e w e i g h t f = X f W c W W W

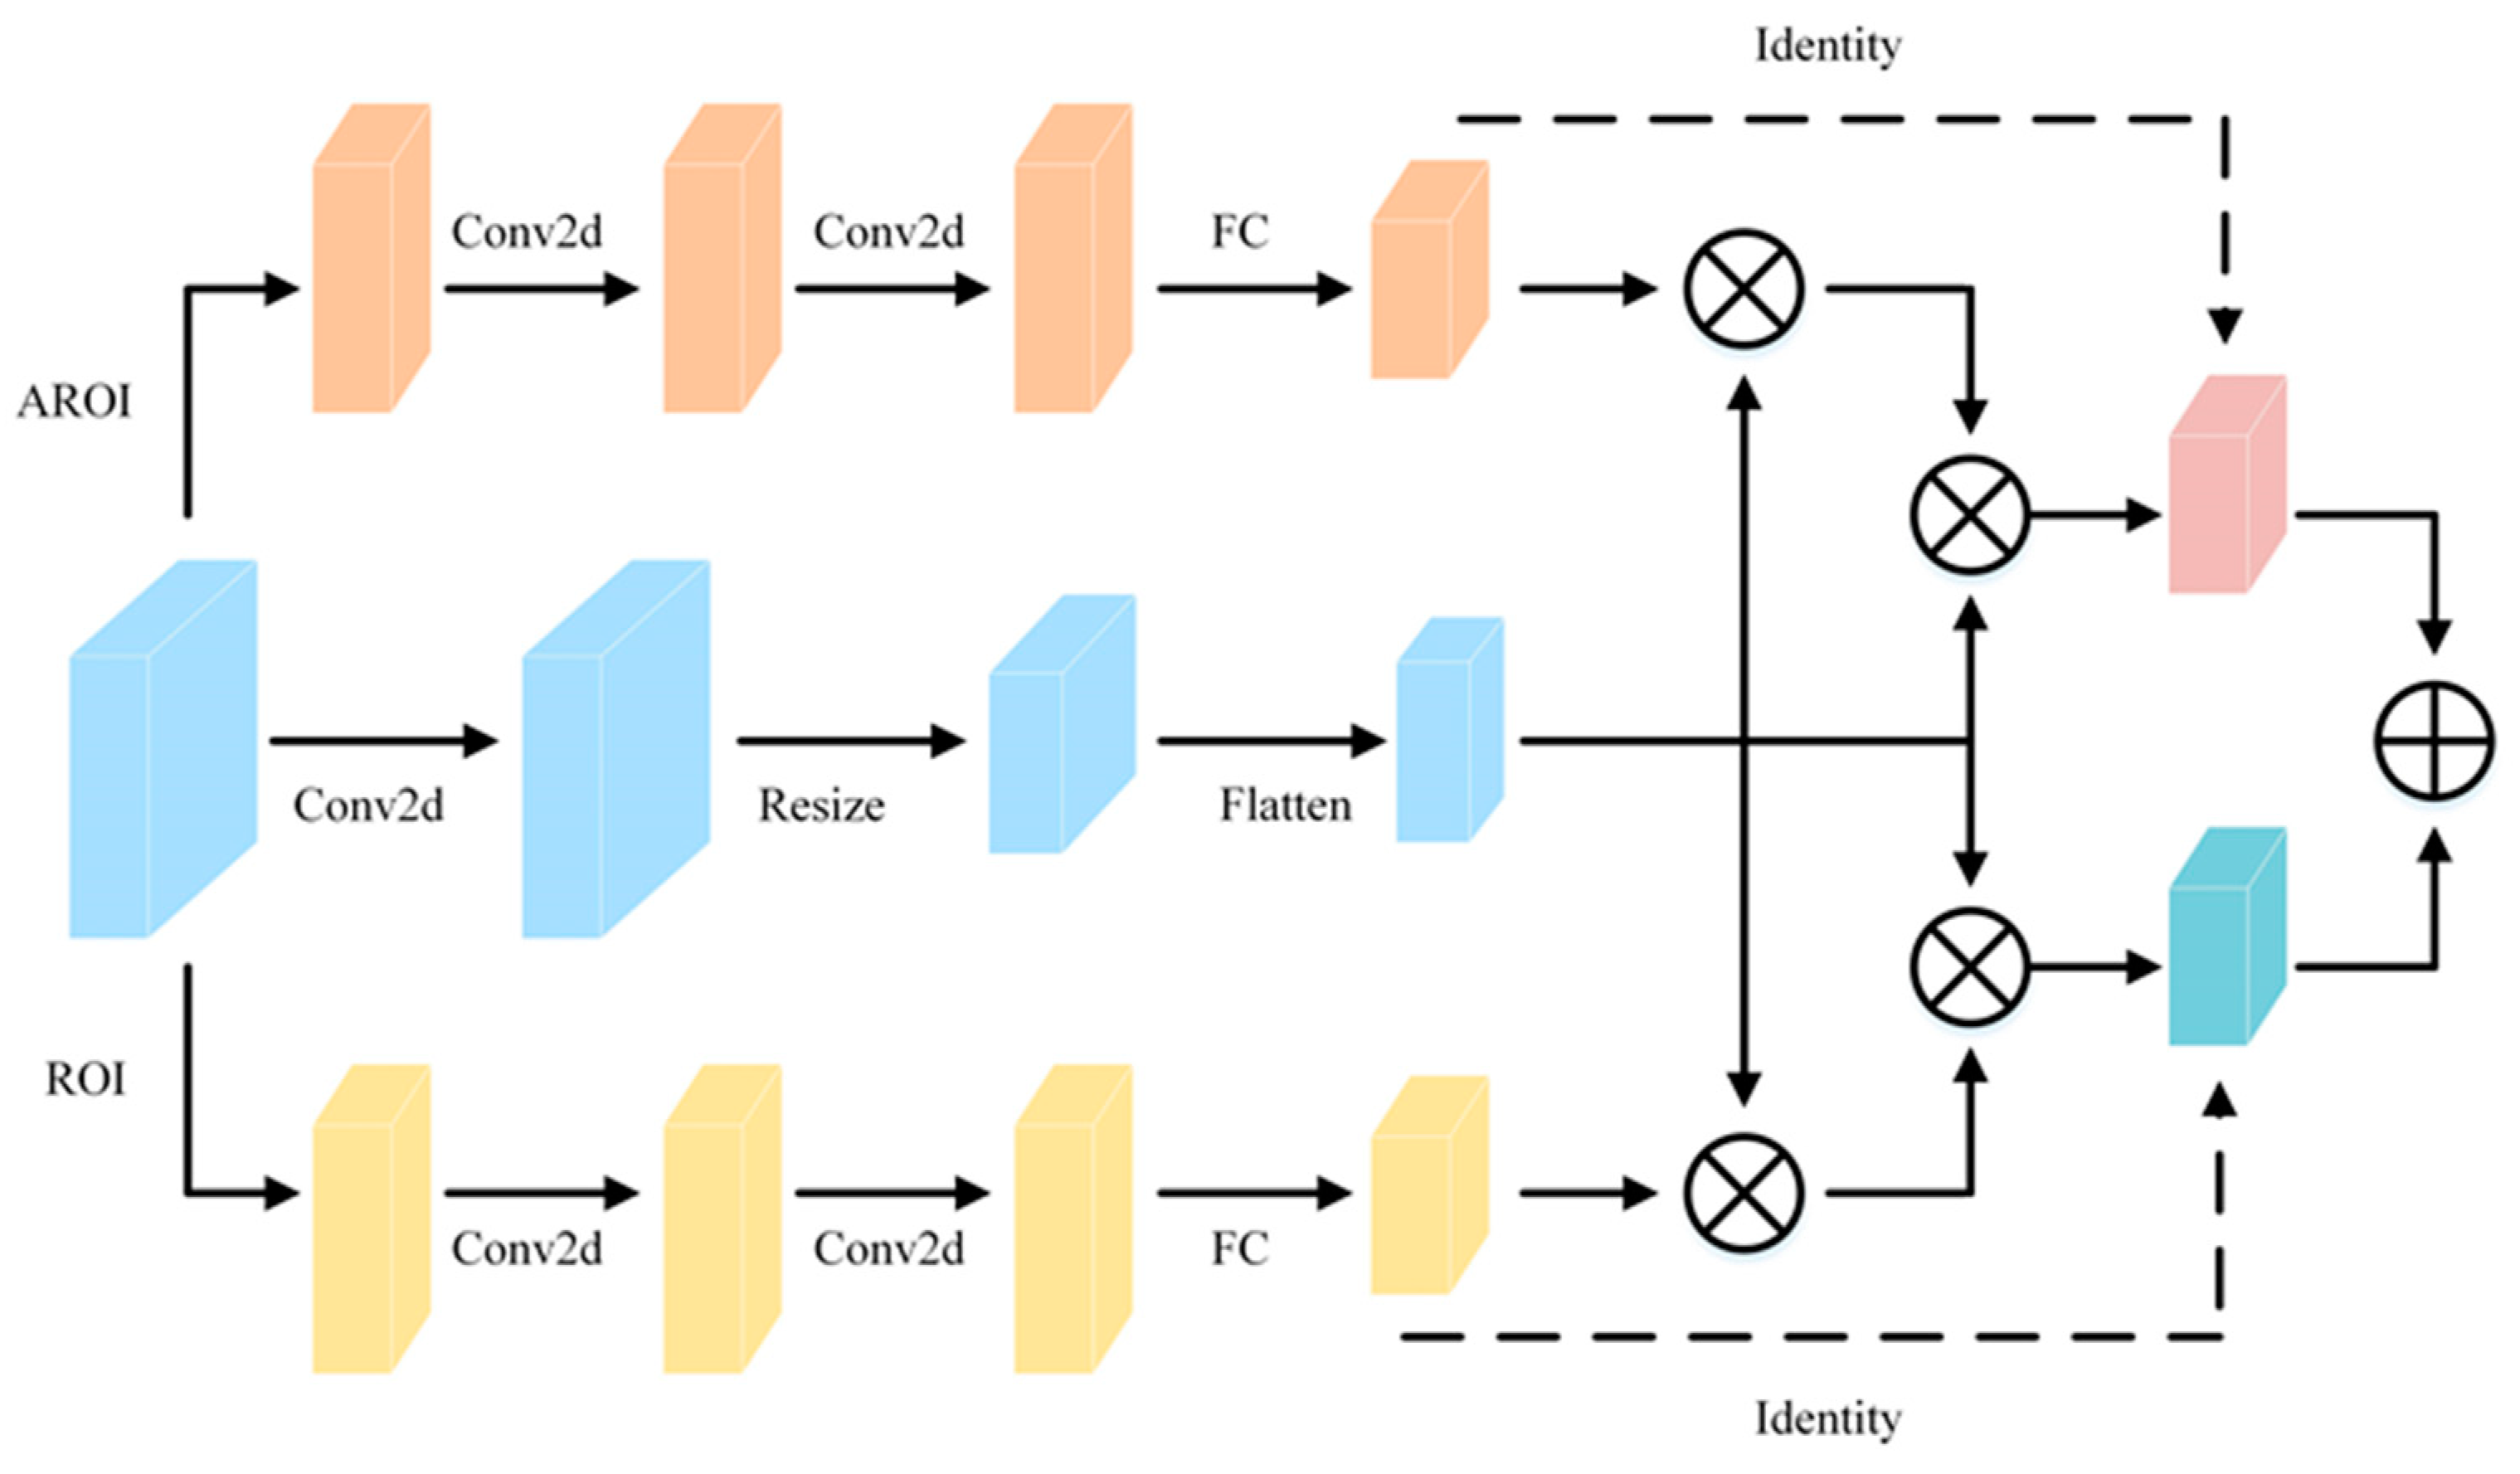
3.4. Adaptive Cross-Scale ROI Fusion

The framework diagram of Adaptive Cross-scale ROI Fusion (ACSF_ROI) is shown in Figure 2, and the parameters and variables are listed in Table 2. If each anchor is assigned to the feature map and only context features corresponding to the anchors are extracted using the ROIAlign [32] approach, then the features extracted in this way are far from sufficient for lane detection under adverse conditions. They cannot guarantee the presence of local visual evidence in complex road scenarios, including occlusion and extreme lighting. In order to determine whether a pixel belongs to a lane, it is necessary to aggregate nearby features. Multi-scale convolution is a commonly used method in object detection that can fuse local features, improve localization accuracy, and enhance robustness [33]. Therefore, in the ACSF_ROI module, different-sized convolution kernels are employed to convolve the ROI features. The aim is to learn features from various field-of-view ranges in complex road scenarios through multi-scale convolution. In the ACSF_ROI module, each anchor continuously optimizes itself by learning the angle with respect to the horizontal direction and the starting point coordinates. However, the model cannot guarantee that each anchor will undergo positive optimization during the training process. Therefore, we extract the first two elements of the returned anchor vector and compare them to a pre-defined threshold. If they exceed the threshold, it indicates that this anchor is closer to the lane. Anchors exceeding the threshold will be reused to assist in anchor optimization, providing gains to the model. Furthermore, to learn richer contextual information, ACSF_ROI establishes relationships between ROI features of different scales and the entire feature map and finally performs fusion.
The ACSF_ROI module proposed in this study takes two inputs: one is the output of the Feature Pyramid Network (FPN), and the other is the relevant information of the anchors. In ACSF_ROI1, anchors are first initialized, and then, the accurate values of the sampling points on the input feature map are calculated using bilinear interpolation. The first branch extracts ROI features from all points on the anchor, whereas the second branch extracts ROI features from simplified points on the anchor. The preliminary ROI features are processed through convolution and an activation function, collecting features near each pixel. Finally, they are fed into a fully connected layer to obtain the ultimate ROI features X R C × 1 . The first branch employs a large convolutional kernel for convolution, resulting in X R 1 C × 1 , while the second branch uses a small convolutional kernel for convolution, yielding X R 2 C × 1 . To enrich global context information, ACSF_ROI first resizes the entire feature map to a uniform size, then processes it through convolution and an activation function to obtain X f C × H W , and finally establishes connections with different ROI features. Calculate the attention weight matrix ( W 1 , W 2 ) from the ROI features ( X R 1 , X R 2 ) obtained from convolution at different scales and the entire feature map ( X f ), and then multiply the attention weight matrix with the entire feature map. The aggregation feature formula can be written as follows:
F = W 1 X f T + W 2 X f T
where W 1 and W 2 are the attention weight matrices. The formula for computing the attention weight matrices is as follows:
W 1 = f ( X R 1 T X f C )
W 2 = f ( X R 2 T X f C )
where f is the softmax activation function, and X R 1 T and X R 2 T are the ROI features obtained via convolution using different-sized kernels. The aggregated feature F will be fed into two fully connected layers for classification and regression, thereby obtaining optimized anchor information. The anchors will undergo three rounds of optimization through ACSF_ROI1, ACSF_ROI2, and ACSF_ROI3. In the ACSF_ROI2 and ACSF_ROI3 layers, the second branch remains unchanged, extracting ROI features from simplified points for all anchors, while the first branch switches to selecting important anchors for ROI extraction. These important anchors are selected adaptively based on threshold judgment using information returned from the previous layer. Anchors exceeding the threshold will be used for the next round of optimization. The adaptive cross-scale ROI fusion strategy is presented in Algorithm 1.
Algorithm 1 Adaptive Cross-scale ROI Fusion(ACSF_ROI)
Input: FPN output feature maps and anchor-related information
Output: Aggregated feature F
  1: Initialization of anchor-related information priors1 and priors2.
  2: for i in [1,refine] do
  3:   Calculate ROI features X R 1 and X R 2 for the two branches using ROIAlign.
  4:   Convolve the input feature map, and adjust and expand the vector size to obtain X f .
  5:   for batch in dataLoader do
  6:    Compute attention weight matrices W 1 and W 2 for ROI features and feature map X f using Formulas (3) and (4).
  7:    Calculate the aggregated feature F using Formula (2).
  8:   end for
  9:   Modify the information related to priors.
10:   if i != refine then
11:    for batch in dataLoader do
12:     if scores >= threshold then
13:      Keep anchors in priors2 that are greater than the threshold.
14:     else
15:      Do not retain this anchor in priors2.
16:     end if
17:    end for
18:    Modify the information associated with priors1.
19:    end if
20: end for

4. Experiments and Analysis

In this chapter, we substantiate the effectiveness of the model proposed in this study through extensive experiments. We will elaborate on the following aspects: (1) Introduction of the experimental dataset. (2) Introduction of evaluation criteria for the dataset. (3) A detailed listing of experimental parameters. (4) Comparison with other excellent models on different datasets. (5) Conducting model ablation experiments.

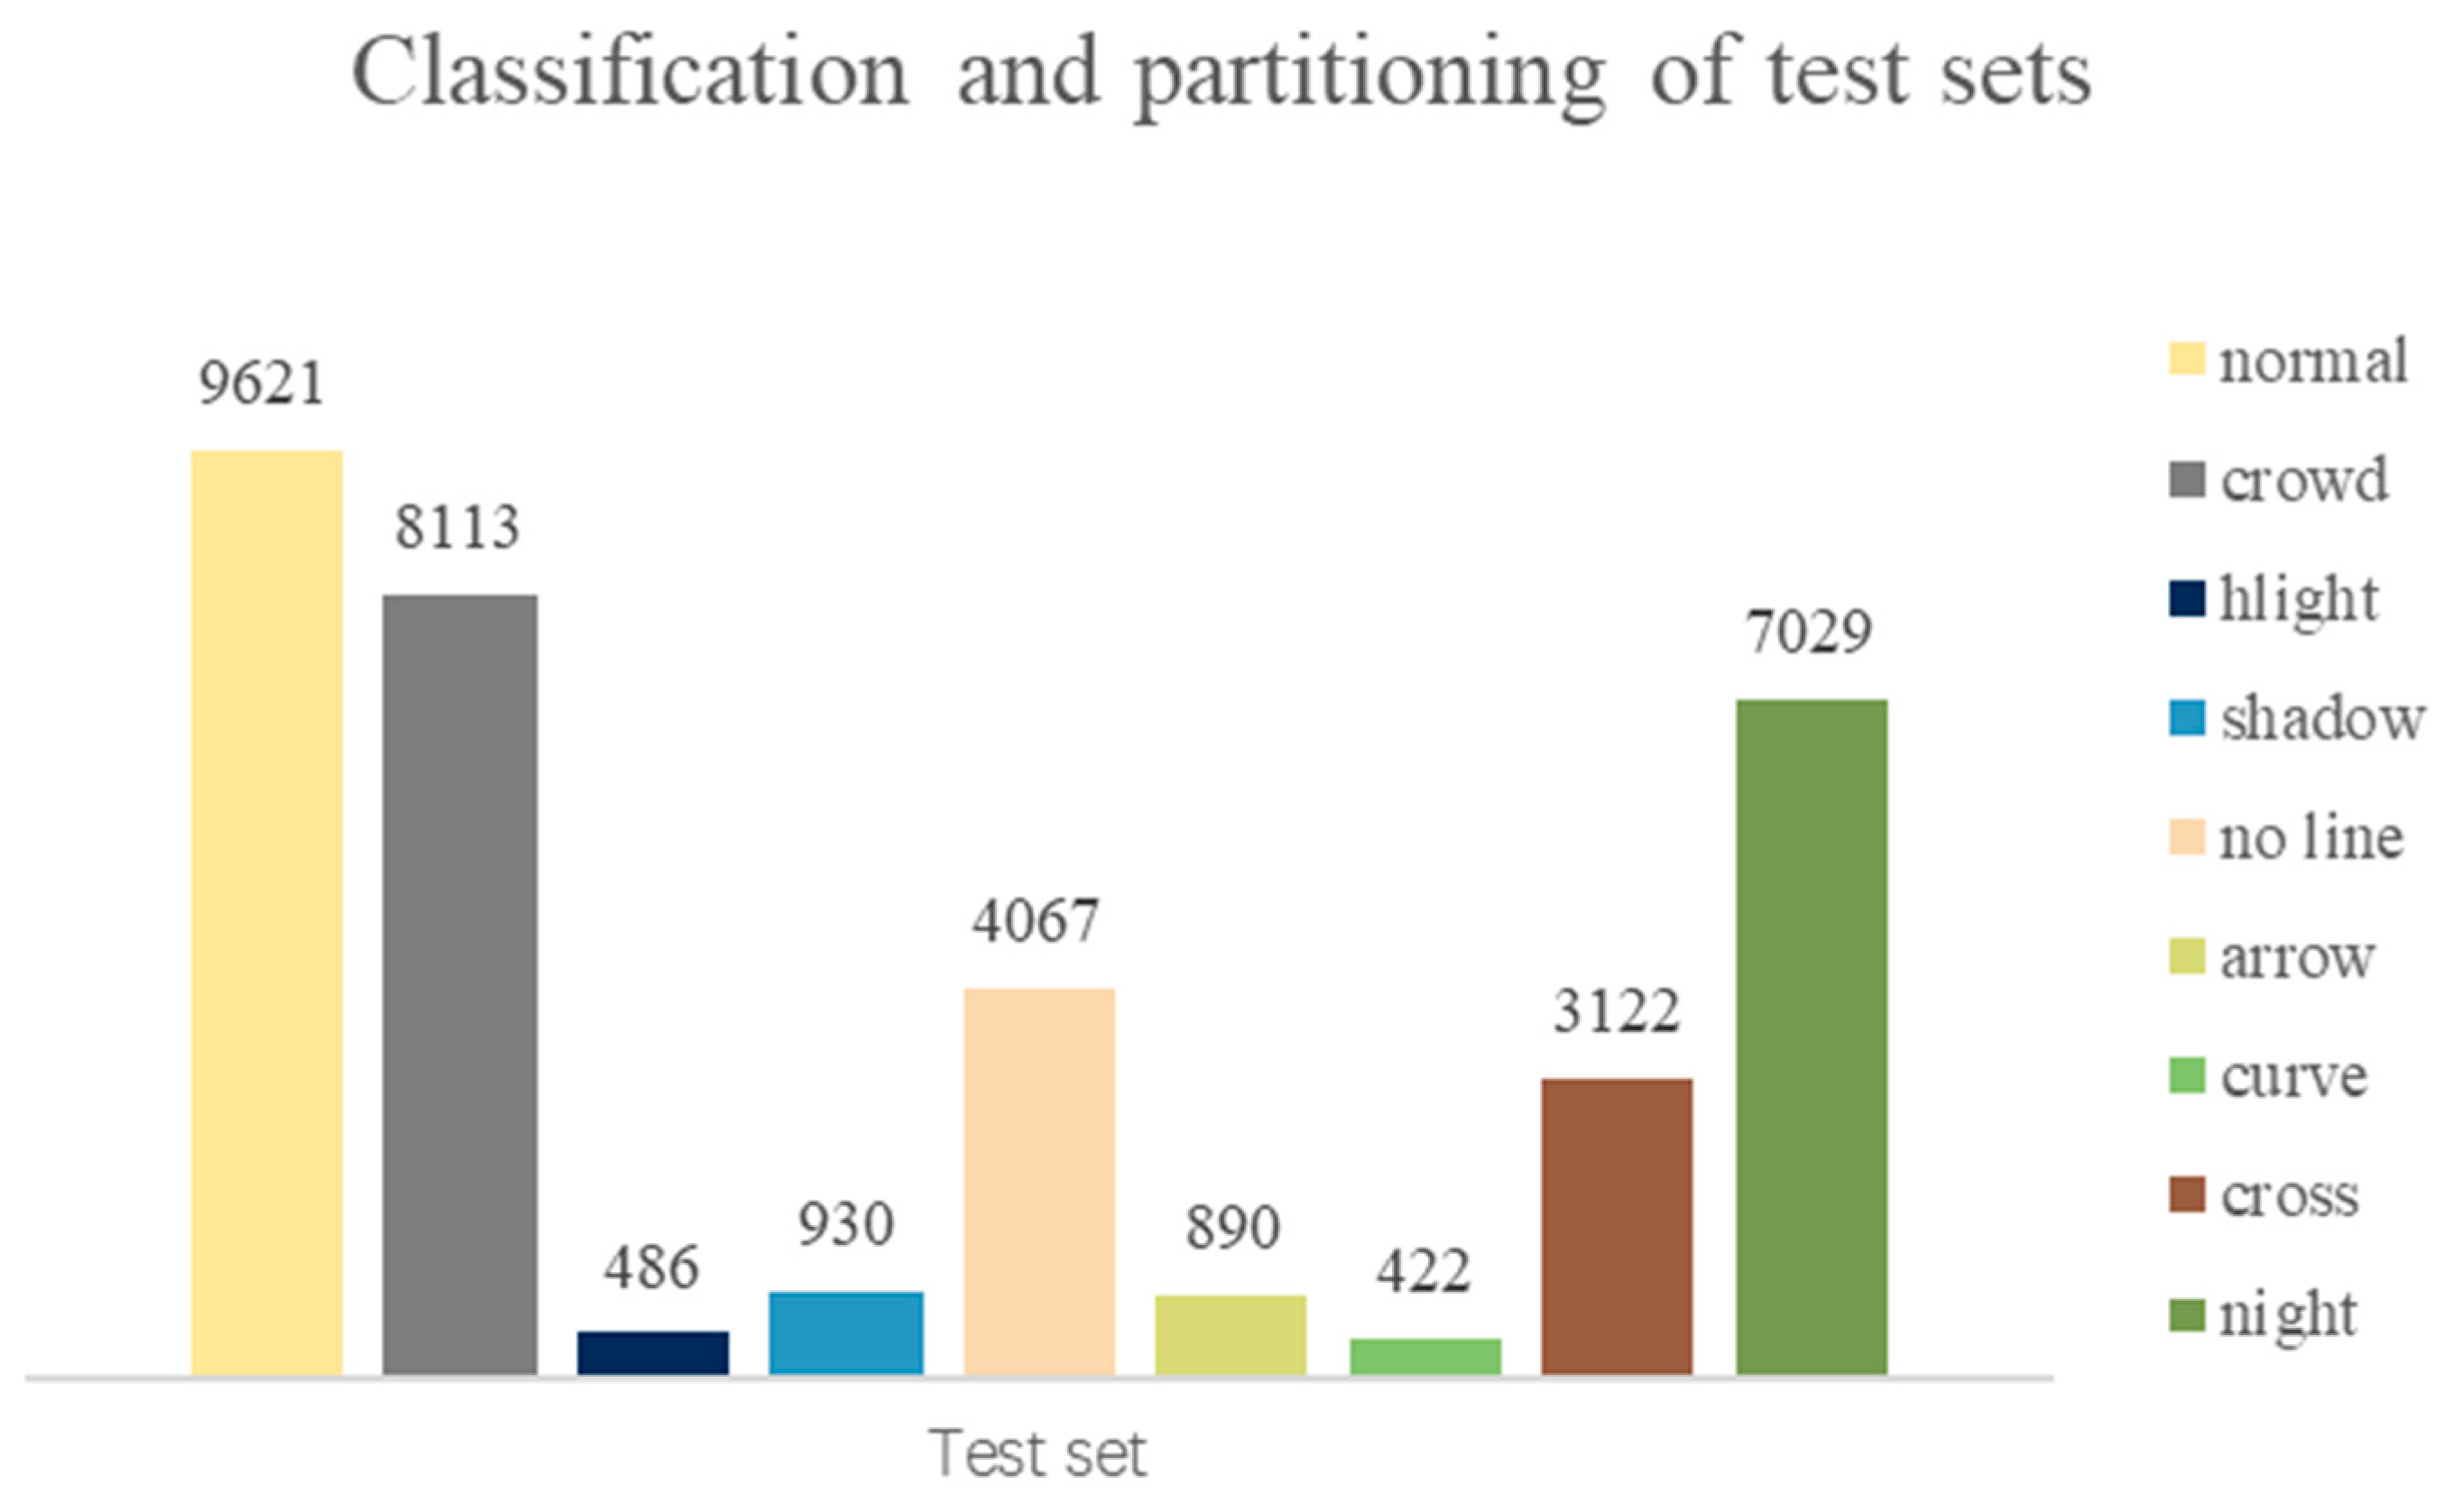
4.1. Dataset Introduction

This study utilizes the commonly used datasets CULane [5] and Tusimple [34] for lane detection. The CULane dataset is divided into 88,880 training samples, 9675 validation samples, and 34,680 test samples. The test set is divided into normal categories and eight challenging categories, including night, light, shadow, and so on. All images are resized to 1640 × 590 pixels. The specific categories and divisions of the CULane test set are shown in Figure 4. The Tusimple dataset is divided into 3268 training samples, 358 validation samples, and 2782 test samples. It exclusively contains highway scenes characterized by clear weather and clear lanes. All images have been resized to 1280 × 720 pixels.

4.2. Evaluation Metrics

In the case of the CULane dataset, the evaluation is conducted using the F1 score, and the computation process is outlined in Formula (5). The F1 score represents the harmonic mean of precision and recall, where the calculation formula for precision is provided in Equation (6), and the calculation formula for recall is given in Equation (7). IoU represents the overlap between the actual lanes and predicted lanes with fixed lane width. If IoU exceeds 0.5, it is categorized as true positive (TP), while if it is below 0.5, it is identified as false positive (FP) or false negative (FN).
F 1 = 2 × P r e c i s i o n × R e c a l l P r e c i s i o n + R e c a l l
P r e c i s i o n = T P T P + F P
R e c a l l = T P T P + F N
For the Tusimple dataset, the main evaluation metric is accuracy, and its calculation formula is as follows:
a c c u r a c y = c l i p C c l i p c l i p S c l i p
where C c l i p is the number of lane points correctly predicted by the model, and S c l i p the total number of true lane points in each clip. Predicted points are considered correct only if they are within 20 pixels of the true points. Additionally, this study also evaluates using the F1 score, where lanes with an accuracy greater than 85% are considered true positives (TP); otherwise, they are classified as false positives (FP) or false negatives (FN).

4.3. Experimental Parameters

The experiments in this study are based on the PyTorch framework, and ResNet18 is used as the backbone network. The specific model parameters of ACSNet are shown in Table 3.

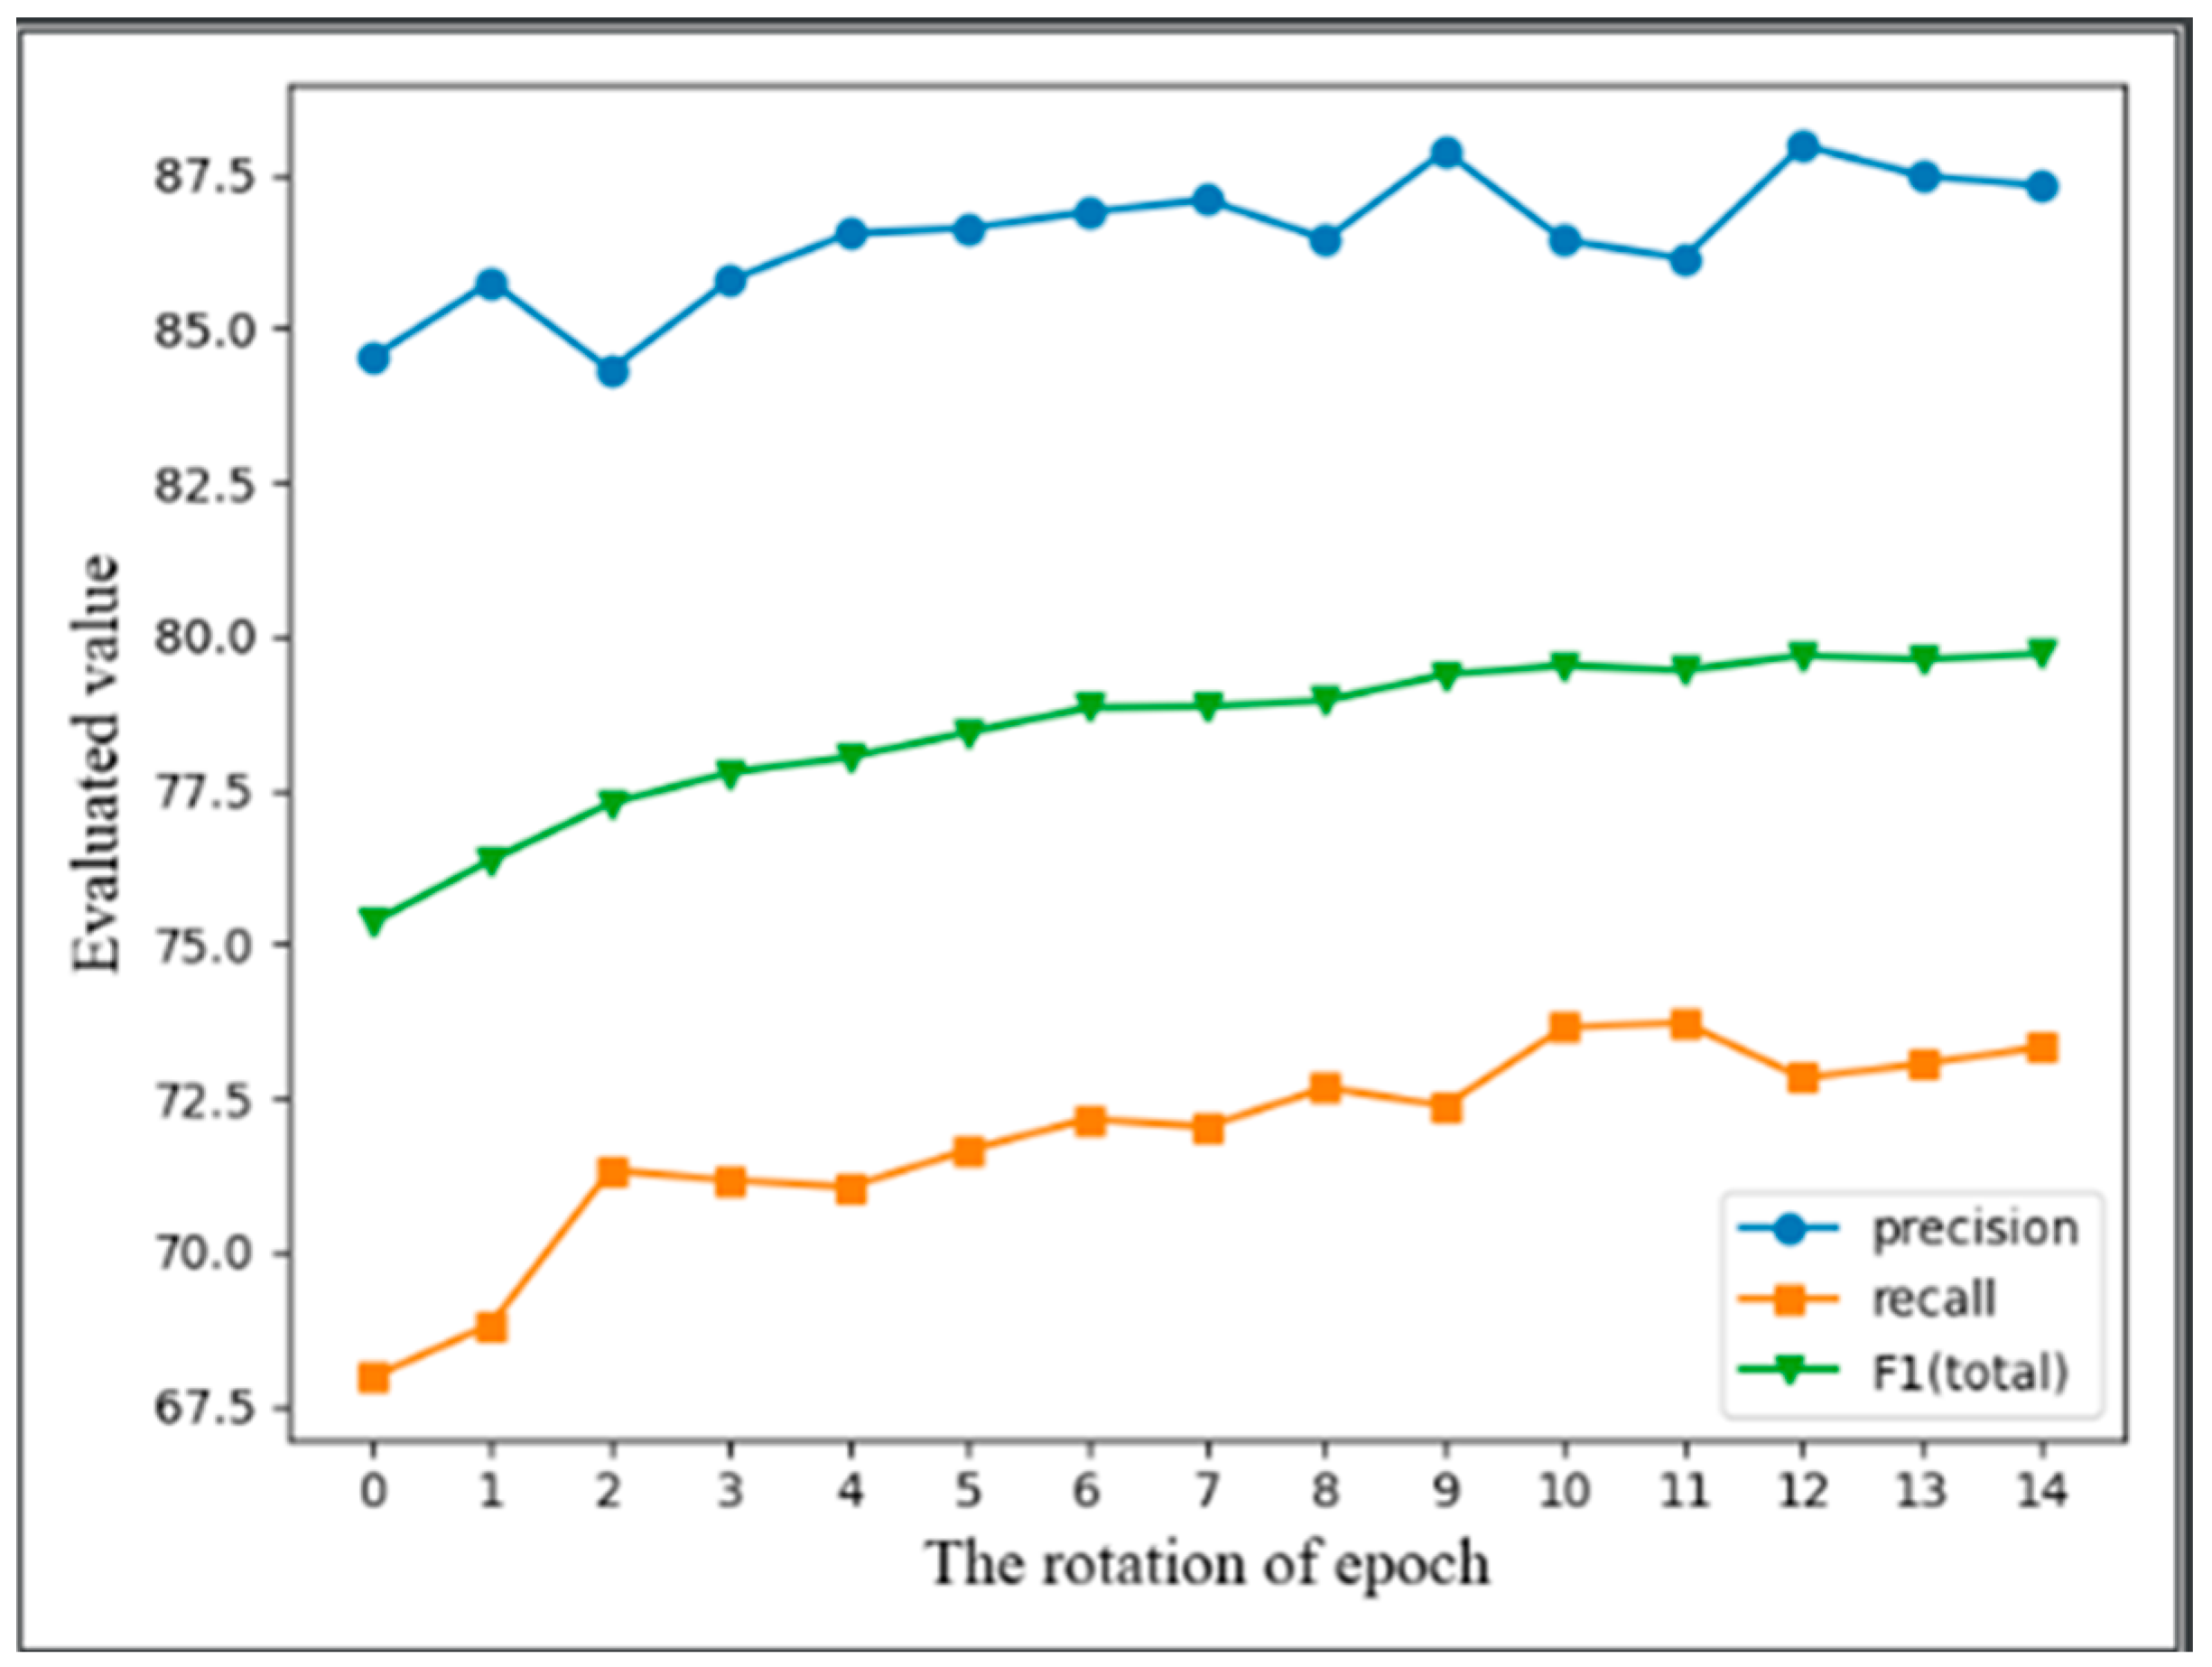
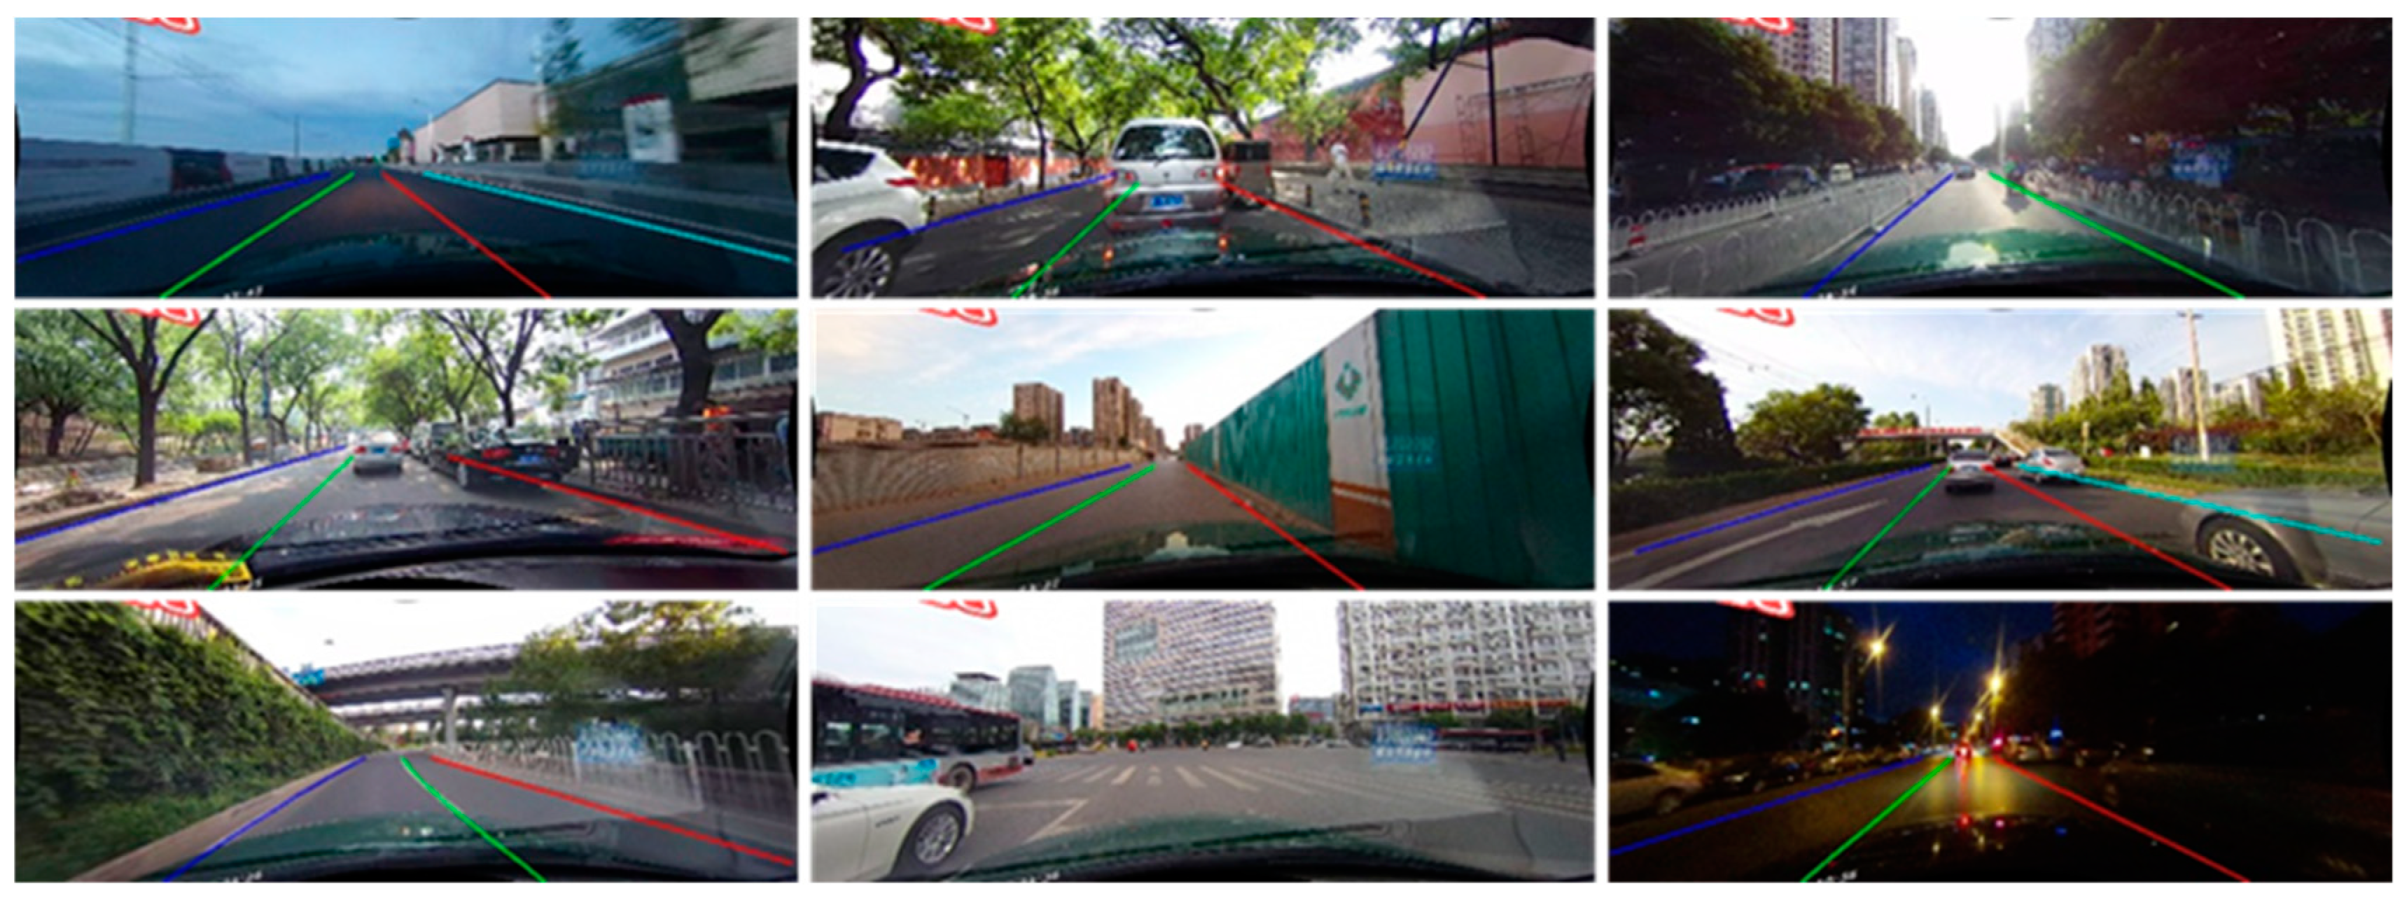
4.4. Experimental Results

4.4.1. Results on CULane

For the overall F1 score, precision, and recall, we have plotted the curves showing their changes during model training, as shown in Figure 5. From Figure 5, it can be observed that the F1 score, precision, and recall show an overall upward trend as the number of epochs increases. Before the seventh epoch, the F1 score increases rapidly, indicating fast learning by the model. After the seventh epoch, precision, and recall start to fluctuate, and the F1 score shows slow growth. At epoch 14, the F1 score reaches its highest point, indicating that the model has learned the optimal parameters.
The performance of ACSNet on the CULane data set relative to other excellent models (such as SCNN, RESA, LaneATT, UFLD, CondLaneNet, etc.) is shown in Table 4. From the table, it can be seen that ACSNet, using ResNet18 as the backbone network, achieves an overall F1 score of 79.70, surpassing the ResNet18 version of CLRNet. Additionally, under the same backbone network conditions, six out of the nine categories outperform all other models, with the shadow category showing a 1.6 improvement relative to CLRNet. ACSNet improves the overall F1 score relative to the baseline LaneATT-ResNet18 by 4.57 and even surpasses the F1 score of LaneATT-ResNet122 by 2.68. Among the challenging nine categories, when compared to the baseline LaneATT-ResNet18, ACSNet leads by a significant margin in eight categories, with only the cross-category showing a slight difference. These data demonstrate the effectiveness of the ACSNet model proposed in this study in various scenarios. The performance of ACSNet in the nine scenes of the CULane test set is shown in Figure 6.

4.4.2. Results on Tusimple

In the case of the Tusimple dataset, we provide not only the official evaluation metric, Accuracy, but also scores for F1, FP, and FN of the prediction results. Furthermore, we visualize their curves as shown in Figure 7. From Figure 7a, it can be observed that Accuracy and F1 increase rapidly before the 40th epoch, after which they show slow growth and fluctuations. This indicates that the model has already learned the optimal parameters before the 70th epoch, and the fluctuations at the end of the curve are a sign of overfitting, which is confirmed by the FP and FN curves in Figure 7b. In the end, the model selects and saves the best parameters as the training result.
ACSNet also performs very well on the Tusimple data set. The performance comparison with other models is shown in Table 5. From the table, it can be seen that ACSNet achieved an accuracy of 96.96, which is an improvement of 1.39 over the baseline LaneATT-ResNet18 and even higher by 0.86 compared to the accuracy of LaneATT-ResNet122. ACSNet has achieved the highest standard in terms of accuracy on the Tusimple dataset. A false positive rate and a false negative rate reflect whether the model can correctly classify samples, and lower values for both indicators are better. From the perspective of a false negative rate and a false positive rate, our proposed model can classify samples effectively. Compared to other models, ACSNet achieved the lowest false negative rate of 1.68. These experimental data once again confirm the effectiveness of ACSNet.

4.5. Ablation Experiment

In this section, we conduct an ablation study on the proposed modules to validate their effectiveness. The hyperparameters for all experiments in this section are kept consistent, and the backbone network is ResNet18.

4.5.1. Overall Ablation Study

Under the same variable conditions, we conducted an ablation study on the TDCA and ACSF_ROI modules, and the model’s performance is shown in Table 6. After removing the TDCA and ACSF_ROI modules, the model achieved an F1 score of 78.93 on the CULane dataset. Adding the ACSF_ROI module alone, the model achieved an F1 score of 79.20 on the CULane dataset, representing an improvement of 0.27 compared to the baseline. By solely incorporating the TDCA module, the model achieved an F1 score of 79.10 on the CULane dataset, surpassing the baseline. This demonstrates that the two modules proposed in this study are effective compared to the baseline. From Table 6, we can observe that incorporating both TDCA and ACSF_ROI modules into the model results in an overall F1 score of 79.70, which is more effective than adding either module individually. This indicates that the synergy between these two modules yields better performance.

4.5.2. TDCA Ablation Study

We conducted component replacement on TDCA in ACSNet, demonstrating the effectiveness of the components proposed in this study compared to other attention mechanisms. In this study, TDCA was replaced with SENet [36], CBAM, and ECA [37], and the specific results are shown in Table 7. SENet belongs to channel attention mechanisms, assigning a weight to each feature channel through global average pooling. From Table 7, it can be observed that when SENet is integrated into the ACSNet model, its F1 score on the CULane dataset is 79.38, and its accuracy on the Tusimple dataset is 96.83, both of which are significantly lower than our TDCA component. ECA replaces the fully connected layer in SENet with 1 × 1 convolution, achieving high efficiency and low parameter count. When ECA is integrated into our model, it achieves a higher F1 score than SENet on the CULane dataset but still remains lower than the TDCA component. CBAM combines the channel attention mechanism and the spatial attention mechanism. It achieves an F1 score of 79.48 on the CULane dataset and an accuracy of 96.85 on the Tusimple dataset. The TDCA component proposed in this study achieves the highest standard compared to the previous three attention mechanisms on the CULane dataset and also achieves the highest accuracy on the Tusimple dataset. This demonstrates that the TDCA proposed in this study is effective compared to the aforementioned three attention mechanisms and can provide the maximum gain to the network.

5. Conclusions

In order to fully extract subtle features from images under challenging conditions such as shadows and extreme lighting, enabling anchors to carry more useful information and promoting their positive optimization, this study proposes a lane-detection strategy, ACSNet, based on adaptive cross-scale ROI fusion. The adaptive cross-scale ROI fusion (ACSF_ROI) module adaptively selects important anchors for large-scale feature extraction and performs cross-scale fusion with the features of all anchors. Relying on this feature extraction method, the detection model can learn features in different fields of view and fully extract features in the image. Additionally, due to the slender structure of lanes, there are relatively fewer useful features in the image. Therefore, this study proposes the Three-dimensional Coordinate Attention (TDCA) mechanism to enhance features. TDCA calculates attention weights for the input feature map along the row, column, and channel dimensions and then combines the obtained weights with the feature map through weighted summation to enhance feature representation. TDCA, as a lightweight component, can be transplanted into other networks without significantly increasing the inference time. Experiments show that the proposed ACSNet achieves excellent performance on two public datasets. ACSNet achieved the highest F1 score of 79.70 on the CULane dataset and the highest Accuracy score of 96.96 on the Tusimple dataset. Moreover, the scores of challenging categories in the CULane dataset significantly outperform other models, with a notable improvement in the F1 scores for the Shadow and Dazzle categories, demonstrating the effectiveness of the two proposed modules in this study.

Author Contributions

Conceptualization, L.D.; methodology, L.D. and X.L.; data curation, L.D., M.J. and H.L.; formal analysis, L.D., M.J. and Z.L.; software, X.L., Z.L. and H.L.; validation, X.L. and J.M.; writing—review and editing, X.L.; investigation, M.J., Z.L. and J.M.; supervision, M.J. and J.M.; writing—original draft preparation, H.L. All authors have read and agreed to the published version of the manuscript.

Funding

This study was supported by the Henan Provincial Science and Technology Research Project: 232102210044, 222102210032, and 232102211006, the Songshan Laboratory Pre-research Project: YYJC012022023, the Research and Practice Project of Higher Education Teaching Reform in Henan Province: 2019SJGLX320 and 2019SJGLX020, the Undergraduate Universities Smart Teaching Special Research Project of Henan Province: Jiao Gao [2021] No. 489-29, the Academic Degrees and Graduate Education Reform Project of Henan Province: 2021SJGLX115Y.

Data Availability Statement

The data presented in this study are openly available in [CULane] at [https://doi.org/10.48550/P7256-7283 (accessed on 19 November 2022)] and [Tusimple] at [https://github.com/TuSimple/tusimple-benchmark/ (accessed on 20 November 2022)] reference number [5] and reference number [34].

Conflicts of Interest

The authors declare no conflict of interest.

References

  1. Premachandra, C.; Gohara, R.; Kato, K. Fast Lane Boundary Recognition by a Parallel Image Processor. In Proceedings of the 2016 IEEE International Conference on Systems, Man, and Cybernetics (SMC), Budapest, Hungary, 9–12 October 2016. [Google Scholar]
  2. Kaur, G.; Kumar, D. Lane detection techniques: A review. Int. J. Comput. Appl. 2015, 112, 4–8. [Google Scholar]
  3. Zakaria, N.J.; Shapiai, M.L.; Ghani, R.A.; Yassin, M.N.M.; Ibrahim, M.Z.; Wahid, N. Lane detection in autonomous vehicles: A systematic review. IEEE Access 2023, 10, 3729–3765. [Google Scholar] [CrossRef]
  4. Tang, J.; Li, S.; Liu, P. A review of lane detection methods based on deep learning. Pattern Recognit. 2021, 111, 107623. [Google Scholar] [CrossRef]
  5. Pan, X.G.; Shi, J.P.; Luo, P.; Wang, X.G.; Tang, X.O. Spatial as deep: Spatial cnn for traffic scene understanding. In Proceedings of the 32nd AAAI Conference on Artificial Intelligence, New Orleans, LA, USA, 2–7 February 2018. [Google Scholar]
  6. Zheng, T.; Fang, H.; Zhang, Y.; Tang, W.J.; Yang, Z.; Liu, H.F.; Cai, D. Resa: Recurrent feature-shift aggregator for lane detection. In Proceedings of the 35th AAAI Conference on Artificial Intelligence, Virtual, 2–9 February 2021. [Google Scholar]
  7. Li, X.; Li, J.; Hu, X.L.; Yang, J. Line-cnn: End-to-end traffic line detection with line proposal unit. IEEE Trans. Intell. Transp. Syst. 2019, 21, 248–258. [Google Scholar] [CrossRef]
  8. Tabelini, L.; Berriel, R.; Paixao, T.M.; Badue, C.; De Souza, A.F.; Oliveira-Santos, T. Keep your eyes on the lane: Real-time attention-guided lane detection. In Proceedings of the 2021 IEEE/CVF Conference on Computer Vision and Pattern Recognition, Virtual, 19–25 June 2021. [Google Scholar]
  9. Qin, Z.; Wang, H.; Li, X. Ultra fast deep lane detection with hybrid anchor driven ordinal classification. IEEE Trans. Pattern Anal. Mach. Intell. 2022. Early Access. [Google Scholar] [CrossRef] [PubMed]
  10. Zheng, T.; Huang, Y.F.; Liu, Y.; Tang, W.J.; Yang, Z.; Cai, D.; He, X.F. Clrnet: Cross layer refinement network for lane detection. In Proceedings of the 2022 IEEE/CVF Conference on Computer Vision and Pattern Recognition, New Orleans, LA, USA, 18–24 June 2022. [Google Scholar]
  11. Wang, W.; Chen, W.; Qiu, Q.; Chen, L.; Wu, B.; Lin, B.; He, X.; Liu, W. Crossformer++: A versatile vision transformer hinging on cross-scale attention. arXiv 2023, arXiv:2303.06908. [Google Scholar]
  12. Deng, L.J.; Fu, R.C.; Sun, Q.; Jiang, M.; Li, Z.H.; Chen, H.; Yu, Z.Q.; Bu, X.Z. Abnormal behavior recognition based on feature fusion C3D network. J. Electron. Imaging 2023, 32, 021605. [Google Scholar] [CrossRef]
  13. Berriel, R.F.; de Aguiar, E.; de Souza, A.F.; Oliveira-Santos, T. Ego-Lane Analysis System (ELAS): Dataset and algorithms. Image Vis. Comput. 2017, 68, 64–75. [Google Scholar] [CrossRef]
  14. Lee, D.H.; Liu, J.L. End-to-end deep learning of lane detection and path prediction for real-time autonomous driving. Signal Image Video Process. 2022, 17, 199–205. [Google Scholar] [CrossRef]
  15. Dong, Y.Q.; Patil, S.; van Arem, B.; Farah, H. A hybrid spatial–temporal deep learning architecture for lane detection. Comput.-Aided Civ. Infrastruct. Eng. 2023, 38, 67–86. [Google Scholar] [CrossRef]
  16. Xu, H.; Wang, S.; Cai, X.; Zhang, W.; Liang, X.; Li, Z. Curvelane-nas: Unifying lane-sensitive architecture search and adaptive point blending. In Proceedings of the Computer Vision–ECCV 2020: 16th European Conference, Glasgow, UK, 23–28 August 2020. [Google Scholar]
  17. Neven, D.; De Brabandere, B.; Georgoulis, S.; Proesmans, M.; Van Gool, L. Towards end-to-end lane detection: An instance segmentation approach. In Proceedings of the IEEE Intelligent Vehicles Symposium (IV), Changshu, China, 26–30 June 2018. [Google Scholar]
  18. Ko, Y.; Lee, Y.; Azam, S.; Munir, F.; Jeon, M.; Pedryca, W. Key points estimation and point instance segmentation approach for lane detection. IEEE Trans. Intell. Transp. Syst. 2021, 23, 8949–8958. [Google Scholar] [CrossRef]
  19. Feng, Z.; Guo, S.; Tan, X.; Xu, K.; Wang, M.; Ma, L.Z. Rethinking efficient lane detection via curve modeling. In Proceedings of the 2022 IEEE/CVF Conference on Computer Vision and Pattern Recognition, New Orleans, LA, USA, 18–24 June 2022. [Google Scholar]
  20. Hou, Y.Z.; Ma, Z.; Liu, C.X.; Loy, C.C. Learning lightweight lane detection cnns by self attention distillation. In Proceedings of the 2019 IEEE/CVF International Conference on Computer Vision, Seoul, Republic of Korea, 27 October–2 November 2019. [Google Scholar]
  21. Lee, M.; Lee, J.; Lee, D.; Kim, W.; Hwang, S.; Lee, S. Robust lane detection via expanded self attention. In Proceedings of the 2022 IEEE/CVF Winter Conference on Applications of Computer Vision, Waikoloa, HI, USA, 4–8 January 2022. [Google Scholar]
  22. Liu, R.J.; Yuan, Z.J.; Liu, T.; Xiong, Z.L. End-to-end lane shape prediction with transformers. In Proceedings of the IEEE Winter Conference on Applications of Computer Vision (WACV), Virtual, 5–9 January 2021. [Google Scholar]
  23. Bodla, N.; Singh, B.; Chellappa, R.; Davis, L.S. Soft-NMS–Improving object detection with one line of code. In Proceedings of the 16th IEEE International Conference on Computer Vision, Venice, Italy, 22–29 October 2017. [Google Scholar]
  24. Qin, Z.; Wang, H.; Li, X. Ultra fast structure-aware deep lane detection. In Proceedings of the Computer Vision–ECCV 2020: 16th European Conference, Glasgow, UK, 23–28 August 2020. [Google Scholar]
  25. Liu, L.Z.; Chen, X.H.; Zhu, S.Y.; Tan, P. Condlanenet: A top-to-down lane detection framework based on conditional convolution. In Proceedings of the 18th IEEE/CVF International Conference on Computer Vision, Virtual, 11–17 October 2021. [Google Scholar]
  26. He, K.M.; Zhang, X.Y.; Ren, S.Q.; Sun, J. Deep residual learning for image recognition. In Proceedings of the 2016 IEEE Conference on Computer Vision and Pattern Recognition, Las Vegas, NV, USA, 27–30 June 2016. [Google Scholar]
  27. Lin, T.Y.; Dollár, P.; Girshick, R.; He, K.; Hariharan, B.; Belongie, S. Feature pyramid networks for object detection. In Proceedings of the 2017 IEEE Conference on Computer Vision and Pattern Recognition, Honolulu, HI, USA, 21–26 July 2017. [Google Scholar]
  28. Qiu, Z.; Zhao, J.; Sun, S. MFIALane: Multiscale Feature Information Aggregator Network for Lane Detection. IEEE Trans. Intell. Transp. Syst. 2022, 23, 24263–24275. [Google Scholar] [CrossRef]
  29. Woo, S.H.; Park, J.; Lee, J.Y.; Kweon, I.S. Cbam: Convolutional block attention module. In Proceedings of the 15th European Conference on Computer Vision, Munich, Germany, 8–14 September 2018. [Google Scholar]
  30. Hou, Q.B.; Zhou, D.Q.; Feng, J.S. Coordinate attention for efficient mobile network design. In Proceedings of the 2021 IEEE/CVF Conference on Computer Vision and Pattern Recognition, Virtual, 19–25 June 2021. [Google Scholar]
  31. Deng, L.J.; Liu, B.Y.; Li, Z.H.; Ma, J.T.; Li, H.B. Context-Dependent Multimodal Sentiment Analysis Based on a Complex Attention Mechanism. Electronics 2023, 12, 3516. [Google Scholar] [CrossRef]
  32. He, K.M.; Gkioxari, G.; Dollár, P.; Girshick, R. Mask r-cnn. In Proceedings of the 2017 IEEE International Conference on Computer Vision, Venice, Italy, 22–29 October 2017. [Google Scholar]
  33. Li, Z.W.; Liu, F.; Yang, W.J.; Peng, S.H.; Zhou, J. A survey of convolutional neural networks: Analysis, applications, and prospects. IEEE Trans. Neural Netw. Learn. Syst. 2021, 33, 6999–7019. [Google Scholar] [CrossRef] [PubMed]
  34. TuSimple. Available online: https://github.com/TuSimple/tusimple-benchmark/ (accessed on 20 November 2022).
  35. Tabelini, L.; Berriel, R.; Paixao, T.M.; Badue, C.; De Souza, A.F.; Oliveira-Santos, T. Polylanenet: Lane estimation via deep polynomial regression. In Proceedings of the 25th International Conference on Pattern Recognition, Virtual, 10–15 January 2021. [Google Scholar]
  36. Hu, J.; Shen, L.; Sun, G. Squeeze-and-excitation networks. In Proceedings of the 2018 IEEE/CVF Conference on Computer Vision and Pattern Recognition, Salt Lake City, UT, USA, 18–23 June 2018. [Google Scholar]
  37. Wang, Q.; Wu, B.; Zhu, P.; Li, P.; Zuo, W.; Hu, Q. ECA-Net: Efficient channel attention for deep convolutional neural networks. In Proceedings of the 2020 IEEE/CVF Conference on Computer Vision and Pattern Recognition, Seattle, WA, USA, 13–19 June 2020. [Google Scholar]
Figure 1. Network architecture diagram of ACSNet.
Electronics 12 04911 g001
Figure 2. ACSF_ROI structure diagram.
Electronics 12 04911 g002
Figure 3. Structure of the Three-dimensional Coordinate Attention Mechanism.
Electronics 12 04911 g003
Figure 4. Detailed categories and quantities in the CULane test set.
Electronics 12 04911 g004
Figure 5. Curves depicting the changes in overall F1 score, precision, and recall with training on the CULane dataset.
Electronics 12 04911 g005
Figure 6. ACSNet’s performance on nine scenarios in the CULane test dataset.
Electronics 12 04911 g006
Figure 7. (a) Curves showing the accuracy and F1 score of ACSNet on the Tusimple dataset as they change during training. (b) Curves showing the FP and FN scores of ACSNet on the Tusimple dataset as they change during training.
Electronics 12 04911 g007
Table 1. Comparison table of parameters and variables for TDCA, CBAM, and CA. Channel represents channel attention mechanism, Spatial represents spatial attention mechanism, and - represents none.
Parameters and VariablesCACBAMTDCA
ChannelChannelSpatialChannelSpatial
Layers34131
Kernel size(1, 1)(1, 1)(7, 7)(1, 1)(7, 7)
Reduction ratio1616-4, 8, 16-
NormalizationBatchNorm+
Non-linear
--BatchNorm-
Activation functionSigmoid
H_swish
Sigmoid
Relu
SigmoidSigmoid
H_swish
Sigmoid
Pooling methodAvg PoolAvg Pool
Max Pool
Avg Pool
Max Pool
Avg Pool
Max Pool
Avg Pool
Max Pool
Table 2. Parameters and variables table for ACSF_ROI.
Parameters and VariablesValues
Layers12
Dropout0.1
Adaptive threshold0.4
Number of samples36
Adaptive number of samples72
Initialize the number of anchors192
Resizing of feature maps in ACSF_ROI(10, 25)
Convolution kernel size for the first branch(13, 1), (1, 1)
Convolution kernel size for the second branch(9, 1), (1, 1)
Activation functionRelu, Softmax
NormalizationBatchNorm, LayerNorm
Table 3. Experimental parameters.
Parameter NamesValues
Input image size320 × 800
OptimizerAdam
Dropout0.1
Initial learning rate0.001
Number of samples36
Adaptive number of samples72
Adaptive threshold0.4
Initialize the number of anchors192
Resizing of feature maps in ACSF_ROI(10, 25)
Batch size of CULane dataset24
Batch size of Tusimple dataset30
Epoch of the CULane dataset15
Epoch of the Tusimple dataset70
Table 4. ACSNet’s performance on the CULane test set evaluated using the F1 score with an IoU threshold of 0.5. Only False Positives (FP) are shown for the Cross category. Bold indicates the best result.
MethodTotalNormalCrowdedDazzleShadowNo LineArrowCurveCrossNight
SCNN [5]71.6090.6069.7058.5066.9043.4084.1064.40199066.10
ENet-SAD [20]70.8090.1068.8060.2065.9041.6084.0065.70199866.00
CurveLanes-NAS-L [16]74.8090.7072.3067.7070.1049.4085.8068.40174668.90
RESA-Res34 [6]74.5091.9072.4066.5072.0046.3088.1068.60189669.80
RESA-Res50 [6]75.3092.1073.1069.2072.8047.7088.3070.30150369.90
LaneATT-Res18 [8]75.1391.1772.7165.8268.0349.1387.8263.75102068.58
LaneATT-Res34 [8]76.6892.1475.0366.4778.1549.3988.3867.72133070.72
LaneATT-Res122 [8]77.0291.7476.1669.4776.3150.4686.2964.05126470.81
UFLD-Res18 [24]68.4087.7066.0058.4062.8040.2081.0057.90174362.10
UFLD-Res34 [24]72.3090.7070.2059.5069.3044.4085.7069.50203766.70
CLRNet-Res18 [10]79.5893.3078.3373.7179.6653.1490.2571.56132175.11
ACSNet (ours)79.7093.3178.1074.4681.2953.2290.4071.56104574.89
Table 5. Performance of ACSNet on the Tusimple dataset relative to other models. This study also provides the F1 score, false positive rate, and false negative rate as references. The IOU threshold is 0.5. Bold indicates the best result. ↓ means the lower the value, the better.
MethodF1 (%)Acc (%)FDR (%) ↓FNR (%) ↓
SCNN [5]95.9796.536.171.80
ENet-SAD [20]95.9296.646.022.05
RESA-Res34 [6]96.9396.823.632.48
LaneATT-Res18 [8]96.7195.573.563.01
LaneATT-Res34 [8]96.7795.633.532.92
LaneATT-Res122 [8]96.0696.105.642.17
CondLaneNet-Res101 [25]97.2496.542.013.50
CLRNet-Res18 [10]97.8996.842.281.92
CLRNet-Res34 [10]97.8296.872.272.08
PolyLaneNet [35]90.6293.369.429.33
LSTR-Res18 [22]96.8596.182.913.38
ACSNet (ours)97.4896.963.311.68
Table 6. Overall ablation experiments on the CULane dataset. ✓ means including.
BaselineTDCAACSF_ROIF1
78.93
79.10
79.20
79.70
Table 7. TDCA ablation study. Bold indicates the best result.
MethodCULaneTusimple
F1AccuracyF1
SENet 79.3896.8397.63
CBAM 79.4896.8597.46
ECA 79.5396.8997.71
TDCA79.7096.9697.48
Disclaimer/Publisher’s Note: The statements, opinions and data contained in all publications are solely those of the individual author(s) and contributor(s) and not of MDPI and/or the editor(s). MDPI and/or the editor(s) disclaim responsibility for any injury to people or property resulting from any ideas, methods, instructions or products referred to in the content.

