Abstract
In modern warfare, it is often necessary for the operator to control the UAV cluster from a ground control station to perform an attack task. However, the absence of an effective method for optimizing the human–computer interface in ground control stations for UAV clusters leads to usability difficulties and heightens the probability of human errors. Hence, we propose an optimization framework for human–computer interaction interfaces within UAV ground control stations, rooted in interface-essential elements. Specifically, the interface evaluation model was formulated by combining the Salient, Effort, Expectancy, and Value (SEEV) framework with the essential factor mutation cost of the quantified interface. We employed the SEEV–ant colony algorithm to address the challenge of optimizing the interface design within this context. For a typical UAV cluster attack mission, we optimized the human–computer interaction interfaces of the three mission stages based on the proposed SEEV-AC model. We conducted extensive simulation experiments in these optimized interfaces, and used eye-movement indicators to evaluate the effectiveness of the interface optimization model. Based on the experimental results, divergence is reduced by 11.59%, and the fitness of the optimized interface is increased from 1.34 to 3.42. The results show that the proposed intelligent interface optimization method can effectively improve the interface design and reduce the operator’s workload.
1. Introduction
With the development of modern warfare towards intelligence, the unmanned aerial vehicle (UAV) has gradually become an indispensable force. The ground control station (GCS) is an important place for operators to control UAVs to perform missions [1]. The design of the operation interface of GCSs directly affects the flight safety and efficiency of UAVs [2]. The current battlefield environment has become increasingly intricate, thereby driving the human–computer interaction (HCI) interface of UAV-GCSs towards higher levels of integration and complexity [3]. The multi-dimensional information such as UAV status, navigation flight path, payload information, situation map, and so on, need to be simultaneously displayed on the interface (Figure 1). However, in the actual use by operators, the interface often displays a huge amount of information, some of which is usually not closely related to the missions’ requirements. This makes it easy for operators to ignore key information, causing human error, resulting in the loss of the UAV [4,5,6]. Thus, in a complex environment, a reasonable interface is one of the main ways to effectively improve the comfort, safety, and efficiency of an HCI in the process of a UAV confrontation [7,8].
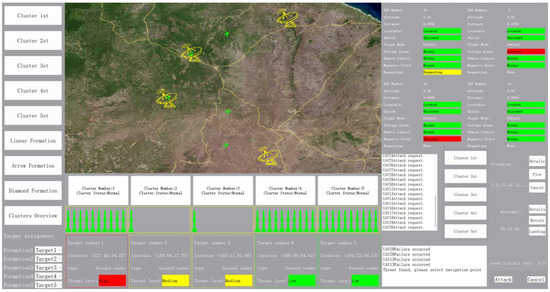
Figure 1.
The human–computer interaction interface diagram of a UAV-GCS.
In recent years, researchers have carried out in-depth research on optimization methods and intelligent algorithms for solving the problems of the HCI interface. Ye et al. optimized the interface of an aircraft cockpit based on a visual attention model [9]. Yang et al. optimized the interface by studying the visual attention distribution of pilots when observing instruments [10]. Jin et al. optimized the interface of the tunnel rescue virtual reality (VR) system by building a layout model based on a visual attention mechanism, color, and spacing [11]. Wu et al. proposed an error-cognition (EC) mapping model based on users’ cognition errors in complex systems, and applied the model to the optimization of a display interface for complex fighter equipment [12]. Wang et al. determined the optimal interface of the control cabin display console of air defense and anti-missile equipment by constructing a layout model based on operation habits, cognition, and psychological characteristics [13]. Zhang et al. carried out an ergonomic simulation of the visual field, reachable field, and comfort of a user interface for agricultural machinery, and analyzed the direction of interface optimization based on it [14].
The above research aims to design interfaces based on user factors such as visual attention and cognition, but the optimization results often pose challenges in terms of generalization, indicating limitations in the applicability of these optimization algorithms. To overcome this limitation, many researchers have started using intelligent algorithms. Deng et al. combined human cognitive characteristics with comfort requirements and proposed an HCI interface design of a cabin based on the genetic algorithm–ant colony algorithm (GA-ACA) [15]. Kang studied the layout optimization design of the HCI interface under multi-objective conditions based on a genetic algorithm [16]. Zhang et al. proposed a visual perception field model based on the concept of field in physics, and adopted a genetic algorithm to determine the optimal HCI interface scheme based on the visual perception field [17]. Chen et al. established the principle of quantifying cognitive load based on eye-movement indicators to guide interface design, and used the sparrow search algorithm to optimize its design [18]. Yan et al. established a mathematical model for the optimization of the matching degree of the HCI interface in the main control room of a nuclear power plant, and adopted a genetic algorithm to realize adaptive interface optimization [19]. Zhao et al. built the HCI interface optimization model of mechanical equipment based on the visual field and reachable field, and determined the optimal interface scheme using an ant colony algorithm [20].
To sum up, researchers have conducted extensive studies on HCI interface optimization methods for various equipment, and have achieved certain results. However, the existing interface optimization methods have relatively simple optimization objectives and emphasize determining the importance weight of information based on expert experience, which has certain limitations. These methods are difficult to apply to multi-stage, multi-dimensional information, multi-object, and multi-function HCI requirements in UAV cluster attack scenarios.
Therefore, the three contributions of this paper aim to solve the above problems on the basis of a review of the literature:
- This paper proposes a comprehensive multi-dimensional and multi-factor evaluation method of the HCI interface in GCS under the scenario of a UAV cluster attack control mission. The interface evaluation model incorporating visual attention allocation factors, cognitive psychological characteristics, and attack mission requirements is developed, consisting of five evaluation factors: Salient, Effort, Expectancy, Value, and Cost of interface mutation.
- A SEEV–ant colony algorithm is proposed to establish an implementation method that can adaptively optimize the interface according to the stage of the UAV cluster attack mission.
- A simulated scenario for a typical UAV cluster attack mission is established, and a thorough comparative analysis was conducted between static and adaptive interfaces, focusing on their impact on operators. Utilizing an eye-movement indicator-based model, we assessed interface performance. The results show an 11.59% reduction in operator divergence when using adaptive interfaces in comparison to static ones. Moreover, the evaluation of interface optimization reveals a more than 2.5-fold enhancement in fitness for adaptive interfaces compared to static ones, highlighting a substantial improvement in interface performance.
The rest of the paper is organized as follows: Section 2 proposes the quantification and evaluation methods of interface-essential elements. Section 3 established the SEEV-factor-integrated ant colony algorithm to implement the adaptive interface optimization model. Section 4 shows the design of the verification experiment, and analyzes and discusses the obtained experimental results. Section 5 discusses limitations and challenges. Section 6 concludes the paper and proposes future work.
2. SEEV-Enhanced Interface Evaluation Model
A promising adaptive interactive interface needs to automatically adjust the size and layout of the interface elements based on task objectives and guide the operator to allocate more visual attention to the interface elements whose functions help to achieve the task objectives. Additionally, when the layout of the interface elements changes, the operator will have an interval of observing and understanding the reconstructed interface. If the layout of the two interface elements before and after reconstruction is considerably distinct, it will break the operator’s original interface cognition and increase the difficulties of obtaining information. Therefore, this study establishes an interface evaluation method from two aspects: visual attention distribution factors and interface mutation effects. This method aims to optimize the allocation of the operator's limited attention resources and to ensure that the operator maintains a high level of cognition. This guarantees that the operator’s attention is directed in a way that maximizes the efficiency and effectiveness of their cognitive resources. The framework of the proposed intelligent interface optimization method designed in this paper is shown in Figure 2 which consists of five main components:
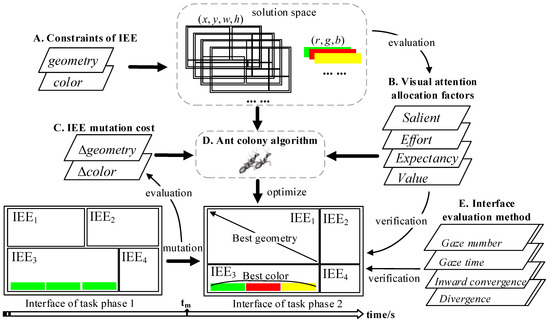
Figure 2.
Adaptive interface optimization model framework. Possible colors on the interface include green, red, and yellow and so on. For example, the IEE3 part in Figure 3 shows that three colors of red, yellow and green are used to distinguish the high, medium and low threat levels.
- (A) Quantify the impact factors of interface design, see Section 2.1 for details;
- (B) Establish an interface evaluation model based on the SEEV model, see Section 2.2 for details;
- (C) Quantify the cost of the intelligent optimization process of the interface to the interface evaluation, see Section 2.3 for details;
- (D) The interface evaluation factor is introduced to improve the ant colony algorithm to realize the intelligent optimization of the interface, see Section 3 for details;
- (E) Test the use effect of the intelligent optimized interface, see Section 4.3 for details.
2.1. Geometry and Color Quantization Method of IEE
The interface-essential element (IEE) is divided according to the functions of different regions of the interface [21]. According to the interface design practice of GCS [22,23], we built an HCI interface for UAV cluster attack missions in a portable UAV-GCS, as shown in Figure 3. This paper takes the interface of the middle screen as the research object, which includes 4 IEEs.
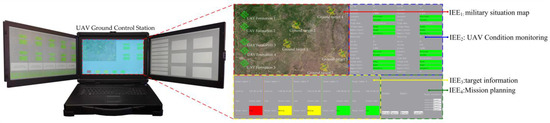
Figure 3.
UAV ground control station device and HCI interface.
- (1)
- Military situation map: the function is to display the complex situation, including the map of the battlefield area, the position of our UAV, and the enemy ground targets;
- (2)
- UAV condition monitoring: the detailed information of the four UAVs can be displayed at the same time, including the UAV ID, height, distance, navigation state, flight mode, voltage state, communication state, magnetic field state, and attack mode;
- (3)
- Target information: displays target type, location coordinates, and threat level.
- (4)
- Mission planning: provides interactive functions such as task allocation and attack authorization for the operator, and displays the feedback information of the UAV.
To explain the visual attention allocation of human beings in a multi-task environment, Wickens et al. propose the SEEV model based on the research of cognitive psychology and ergonomics [24]. Based on their research, this paper transforms SEEV into the design strategy of the HCI interface of the UAV-GCS, and establishes the definition and calculation model of IEE.
2.1.1. Geometry Definition of IEE
The shape of the interface elements in this paper is rectangular, as shown in Figure 2, so the geometry definition of IEE can be represented by a four-tuple composed of the vertex coordinates of the upper left corner, the width, and the height. The proposed optimization model focuses on the effect of the interface layout structure on HCI efficiency, and it is necessary to avoid the influence of hardware parameters. Therefore, the geometric definition of IEE is not based on pixel points as specific units, but takes the proportion of the length to the width or height of the entire interface. Assuming that the variable geometry is the geometric description of IEE, as shown in Equation (1).
where x is the abscissa of the upper left corner of the interface element, y is the ordinate of the upper left corner, w is the width of the interface element, and h is the height of the interface element.
The constraint that all IEEs within the HCI interface can be simplified as ensuring that the upper left corner and the lower right corner of the interface elements fall within the interface, as shown in Equation (2).
For any two IEEs, there are four kinds of positional relationships, and the non-overlapping positional constraints are shown in Equation (3).
2.1.2. Color Definition of IEE
When the operator obtains information from the interface, the influence of color on attention mainly comes from the color difference between the information expression color and the background in the interface elements [25]. Therefore, the influencing factors of color of the interface elements are defined in Equation (4). Each component is represented by an 8-bit binary number and quantified by the widely used RGB color space. Assuming that the variable color is the color description of the IEE.
where rI, gI, bI are the interface element information expression colors, and rB, gB, bB are the interface element background colors.
2.2. Analysis of IEE Based on SEEV
When controlling a UAV cluster, a large amount of information usually appears, competing for the operator’s limited attention resources. It is necessary for operators to maintain excellent situation awareness, allocate attention resources to key information, and ensure efficiency. An excellent interactive interface helps the operator to allocate the correct attention resources quickly, while a poor interface will waste a lot of attention resources of the operator. Therefore, based on the SEEV model, this paper quantifies the fitness of the interface through four key attention allocation factors, namely Salient, Effort, Expectancy and Value.
2.2.1. Salient
The Salient (S) quantifies the impact of an interface element’s dimensions, color attributes, and spatial placement on the allocation of the operator’s visual attention. S is used to describe the perceptibility of objects, which is affected by the area saliency C1, color saliency C2 and position saliency C3 of interface elements. Therefore, the significance is quantified as Formula (5).
where , , are the weighting coefficient determined by the different sensitivities of the human eye to the primary colors red, green, and blue, and the value in this paper is (3,4,2). is the coordinate of the line of sight, and d is the dimensionless value of the normalized actual distance between the human eye and the interface.
2.2.2. Effort
Effort (EF) pertains to quantifying the visual resource allocation challenge associated with information retrieval within various IEEs. EF is the degree of difficulty in diverting attention. By calculating the relative distance between different interface elements, the amount of effort required for attention transfer is quantified, as shown in Equation (6).
where EFi is the effort quantization value corresponding to IEEi, and N is the total number of IEEs.
2.2.3. Expectancy
Expectancy (EX) quantifies the efficiency and effectiveness of information exchange between interface elements and operators. EX indicates that the operator should pay attention to the degree of the interface element, which is quantified as the proportion of the expected weight of the interface element to the sum of the expected weights of all interface elements, as shown in Equation (7).
where is the expected weight of IEEi, which is determined according to expert experience. is the sum of the expected weights of all interface elements.
2.2.4. Value
Value (V) entails quantification of the importance attributed to different interface-essential elements based on their functionality within distinct missions. This quantification is expressed using a priority scale. The information priority is embodied as V. In the UAV cluster attack mission, the operator always tends to allocate attention to information with higher value. Referring to the results of the questionnaire survey data of Beringer of the Civil Aviation Medical Institute of the Federal Aviation Administration, the information types in the interface of the UAV cluster attack mission are divided into four information priorities [26]. The specific classification results are shown in Table 1.

Table 1.
The priority corresponds to the information in the interface.
2.3. Analysis of the Interface Essential Factor Mutation Cost
Through the intelligent optimization model, the position and quantity of information on the interface will be automatically adjusted with the different mission stages, and the operator needs to reconstruct the cognition of the adjusted interface. The cognitive load caused by this process on the operator is defined as the interface essential factor mutation cost (IEFMC), which is proposed as a variable of the IEE evaluation method in this paper.
The influence of a single interface element on other interface elements has been included in the attention allocation, so it is considered that the influence on the operator of each interface element mutation is independent of the others. The mutation cost IEFMCi includes geometric mutation cost and color mutation cost, as shown in Equation (8).
where is the geometric mutation cost, is the color mutation cost.
The geometric catastrophe cost is composed of two factors: the position and the area change of the IEE, as shown in Equation (9).
where is the influence of the change of interface element position, and is the influence of the change of interface element area. is the position after IEEi mutation, and is the position before IEEi mutation.
The cost of color mutation is composed of two factors: color mutation of background interface elements and color mutation of interface information, as shown in Equation (10).
where is the influence of information color change in interface elements, and is the influence of background color change in interface elements. and are the color description of the information and background before the interface element changes, and are the color description of the information and background after the interface element changes.
3. SEEV-AC Interface Optimization Model
The ant colony (AC) algorithm is a bionic intelligence algorithm proposed by Marco Dorigo [27], which simulates the search mechanism of ant colony with pheromone as the medium. It has the characteristics of a positive feedback mechanism and heuristic search [28], and is widely used in combinatorial optimization problems [29,30]. Based on the IEE evaluation method proposed in Section 2, this paper establishes the SEEV-AC algorithm to optimize the interface for different mission types.
The four factors S, EF, EX and V, quantified within the SEEV framework, collectively constitute visual attention allocation factor determinants. For the interface element IEEi, the error function is constructed by combining the visual attention allocation factors, as shown in Equation (11). When the mission type changes, the interface with the smallest error function is the optimal interface.
where , , , are the Salient, Effort, Expectancy and Value factors of IEEi, respectively. f is a normalized function; that is, linear transformation of the original data, so that the interaction interface and the operator’s influencing factors are in the range [0, 1].
The algorithm optimizes the interface by adjusting the size and position of the IEEs. Aiming at the interface composed of different IEEs, the goal of the SEEV-AC algorithm is to find the interface with the best possible comprehensive interface evaluation index. The comprehensive evaluation index is defined by the interface fitness function, which describes the comprehensive evaluation index of the process of interface adaptive adjustment and the operational effect of the optimized interface. The value of the fitness function is positively correlated with interface adaptation. The mutation cost of interface elements describes the negative impact of the adaptive optimization of the interactive interface on operator cognition. The fitness function needs to consider the sum of the attention allocation errors of each interface element and the interface mutation cost, as shown in the Formula (12).
under the interface constraints, m is the size of the ant colony, and n is the number of interface elements to be selected. The set allowedk (k = 1, 2, …, m) is used to record the combination of interface elements that the ant currently walks through. In the search process, the ant k (k = 1, 2, …, m) calculates the transition probability according to the pheromone concentration on each path and the heuristic information of the path. In this paper, combined with the SEEV model, the nodes are mapped to the combination of interface elements, and the distance between nodes is mapped to an error function quantified by the attention allocation factor. The SEEV-AC algorithm flowchart is shown in Figure 4: the highlighted steps in it are algorithm-driven steps that integrate SEEV evaluation indicators based on AC algorithm.
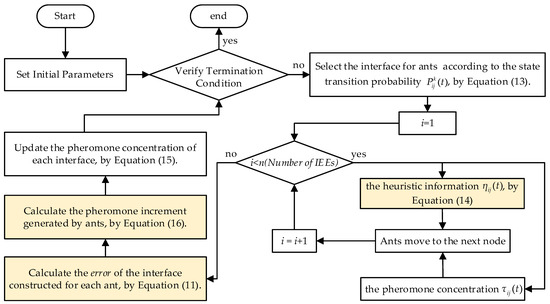
Figure 4.
The SEEV-AC algorithm flowchart.
Figure 4 provides an overview of the SEEV-AC algorithm’s workflow, which can be detailed as follows: To start, the relevant parameters are initialized, including the number of ants, the pheromone heuristic factor, the expected heuristic factor, the pheromone volatilization coefficient, and the maximum number of iterations. Next, the solution space is constructed, and ants select interfaces with different starting points based on state transition probabilities. Subsequently, the ants traverse all IEEs, and record heuristic information and pheromone concentrations for each IEE. Then, the error of the interface constructed by each ant is calculated. The pheromone increments for each interface are calculated to update their pheromone concentration. We update the current optimal interface, which boasts the highest fitness score. The termination condition of the algorithm is reaching the maximum number of iterations or stagnation has occurred. If either condition is met, the algorithm terminates, and the current optimal interface is outputted. Otherwise, the algorithm proceeds to the next iteration.
denotes the state transition probability of ant k from interface i to interface j at time t, as shown in Formula (13).
where is the pheromone heuristic factor, indicating the importance of the pheromone. is the expected heuristic factor, which indicates the importance of heuristic information. represents the pheromone concentration at time t. represents the set of ant k next selectable nodes.
where is the heuristic information, which is mapped to the interface evaluation index.
Usually, ants leave a certain amount of pheromone during their movement, and its concentration changes over time. Whenever the ant completes an iteration, the pheromone is updated, and the specific update rule is shown in Formula (15).
where represents the pheromone volatilization coefficient. denotes the increment of pheromone in this cycle.
where Q represents the total amount of pheromone released by the ants on the path once per cycle, which is set to a constant. is the sum of the errors of the interface elements evaluated by the ant in this cycle.
The framework of the intelligent interface optimization model is shown in Figure 5. The selection of , and will affect the performance of the algorithm. The larger the , the faster the pheromone evaporation in the iterative process. The algorithm pays more attention to the breadth of the search space, which is conducive to exploring a new solution space. On the contrary, the algorithm pays more attention to the depth of the search space and tends to choose from the explored good results. The larger the , the more the SEEV-AC model focuses on finding the optimal interface, and the results may change greatly compared with the original interface. Under the constraint of IEFMC, the larger , the SEEV-AC model tends to explore based on the optimal interface of the previous task stage. In application, the balance between them should be weighed to ensure that a feasible optimal solution can be found quickly.
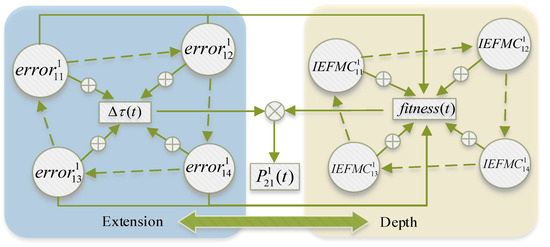
Figure 5.
The framework of the interface optimization model.
4. Experiments and Results Analysis
This section includes the UAV cluster attack mission scenario, the SEEV-AC model training results in this scenario, and the comparison and analysis of the model’s performance.
4.1. Simulation Environment
To test the capability of the model, based on the design paradigm and research foundation [31,32], a typical UAV cluster ground attack scenario was established using the Qt graphical user interface development software. The design of the HCI interface and the definition of the IEEs are shown in Figure 3. The operators need to use this interface to complete the three stages of experimental missions, as shown in Figure 6. The three stages are the task stage of avoiding the threat area, the task stage of tactical planning and target assignment, and the task stage of attacking ground targets.
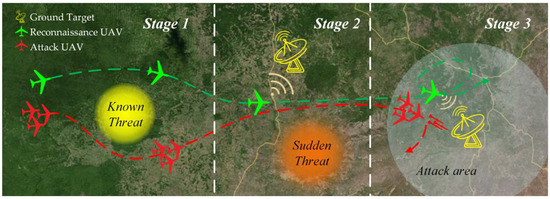
Figure 6.
UAV cluster ground attack mission stages.
- Stage 1: Five of our UAV clusters enter from the left side of the enemy area, and the operator performs route point selection to assist the UAVs in avoiding known threat areas. As shown in Figure 7a, the operator needs to command the UAV formation to select the navigation point to avoid the UAVs entering the threat area. Three navigation points and a known threat area are set up.
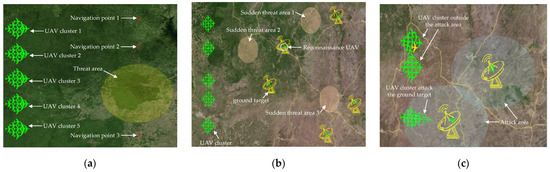 Figure 7. The UAV cluster ground attack scenario and tasks set up. (a) Stage 1; (b) stage 2; (c) stage 3.
 - Stage 2: A reconnaissance UAV searches for enemy ground targets and hovers in the target airspace to continuously monitor the target. According to the reconnaissance information, the operator performs tactical planning and target assignment of the UAV cluster to avoid sudden unknown threats. As shown in Figure 7b, after the reconnaissance UAV autonomously searches for the enemy ground target, the operator needs to comprehensively consider the target location, the sudden threat area, and the state of the UAVs to select the ground target attacked by the UAV formation. Five ground targets and three sudden threat areas are set up. After the reconnaissance UAV searches the enemy ground target, one of the three sudden threat areas will appear randomly, and the operator needs to stop the UAVs entering the threat area.
- Stage 3: The UAV cluster carries out air strikes on the ground targets, and the operator processes the attack request. As the formation of UAVs approaches a designated ground target, an established attack zone is activated. Once the UAV enters this attack zone, they generate an attack request, which undergoes a brief processing period lasting 3 s. It is imperative for the operator to promptly issue the attack command during this interval. Subsequently, the UAV formation performs an attack on the designated target, and then autonomously initiates the return phase. If the operator fails to issue the attack command within the prescribed time frame, the UAVs will proceed directly to their return phase.
According to the operational requirements at different stages and the experience of experts in the field, the parameter settings for the 4 IEEs are shown in Table 2.
Table 2.
The Expectancy and Value of IEEs in different task stages.
W is a variable defined to calculate the Expectancy evaluation index, as shown in Equation (7), which is defined as the expected weight of IEE and is determined based on previous test experience. Specifically, it represents the frequency of interaction between the operator and the IEE. In this paper, 1–7 is used to indicate that the higher the value, the more frequently the operator interacts with the IEE during the mission. V is a variable defined to calculate the Value evaluation index, which is defined as the information priority. Specifically, it represents the importance of information in IEE. Through Table 1, we can determine the quantized values of the four IEEs in this paper.
4.2. Analysis of SEEV-AC Intelligent Interface Optimization Model
The control parameters of the ant colony algorithm are determined by the single factor analysis method [33]. The control parameters of the ant colony algorithm are set as shown in Table 3.
Table 3.
Key parameters for simulation.
Figure 8 shows the error decline curve of SEEV-AC algorithm in three stages. What is shown is the result of the two simulations in which the error drops to the maximum and minimum in each stage. The sequence number in the legend indicates the rounds of simulation. Each stage is simulated 30 times, and the error can converge to a stable value for the three stages.
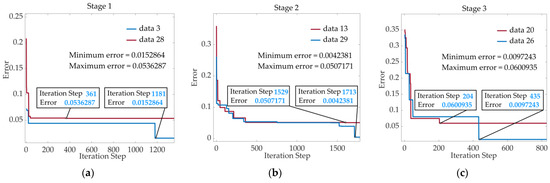
Figure 8.
Interface optimization algorithm error drop curve. (a) Stage 1; (b) stage 2; (c) stage 3.
Figure 9 shows examples of interface optimization results at different stages. The geometry of the military situation map was (0, 0, 0.7209, 0.8457) in the stage 1, (0, 0, 0.7947, 0.7339) in the stage 2, and (0, 0, 0.6889, 0.6663) in in the stage 3. The simulation results show that the SEEV-AC interface intelligent optimization model has high adaptability to all stages of UAV cluster attack missions.
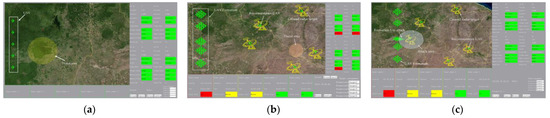
Figure 9.
Interface optimization results. (a) Stage 1; (b) stage 2; (c) stage 3.
4.3. Performance Evaluation and Comparison
Comparative experiments were carried out to verify the performance of the optimized interface to the UAV cluster attack mission. Thirty students aged 20–26 years old with experience in UAV operation were recruited as subjects. The computer platform used for the operation of the interface was equipped with the following configuration: The CPU is a 12th Gen Intel Core i7-12700H. The GPU is the Nvidia GeForce RTX 3060 (Lenovo, Beijing, China). The display features a resolution of 2560 × 1440, with a refresh rate of 144 Hz, and an 8-bit color depth.
The experimental contents of this work are as follows.
- The subjects use the three interfaces of Figure 9a–c to complete the corresponding stages of the UAV cluster attack mission; this interface is defined as an adaptive interface. The update latency of the adaptive interface is within 5 ms.
- The subjects only use the interface of Figure 9a to complete the UAV cluster attack mission, this interface is defined as a static interface.
Based on the HCI evaluation model proposed by Wang et al. [34], this paper compares and evaluates the performance of different interfaces through eye movement indicators. The indicators include: gaze number (Na), gaze time (Ta), inward convergence (IN), divergence (DI).
The higher the IN of the interface, the better the operator’s information processing of the interface, and the lower the ineffective cognitive load is. The definition of IN is shown in formula (17).
where is the number of gazes of IEE. q represents the total number of gazes of all IEEs. is the gaze time of IEE. T represents the total duration of the experiment.
The higher the divergence value, the more difficult it is for the operator to process the information of a single element, the higher the cognitive load, and the worse the interface. The DI is defined as shown in Formula (18).
The mean values of Na, Ta, IN, DI are shown in Figure 10. The data source is 30 sets of comparative experiments.
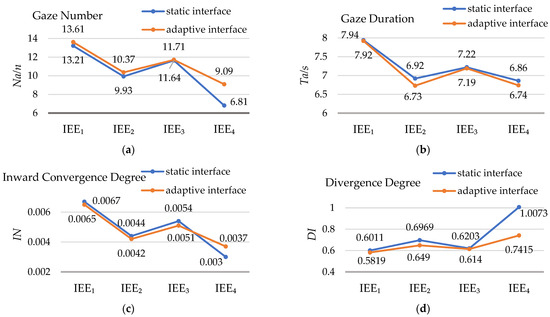
Figure 10.
Comparison results of cognitive evaluation model based on eye movement indicators. (a) Gaze number; (b) gaze duration; (c) inward convergence degree; (d) divergence degree.
According to Figure 10, the total Na and total Ta can be obtained by accumulating Na and Ta of the 4 IEEs. For the static interface, the total Na is 41.59 times, and the total Ta is 28.94 s. For the adaptive interface, the total Na is 44.78 times, and the total Ta is 28.58 s. Evidently, the adaptive interface exhibits an increase in the total Na, while the total Ta is slightly reduced. A tentative explanation for this phenomenon is that, even if the additional cognitive load brought on by the interface change has been considered, in some cases the operator still needs to find the information in the interface again, increasing the number of gazes. The reduction in the total value of Ta can be attributed to the adaptive interface’s ability to optimize the placement and dimensions of the IEEs in alignment with the various mission stages, making information more readily accessible. The average gaze duration is reduced from 0.70 s to 0.64 s, indicating that the information acquisition of the adaptive interface is less difficult. For the static interface, the total IN is 0.0196, and the total DI is 2.9256. For the adaptive interface, the total IN is 0.0196, and the total DI is 2.5864, a decrease of 11.59%. Evidently, the adaptive interface has a lower total DI when the total IN remains unchanged, indicating that the operator needs less time to understand its representation, and the workload is lower.
Figure 11 shows the results of the evaluation of the static and adaptive interfaces using the SEEV model. Figure 11 illustrates the cumulative values of S, EX, EF, V, and IEFMC for the four IEEs associated with both the static interface and the adaptive interface, and the fitness is obtained by Equation (12). The primary objective of this study is to compare the impact of static and adaptive interfaces on operators’ visual attention allocation by presenting fitness evaluated through the SEEV model. It is evident that the static interface, characterized by a lack of interface changes, yields an IEFMC value of 0. Conversely, the adaptive interface dynamically adjusts to match the current task stage, resulting in the generation of IEFMC. As depicted in Figure 11, IEE4 exhibits a larger IEFMC, attributable to the operator’s visual attention tendency to initiate from the upper-left corner of the interface. IEE4 is situated in the bottom right corner of the operator’s last search, and its color saliency and area are lower compared to the other three IEEs, resulting in a higher IEFMC value. Despite the presence of some IEFMC, which adversely affects the operator attention allocation, the adaptive interface effectively assists operators in directing their attention toward key information relevant to the current task stage. Evidently, the fitness of the adaptive interface is increased from 1.34 to 3.42 compared with the static interface, which indicates that the adaptive interface established by the interface intelligent optimization model proposed in this paper can provide clearer and easier to identify interface elements, so that the operator can accurately allocate its attention resources.
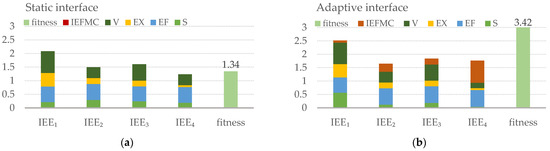
Figure 11.
The SEEV evaluation model comparison results. (a) Static interface; (b) adaptive interface.
5. Discussion
The method described in this paper presents a novel approach to adaptive optimization in human–computer interaction interfaces. Intelligent interface optimization algorithms that consider cognitive characteristics as constraints are rare, often heavily relying on expert experience to determine the importance weights of interface elements. Furthermore, in the context of UAV cluster control, various mission styles and significantly diverse mission requirements are encountered. Currently, there is a lack of methods for interface optimization that can adapt to these mission variations. This research aims to bridge this gap by proposing the SEEV-AC interface optimization model, which simultaneously considers factors such as visual attention allocation factors, cognitive psychological characteristics, and attack mission requirements.
In the process of interface evaluation validation, the overall divergence of the adapted interface decreased by 11.59%. This reduction demonstrates the effectiveness of interfaces in adapting to interface optimization requirements across different mission stages. However, the adaptive interface principles still exhibit limitations in aligning with operator cognitive processes. Various influencing factors, including the real-time emotional and cognitive states of the operator, as well as the work environment, are not comprehensively addressed in the model. This limitation makes it challenging for the interface optimization model to provide accurate real-time feedback on the operator’s state.
Quantifying human cognition to establish a more comprehensive principle for interface adaptation poses a formidable challenge, especially as certain cognitive processes remain something of a challenge to formalize. In the future, it would be of interest to delve deeper into the intricacies of human cognitive processes to develop a more efficient method for constructing interfaces and optimizing their design.
6. Conclusions
Aiming at the HCI interface of GCS, this paper proposes the SEEV-AC intelligent optimization method of interface based on the established evaluation model of interface-essential elements. In addition, the HCI interface optimization experiments are carried out with the typical UAV cluster attack mission as the simulation scenario. Then, we carry out comparative experiments to test the practical application effects of the optimized interface through the cognitive evaluation model and the SEEV evaluation model. The results emphasize that the proposed intelligent interface optimization method can effectively improve the interface design and reduce the operator’s workload. Future work will mainly focus on the refinement of the interface optimization unit and improvement of the optimization rules, and explore more interface construction optimization models to achieve interface optimization in more diverse UAV cluster combat scenarios.
Author Contributions
Conceptualization, J.W. and F.X.; methodology, A.C. and J.C.; software, A.C. and J.W.; validation, A.C., J.W. and F.X.; formal analysis, A.C.; resources, J.C.; data curation, J.C.; writing—original draft preparation, A.C.; writing—review and editing, A.C. and F.X.; visualization, A.C.; supervision, F.X. All authors have read and agreed to the published version of the manuscript.
Funding
This research was funded by the Aeronautical Science Foundation of China, grant number 2020Z023053002.
Data Availability Statement
The data presented in this study could be available on request from the corresponding author.
Conflicts of Interest
The authors declare no conflict of interest.
References
- Xiang, X.J.; Tan, Q.; Wang, C.; Zhou, H.; Tang, D.Q.; Niu, Y.F. Survey on Key technologies of UAV advanced ground stations. J. Natl. Univ. Def. Technol. 2023, 45, 1–14. [Google Scholar]
- Zhang, J.; Zhao, X.; Wang, X. Man-machine Ergonomics Evaluation of Static Operation Interface of UAV Ground Station. J. Aircr. Des. 2020, 40, 49–53+64. [Google Scholar]
- Lang, W.M.; Zhou, L.; Wang, Z.Y.; Yao, J.F.; Fei, Y.X. Research on ground control station of unmanned aerial vehicle. J. Telecommun. Inf. 2021, 604, 1–7. [Google Scholar]
- Jiang, H.; Gao, X. Application and Prospect of Human Factor Engineering in Unmanned Aerial Vehicle. J. Aeronaut. Sci. Technol. 2019, 30, 9–13. [Google Scholar]
- Chen, S.G.; Li, Z.Z.; Ge, L.Z.; Zhang, J.Y.; Wang, C.H. Research Progress and Development Suggestions on Human Factors Engineering. J. Bull. Natl. Nat. Sci. Found. China 2021, 35, 203–212. [Google Scholar]
- Lin, Q.; Wang, Y.X.; Cai, Z.J.; Wu, K. Statistics and analysis of several types of UAV accidents abroad. In Proceedings of the 5th Proceedings of China UAV Conference, Beijing, China, 15 September 2014. [Google Scholar]
- Hocraffer, A.; Nam, C.S. A meta-analysis of human-system interfaces in unmanned aerial vehicle (UAV) swarm management. Appl. Ergon. 2017, 58, 66–80. [Google Scholar] [CrossRef]
- Wu, X.L.; Zhang, L.; Niu, J.R.; Liu, X.; Han, W.Y. Review of Display Control Interaction and Man-machine Coordination in Fighter Cockpit. J. Packag. Eng. 2022, 43, 1–13. [Google Scholar]
- Ye, K.; Bao, H.; Wei, S. Layout Optimization for Aircraft Cockpit Man-Machine Interface Based on Visual Attention Distribution. J. Nanjing Univ. Aeronaut. Astronaut. 2018, 50, 416–421. [Google Scholar]
- Yang, K.; Gao, W.; Bai, J. Research on the Evaluation of Flight Instruments Layout Based on Eye Movement Indices. Chin. J. Ergon. 2016, 22, 1–6. [Google Scholar]
- Jin, Y.T.; Lu, J.; Pan, W.J.; Zhao, Z.J.; Liu, X. Layout Optimization of Virtual Interface Based on Visual Attention Mechanism. Comput. Eng. Des. 2020, 41, 763–769. [Google Scholar]
- Wu, X.; Xue, C.Q.; Wang, H.Y. E-C Mapping Model for Human Computer Interaction Interface of Complex System. J. Mech. Eng. 2014, 50, 206–212. [Google Scholar] [CrossRef]
- Wang, D.Y.; Qu, J.; Wang, W. Optimization design and evaluation of interface layout of display console of air defense and anti-missile equipment command module. J. Air Force Eng. Univ. 2021, 22, 104–111. [Google Scholar]
- Zhang, J.M.; Fu, J. Research on human machine analysis and JACK simulation optimization of tractor user interface. Agric. Mech. Res. 2022, 44, 244–250. [Google Scholar]
- Deng, L.; Wang, G.H.; Yu, S.H. Layout design of human-machine interaction interface of cabin based on cognitive ergonomics and GA-ACA. Comput. Intell. Neurosci. 2016, 3, 1–12. [Google Scholar] [CrossRef] [PubMed]
- Kang, H.; Yang, S.X.; Deng, S.W. Multi-objective design optimization of the layout of product interface elements. Packag. Eng. 2020, 41, 149–153+172. [Google Scholar]
- Zhang, B.; Ding, M.; Li, Y.J. Optimized design of human-computer interaction interface based on visual perception intensity. China Mech. Eng. 2016, 27, 2196–2202. [Google Scholar]
- Chen, L.; Lu, J.; Pan, W.J.; Liu, X. User Interface Layout Optimization Incorporating Cognitive Load. Comput. Syst. Appl. 2022, 31, 307–315. [Google Scholar]
- Yan, S.; Chen, Y.; Chen, W. Research on complex human-machine interface safety evaluation for main control room of nucleal power plant. China Saf. Sci. J. 2014, 24, 62–67. [Google Scholar]
- Zhao, Z.J.; Lu, J.; Jin, Y.T.; Ji, W.Y.; You, Q. Optimization of Operating Interface Layout of Ant Colony Algorithm Driven by Human Factor Features. J. Modul. Mach. Tool Autom. Manuf. Tech. 2020, 555, 124–127+131. [Google Scholar]
- Ilysa, Q.M.; Ahmad, M.; Zaman, N.; Alshamari, M.A.; Ahmed, I. Localized Text-Free User Interfaces. IEEE Access 2022, 10, 2357–2371. [Google Scholar] [CrossRef]
- Wu, L.Z.; Niu, Y.F.; Wang, C.; Fang, B. Design and Practice of Supervisory Control System for Multiple Unmanned Aircraft Systems. Unmanned Syst. Technol. 2020, 3, 42–52. [Google Scholar]
- Zhang, G.; Peng, H.; Niu, Y.F. Architecture Analysis and Design of Multiple UAVs Supervisory Control System. J. Syst. Simul. 2010, 22, 138–141. [Google Scholar] [CrossRef][Green Version]
- Wickens, C.D.; Alexander, A.L. Attentional tunneling and task management in synthetic vision displays. Int. J. Aviat. Psychol. 2009, 19, 182–199. [Google Scholar] [CrossRef]
- Bo, C.; Wei, W.; Jue, Q. Discussion on adaptive man-machine function allocation mechanism of UAV ground station. J. Aerosp. Technol. 2016, 376, 52–54+88. [Google Scholar]
- Schvaneveldt, R.W.; Beringer, D.B.; Lamonica, J.A. Priority and organization of information accessed by pilots in various phases of flight. Int. J. Aviat. Psychol. 2001, 11, 253–280. [Google Scholar] [CrossRef]
- Zarali, F.; Yazgan, H.R.; Delice, Y.A. New solution method of ant colony-based logistic center area layout problem. Sadhana 2018, 43, 83–99. [Google Scholar] [CrossRef]
- Srikakulapu, R.; Vinatha, U. Optimized design of collector topology for offshore wind farm based on ant colony optimization with multiple travelling salesman problem. J. Mod. Power Syst. Clean Energy 2018, 6, 1181–1192. [Google Scholar] [CrossRef]
- Zhu, H.T.; Liu, X.; Ma, G.J.; Li, S.Y.; Gan, Y.H. An Improved Route Planning Method for Cruise Missile Cluster Based on Area Sealing and Control Expansion. J. Proj. Rocket. Missiles Guid. 2022, 42, 114–118. [Google Scholar]
- Li, R.Q.; Wu, S.F.; Fen, Z.T.; Gao, X.; Wang, J.Y. Sheet metal layout algorithm based on ant colony algorithm and rectangle method. Mach. Des. Manuf. Eng. 2021, 50, 72–76. [Google Scholar]
- Chen, A.Q.; Bai, W.B.; Chen, J.; Xie, F. Performance Evaluation Model of Human-Machine Interactions for UAV Cluster Attack. In Proceedings of the International Conference on Autonomous Unmanned Systems, Xi’an, China, 23–25 September 2022. [Google Scholar]
- Chen, J.; Bai, W.B.; Li, Z.L.; Chen, S. An Information Overload Containment Method for Operators Facing Multi-UAVs Supervisory Control Task. J. Unmanned Syst. Technol. 2022, 5, 21–30. [Google Scholar]
- Li, G.; Li, H.; Zhang, S.Y. Optimal path planning and parameter analysis based on ant colony algorithm. J. China Sci. Pap. 2018, 13, 1909–1914. [Google Scholar]
- Wang, H.B.; Xue, C.Q.; Huang, J.W.; Song, G.L. Design and Evaluation of Human-computer Digital Interface Based on Cognitive Load. Electro-Mech. Eng. 2013, 29, 57–60. [Google Scholar]


Disclaimer/Publisher’s Note: The statements, opinions and data contained in all publications are solely those of the individual author(s) and contributor(s) and not of MDPI and/or the editor(s). MDPI and/or the editor(s) disclaim responsibility for any injury to people or property resulting from any ideas, methods, instructions or products referred to in the content. |
© 2023 by the authors. Licensee MDPI, Basel, Switzerland. This article is an open access article distributed under the terms and conditions of the Creative Commons Attribution (CC BY) license (https://creativecommons.org/licenses/by/4.0/).