Abstract
The pharmaceutical industry is facing significant economic challenges due to measures aimed at containing healthcare costs and evolving healthcare regulations. In this context, pharmaceutical laboratories seek to extend the lifespan of their machinery, particularly fluid bed dryers, which play a crucial role in the drug production process. Older fluid bed dryers, lacking advanced sensors for real-time temperature optimization, rely on fixed-time deterministic approaches controlled by operators. To address these limitations, a groundbreaking approach taking into account Exploration Data Analysis (EDA) and a Catboost machine-learning model is presented. This research aims to analyze and enhance a drug production process on a large scale, showcasing how AI algorithms can revolutionize the manufacturing industry. The Catboost model effectively reduces preheating phase time, resulting in significant energy savings. By continuously monitoring critical parameters, a paradigm shift from the conventional fixed-time models is achieved. It has been shown that the model is able to predict on average a reduction of 50.45% of the preheating process duration and up to 59.68% in some cases. Likewise, the energy consumption of the fluid bed dryer for the preheating process could be reduced on average by 50.48% and up to 59.76%, which would result on average in around 3.120 kWh energy consumption savings per year.
1. Introduction
The entire pharmaceutical manufacturing process comprises multiple stages, including dispensing, granulation, drying, compression, and coating [1], as depicted in the diagram below in Figure 1.
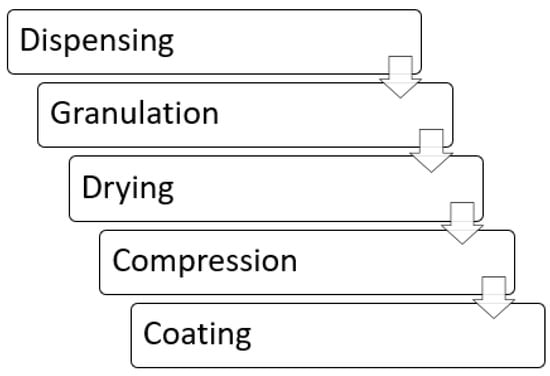
Figure 1.
Pharmaceutical manufacturing process.
Fluid bed drying technology is widely employed in pharmaceutical manufacturing due to its high efficiency in drying granules obtained through wet granulation [2]. However, the primary challenge associated with using a fluid bed dryer lies in the time and energy it consumes to complete the process. The drying process entails three phases: (i) preheating the machine without introducing any product, (ii) drying the product, and (iii) cooling the machine for product cooling. Costs are incurred in all three phases, encompassing the time taken by the machines and the energy required for heating and air circulation. Additionally, the budget is impacted by the number of operators involved in handling the machine [3]. The fluid bed drying of wet granules obtained through high shear granulation involves a combination of moisture diffusion from the solid material, facilitated by hot air, and the entrainment of this moisture through forced convection. The success of this process relies on the uniform fluidization of the granules by hot air, ensuring efficient mass and energy transfer. The drying time can be reduced by increasing the temperature and intake airflow. However, each parameter must be carefully tailored for the specific granule type. The inlet air temperature is adjusted based on the temperature signal recorded by the air sensor in contact with the fluidized product, ensuring it does not exceed the critical temperature for pharmaceutical stability. Inlet air humidity is kept within a narrow dew-point range to achieve batch-to-batch reproducibility. Thus, under optimized conditions of temperature, humidity, and airflow entering the machine, drying takes less time and generates a high-quality product. Temperature, pressure, and flow sensors monitor the changes throughout the process [4,5].
The financial landscape, ongoing measures implemented by authorities to control healthcare expenses, and recent changes in healthcare regulations significantly impact pharmaceutical laboratories and manufacturers of medical products. Due to the considerable cost of fluid bed dryers and other machinery used in medicine production, there is a concerted effort to maximize the lifespan of these machines [6]. In particular, older fluid bed dryers lack sensors that can indicate when the machine has reached the optimal temperature for any of the three phases (preheating, drying, and cooling). Deterministic methods are usually employed, meaning fixed times are used for each process phase, and the machine’s operator is responsible for managing these times. Moreover, during the drying process, the operator halts the machine after a specific duration to obtain a product sample and measure humidity levels, thereby checking whether any critical machine parameters need adjustments (such as inlet air temperature or airflow). The primary aim of this study is to propose a Catboost machine-learning model that can reduce the time needed for the preheating phase, therefore reducing overall energy consumption, and to demonstrate a methodology for utilizing exploratory data analysis in the analysis and optimization of a drug production process on a large scale. The experiments were performed on a fluid bed dyer located in a pharmaceutical manufacturing plant in Spain. The methodology used to develop the model can be implemented in a wide range of equipment that does not possess state-of-the-art sensor technology. Our study embraces a groundbreaking approach that involves real-time monitoring of crucial manufacturing equipment parameters, representing a paradigm shift from the conventional model. The paper is organized as follows: Section 2 presents the related work on applying artificial intelligence algorithms to improve methods and processes in the manufacturing industry; Section 3 details the proposed methodology; Section 4 presents the experiment set up, including a description of the fluid bed dryer and the data collection; Section 5 presents the results in terms of energy savings for the fluid bed dryer preheating process after applying EDA and Catboost machine learning model; finally, Section 6 gives the main conclusions.
2. Related Work
The most significant hurdle in employing a fluid bed dryer lies in mitigating the substantial time and energy consumption associated with completing the process. Following the electric energy crises of the 1970s [7], electricity consumption became a topic of discussion. Furthermore, it has been established that global electric energy use is quickly expanding [8], specifically in the pharmaceutical industry, which is a growing field nowadays. As a result, every pharmaceutical company seeks to utilize as little electric energy as possible in many sectors, such as manufacturing fields, packing industrial processes, and transportation to different hospitals or medical stores [9]. Utilizing advanced analytics techniques, such as machine learning, enables us to anticipate the electricity consumption in diverse pharmaceutical manufacturing processes, allowing us to tailor strategies to specific domains [10]. The accurate prediction of electricity usage holds paramount importance for decision makers and policymakers within the pharmaceutical industry, given the energy-intensive nature of its machinery. In the context of increasingly dynamic electricity markets, where prices are subject to fluctuation, understanding and forecasting electricity usage becomes even more critical. The ability to predict electricity costs can significantly impact the bottom line for pharmaceutical manufacturers. Comprehending the expected electric energy consumption empowers us to envision enhancements in pharmaceutical manufacturing processes, aiming to reduce electricity usage. This predictive capability, whether in the short or long term, equips us with insights into energy-saving opportunities and strategies for optimizing current energy consumption, thus mitigating the potential impacts of rising electricity prices. With many variables, estimating energy usage is a problematic manufacturing task [11]. Machine learning models are currently employed in various fields, since they are beneficial. Machine learning operates similarly to a function that nicely maps the input data to the output. Machine-learning models can give high-accuracy predictions for energy usage in the pharmaceutical process or the heating process in the manufacturing process. As a result, pharmaceutical companies can use them to enact energy-saving initiatives in different manufacturing domains. For example, machine learning algorithms can forecast how much electric energy is utilized in a dryer machine in manufacturing [12]. They can also be used to forecast the future-energy consumption, such as power or organic gas [13]. Numerous studies have showcased the wide applicability of machine learning techniques in the pharmaceutical industry [14,15,16,17,18]. For instance, [19] conducted a comprehensive investigation into the implementation of Artificial Neural Networks (ANNs) for the development and formulation of pharmaceutical products using a Quality by Design approach for tablet formulations. By leveraging historical data, the researchers were able to gain valuable insights into the intricate interactions between formulation variables and drug specifications. The study’s conclusions emphasized the efficiency of neural networks and genetic algorithms in optimizing formulations, ultimately leading to reduced energy consumption.
3. Proposed Methodology
Figure 2, from left to right, shows the overall approach for data modeling and simulating. First, a business need and objective have to be clearly agreed—in the present work, the modeling and optimization of the drying process—due to the high energetic cost and the evaluation that significant savings can be obtained. Next, the right data have to be captured in order to satisfy the business objective. This is followed by data exploration/processing, modeling and finally evaluation of the results [20]. Note that this can, in practice, become a cyclic processing iterating back from the result evaluation phase to the data collection phase, or even back to re-evaluate the business need.
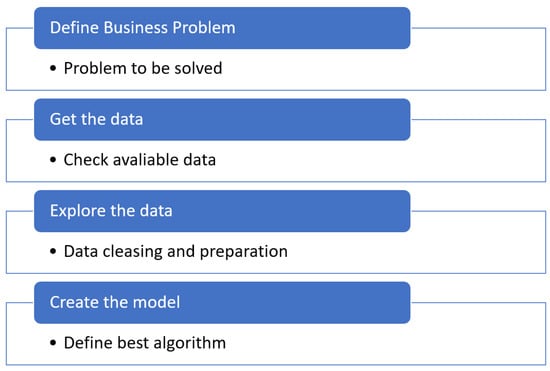
Figure 2.
Overall procedure for data analysis and modeling.
- Define business problem: The initial phase of the machine learning workflow involves defining the business problem. The duration of this step varies, ranging from several days to a few weeks, depending on the complexity of the problem and its specific application. During this stage, data scientists collaborate with subject matter experts (SMEs) to gain a comprehensive understanding of the problem. This involves conducting interviews with key stakeholders, gathering pertinent information, and establishing overall project goals. In the case at hand, our objective is to minimize the energy consumption in the fluid bed dryer.
- Obtain the data: Once the understanding of the problem is achieved, it is about obtaining the information identified and available for solving the business problem. In our case, the data obtained from the fluid bed dryer will be used directly.
- Explore the data: The next step in the process is exploration data analysis (EDA), which involves analyzing the raw data. The primary objective of EDA is to delve into the data, evaluate its quality, identify any missing values, examine feature distributions, assess correlations, and so on.
- Create the model: Model creation encompasses various tasks, including dividing the data into training and testing sets, handling missing values, training multiple models, fine-tuning hyperparameters, consolidating models, evaluating performance metrics, and ultimately selecting the optimal model for deployment to forecast our target variable. In our specific scenario, we aimed to predict the duration required for the preheating process in order to minimize energy consumption. In this paper, Catboost machine learning model for optimizing fluid bed dryer energy consumption is used.
Catboost Algorithm Application
Catboost Regression represents a relatively recent and purportedly potent machine learning algorithm, offering several advantages [21]. In essence, machine learning algorithms are commonly utilized to discern intricate patterns within extensive datasets, enabling predictions of future behaviors. Catboost specifically leverages gradient boosting for decision trees. In both regression and classification scenarios, gradient boosting serves as a machine learning technique that constructs a prediction model by combining multiple “weak prediction models”, typically decision trees [22]. The fundamental concept revolves around applying steepest descent steps to a minimization problem, known as functional gradient descent. The gradient boosting process progressively generates a series of approximations Ft: Rm→R, with t = 0, 1, …, in a step-by-step manner. Each Ft is derived additively from the previous approximation Ft−1, following the formula: Ft = Ft−1 + αht, where α represents a step size and function ht: Rm→R, referred to as a base predictor, is selected from a family of functions H to minimize the expected loss ht. Catboost, in particular, implements gradient boosting using binary decision trees as the function h(x), defined as
In Catboost’s implementation, the regions Rj represent the disjoint leaves of the decision tree, and denotes the jth binary variable corresponding to attribute x. One notable advancement of Catboost is its ability to process mixed data types simultaneously for model construction. It can handle both categorical inputs (converted to numbers) and numerical inputs effectively. Additionally, two of its strong features are (i) the default hyper-parameters, which require minimal tuning and perform well across various data scenarios, and (ii) its built-in mechanism for auto-correction, which helps prevent overfitting. When applying Catboost to the data, certain measures were taken to address concerns about model size and memory consumption by setting specific meta-parameters:
- RAM limit—a limit value was set to restrict memory usage.
- Max_ctr_complexity—it was assigned a value of 1 or 2 to control the complexity of interactions. The default value is 4.
- Model_size_reg—a larger value was assigned to penalize heavy combinations.
It is worth noting that memory usage currently remains a significant limitation of Catboost. Catboost demands that all data be immediately accessible in memory for quick random sampling, unlike stochastic gradient and neural network models. An additional critical concern is the sensitivity of Catboost to hyper-parameters and the significance of conducting hyper-parameter tuning. These factors can be influenced by the Big Data environment, such as the Apache Spark distributed framework [23]. Further details regarding hyper-parameter tuning will be provided later in the study. When dealing with extremely large datasets, an approach to address this challenge involves fitting the Catboost model to a representative sample using the Catboost Python API. Subsequently, the model can be applied to the larger dataset using Apache Spark or Hadoop with the aid of Catboost’s Java API. This methodology enables the efficient processing of massive datasets within the distributed computing environment.
4. Methodology Applied to Fluid Bed Dryer
4.1. Fluid Bed Dryer
The fluid bed drying machine utilized in this study is the Fielder Aeromatic MP, located within a pharmaceutical manufacturing plant in Spain, as depicted in Figure 3. This machine is equipped with 56 sensors controlled by Programmable Logic Controller (PLC), and the SCADA (Supervisory Control And Data Acquisition) system, which enables operators to monitor and adjust essential parameters, such as the inlet air temperature and air flow. Three critical parameters significantly impact the efficiency of the drying process and, consequently, can influence the final product’s quality. These parameters are temperature, humidity, and air flow. In theory, a higher inlet air temperature and flow rate lead to a shorter drying time. However, it is essential to configure each of these three parameters correctly, depending on the specific product type, to prevent quality issues and degradation of the final product post-drying. Notably, it is crucial to ensure that the inlet air temperature does not exceed the critical temperature of the product to be dried, as surpassing this threshold could jeopardize its quality and pharmaceutical properties. Careful monitoring and regulation of these parameters are vital to maintaining product integrity and achieving desired outcomes during the drying process.
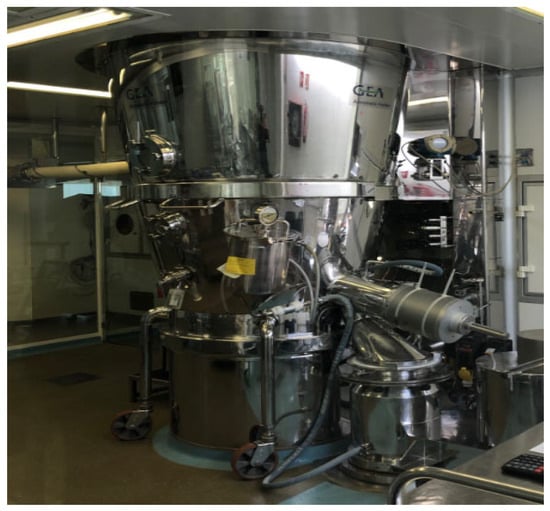
Figure 3.
Fluid bed dryer Fielder Aeromatic.
In this process, the operator utilizes SCADA to monitor the increase in outlet air temperature during the product drying phase. It is essential to note that when the product is completely dried, the outlet air temperature aligns closely with the inlet air temperature. At this critical point, the operation must be halted promptly to avoid jeopardizing the product’s quality and prevent the unnecessary consumption of time and energy, leading to increased process costs. As the fluid bed drying machine lacks sensors to indicate the optimal temperatures for different drying phases (preheating, drying, and cooling), human operators typically rely on fixed time durations for these phases. However, the preheating phase may vary in time depending on the operator’s experience with the machine. During the preheating phase, the fluid bed dryer contains no drug product; instead, it receives hot air for machine preheating. Once preheating is complete, operators introduce the drug product to initiate the drying phase. During drying, operators take samples to analyze various chemical parameters. After drying, the cooling process commences. Once all three phases are finished, the fluid bed dryer undergoes cleaning before a new batch is processed. Overall, continuous monitoring of the outlet air temperature through SCADA is crucial to ensure the preheating process is controlled effectively and prevent unnecessary energy consumption.
4.2. Data Collection
For this study, a fluid bed dryer machine was used, which is presently operational in a real pharmaceutical plant belonging to a multinational company in Spain. This machine typically handles one to two batches of pharmaceutical drug granules each day, with each batch comprising approximately 150 kg of drug mixed with 25 kg of alcohol and 10 kg of another excipient before entering the fluid bed dryer. The fluid bed dryer is equipped with 56 sensors that measure several parameters, including inlet/outlet air temperature, air flow (m3/h), motor rotation speed (rpm), air pressure (Pa), and others. Each sensor records data at a minute-by-minute interval. A dataset covering a year and a half of data has been accumulated, comprising more than 700,000 readings for each of the 56 signals. Data collection was accomplished through a Programmable Logic Controller (PLC) and stored in a SCADA system. These datasets served as the foundation for our subsequent analysis and optimization of the fluid bed drying process. Table 1 shows a sample from the fluid bed dryer sensors, including a description for each signal, the minimum and maximum value and their units of measure.

Table 1.
Fluid Bed Dryer sensors.
Some of these sensors are involved in different processes, such as granulation (column PMA), drying (column TSG) or cleaning (column CIP). For the exploration phase, be the sensors involved just in the drying process were selected (column TSG), but, as it will be explained in next section, for the data modeling, all of these were selected, to simulate a real situation where it would not able to differentiate which sensor belongs to which phase. Figure 4 illustrates the SCADA interface utilized by operators to interact with the machine, providing functionalities such as starting/stopping the controller and displaying indicators for the inlet air temperature, inlet air flow, and more. To conduct our analysis, the data from SCADA was exported into a tabular format comprising over 700,000 rows and 56 columns, containing the recorded information from the various sensors and parameters of the fluid bed dryer. This comprehensive dataset was the basis for our further exploration and optimization of the fluid bed drying process.
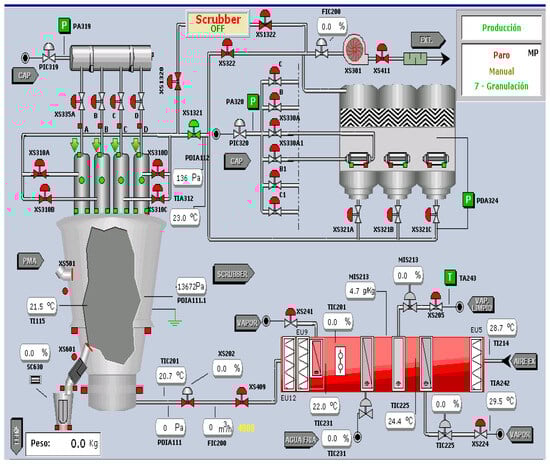
Figure 4.
Fluid bed dryer SCADA.
On the SCADA screen, the status of the station in detail can be seen, including the values of the sensors and valves, for example the temperature or pressure, and in the upper right, it shows the state of the fluid bed dryer, what process it is carrying out and what state each of them is in (granulating, drying or cleaning). For example, when steam is added to the fluid bed dryer to control the humidity of the air that is introduced into the dryer, if the humidity is very low, more steam is added to increase it. The air that is introduced into the dryer allows us to control both the temperature and its humidity. The pressure of the dryer is indicative of the clogging of the filters: if there is a big difference between the internal pressure and the output pressure, it means that it has dirty filters, and you need to clean them. The SCADA records and monitors the operating status of the fluid bed dryer in its operating modes and states and the duration of these and the registers of the analog parameters involved. Taking into account the drying process and how the fluid bed machine works, four sensors were selected for the exploration analysis. The signals recorded by the different sensors in the fluid bed dryer were as follows:
- Fan motor: this signal indicates whether the fluid bed dryer is currently running (ON) or turned off (OFF).
- Air flow: This signal represents the quantity of air flowing into the fluid bed dryer, measured in cubic meters per hour (m3/h). The machine operator configures this parameter. Monitoring the air flow helps distinguish between the preheating and drying phases, as both processes require air to be completed.
- Inlet air temperature: this signal indicates the initial temperature of the air entering the fluid bed dryer, and it is set by the machine operator at the start of the process.
- Outlet air temperature: this signal indicates the temperature of the air leaving the fluid bed dryer.
During the operation of the fluid bed dryer and the commencement of the hot air inlet process, it is essential to consider the heat absorbed by the machine to reach the preheating temperature. The temperature difference between the outlet air temperature and the inlet air temperature helps determine the amount of heat absorbed by the fluid bed dryer. When the machine reaches a point where it cannot absorb more heat, the inlet air temperature will become similar to the outlet air temperature. To better understand the behavior of the process, the temperature difference of the air inlet and outlet of the machine was utilized, denoted as which is defined in Equation (1):
where represents the outlet air temperature, represents the inlet air temperature, and represents the temperature difference.
5. Experimental Results
5.1. Exploratory Data Analysis
The dataset used for machine learning analyses is the same that was used for the exploratory data analysis. It includes various parameters related to the fluid bed dryer’s operation, such as the inlet and outlet air temperatures, airflow rate, and the phase number the machine is in (preheating, drying, or cooling). Information from over 200 batches of dried drug product, covering a span of 18 months of production, was also accessible for analysis. The variables used in the current study were the following:
- The phase indicator takes values 1, 2, or 3, representing the current phase of the fluid bed dryer. Phase 1 indicates preheating, Phase 2 is the drying phase, and Phase 3 indicates cooling after the drying process.
- The inlet air temperature sensor represents the temperature at which the air enters the machine during any of the three phases (preheating, drying, or cooling).
- The outlet air temperature signal corresponds to the temperature at which the air leaves the machine.
- The inlet airflow sensor indicates the volume of air supplied by the machine’s fan.
- The fan motor signal is useful for determining when the machine is active during any of the three phases, indicating the fan motor’s movement.
In the next step of the analysis, random days will be selected to observe the behavior of the machine signals during the preheating, drying, and cooling processes for each batch of pharmaceutical product processed. The primary goal of this exploration is to identify trends and gain a better understanding of fluid bed dryer processes, with the objective of identifying opportunities for improvement. Figure 5 visually depicts the behavior of the signals on different days, representing a full day of fluid bed dryer operation. The x-axis represents the elapsed time for one day of fluid bed dryer operation (1440 min, corresponding to 24 h), while the y-axis indicates the difference in temperature between the machine’s inlet and outlet air. The blue dots indicate the preheating process, the orange dots represent the drying process, and the green dots represent the cooling process.
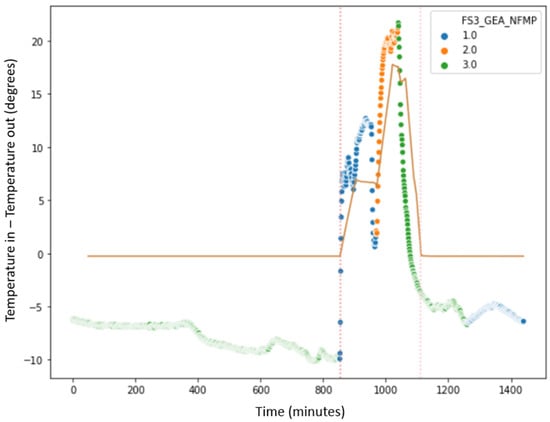
Figure 5.
Plot of the drying steps.
Figure 6 shows a sample of 4 different days taken randomly, where it can be observed that some days, the fluid bed dryer processed one batch, and other days two batches, with an average of around 350 min per batch. In the figure dated 2 December 2019, there are two batches that were processed, and if looking at the blue dots, it can be seen that the preheating process lasted much longer in the two batches, compared to the duration of the preheating process; for example, on 7 October 2018, the blue dots were much smaller and the temperature difference, the y-axis, did not exceed 10 degrees. It can also be observed that the duration of the drying process, the orange dots, was more or less homogeneous, and lasted approximately the same for all the days and all the batches (x-axis); as well as this, the temperature differences were approximately similar (y-axis). As a conclusion, it is evident from the data that the duration of the preheating process exhibits variability. To preheat the fluid bed dryer, some batches take a longer time preheating the machine than others, with the consequent unnecessary consumption of energy.
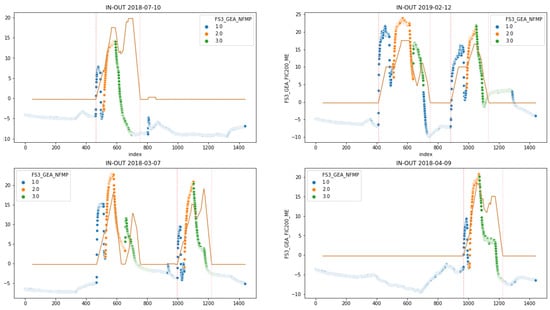
Figure 6.
Example of 4 different days of batch drying. Above each figure is plotted the date of the batch (1.0 Preheating, 2.0 Drying, 3.0 Cooling).
5.1.1. EDA Timing Savings Analysis
In Figure 7, it can be observed for the 200 batches analyzed how many minutes on average the fluid bed dryer was used to perform the preheating process. Each blue line indicates, for each individual batch, the time taken to complete the preheating process in the fluid bed dryer. The variability in the preheating duration is attributed to the manual operation of the process, as it relies on the operator’s discretion to start and finish the preheating phase; considering the age of the machine, the machine is kept for preheating less than 50.1 min, whereas other times, the machine is kept preheating for up to 180.3 min. The fluid bed dryer is initially set up with hot air inlet at 45 degrees and airflow 2000 m3/h. However, the fluid bed dryer does not have any sensor notifying when the machine is warm enough to introduce the drug product and start the drying process. The brown line in the graph indicates the average that was 99.7 min to complete the preheating process. To summarize, this indicates again the opportunity to harmonize the preheating process by establishing an optimum preheating time, and potentially, to be able to reduce the preheating process time, and consequently reduce the fluid bed dryer energy consumption.
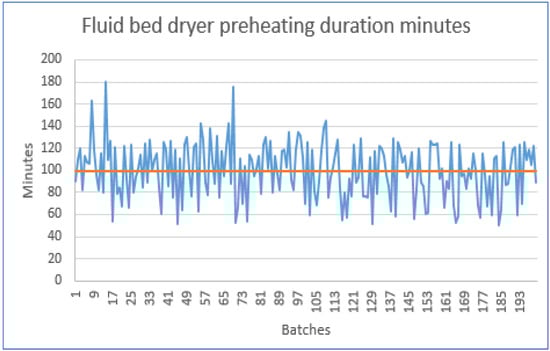
Figure 7.
Fluid bed dryer preheating duration in minutes. Brown line indicates average duration.
5.1.2. EDA Energy Savings Analysis
Figure 8 shows the variability of analyzing the energy consumption used to complete the preheating process for each batch in the fluid bed dryer. The energy consumption was calculated using Equation (2):
where is the time consumed by the fluid bed dryer for preheating the batch, and corresponds to the fluid bed dryer energy consumption per minute. The fluid bed dryer currently consumes 18.5 kWh during the preheating process; this means that for each minute it consumes 0.31 kWh (18.5 kWh/60 min = 0.31 kWh). If the preheating process may take between 50.1 and 180.3 min, the fluid bed dryer consumes between 15.5 kWh and 55.8 kWh for preheating the machine to dry one batch of drug product.
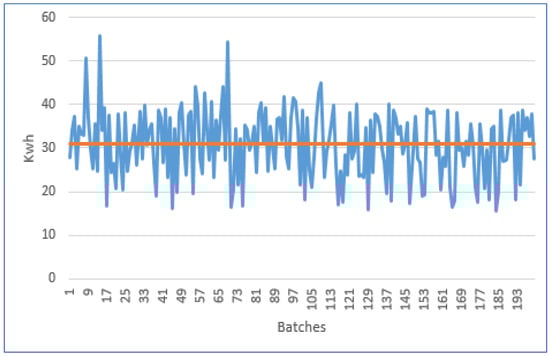
Figure 8.
Fluid bed dryer preheating energy consumption (kWh). Brown line indicates average duration.
It can be observed that some batches needed 55.8 kWh; however, other batches needed less than 15.5 kWh, which means in some cases around 72.2% less energy consumption for some batches. The brown line indicates the average consumption for the 200 batches, around 30.9 kWh. This indicates important potential energy savings if the preheating process in the fluid bed dryer is optimized. To calculate the potential energy savings of the fluid bed dryer during the preheating process for each batch, a machine learning model was implemented, as discussed in the next chapter, to predict when the right time was to stop the process, and therefore, consume just the energy needed for preheating the fluid bed dryer.
5.2. Catboost Machine Learning Model Analysis
As described in this section, a Catboost model was selected and executed using the historical data obtained from the activity of the fluid bed dryer process in the production plant. Due to the fluid bed dryer’s age, one of the primary problems is that it does not have sensors that can detect whether the air within is at the right temperature to conclude the preheating process. From the perspective of data modeling, the issue has a number of intriguing characteristics:
- Due to the inclusion of 56 sensors, there are a large number of possible inputs (700.000 rows and 3 GB data).
- There are a lot of manufacturing batches, more than 200, but the machine does not keep track of when the preheating operation starts or ends. As a result, the deduction is carried out using the machine’s air inlet and output as well as temperature differences.
- The goal is to interpret the estimated model in a way that can reveal the factors that influence the air inlet- and outlet-temperature differential curves. Using this method, it is possible to estimate how long the preheating process will take.
To estimate the preheating time conceptually, a function model f (i) was constructed using the data of a matrix X, which contained the data taken from the fluid bed dryer. In order for the operators to know when it is best to cease the machine’s preheating operation and so save energy, the information present in the machine learning model was used to anticipate the estimated preheating time for each batch. The time remaining for the fluid bed dryer to finish preheating (based on the inlet–outlet temperature disparities) was the predicted output from our model. Data preprocessing techniques were used on the input dataset to remove unnecessary information, such as missing values, in preparation for future analysis. The first step to select the most suitable model was to split the dataset into training and testing data. This technique is used for evaluating the performance of a machine learning algorithm. It can be used for classification or regression problems and can be used for any supervised learning algorithm. The process consists of taking a dataset and dividing it into two subsets. The first subset is used to fit the model and is referred to as the training dataset. The second subset is not used to train the model; instead, the input element of the dataset is provided to the model, then predictions are made and compared to the expected values. This second dataset is referred to as the test dataset. The objective of splitting the dataset into train and test is to estimate the performance of the machine learning model based on new data that will be captured directly from the fluid bed dryer, namely, to fit it on available data with known inputs and outputs, then make predictions on new examples in the future where there are not the expected output or target values. The train–test procedure is appropriate when there is a sufficiently large dataset available, which means that there are enough data to split the dataset into train and test datasets and each of the train and test datasets are suitable representations of the problem domain. To perform the evaluation and selection of the best-fit algorithm for the fluid bed dryer process, the Python libraries were used. The same dataset was injected in the different algorithms. The dataset contained 18 months data coming from the 56 sensors of the fluid bed dryer, and the values represented the average of 10-fold cross validation (partitioning of the dataset into 10 parts, 9 for train and one for test, then rotating 10 times to obtain different combinations of partitions). The results of the most relevant algorithm’s evaluation are shown in Table 2.
Table 2.
Benchmarking outcomes of various machine learning algorithms on the dataset.
Based on Table 2, the Catboost Regressor has the lowest MAE of 83.507 and the lowest RMSE of 118.781, indicating that it has the best predictive accuracy compared to the other models. It also has the highest R2 value of 0.6806, indicating that it can explain about 68.06% of the variance in the target variable. The Light Gradient Boosting Machine has the second-best performance, with slightly higher MAE and RMSE values than the Catboost model, and an R2 value of 0.67. The Extreme Gradient Boosting, Random Forest Regressor, and Gradient Boosting Regressor models have higher MAE, MSE, and RMSE values and lower R2 values than the Catboost and Light Gradient Boosting models, indicating that they may not perform as well on this specific dataset, the same as the rest of the models. To select the best metric for the Catboost algorithm, the nature of the problem and the evaluation criteria was considered. To measure the proportion of variance in the target variable that can be explained by the model, R2 was the most suitable metric. MAE was discarded because it focuses on minimizing the average absolute difference between predicted and actual values, and MSE or RMSE penalize larger errors more than smaller errors.
5.2.1. Time Duration Analysis
In Figure 9, the real duration of the preheating process per month from the historical dataset can be seen in blue. This duration is measured in minutes and represents the average of the time spent by the process for the whole month. This measure was performed for the 200 batches evaluated during 18 months. The results show that the preheating process duration varied from one month to another and fell between 88.5 and 110.6 min, depending on when the optimal temperature difference in–out was reached. The average duration of the 200 batches during the 18 months was around 99.7 min. This key information allowed us to calculate the real consumption of the preheating process. Figure 9 also shows the Catboost prediction duration of the preheating process. It can be observed how for the 200 batches, during 18 months of evaluation, the predicted time was always lower than the real time. The reduction in the predicted time was significant, ranging from 34.7 min (39.2% time reduction) in the month of December 2018 to 66.0 min (59.68.2% reduction) in the month of October 2018. The optimal time predicted by the algorithm corresponded to an average per month between 42.5 and 59.5 min, with an average of 49.4 min. The average predicted time reduction was 50.3 min. Therefore, the duration of the process can be reduced on average by 50.45%.
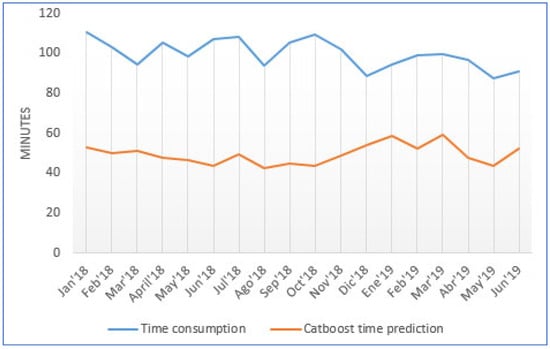
Figure 9.
Time duration for preheating process comparing real duration with Catboost prediction.
5.2.2. Energy Saving Analysis
In Figure 10, the real energy consumption of the preheating process per month from the historical dataset can be seen in blue. This energy consumption is measured in kWh and represents the average of the energy spent by the process for the whole month per batch. This measure was performed for the 200 batches, evaluated over 18 months. The results show that the real preheating-process energy consumption varied from one month to another and fell between 27.1 kWh and 34.3 kWh per batch every month, depending on when the optimal temperature difference in–out was reached. The average energy consumption of the 200 batches as 30.9 kWh per batch.
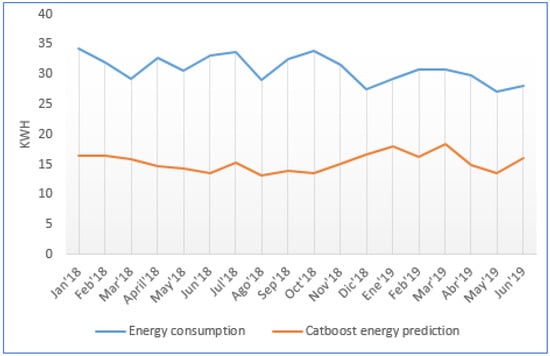
Figure 10.
Energy consumption for preheating process comparing real energy with Catboost prediction.
Figure 10 shows also the Catboost prediction energy consumption of the preheating process. It can be observed how for the 200 batches, during the 18 months of evaluation, the predicted energy consumption was always lower than the real energy consumption. The reduction in the predicted energy consumption was significant, ranging from 10.8 kWh (39.8% energy reduction) in the month of December 2018 to 20.5 kWh (59.76% energy reduction) in the month of October 2018.
The optimal energy consumption predicted by the algorithm per batch corresponded to on average between 13.2 kWh and 18.4 kWh. The average predicted energy reduction was 15.6 kWh. Consequently, the reduction in energy consumption predicted by the algorithm, to complete the prehearing process, represented 50.48% less energy. The total energy saving was calculated using Equation (3), with being the number of batches and the energy saved per batch.
Based on Figure 9, there is a potential saving of 50.3 min per batch each time the fluid bed dryer is preheated. This means a saving of around 15.6 kWh per batch (50.3 min × 0.31 kWh). If the fluid bed dryer processes approximately 200 batches per year, based on the current estimation, then the annual potential energy savings could be approximately 3.120 kWh when applying Equation (3).
6. Conclusions
This paper introduced an exploration data analysis methodology tailored for the analysis and optimization of a large-scale drug production process, and a Catboost machine learning model implementation, specifically focusing on the preheating stage of pharmaceutical granules using a fluid bed dryer. As a conclusion drawn from the exploratory data analysis of the signals, it can be stated that the preheating phase lasts longer than necessary. Some batches need less than 50.1 min to complete the preheating process; however, there are batches that take up to 180.3 min. In terms of energy consumption, this means that for some batches, the fluid bed dryer consumes 15.5 kWh, and for others it consumes 55.8 kWh, which could represent savings, in some cases, of 72.2% of energy. In addition, the most suitable model for the fluid bed dryer prediction process was selected based on the current dataset obtained from the activity of the fluid bed dryer process in the production plant. First, several models, including Catboost, Elastic net, Random Forest or Linear Regression, were compared. Catboost was selected because it provided the lowest error and, at the same time, the highest R2, as it has been described in previous sections. Once the model was selected, the analysis of the historical dataset, with 200 batches from 18 months of production, was performed. It has been shown that the model is able to predict on average a reduction of 50.45% of the preheating process duration and up to 59.68% in some cases. Likewise, the energy consumption of the fluid bed dryer for the preheating process could be reduced on average by 50.48% and up to 59.76%, which results on average in around 3.120 kWh of energy consumption savings per year.
Author Contributions
Conceptualization, R.B. and M.R.; methodology, R.B.; software, R.B.; validation, R.B. and M.R.; formal analysis, R.B.; investigation, R.B.; resources, R.B.; data curation, R.B.; writing—original draft preparation, R.B.; writing—review and editing all authors; visualization, all authors; supervision H.H. All authors have read and agreed to the published version of the manuscript.
Funding
This research received no external funding.
Data Availability Statement
Data is unavailable due to privacy restrictions.
Conflicts of Interest
The authors declare no conflict of interest.
References
- Pharmaguide. Available online: https://www.pharmaguideline.com/2021/10/tablet-manufacturing-process-overview.html (accessed on 1 September 2023).
- Parikh, D. How to Optimize Fluid Bed Processing Technology: Part of the Expertise in Pharmaceutical Process Technology Series; Academic Press: Cambridge, MA, USA, 2017. [Google Scholar]
- Lourenço, V.; Lochmann, D.; Reich, G.; Menezes, J.; Herdling, T.; Schewitz, J. A quality by design study applied to an industrial pharmaceutical fluid bed granulation. Eur. J. Pharm. Biopharm. 2012, 81, 438–447. [Google Scholar] [CrossRef] [PubMed]
- Burggraeve, A.; Monteyne, T.; Vervaet, C.; Remon, J.P.; De Beer, T. Process analytical tools for monitoring, understanding, and control of pharmaceutical fluidized bed granulation: A review. Eur. J. Pharm. Biopharm. 2013, 83, 2–15. [Google Scholar] [CrossRef] [PubMed]
- Yüzgeç, U.; Becerikli, Y.; Türker, M. Dynamic neural-network-based model-predictive control of an industrial baker’s yeast drying process. IEEE Trans. Neural Netw. 2008, 19, 1231–1242. [Google Scholar] [CrossRef]
- Price, W.N. Making do in making drugs: Innovation policy and pharmaceutical manufacturing. Boston Coll. Law Rev. 2013, 55, 2013. [Google Scholar] [CrossRef]
- Lifset, R.D. A new understanding of the American energy crisis of the 1970s. Hist. Soc. Res. Hist. Sozialforschung 2014, 39, 22–42. [Google Scholar]
- Boyd, G.A. Development of a Performance-based Industrial Energy Efficiency Indicator for Pharmaceutical Manufacturing Plants; Duke University: Durham, NC, USA, 2013. [Google Scholar] [CrossRef][Green Version]
- Thomas, P. Will Pharma Wear the Energy Star. Pharma Manufacturing, 6 March 2006. [Google Scholar]
- Pazhayattil; Babu, A.; Konyu-Fogel, G. An empirical study to accelerate machine learning and artificial intelligence adoption in pharmaceutical manufacturing organizations. J. Generic Med. 2023, 19, 17411343221151109. [Google Scholar]
- Mujumdar, A.S. Research and development in drying: Recent trends and future prospects. Dry. Technol. 2014, 22, 1–26. [Google Scholar] [CrossRef]
- Aghbashlo, M.; Mobli, H.; Rafiee, S.; Madadlou, A. The use of artificial neural network to predict exergetic performance of spray drying process: A preliminary study. Dry. Technol. 2012, 88, 32–43. [Google Scholar] [CrossRef]
- Lai, J.-P.; Chang, Y.-M.; Chen, C.-H.; Pai, P.-F. A survey of machine learning models in renewable energy predictions. Appl. Sci. 2020, 10, 5975. [Google Scholar] [CrossRef]
- Diaz, L.P.; Brown, C.J.; Ojo, E.; Mustoe, C.; Florence, A.J. Machine learning approaches to the prediction of powder flow behaviour of pharmaceutical materials from physical properties. Digit. Discov. 2023, 2, 692–701. [Google Scholar] [CrossRef]
- Sciuto, G.L.; Susi, G.; Cammarata, G.; Capizzi, G. A spiking neural network-based model for anaerobic digestion process. In Proceedings of the 2016 International Symposium on Power Electronics, Electrical Drives, Automation and Motion (SPEEDAM), Capri, Italy, 22–24 June 2016; pp. 996–1003. [Google Scholar]
- Kim, D.; Kim, M.; Kim, W. Wafer Edge Yield Prediction Using a Combined Long Short-Term Memory and Feed- Forward Neural Network Model for Semiconductor Manufacturing. IEEE Access 2020, 8, 215125–215132. [Google Scholar] [CrossRef]
- Wang, J.; Zhang, J.; Wang, X. A Data Driven Cycle Time Prediction with Feature Selection in a Semiconductor Wafer Fabrication System. IEEE Trans. Semicond. Manuf. 2018, 31, 173–182. [Google Scholar] [CrossRef]
- Aksu, B.; Matas, M.D.; Cevher, E.; Özsoy, Y.; Güneri, T.; York, P. Quality by design approach for tablet formulations containing spray coated ramipril by using artificial intelligence techniques. Int. J. Drug Deliv. 2012, 4, 59. [Google Scholar]
- Peterson, J.J.; Snee, R.D.; McAllister, P.R.; Schoeld, T.L.; Carella, A.J. Statistics in pharmaceutical development and manufacturing. J. Qual. Technol. 2019, 41, 111–134. [Google Scholar] [CrossRef]
- Prokhorenkova, L.; Gusev, G.; Vorobev, A.; Dorogush, A.V.; Gulin, A. CatBoost: Unbiased boosting with categorical features. In Proceedings of the 32nd International Conference on Neural Information Processing Systems, Red Hook, NY, USA, 3–8 December 2017. [Google Scholar]
- Liu, Z. Using neural network to establish manufacture production performance forecasting in IOT environment. J. Supercomput. 2022, 78, 9595–9618. [Google Scholar] [CrossRef]
- Markarian, J. Modernizing pharma manufacturing. Pharm. Technol. 2018, 42, 20–25. [Google Scholar]
- Nettleton, D.F.; Wasiak, C.; Dorissen, J.; Gillen, D.; Tretyak, A.; Bugnicourt, E.; Rosales, A. Data Modeling and Calibration of In-Line Pultrusion and Laser Ablation Machine Processes. In Proceedings of the International Conference on Advanced Data Mining and Applications (ICADMA), Barcelona, Spain, 20–21 August 2018. [Google Scholar]
Disclaimer/Publisher’s Note: The statements, opinions and data contained in all publications are solely those of the individual author(s) and contributor(s) and not of MDPI and/or the editor(s). MDPI and/or the editor(s) disclaim responsibility for any injury to people or property resulting from any ideas, methods, instructions or products referred to in the content. |
© 2023 by the authors. Licensee MDPI, Basel, Switzerland. This article is an open access article distributed under the terms and conditions of the Creative Commons Attribution (CC BY) license (https://creativecommons.org/licenses/by/4.0/).