Article

A Novel Statistical Analysis Algorithm for Angular Sampling for Measurement of the TRP of Spurious Emissions

1
State Key Laboratory of Networking and Switching Technology, Beijing University of Posts and Telecommunications, Beijing 100876, China
2
China Telecommunication Technology Lab, China Academy of Information and Communications Technology, Beijing 100191, China
*
Author to whom correspondence should be addressed.
These authors contributed equally to this work.
Electronics 2023, 12(20), 4290; https://doi.org/10.3390/electronics12204290
Submission received: 27 September 2023 / Revised: 13 October 2023 / Accepted: 14 October 2023 / Published: 17 October 2023

Abstract

:
The total radiated power (TRP) has been stipulated as the spurious emission limit for a mmWave terminal. Angular sampling is crucial for ensuring the accuracy of the measurement of the TRP of spurious emissions while improving measurement efficiency. In this study, we investigate the sampling requirements for different TRP measurement methods. A novel algorithm based on the statistical analysis of the measurement uncertainty caused by the sampling step is proposed. Specifically, the HPBW of the entire machine radiation pattern is considered instead of that of a simple antenna array. This study was conducted in strict compliance with regulatory requirements to ensure that the statistical algorithm was more closely aligned with practical testing. Based on this, the maximum sampling steps allowed by different terminal models while maintaining measurement accuracy were analyzed. The simulation results demonstrate that negligible measurement uncertainty was produced when the sampling step of the full spherical grid method was less than 6 . However, for the two-cut and the three-cut methods, a maximum of 2 dB of measurement uncertainty should be considered. These findings are valuable inputs for the ongoing work on electromagnetic compatibility testing and standardization.

1. Introduction

The fifth-generation (5G) mobile communication network has opened up a new paradigm through the organic integration of ubiquitous communication, computing, and control capabilities. The sixth-generation (6G) mobile communication network will further connect the physical world and the digital world through the “intellicise” network architecture [1,2]. This is envisioned with many new technologies for enhancing network performance [3,4]. Among them, the millimeter-wave (mmWave) and terahertz technologies are considered the key technologies of the intellicise communication system. With the application of these technologies, the antenna systems of transmitters have changed greatly [5,6]. The most important change is that antenna systems are permanently integrated into distributed transmitter terminals to reduce space and interconnection losses [7,8]. This change has brought great challenges to the electromagnetic compatibility (EMC) testing of transmitters [9,10].
At present, many organizations worldwide, such as the European Telecommunication Standard Institute (ETSI), the China Communications Standards Association (CCSA), and the Third-Generation Partnership Project (3GPP), are actively specifying EMC standards for transmitter terminals. However, most of the standards are for the FR1 (410 MHz–7125 MHz) frequency band, while for the FR2 (24,250 MHz–52,600 MHz) band, the standards are still under discussion. For the United States, which is the main market for mmWave terminals at present, the Federal Communications Commission (FCC) stipulates the certification requirements for such equipment, and only terminals that meet its requirements can be sold in America. The main technical parameters involved in the regulations are the radiated RF output power, occupied bandwidth, unwanted radiated emissions, and frequency tolerance [11]. The test for unwanted radiated emissions is much different from that in the FR1 band.
The regulations specify that the limit for unwanted radiated emissions from mmWave terminals is the total radiated power (TRP) rather than the traditional equivalent isotropically radiated power (EIRP) limits. The main idea of TRP testing for unwanted radiated emissions is the same as that of traditional TRP testing with radio-frequency radiation. It is essentially calculated by using the integral of the power flux in the corresponding state on a spherical surface in the far field. In practical tests, the discrete sampling method is usually used to approximate the continuous integral to a discrete summation. For discrete methods, the sampling step in the azimuth and elevation directions is a critical parameter in TRP testing. The test accuracy increases with the decrease in the sampling step, but the testing time also increases. Therefore, it is necessary to explore a way to have the best of both worlds. On one hand, the sampling step must be small enough to ensure measurement accuracy. On the other hand, unnecessary oversampling should be avoided to improve measurement efficiency. The full spherical grid method with uniform sampling is usually used for the traditional TRP testing with radio-frequency radiation. The impact of angular sampling on the testing accuracy of this method can be analyzed using statistical analysis [12,13]. First, antenna array patterns with different numbers of elements are randomly generated as the sources. Then, a random rotation matrix is used to rotate the source positions. Simultaneously, the TRP for the grid can be calculated using the angular step of interest. The above steps are repeated 10,000 times, and the TRP error for each angular step is counted. The Cellular Telecommunications Industry Association (CTIA) stipulates that TRP errors from angular sampling within 15° are negligible in TRP testing with radio-frequency radiation. In addition, some special angular sampling methods can be used to reduce the TRP error caused by sparse sampling—for instance, by modifying the equi-angle to eliminate the effect of the metric coefficient and by using generalized spiral scanning to uniformly pick up measured data [14]. Alternatively, the Clenshaw–Curtis quadrature method can be adopted in TRP tests [15]. This method can achieve higher accuracy without increasing the number of sampling points or the measurement time. However, it must be noted that the quadrature method must be judiciously selected by considering the practical OTA setting. These methods have been validated through simulations to demonstrate their effectiveness in traditional TRP testing. However, a TRP testing method for unwanted radiated emissions was already introduced by the 3GPP [16,17] and the American National Standards Institute (ANSI) [11] in recent years. Although the main idea of TRP testing for unwanted radiated emissions is the same as that of traditional TRP testing for radio-frequency radiation, the specific test methods and operations are different due to the large frequency band coverage and the unknownness of radiation. The testing procedure for unwanted radiated emissions regulated by the FCC is divided into three steps [18].
(1)
An initial exploratory scan is conducted to optimize the test time by identifying a set of frequencies that need to be further measured by using the EIRP/TRP. It is acceptable to perform maximum EIRP measurements over the required frequency range and compare the measurements with the limit to verify compliance, which is herein referred to as an “early exit” condition. If the measured EIRP levels are below the TRP limit, the early exit condition is met, and the device is compliant. If the device does not meet the emission limit at one or some frequencies, then TRP measurements need to be performed only at those frequencies.
(2)
The decision process involves performing TRP measurements based on the results of the first step and determining which frequencies meet the early exit conditions (based on EIRP measurements) and which frequencies require TRP measurements.
(3)
The final scan involves the use of various methods of measuring the TRP according to the results of the second step, and the measurements are compared with the limit to verify compliance.
Spurious emissions include harmonic emissions, parasitic emissions, intermodulation products, and frequency conversion products, but exclude out-of-band emissions [
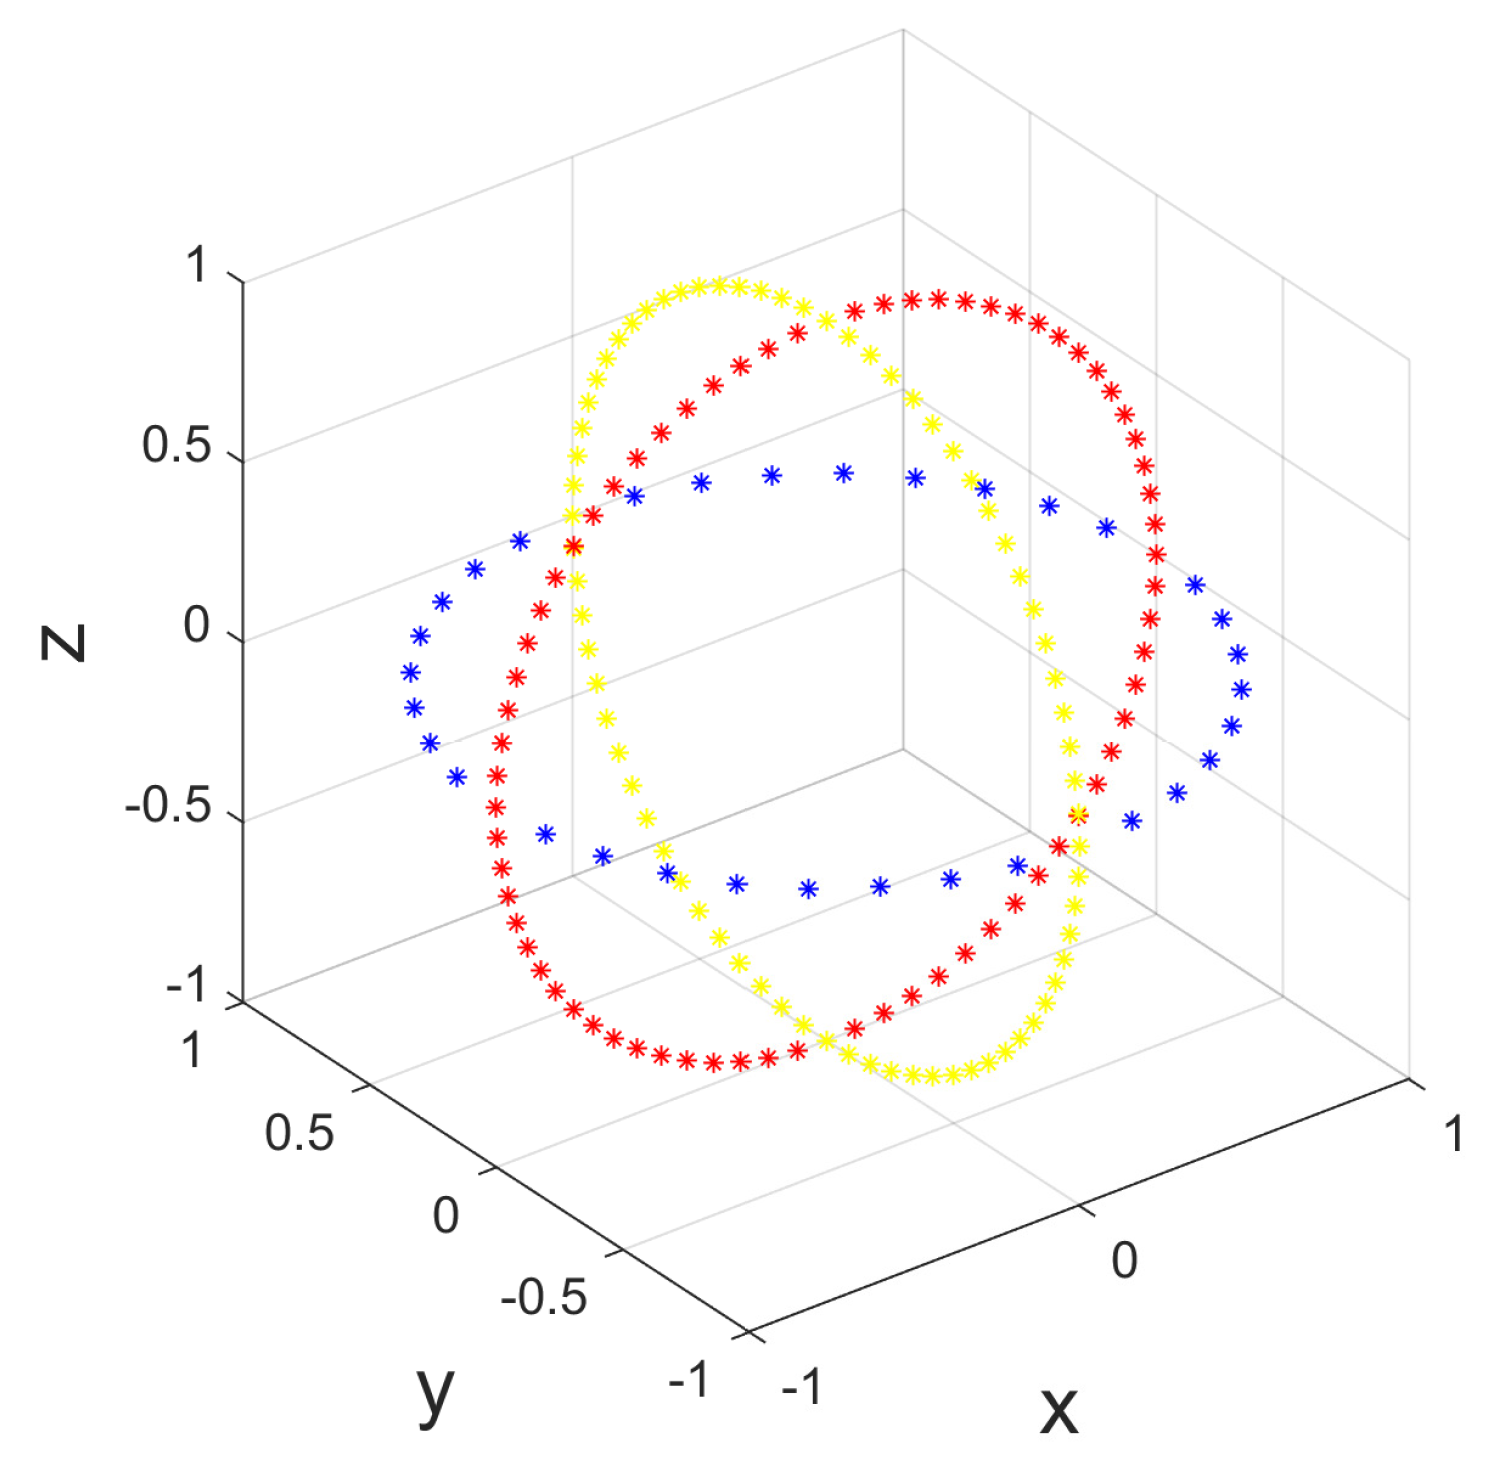
19]. For these kinds of emissions with narrow radiation beams, the FCC also proposes some simpler TRP testing methods for the third step to improve the measurement efficiency as much as possible. These are the two-cut method and the three-cut method. Similarly to traditional TRP testing for radio-frequency radiation, angular sampling is still the balancing factor for ensuring measurement accuracy and improving measurement efficiency, while it is also a concern for manufacturers and test labs. In the techniques used, the beam of spurious emissions should be aligned with the orthogonal cuts of a coordinate system to include the beam peak based on exploratory scans. Furthermore, any part of the device can act as an active or passive radiator, so it cannot be assumed to be a simple antenna array. Therefore, traditional statistical analysis is no longer applicable to the two-cut and the three-cut methods.
To address this problem, we evaluated the correction factor for different TRP measurement methods. In order to verify the effects of angular sampling on TRP, a method of measurement uncertainty analysis based on statistical analysis is proposed. This method is carried out by measuring the TRP of radiation sources with different half-power beamwidths (HPBWs). In particular, the dimensions of the source refer to the entire mechanical dimensions of the device under test (DUT). In the end, simulation results are presented.
The rest of this study is organized as follows. The three TRP measurement methods prescribed by the FCC and a novel statistical analysis algorithm for the effect of angular sampling on TRP (SA-AS-TRP) are presented in Section 2. The simulation settings and results of various possible cases are discussed in Section 3. The conclusion is given in Section 4.

2. Definition and Methods of Analysis

The TRP is the integral of the power flow out of a spherical surface surrounding the DUT. The dimensions and spherical coordinates of the DUT are defined in Figure 1. The power density S r in the far field can be defined as [20]
S r E 2 / Z 0
where Z 0 is the impedance and E is the electric field of the DUT. Then, the TRP can be written as
T R P = 4 π S r ( r , θ , ϕ ) r 2 sin θ d θ d ϕ
where θ and ϕ are the elevation and azimuth angles, respectively. The angular ranges cover a whole sphere, e.g., 0 θ 180 and 0 ϕ 360 . r 2 sin θ d θ d ϕ denotes the infinitesimal surface area of the sphere with a radius r. Usually, the EIRP of the DUT is used to calculate the TRP in practical tests. It can be calculated as
E I R P ( θ , ϕ ) = lim r S r ( r , θ , ϕ ) 4 π r 2
Then, the TRP can be written as
T R P = 1 4 π θ = 0 π ϕ = 0 2 π E I R P ( θ , ϕ ) sin θ d θ d ϕ

2.1. TRP Testing Methods

In practical tests, the discrete sampling method is usually used to approximate the continuous integral to the discrete summation. It is assumed that the measurement points are selected on a rectilinear grid with a constant sampling step. As shown in Figure 2, the discrete summation in the full spherical grid method can be expressed as
T R P grid Δ θ Δ ϕ 4 π m , n E I R P ( θ , ϕ ) sin θ
where Δ θ and Δ ϕ are the sampling steps for the elevation and azimuth angle, respectively. For each emission frequency, the EIRP (as a sum of two orthogonal polarizations) is measured at each spatial sampling step on the selected grid.
The TRP testing of spurious emissions can be carried out using a simpler approach, that is, the two-cut method or the three-cut method. As shown in Figure 3, the two-cut method requires the DUT to be aligned with a chosen xy-plane (blue) and xz-plane (red) of the antenna measurement coordinate system. For an orthogonal-cut grid,
TRP two - cut = 1 2 EIRP ( θ , ϕ ) 1 ¯ + EIRP ( θ , ϕ ) 2 ¯
where ETRP ( θ , ϕ ) n for n = 1 , 2 is the EIRP (as a sum of two orthogonal polarizations) in each cut, i.e., the xy-plane and xz-plane. The bar denotes the average angular value calculated for each cut. When calculating orthogonal cuts, the intersections are calculated multiple times, and duplicate values can be removed from the sample before averaging. The beam peak should be required to align the orthogonal cuts that are beamformed, as identified in the exploratory scan for harmonics and spurious emission frequencies. If the TRP limit is exceeded, a third orthogonal cut in the yz-plane (yellow) can be added by using the Δ θ angular step. Therefore, the average values are separately calculated in all three cuts, and then the average value of these three average values is taken.
TRP three - cut = 1 3 EIRP ( θ , ϕ ) 1 ¯ + EIRP ( θ , ϕ ) 2 ¯ + EIRP ( θ , ϕ ) 3 ¯

2.2. SA-AS-TRP Algorithm

As previously stated, spurious emissions include harmonic emissions, parasitic emissions, intermodulation products, and frequency conversion products. The FCC first designated the TRP as an indicator for spurious testing and proposed two testing methods that are not commonly used in traditional RF testing: the two-cut method and three-cut method. Regardless of which TRP testing method is used, angular sampling is a key parameter. Proper angular sampling can improve testing efficiency while ensuring measurement accuracy. Angular sampling is also the issue of greatest concern for various testing organizations. Currently, the determination of angular sampling is still based on traditional TRP testing for radio-frequency radiation. However, the DUT in spurious emission testing cannot be treated as an antenna array as in traditional TRP testing for RF radiation, and the two-cut and three-cut methods are also not applicable to traditional statistical methods. The specific reasons are as follows. Firstly, there are many types of millimeter-wave terminal antennas [5], and only the main radiation frequency depends on the antenna type. Spurious emissions are not directly related to the antenna type unless there are defects in the antenna design. Spurious emissions are unwanted emissions that accidentally occur. Secondly, in practical testing, the location information of spurious emissions is unknown, and the DUT behaves like a “black box”. In principle, spurious emissions may be emitted from anywhere within the “black box”. Finally and most importantly, in the three-step spurious testing specified by the FCC, it is explicitly required to record the frequency and location information of the maximum EIRP during the initial exploratory scan (including the position of the turntable, the height of the antenna tower, and the orientation of the DUT). Then, in TRP testing, the DUT needs to be repositioned based on the information recorded during the initial exploratory scan to ensure that the beam of spurious emissions can be aligned with the orthogonal cuts of the coordinate system to include the beam peak.
In this section, we propose the SA-AS-TRP algorithm. The algorithm assumes the DUT is a “black box” with the entire mechanical dimensions. Namely, its antenna structure is ignored, and the focus is only on the HPBW of the DUT radiation beam. As in practical tests, the beam radiation from the DUT always orients toward the center of the coordinate system, as shown in Figure 1. Thus, the beam can be aligned with the orthogonal cuts of the coordinate system to include the beam peak based on exploratory scans. The statistical variable in the algorithm is the HPBW of the emission beam. The beams are random and cannot be predicted in advance. In order to cover all possible situations, two ranges of the HPBW model are considered in this study, i.e., [ 10 , 50 ] and [ 2 , 10 ] . Furthermore, the Δ θ ref and Δ ϕ ref are determined by the physical size of the DUT. One of the main features of the discrete summation method is the tradeoff between the measurement time and the accuracy of TRP estimation. The reference angular step, which is the angular step required for accurate TRP assessment when using the full spherical grid without errors, is defined as follows:
Δ θ ref = min 15 , 180 π D λ Δ ϕ ref = min 15 , 180 π D c y l λ
where λ is the wavelength. D and D c y l are the spherical diameter and cylindrical diameter, respectively. In principle, any part of the equipment can act as an active or passive radiator. Therefore, the calculation of the reference steps for the evaluation of the TRP of spurious emissions must be based on the entire device size, including the mechanical structure. The structure of the DUT in Figure 1 includes the depth (d), width (w), and height (h); then,
D = d 2 + w 2 + h 2 D c y l = d 2 + w 2
The regular size of a DUT is 10 × 80 × 160 mm ( d × w × h , as shown in Figure 1). According to Equations (8) and (9), the reference step becomes
Δ θ ref 0.5 , Δ ϕ ref 1
where λ in Equation (8) is 0.0015 m, i.e., f = 200 GHz. This is because the FCC test requirements cover a frequency range from 9 kHz to 200 GHz for spurious emissions [11]. In this study, we discuss angular sampling under the harshest conditions, so we took the highest frequency to make all test situations applicable.
A correlation factor Δ TRP is defined to describe the deviation between the measured TRP and the target TRP.
Δ TRP = TRP measured TRP target
TRP target is calculated by using a dense full spherical grid method, where the sampling steps are Δ θ ref and Δ ϕ ref . TRP measured can be calculated with the spherical grid method, the two-cut method, and the three-cut method sampled at any angle. Furthermore, TRP target is considered to be an accurate TRP, which is used as a benchmark to measure the accuracy of TRP measured . In particular, when TRP measured is calculated using the spherical grid method and the sampling step is exactly equal to Δ θ ref and Δ ϕ ref , Δ TRP = 0 .
Subsequently, the standard deviation (STD) of 10,000 calculation results was used to characterize the measurement uncertainty caused by angular sampling in the TRP test.
STD = 1 M 1 m = 1 M ( Δ TRP m Δ TRP ¯ ) 2
where M = 10,000, and the bar denotes the average value.
As detailed in Algorithm 1, the SA-AS-TRP algorithm randomly generates beams with different HPBWs as the sources. Subsequently, the Δ TRP of the three TRP measurement methods is calculated using different sampling steps. The aforementioned steps are repeated 10,000 times, and the STD of each sampling step is computed. Finally, the measurement uncertainty introduced by angular sampling can be determined based on the STD.
Algorithm 1: Statistical analysis algorithm for the effect of angular sampling on the TRP (SA-AS-TRP)
1:
Initialize the reference angular steps Δ θ ref and Δ ϕ ref according to the entire device size and the highest frequency of testing;
2:
Initialize a vector with the sampling steps of interest, Δ Φ 1 × N = [ Δ ϕ 1 , Δ ϕ 2 , , Δ ϕ n ] , where N is the number of sampling steps;
3:
Initialize a random vector of HPBWs with a size of 1 × 10,000 , where the ranges of values for HPBWs are [ 10 , 50 ] and [ 2 , 10 ] ;
4:
for  n = 1 to N do
5:
    Sampling step: Δ ϕ = Δ ϕ n , Δ θ = Δ ϕ / 2 ;
6:
    for  i = 1 to 10,000  do
7:
        HPBW = HPBWs ( i ) ;
8:
        Calculate TRP target ( HPBW , Δ θ ref , Δ ϕ ref ) ;
9:
        Calculate Δ TRP grid ( HPBW , Δ θ , Δ ϕ ) ,
10:
                           Δ TRP two - cut ( HPBW , Δ θ , Δ ϕ ) ,
11:
                           Δ TRP three - cut ( HPBW , Δ θ , Δ ϕ ) ;
12:
    end for
13:
    Calculate the STD of 10,000 values for each of TRP method to obtain the STD of Δ TRP grid ( Δ θ , Δ ϕ ) , Δ TRP two - cut ( Δ θ , Δ ϕ ) , and Δ TRP three - cut ( Δ θ , Δ ϕ ) ;
14:
end for
15:
Determine the appropriate sampling step according to the STD of the full spherical grid method;
16:
Output the optimal sampling steps Δ θ and Δ ϕ .

3. Simulation Results and Discussion

In order to calculate the effect of angular sampling on the TRP based on the proposed algorithm, simulations were performed. The corresponding analyses and discussions are also described in this section. In the simulations, the test distance satisfied the requirement for the far-field distance.
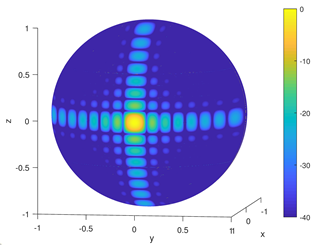
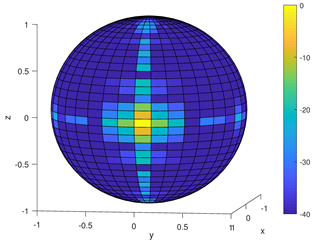
Table 1 shows the impact of the sampling step on the normalized EIRP patterns of different HPBWs. It can be seen that as the step increased, the normalized EIRP patterns exhibited different degrees of distortion. For HPBW = 25 , the normalized EIRP pattern could be basically restored when the sampling step was = 10 . However, when the step increased to 15 , both the main beam and the sidelobe were distorted. For HPBW 6 , the degree of reduction in the normalized EIRP patterns was acceptable when the sampling step was 5 . When it increased to 10 , the distortion was already obvious; as shown in the figure, almost all sidelobes disappeared. This distortion was more obvious when the sampling step was 15 . Although the sampling step was smaller and the restored EIRP pattern was better, it can be seen from the number of sampling points P in the table that the smaller the step was, the greater the number of sampling points would be, which meant that the cost of measurement would be higher. On the contrary, the larger the sampling step, the lower the number of sampling points, the lower the measurement accuracy, and the lower the cost. Therefore, determining an appropriate sampling step to ensure that the normalized EIRP patterns of different HPBWs can be well restored is very important. This also means finding a balance between measurement cost and accuracy to improve measurement efficiency.
To further clarify the impact of the sampling step on the TRP of different HPBWs, we simulated the variations in Δ TRP with different HPBWs and steps for different methods, as shown in Figure 4a–c. From the figure depicting the results of the spherical grid method, it can be seen that when the HPBW was greater than 30 , Δ TRP was small and remained almost unchanged as the sampling step increased. However, when the HPBW was less than 30 , Δ TRP changed significantly with the sampling step. When the step was less than 12, Δ TRP was almost zero, but as the step continued to increase, Δ TRP also gradually increased. In general, the narrower the HPBW of spurious emissions, the greater the effect of the sampling step on Δ TRP .
Figure 4b,c depict Δ TRP for the two-cut and three-cut methods. The values of Δ TRP for these methods were generally higher than those for the spherical grid method, but the trend of the change in Δ TRP with the HPBW and sampling step was the same. Compared with those in the three-cut method, the changes in the two-cut method were more significant. As shown in Figure 4b,c, Δ TRP increased with the decrease in the HPBW and the increase in the sampling step. This was mainly because the narrower the HPBW of spurious emissions is, the higher the beam resolution will be. Therefore, when the sampling step remained constant, Δ TRP increased with the decrease in the HPBW. Meanwhile, the larger the sampling step was, the more sparse the sampling points there would be, which led to an increase in Δ TRP . When the HPBW increases to a certain extent, the impact of the sampling step on Δ TRP can almost be ignored.
From the above analysis, it can be seen that the TRP mainly depended on the HPBW of the spurious beam and the sampling step. Therefore, we statistically analyzed the effect of the sampling step on the TRP with the SA-AS-TRP algorithm. Figure 5 and Figure 6 show the empirical cumulative distribution functions (CDFs) of the TRP error with different ranges of HPBWs for the spherical grid method. The TRP error is Δ TRP in Equation (11). Here, TRP measured was calculated by using the spherical grid method with different sampling steps, and TRP target was calculated with the reference step in Equation (10). Specifically, the TRP error was made when not measuring a dense full sphere. In particular, the discretized grid adopted in this paper is Δ θ = Δ ϕ / 2 . Although the TRP target is considered to be the most accurate TRP, some HPBWs may yield a smaller TRP when sampled at more suitable angles, resulting in a negative error value. This negative error is not expected to be significant, as it is primarily caused by the discretized grid method and computational errors. Generally, TRP values obtained from other sampling steps are greater than those obtained under the reference step, as a larger sampling step corresponds to a larger value and the error is positive. The spherical grid method is a classical method of TRP testing for radio-frequency radiation, and its TRP error (caused by angular sampling) is always less than that of the two-cut method and the three-cut method. As shown in Figure 5 and Figure 6, when the HPBWs of the spurious beam were in the range of [ 10 , 50 ] , keeping the sampling step within 10 ensured that 95 % of the TRP error was almost zero. However, when the HPBWs were in the range of [ 2 , 10 ] , 95 % of the TRP error was nearly above 2 dB if the sampling step was 10 , and the step that was able to satisfy the 95 % confidence interval was less than 6 .
Furthermore, according to the SA-AS-TRP algorithm, we used the STD to determine the measurement uncertainty is caused by angular sampling for the three methods.
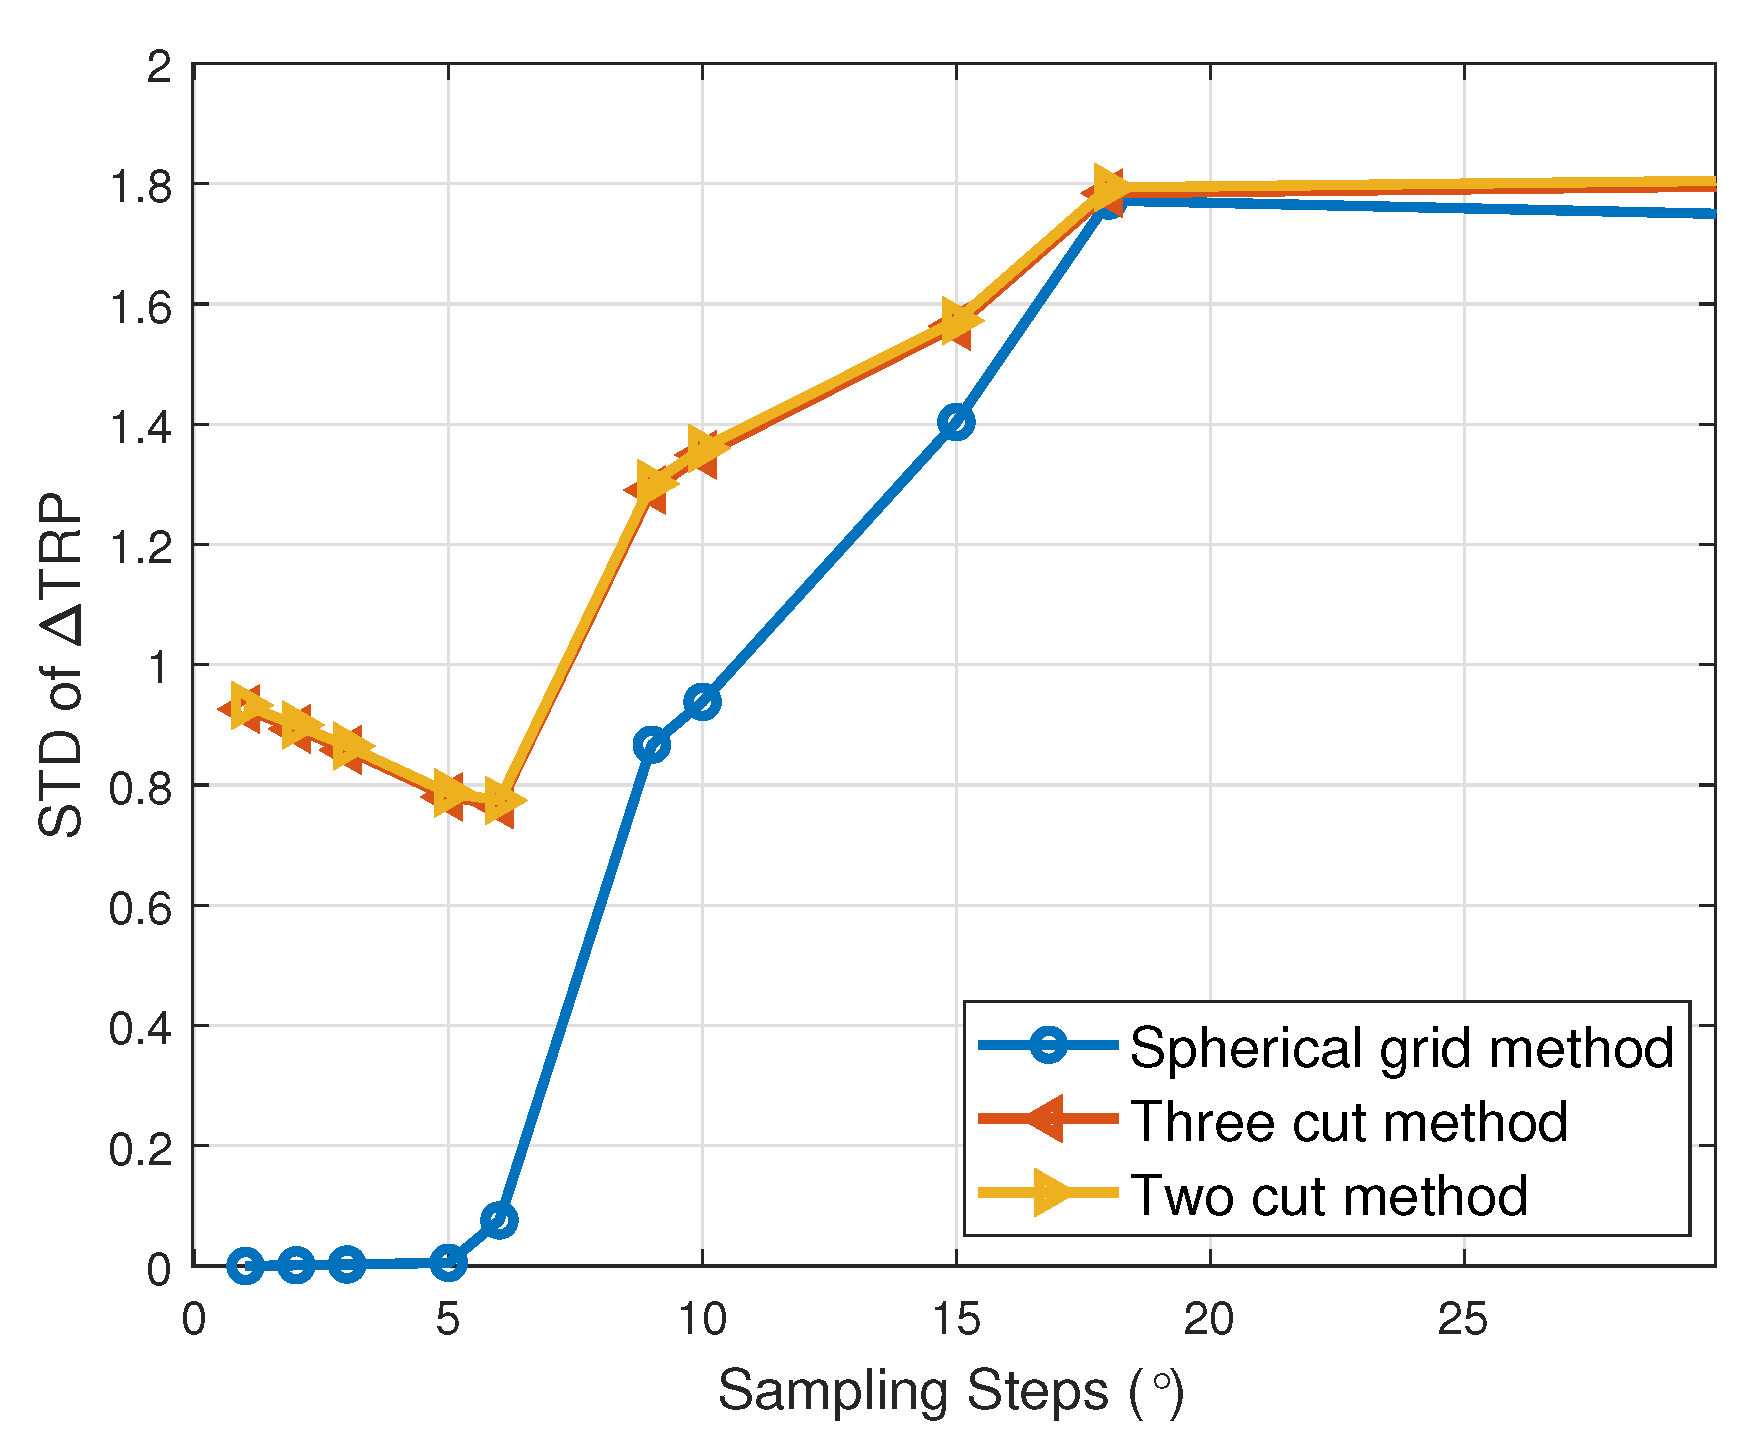
 Figure 7 and Figure 8 show the STDs of Δ TRP for the three methods. When the HPBWs were in the range of [ 10 , 50 ] , the curves calculated with the three methods all increased with the increase in the sampling step. The curves of the two-cut method and the three-cut method had a downward trend and an upward trend in the step range from 5 to 15 . This was because some sampling steps symmetrically aligned beams with the orthogonal cuts of the coordinate system. Consistent with the conclusion obtained in Figure 5, when the sampling step was less than 10 , the STDs of Δ TRP were almost zero. This meant that the measurement uncertainty caused by a sampling step within 10 could be ignored for the spherical grid method. However, for the two-cut and three-cut methods, the STD of Δ TRP reached 2.3 dB and 2.2 dB, even if the step was a reference step. Therefore, the acceptable sampling step was determined by the results of the spherical grid method. Consequently, when the HPBWs were in the range of [ 10 , 50 ] , the maximum angular sampling should have been 10 , but the measurement uncertainty of the two-cut method and three-cut method needed to be considered, and these were 2.19 dB and 2.08 dB, respectively. Similarly, when the HPBWs were in the range of [ 2 , 10 ] , the curves also increased with the increase in the sampling step, and the curves of the two-cut and three-cut methods basically coincided. Consistently with the conclusion in Figure 8, the sampling step needed to be less than 6 in order to ignore the measurement uncertainty caused by sampling with the spherical grid method. However, for the two-cut and three-cut methods, the measurement uncertainty was 0.85 dB. It should be noted that the STDs when the HPBWs were in the range of [ 2 , 10 ] were smaller than those when the HPBWs were in the range of [ 10 , 50 ] . Accordingly, the narrower the beam of spurious emissions, the less measurement uncertainty caused by the sampling step. However, this does not mean that the narrower the beam of spurious emissions is, the higher the measurement accuracy of the two-cut and three-cut methods will be. For example, as shown in Figure 4c, when the HPBW and sampling step were 5 , the Δ TRP reached up to 7.5 dB. The same applies to the three-cut method.

4. Conclusions

This study demonstrated a TRP measurement procedure for spurious emissions and introduced three TRP measurement methods that are regulated by the FCC. Based on this, the SA-AS-TRP algorithm was proposed to analyze the effect of angular sampling on the TRP. The variables that affect the calculation of the TRP with these three methods, i.e., the HPBW of the spurious emissions and the sampling step, were determined through a simulation analysis. Therefore, it was assumed that the HPBWs of spurious emissions were in the ranges of [ 10 , 50 ] and [ 2 , 10 ] . Numerical simulations demonstrated that the narrower the HPBWs of spurious emissions were, the smaller the measurement uncertainty caused by the sampling step would be. The steps needed to be less than 6 in order to ignore the measurement uncertainty for the spherical grid method. However, for the two-cut and three-cut methods, the measurement uncertainty of 2 dB and 1 dB should be considered in the two HPBW models. Moreover, the narrower the HPBWs are, the lower the measurement accuracy of the two-cut and three-cut methods will be.
Qualitative analysis was applied to angular sampling for the three TRP measurement methods. In practical tests, the size of the frequency sweep range increases the time taken for the initial exploratory scan. In addition, it should be ensured that the beam peak is aligned with orthogonal cuts, which are beamformed according to how they are identified in exploratory scans for harmonics and spurious emission frequencies. In future work, an experimental verification should be conducted with a standard test site, test system, and terminal equipment.

Author Contributions

Methodology, G.G., N.M., R.W. and Y.X.; Software, G.G. and X.Y.; Validation, X.Y.; Resources, R.W. and Y.Z.; writing—original draft preparation, G.G. and X.Y.; writing—review and editing, N.M., R.W., Y.Z. and X.X.; Supervision, X.X. and P.Z. All authors have read and agreed to the published version of the manuscript.

Funding

This research did not receive any specific funding.

Data Availability Statement

Not applicable.

Conflicts of Interest

The authors declare no conflict of interest.

References

  1. Zhang, P.; Xu, X.; Dong, C.; Han, S.; Wang, B. Intellicise communication system: Model-driven semantic communications. J. China Univ. Posts Telecommun. 2022, 29, 2–12. [Google Scholar]
  2. Zhang, P.; Xu, W.; Gao, H.; Niu, K.; Xu, X.; Qin, X.; Yuan, C.; Qin, Z.; Zhao, H.; Wei, J.; et al. Toward Wisdom-Evolutionary and Primitive-Concise 6G: A New Paradigm of Semantic Communication Networks. Engineering 2022, 8, 60–73. [Google Scholar] [CrossRef]
  3. Hemadeh, I.A.; Satyanarayana, K.; El-Hajjar, M.; Hanzo, L. Millimeter-Wave Communications: Physical Channel Models, Design Considerations, Antenna Constructions, and Link-Budget. IEEE Commun. Surv. Tuts. 2018, 20, 870–913. [Google Scholar] [CrossRef]
  4. Bj<i>o</i>¨rnson, E.; Larsson, E.G.; Marzetta, T.L. Massive MIMO: Ten myths and one critical question. IEEE Commun. Mag. 2016, 54, 114–123. [Google Scholar]
  5. Zhang, Y.; Mao, J. An Overview of the Development of Antenna-in-Package Technology for Highly Integrated Wireless Devices. Proc. IEEE 2019, 107, 2265–2280. [Google Scholar] [CrossRef]
  6. Zhang, P.; Yang, X.; Chen, J.; Huang, Y. A survey of testing for 5G: Solutions, opportunities, and challenges. China Commun. 2019, 16, 69–85. [Google Scholar]
  7. Hong, W.; Baek, K.H.; Ko, S. Millimeter-wave 5G antennas for smartphones: Overview and experimental demonstration. IEEE Trans. Antennas Propag. 2017, 65, 6250–6261. [Google Scholar] [CrossRef]
  8. Yu, B.; Yang, K.; Sim, C.Y.D.; Yang, G. A novel 28 GHz beam steering array for 5G mobile device with metallic casing application. IEEE Trans. Antennas Propag. 2017, 65, 6250–6261. [Google Scholar] [CrossRef]
  9. Catteau, S. Measuring Radiated Spurious Emissions from a 5G Device in a Reverberation Chamber. In Proceedings of the 2022 International Symposium on Electromagnetic Compatibility-EMC Europe, Gothenburg, Sweden, 5–8 September 2022; pp. 42–46. [Google Scholar]
  10. Qi, Y.; Yang, G.; Liu, L.; Fan, J.; Orlandi, A.; Kong, H.; Yu, W.; Yang, Z. 5G over-the-air measurement challenges: Overview. IEEE Trans. Electromagn. Compat. 2017, 65, 6250–6261. [Google Scholar] [CrossRef]
  11. Standard IEEE C63.26-2015; IEEE/ANSI Standard for Compliance Testing of Transmitters Used in Licensed Radio Services. IEEE: New York, NY, USA, 2015.
  12. CTIA. Test Plan for Wireless Device Over-the-Air Performance Method of Measurement for Radiated RF Power and Receiver Performance Version 3.6.1; CTIA: Washington, DC, USA, 2016. [Google Scholar]
  13. Friden, J.; Razavi, A.; Stjernman, A. Angular sampling, Test Signal, and Near Field Aspects for Over-the-Air Total Radiated Power Assessment in Anechoic Chambers. IEEE Access 2018, 6, 57826–57839. [Google Scholar] [CrossRef]
  14. Arai, H.; Ishii, N. Sampling points reduction in spherical scanned TRP measurement. In Proceedings of the 2014 IEEE Conference on Antenna Measurements & Applications (CAMA), Antibes Juan-les-Pins, France, 16–19 November 2014. [Google Scholar]
  15. Huang, S.; Li, F.; Chen, X. An improved method for total radiated power tests in anechoic chamber. IEEE Trans. Instrum. Meas. 2022, 71, 1–9. [Google Scholar] [CrossRef]
  16. 3GPP RAN4 R4-1704857; Introduction of Test Method for OTA Unwanted Emissions. Ericsson: Stockholm, Sweden, 2017.
  17. 3GPP RAN4 R4-1707736; TP for TR 37.843: Introduce New Test Method. Ericsson: Stockholm, Sweden, 2017.
  18. Federal Communications Commission Office of Engineering and Technology Laboratory Division. KDB842590 D01: Upper Microwave Flexible Use Service v01r02; FCC: New York, NY, USA, 2021.
  19. Zhou, J.; Yang, D.; Sun, C.; Fu, X.; Gu, Z.; Li, H.; Jin, Y. Accurate Simulation Methodology of RSE (Radiated Spurious Emission) on Electronic Device. In Proceedings of the 2022 Asia-Pacific International Symposium on Electromagnetic Compatibility (APEMC), Beijing, China, 8–11 May 2022; pp. 207–209. [Google Scholar]
  20. Cheng, D.K. Field and Wave Electromagnetics; Rifkind, B., Ed.; Addison-Wesley: Reading, MA, USA, 1989. [Google Scholar]
Figure 1. Spherical coordinates and DUT dimensions.
Electronics 12 04290 g001
Figure 2. Schematic diagram of a full spherical grid with fixed steps. Suppose that the sampling radius is 1 m.
Electronics 12 04290 g002
Figure 3. Geometry of orthogonal cuts. The red and blue indicate two mandatory cut grids (two-cut method), while the yellow indicates an optional cut grid (three-cut method).
Electronics 12 04290 g003
Figure 4. Δ TRP as a function of HPBWs and sampling steps with three method.
Electronics 12 04290 g004
Figure 5. Empirical CDFs for HPBWs in the range of [ 10 , 50 ] and the spherical grid method based on 10,000 samples.
Electronics 12 04290 g005
Figure 6. Empirical CDFs for HPBWs in the range of [ 2 , 10 ] and the spherical grid method based on 10,000 samples.
Electronics 12 04290 g006
Figure 7. STDs of Δ TRP as a function of the sampling step for the three methods. The HPBWs are in the range of [ 10 , 50 ] .
Electronics 12 04290 g007
Figure 8. STDs of Δ TRP as a function of the sampling step for the three methods. The HPBWs are in the range of [ 2 , 10 ] .
Electronics 12 04290 g008
Table 1. Sampling setup with the normalized EIRP patterns.
Sampling ConfigHPBW = 25 HPBW = 6
Normalized EIRP patternsElectronics 12 04290 i001Electronics 12 04290 i002
Δ ϕ = 5 P = 32,761Electronics 12 04290 i003Electronics 12 04290 i004
Δ ϕ = 10 P = 1369Electronics 12 04290 i005Electronics 12 04290 i006
Δ ϕ = 15 P = 361Electronics 12 04290 i007Electronics 12 04290 i008
Disclaimer/Publisher’s Note: The statements, opinions and data contained in all publications are solely those of the individual author(s) and contributor(s) and not of MDPI and/or the editor(s). MDPI and/or the editor(s) disclaim responsibility for any injury to people or property resulting from any ideas, methods, instructions or products referred to in the content.

