Article

IoT Intrusion Detection System Based on Machine Learning

1
School of Cyber Science and Engineering, Zhengzhou University, Zhengzhou 450000, China
2
Three Academy, Information Engineering University, Zhengzhou 450000, China
3
The 28th Research Institute of China Electronics Technology Group Corporation, Nanjing 210007, China
*
Author to whom correspondence should be addressed.
Electronics 2023, 12(20), 4289; https://doi.org/10.3390/electronics12204289
Submission received: 18 September 2023 / Revised: 10 October 2023 / Accepted: 12 October 2023 / Published: 17 October 2023
(This article belongs to the Topic Machine Learning in Internet of Things)

Abstract

:
With the rapid development of the Internet of Things (IoT), the number of IoT devices is increasing dramatically, making it increasingly important to identify intrusions on these devices. Researchers are using machine learning techniques to design effective intrusion detection systems. In this study, we propose a novel intrusion detection system that efficiently detects network anomalous traffic. To reduce the feature dimensions of the data, we employ the binary grey wolf optimizer (BGWO) heuristic algorithm and recursive feature elimination (RFE) to select the most relevant feature subset for the target variable. The synthetic minority oversampling technique (SMOTE) is used to oversample the minority class and mitigate the impact of data imbalance on the classification results. The preprocessed data are then classified using XGBoost, and the hyperparameters of the model are optimized using Bayesian optimization with tree-structured Parzen estimator (BO-TPE) to achieve the highest detection performance. To validate the effectiveness of the proposed method, we conduct binary and multiclass experiments on five commonly used IoT datasets. The results show that our proposed method outperforms state-of-the-art methods in four out of the five datasets. It is noteworthy that our proposed method achieves perfect accuracy, precision, recall, and an F1 score of 1.0 on the BoT-Iot and WUSTL-IIOT-2021 datasets, further validating the effectiveness of our approach.

1. Introduction

The rapid development of the Internet of Things (IoT) has completely transformed many industries, such as smart homes, smart agriculture, healthcare, and more [1]. According to survey data, the number of IoT devices is projected to exceed 4.1 billion by 2025 [2]. In everyday life, IoT devices play a crucial role in people’s lives. However, the extensive connectivity of these devices to the internet exposes them to various security risks. For example, IoT devices exchange information over the internet and are susceptible to numerous network attacks, compromising their security. According to a report by Nozomi Networks, new IoT botnet attacks increased rapidly in the first half of 2020, with 57% of IoT devices being vulnerable targets [3]. Furthermore, attackers can launch denial-of-service (DoS) attacks, depleting network and device resources [4]. Therefore, enhancing the security of IoT devices has become a critical area of research [5]. To mitigate the risks posed by different types of attacks, researchers are developing intrusion detection systems to identify malicious behavior in networks. Intrusion detection systems monitor systems in real-time and issue warnings in case of any anomalies, thereby enhancing the security of communication.
In recent years, machine learning, with its rapid development, has found extensive applications in the field of intrusion detection [6,7]. Machine learning algorithms offer unique advantages compared to traditional detection methods. They can not only learn complex patterns and rules from large volumes of data but also handle high-dimensional and nonlinear data, making them more suitable for intrusion detection in complex systems. Furthermore, with the advancement of networks, a significant amount of network data, including samples of various intrusion and abnormal behaviors, has been accumulated. This rich dataset provides ample training samples for machine learning, ensuring excellent detection performance of machine learning algorithms. However, despite the achievements of machine learning algorithms, there are still some challenges and issues that need to be addressed.
The real-time capability of an IoT device intrusion detection system is a crucial consideration for ensuring network security. IoT devices typically have limited computational resources and storage capacity. Due to these resource constraints, the system may struggle to efficiently process and analyze a large amount of network traffic data, leading to delays or inability to meet real-time requirements in detection. Additionally, in the face of frequent network attacks on IoT devices and the constant evolution of attack techniques, intrusion detection systems are under increasing pressure to detect such attacks [8]. The generation of a vast amount of network traffic data introduces significant redundancy and irrelevant features. Redundant features in the data can lead to overfitting during the model learning process, ultimately diminishing detection performance [9]. One effective approach to address feature redundancy is feature selection. Feature selection plays a crucial role in machine learning-based intrusion detection systems, reducing the dimensionality of the dataset, lowering training time and computational costs, while improving model performance [10]. Recently, metaheuristic algorithms have gained considerable attention in the field of feature selection due to their excellent global search capabilities [11]. Commonly used metaheuristic algorithms include genetic algorithm (GA), particle swarm optimization (PSO) [12], whale optimization algorithm (WOA) [13], grey wolf optimization (GWO) [14], and simulated annealing (SA), among others. Among these algorithms, GWO has garnered considerable interest due to its ease of implementation, fast convergence speed, and strong optimization capabilities. To better utilize GWO for feature selection problems, Emary et al. proposed a novel binary grey wolf optimization (BGWO) [15]. Hsu et al. [16] pointed out that hybrid feature selection methods outperform individual feature selection methods. Furthermore, recursive feature elimination (RFE), a wrapper feature selection method, strikes a good balance between accuracy and runtime, preserving a certain level of accuracy while reducing runtime. In this study, we propose a novel two-stage feature selection method that combines the strengths of BGWO and RFE. This method reduces the search space for feature subsets and eliminates redundant features.
Our main contributions are as follows:
  • We propose an intrusion detection system based on XGBoost, utilizing a novel two-stage feature selection method called BGWO-RFE-XGBoost. Initially, BGWO is used to preliminarily filter a large number of features, removing those that have minimal impact on the target variable. Then, RFE-XGBoost is employed for further fine-grained feature selection, resulting in the final feature subset. This two-stage feature selection method maximizes the accuracy and generalization capability of the model.
  • We conduct extensive experiments on five publicly available datasets in the IoT domain to validate the effectiveness of our approach. The results outperform other state-of-the-art methods in both binary and multi-class classification experiments. Particularly, experiments on the N-BaIoT dataset demonstrate that using the proposed hybrid feature selection method reduces the model’s runtime by 39.66% without sacrificing accuracy.
The rest of this paper is organized as follows: Section 2 presents recent relevant research in the field of intrusion detection. Section 3 describes the proposed method. Section 4 presents the experimental details and results. Section 5 concludes the paper and suggests future work.

2. Related Works

Recently, machine learning techniques have been widely applied in the field of intrusion detection in the Internet of Things (IoT) and have achieved excellent results. Intrusion detection systems based on machine learning are typically divided into two parts. The first part is data preprocessing, which involves preprocessing the data before feeding it into the model. This includes feature selection and handling imbalanced datasets, to provide better inputs to the model. The second part is the classifier, where selecting an appropriate model can maximize the intrusion detection rate. Therefore, many researchers have focused their efforts on these two aspects to create powerful intrusion detection systems. In this section, we will review the recent work.
Lazzarini et al. [17] built an IoT intrusion detection system using an ensemble stacking approach. They combined four different deep learning models (MLP, DNN, CNN, and LSTM) to detect and classify attacks in IoT environments. Binary and multi-class experiments were conducted on the Ton-IoT and CIC-IDS2017 datasets. The results showed that the proposed method was able to detect the majority of attacks with particularly low false positive (FP) and false negative (FN) rates. However, this approach integrates four different models, which requires a significant amount of resources and further evaluation of its performance on real IoT devices. Alani [18] used feature importance-based recursive feature elimination (RFE) for feature selection on the dataset, selecting the top 11 most important features. They used a decision tree (DT) classifier for classification and Shapley additive explanation (SHAP) to explain the selected features and classifier. The proposed method achieved an accuracy of 0.9997 on the WUSTL-IIOT-2021 dataset. Nizamudeen [19] employed integer-grading normalization (I-GN) for data preprocessing and used opposition-based learning (OBL)-rat inspired optimizer (RIO) for feature selection to retain important features. Experiments on a combined dataset (NF-UQ-NIDS) showed improved detection accuracy compared to other state-of-the-art methods. Sharma et al. [20] proposed an IoT intrusion detection system based on a deep neural network (DNN) model to better protect the security of internet devices. They used a generative adversarial network (GAN) to synthesize minority attack class data and employed the Pearson’s correlation coefficient (PCC) filter method for feature selection. Experimental results on the UNSW-NB15 dataset achieved an accuracy of 91% with balanced data.
Kareem et al. [21] proposed a feature selection algorithm using the algorithm for bird swarms (BSA) to improve the performance of the gorilla troops optimizer (GTO). Experiments on the NSL-KDD, CICIDS-2017, UNSW-NB15, and Bot-IoT datasets demonstrated that the proposed GTO-BSA achieved better convergence speed and performance. Mohy-eddine et al. [22] presented an IoT intrusion detection system based on the K-nearest neighbors (K-NN) algorithm, utilizing principal component analysis (PCA), univariate statistical tests, and genetic algorithm (GA) for feature selection. Experiments on the Bot-IoT dataset achieved a high accuracy of 99.99% while significantly reducing the prediction time. Liu et al. [23] addressed the issue of excessive flow features affecting detection speed in IoT intrusion detection systems by proposing a feature selection method based on a genetic algorithm. Extensive experiments on the Bot-IoT dataset selected six features from 40 features, achieving an accuracy of 99.98% and an F1 score of 99.63%. Alweshah et al. [24] proposed a novel wrapping feature selection algorithm that employed the emperor penguin colony (EPC) to explore the search space, selecting K-nearest neighbors (KNN) as the classifier. Experimental results on well-known IoT datasets showed improved accuracy and reduced feature size compared to methods such as the multi-objective particle swarm optimization (MOPSO). Hassan et al. [25] used an improved binary manta ray foraging algorithm for feature selection to remove redundant and irrelevant features from the dataset, and utilized a random forest (RF) classifier for classification. The proposed method was evaluated on the NSL-KDD and CIC-IDS2017 datasets, selecting 22 and 38 features, respectively, and achieved accuracies of 98.8% and 99.3%. Mohiuddin et al. [26] proposed a modified wrapper-based whale sine-cosine method to reduce the complexity of feature selection optimization, selecting important features, and used XGBoost as the classifier. Experimental results on the UNSW-NB15 dataset achieved accuracy rates of 99% and 91% for binary and multi-class classification, respectively, and an accuracy of 98% for binary classification on the CIC-IDS2017 dataset.
The literature review indicates that although the aforementioned methods have achieved relatively high detection performance, there is still room for improvement in detection rate and optimization of feature selection methods. Additionally, relying solely on a single feature selection method may not result in the optimal feature subset, which could impact the detection performance of the models.

3. Proposed Method

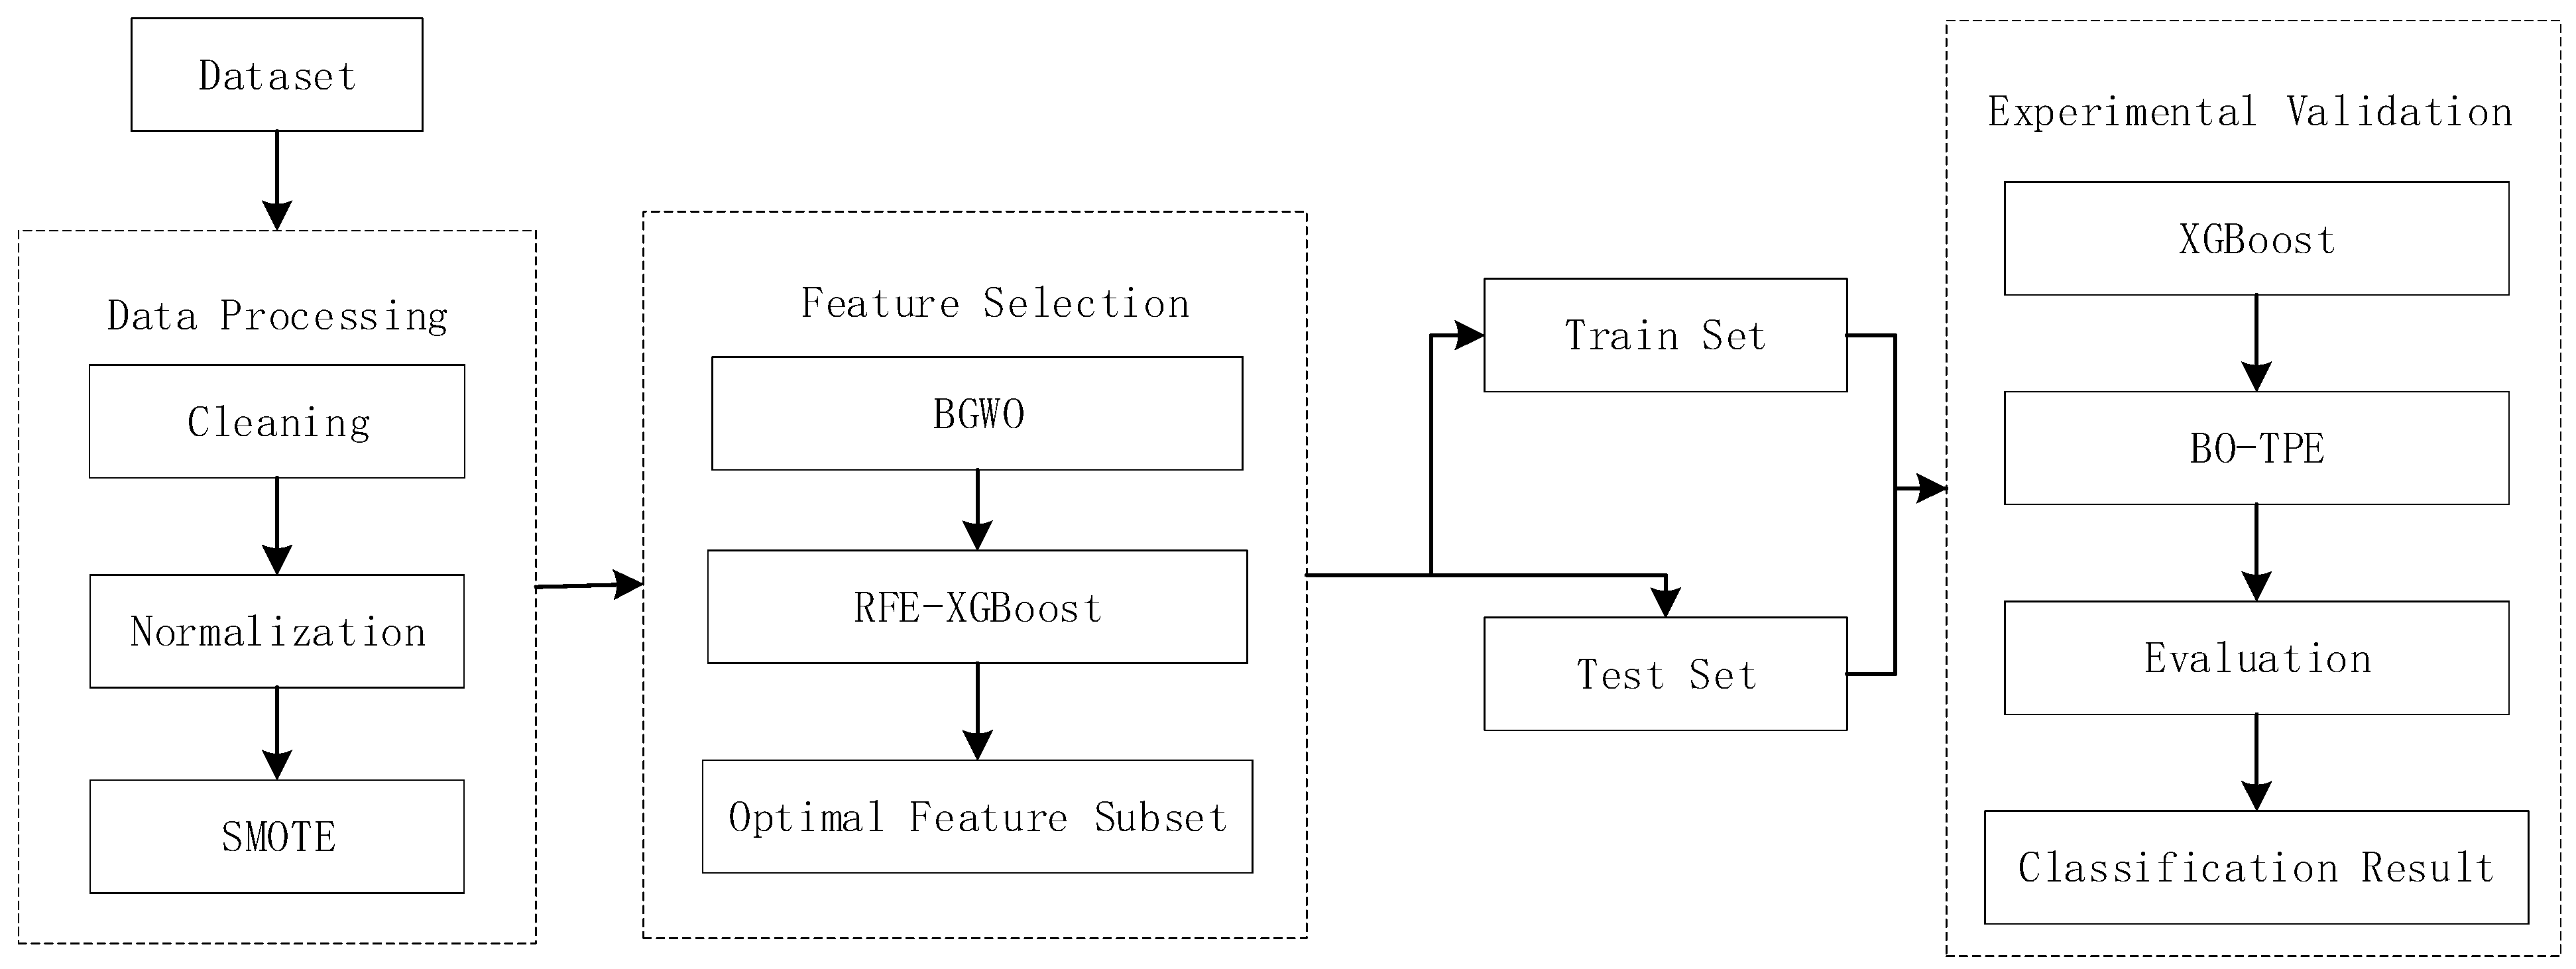
This section provides an introduction to the proposed method, and Figure 1 illustrates the overall architecture. The first step involves dataset cleaning and normalization. The feature selection process consists of two stages. In the initial stage, BGWO is utilized to conduct a screening of the original feature set, removing redundant or irrelevant features. The resulting feature subset then undergoes further optimization using recursive feature elimination (RFE). During the recursive process, the XGBoost [27] model is employed to rank the importance of each feature, and features with low scores are selected and eliminated. This iterative approach enables the identification of an optimal feature subset. To mitigate the impact of imbalanced data distribution on classifier results and enhance the detection rate of minority classes, we employ SMOTE technology. Once the data preprocessing phase is complete, the dataset is split into training and testing sets. Lastly, XGBoost is employed for classification, and Bayesian optimization with tree-structured Parzen estimator (BO-TPE) is utilized to optimize the model parameters, aiming to achieve optimal performance.

3.1. Proposed Feature Selection Method

3.1.1. Grey Wolf Optimization Algorithm

Meta-heuristic algorithms possess several advantages, including simplicity, flexibility, and powerful optimization capabilities, making them widely applicable in various research fields. Mirjalili et al. [
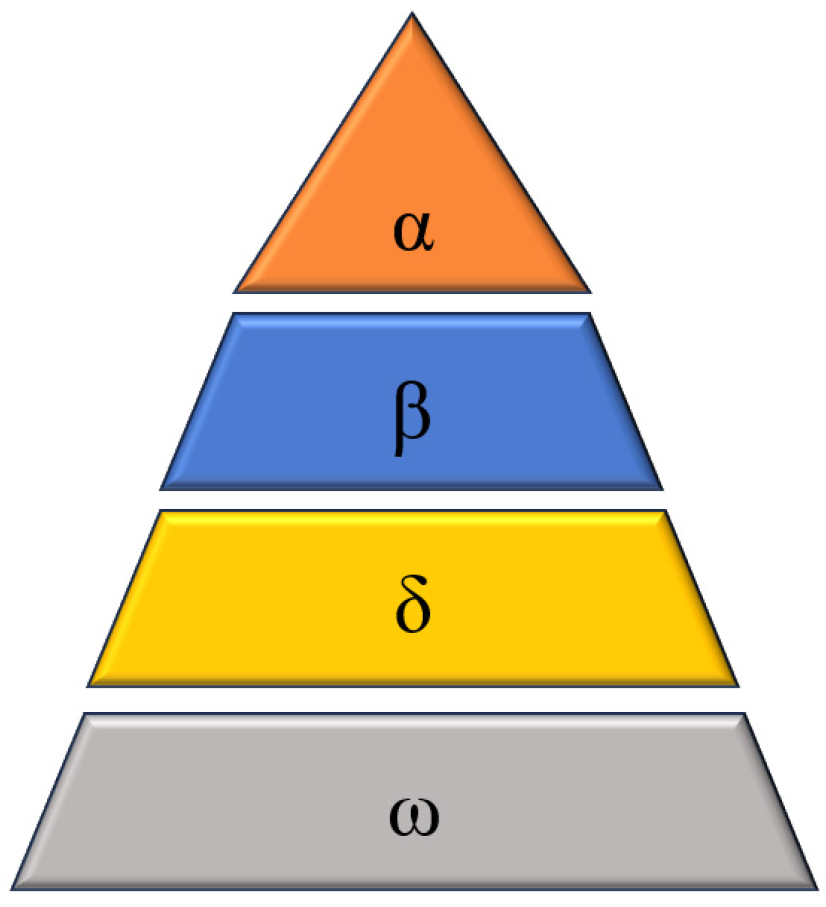
14] introduced the grey wolf optimization algorithm, a metaheuristic algorithm inspired by the hunting behavior of grey wolf populations. Grey wolves are skilled hunters that often collaborate in groups for successful prey capture. Within the grey wolf group, a strict social hierarchy exists, segmented into four distinct classes, as depicted in Figure 2:
(1)
The leader of the grey wolf group, known as the alpha (α) wolf, assumes decision-making responsibilities regarding hunting, sleeping arrangements, and other important matters.
(2)
Beta (β) is the second-ranking member of the grey wolf class, standing second only to the α wolf in status.
(3)
At the third level of the grey wolf hierarchy, we find the delta (δ) wolves, which typically fulfill roles such as lookouts and scouts. δ wolves are obliged to follow the leadership of the α and β wolves and exert authority over the lowest-ranked grey wolf, the omega (ω).
(4)
ω wolves make up the largest population within the grey wolf group and are required to follow the directions of the α, β, and δ wolves. They always receive the last portion of food.
The GWO algorithm model summarizes the hunting process of grey wolves, which is divided into three stages: siege, hunting, and attacking prey.
(1)
The stage of surrounding the prey. During the hunting process, the hunting behavior is expressed as follows:
M = p N p ( i ) N ( i )
N ( i + 1 ) = N p ( i ) q M
q = 2 c d 1 2 c
p = 2 d 2
a = 2 i * 2 i m a x
Among these variables, N p represents the position of the prey that the grey wolf intends to hunt, while N represents the position of the grey wolf itself. d 1 and d 2 are random vectors, with values between 0 and 1 in each dimension. As the iteration progresses, the component a linearly decreases from 2 to 0. Both p and q are coefficients corresponding to these positions.
(2)
During the group hunting phase, grey wolves are capable of recognizing the location of the prey and strategically encircling it. The hunting group consists of alpha leaders, betas, and deltas, all actively participating in the hunt. The aforementioned process can be described mathematically, with the prey symbolizing a potential optimal solution. Assuming that alpha (α), beta (β), and delta (δ) wolves can swiftly identify potential prey (optimal solutions), the top three wolves in the group are updated to become the alpha, beta, and delta wolves after each iteration. Additionally, the omega (ω) wolves coordinate their positions based on alpha, beta, and delta, adjusting their own positions to gradually enclose the prey. The mathematical model representing this process can be expressed as follows:
N 1 = N α p 1 M α , N 2 = N β p 2 M β , N 3 = N δ p 3 M δ ,
M α = q 1 N α N , M β = q 2 N β N , M δ = q 3 N δ N ,
N ( i + 1 ) = N 1 + N 2 + N 3 3
In this context, M α , M β , and M δ represent the distances between the current candidate grey wolf and the α, β, and δ wolves, respectively. Similarly, N 1 , N 2 , and N 3 respectively denote the estimated prey position based on the positions of grey wolves α, β, and δ in the current population. Additionally, N α , N β , and N δ represent the positions of grey wolves α, β, and δ in the current population.

3.1.2. Binary Grey Wolf Optimization (BGWO)

The main focus of the feature selection problem is determining whether a specific feature should be included in the optimal subset constructed from a dataset. Mathematically, this can be described as selecting h features from a total of A features. In the context of intrusion detection, the chosen feature subset is used for classifying network traffic. In this case, the objective is to minimize h (the number of selected features) while maximizing the classification accuracy rate.
To apply the grey wolf optimization (GWO) algorithm to feature selection problems, a redesign of the algorithm is necessary. Emary et al. [15] propose the binary grey wolf optimization (BGWO) algorithm specifically for this purpose. The following Algorithm 1 provides the BGWO algorithm.
In BGWO, the update formula is mainly as follows:
N j i + 1 = C r o s s o v e r n 1 , n 2 , n 3
Among them, the crossover operation between the three solutions of a, b, and c is represented as C r o s s o v e r ( a , b , c ) . The binary vectors n 1 , n 2 , and n 3 represent the α, β, and δ wolf pairs in the group. The influence of the movement of other grey wolves can be calculated using the following formulas.
n 1 m = { 1 i f   ( n α m + x s t e p α m ) 1 0 o t h e r w i s e
n 2 m = { 1 i f   ( n β m + x s t e p β m ) 1 0 o t h e r w i s e
n 3 m = { 1 i f   ( n δ m + x s t e p δ m ) 1 0 o t h e r w i s e
Among them, n α m and x s t e p α m represent the position vector of the α wolf in dimension m and the binary step, respectively. Similarly, n β m and x s t e p β m , x δ m and b s t e p δ m represent the position vector and binary step of the β and δ wolves in dimension m, respectively. x s t e p α m , x s t e p β m , and x s t e p δ m can be calculated using the following formulas.
x s t e p α m = { 1 i f   y s t e p α m r a n d 0 o t h e r w i s e
x s t e p β m = { 1 i f   y s t e p β m r a n d 0 o t h e r w i s e
x s t e p β m = { 1 i f   y s t e p δ m r a n d 0 o t h e r w i s e
Among them, rand belongs to the uniform distribution [0, 1]. y s t e p α m , y s t e p β m , and y s t e p δ m represent the continuous valued step size for α, β, and δ, respectively, in dimension m. This can be obtained using the following formulas.
y s t e p α m = 1 1 + e 10 ( q 1 m M α m 0.5 ) ,
y s t e p β m = 1 1 + e 10 ( q 1 m M β m 0.5 ) ,
y s t e p δ m = 1 1 + e 10 ( q 1 m M δ m 0.5 ) ,
Algorithm 1 BGWO algorithm.
Input: N w o l f , Wolf pack size; N I t e r , Maximum iterations; F, Features in the dataset.
Output: S, Optimal feature subset.
(1). Initialize three parameters a, p and q.
(2). Initializing the position of N w o l f grey wolves
(3). Sorting grey wolves by fitness value and selecting the top three (α, β, and δ wolves)
(4). i = 1
While  (i < N I t e r )
   For Each individual grey wolf in the pack
        Calculate n 1 , n 2 , n 3 using Equations (10)–(12).
     N j i + 1 crossover among n 1 , n 2 , n 3 using Equation (9).
   End
  I Updating the parameters a, p, and q.
  II After updating the location, calculate the fitness value of each grey wolf.
  III update α, β and δ.
End

3.1.3. RFE-XGBoost

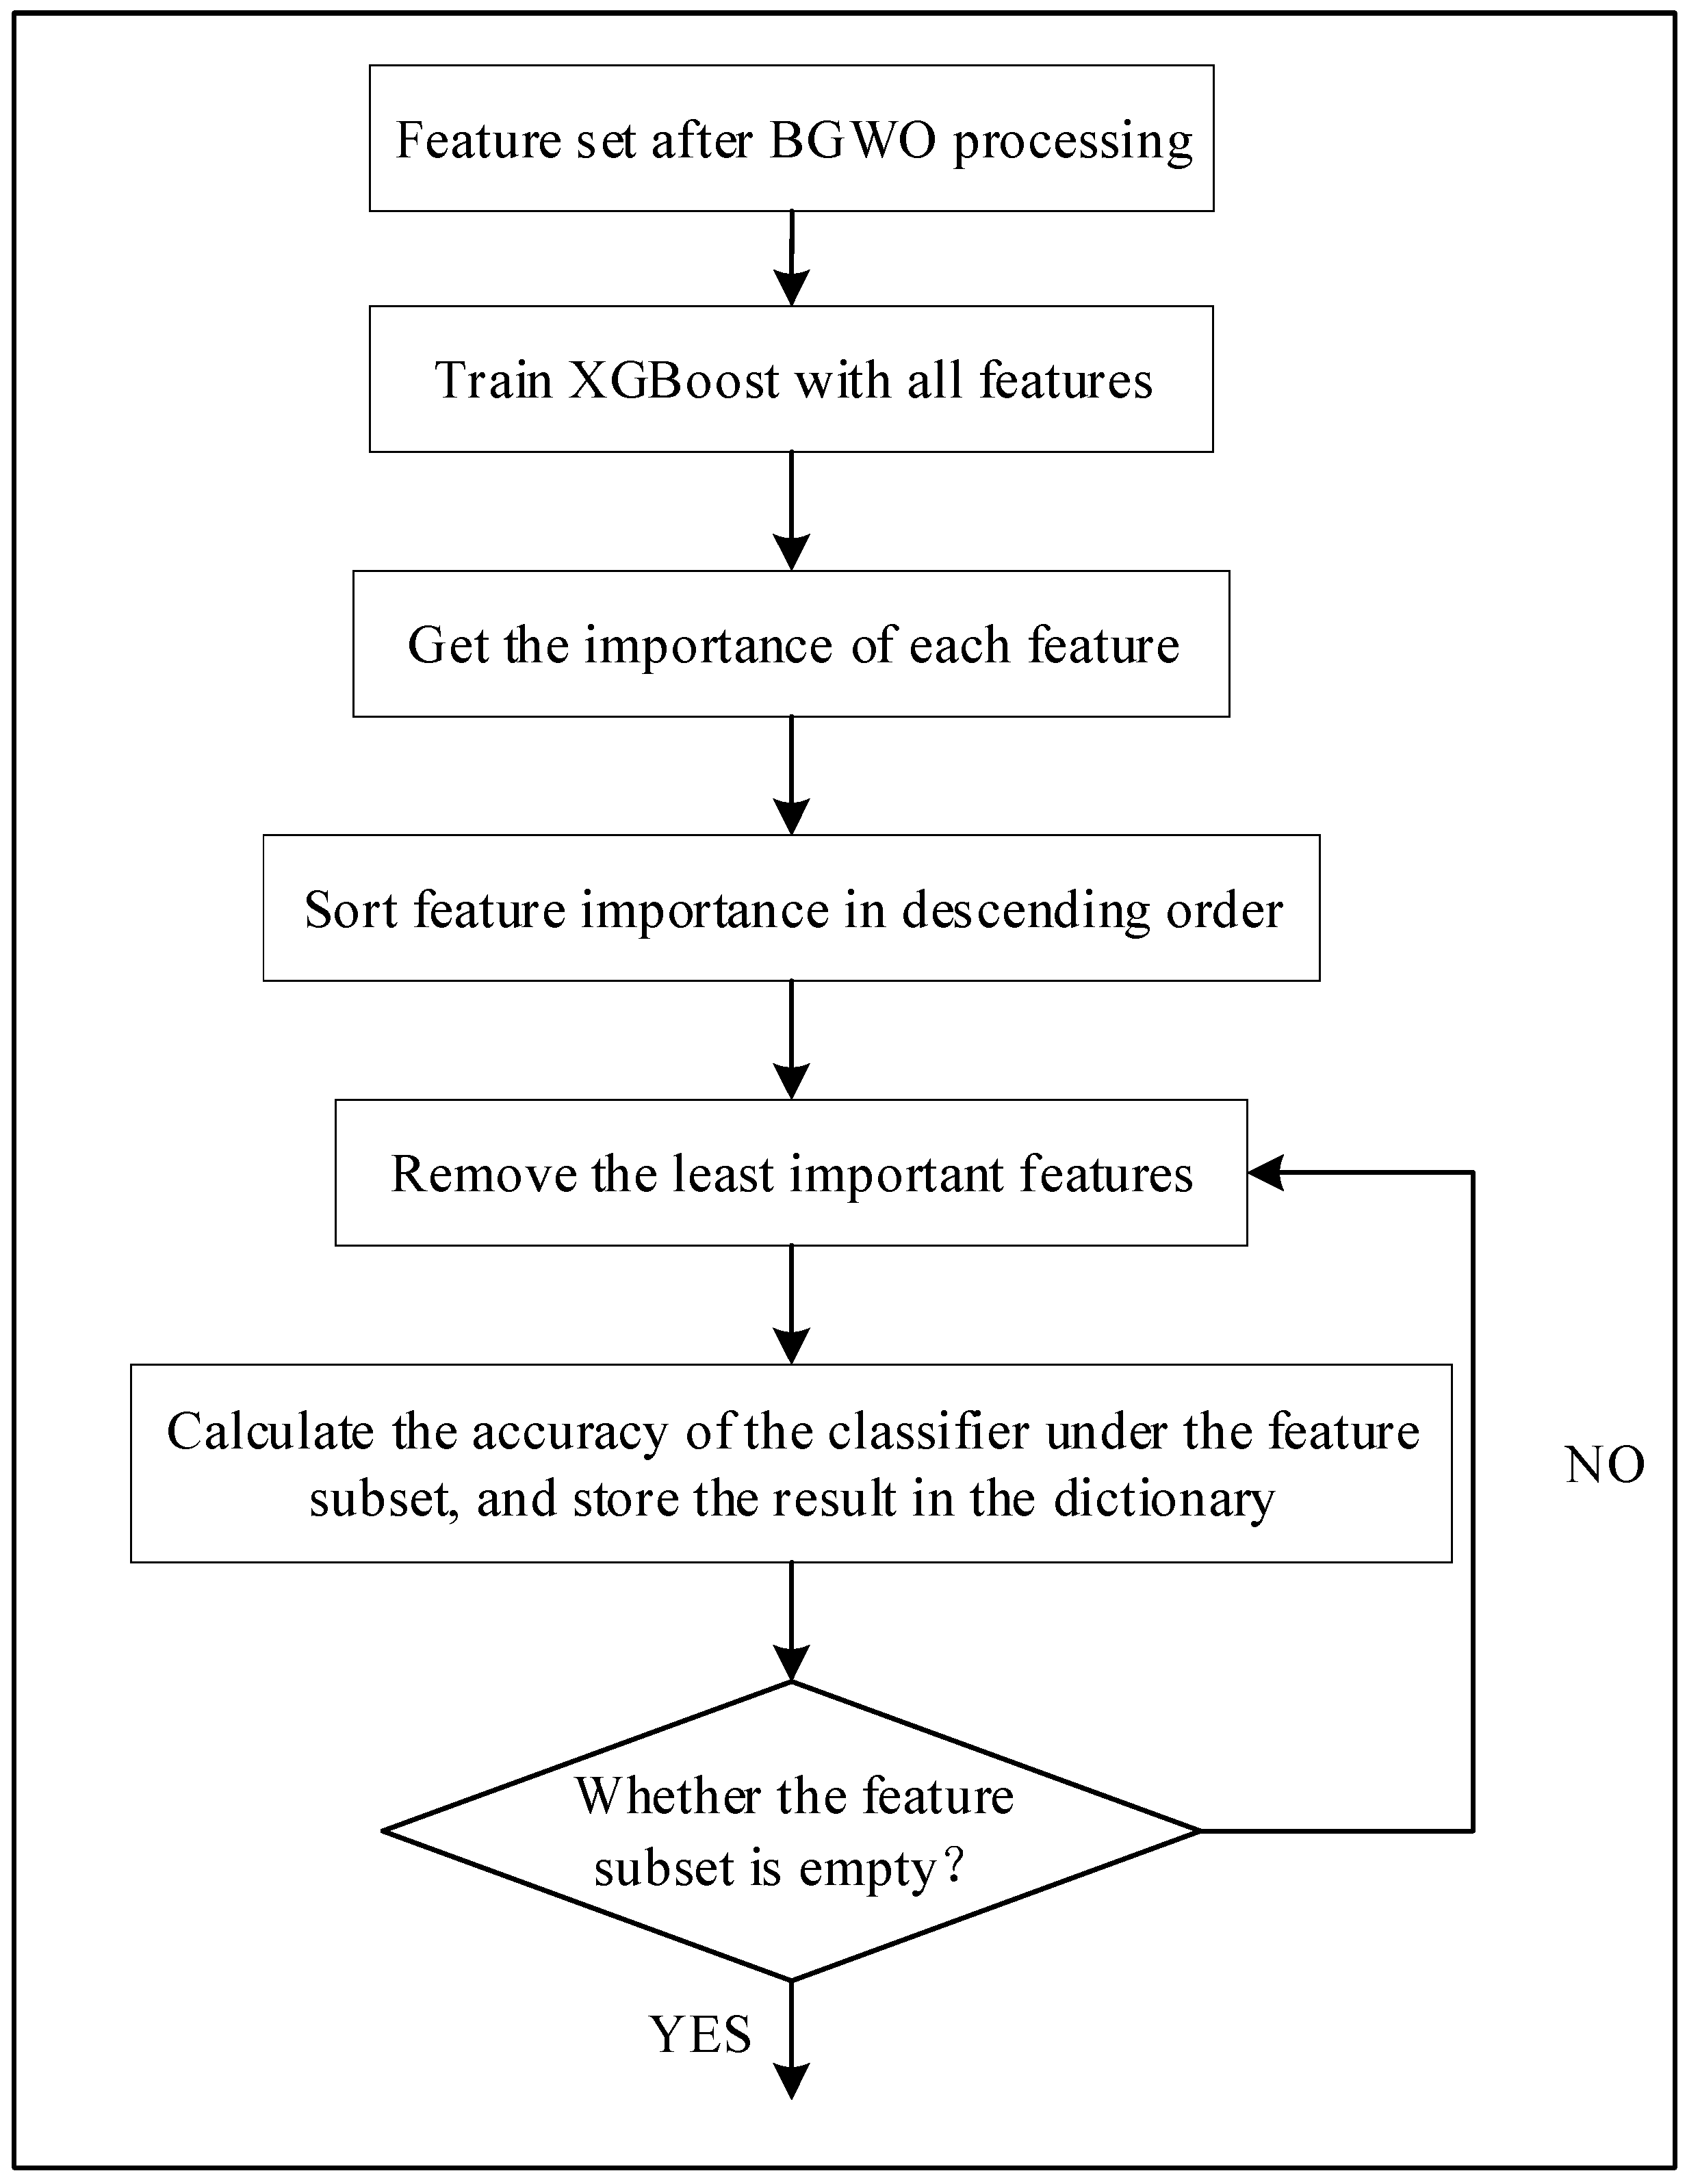
In network traffic data, redundant and irrelevant information is often present, which can adversely affect classifier predictions in terms of efficiency and accuracy. To tackle this issue, Recursive feature elimination (RFE) is utilized as a wrapper feature selection method. The RFE process involves iteratively removing the least important features, gradually reducing the number of feature subsets while maintaining classifier accuracy. Figure 3 illustrates the XGBoost-RFE method. Initially, the full feature set is inputted into the XGBoost classifier, and the accuracy rate of the classifier under this feature set is computed. The importance of each feature is then calculated and ranked in descending order. In the subsequent step, the feature with the lowest importance in the ranking is eliminated, resulting in a new feature subset. This new subset is fed into the XGBoost classifier to evaluate the accuracy. The current feature subset and classifier accuracy are recorded. The second step is repeated until the feature subset becomes empty, with features being removed one by one. Finally, based on the saved classifier accuracy results, the feature subset with the highest accuracy is identified and considered as the optimal subset.

3.1.4. Two-Stage Feature Selection

After implementing the aforementioned feature selection techniques, the final optimal feature subset is obtained. This two-stage approach effectively eliminates irrelevant and redundant features, reduces feature dimensionality, and retains meaningful features, thereby enhancing both the accuracy and efficiency of the model. The two-stage feature selection method combines two different techniques to identify a superior feature subset, enhancing the performance and efficiency of the model. In the first stage, the BGWO algorithm is utilized, which simulates the hunting behavior of grey wolf groups to search for the optimal feature subset. BGWO is known for its ease of implementation, fast convergence, and strong optimization capabilities. It selects an initial optimal feature subset by dynamically adjusting the position of grey wolves based on their fitness evaluation and proximity to other wolves.
The generated feature subset in the first stage is then passed to the second stage, where the RFE-XGBoost algorithm is employed. RFE-XGBoost is a recursive feature elimination algorithm that utilizes the XGBoost algorithm to assess and rank features. It first trains an XGBoost model on the original feature set and then sequentially removes features with lower importance scores. This process continues until a predetermined number of features is obtained or the performance of the feature set reaches its maximum potential. By integrating the two-stage feature selection approach, irrelevant and redundant features can be effectively eliminated, reducing the dimensionality of the feature space while retaining informative features. This results in improved accuracy and efficiency for the model.

3.2. Extreme Gradient Boosting (XGBoost)

XGBoost [27] is an integrated learning algorithm known for its high efficiency and flexibility, making it widely used in various fields. XGBoost combines a group of weak learners to create a powerful model through continuous iterative optimization. The XGBoost model is trained in an additive manner, with the t-th objective function defined as follows:
O b j ( t ) = i = 1 n   l ( y i , y ^ i t 1 + f t ( x i ) ) + Ω ( f t ) + C O N S T A N T
Ω ( f t ) = γ T t + λ 1 2 j = 1 T   w j 2
Among these, Ω represents the complexity penalty of the model, and CONSTANT is a constant value.
Formula (19) expands through Taylor’s formula, resulting in Formula (21).
O b j ( t ) = i = 1 n [ l ( y i , y ^ i t 1 ) + m i f t ( x i ) + 1 2 n i f t 2 ( x i ) ] + Ω ( f t ) + C O N S T A N T
The second derivative of the Taylor formula can be approximated as follows:
f ( x 0 + Δ x ) f ( x 0 ) + f ( x 0 ) Δ x + 1 2 f ( x 0 ) ( Δ x ) 2
Here, m i and n i correspond to f ( x 0 )   and f ( x 0 ) , respectively, in the second derivative of Taylor’s formula, representing the first and second derivatives.
m i = y ^ i t 1 l ( y i , y ^ i t 1 )
n i = y ^ i t 1 2 l ( y i , y ^ i t 1 )
By substituting Equations (20), (23), and (24) into Equation (21), we can calculate the derivative. The solution is obtained from Equations (25) and (26).
w j * = m i n i + λ
O b j * = 1 2 j = 1 T   ( m i ) 2 n i + λ + γ T
O b j * can be expressed as a scoring function, used to measure the quality of the tree structure. The term w j * refers to the solution for the weights.

3.3. Synthetic Minority Oversampling Technique (SMOTE)

In network traffic datasets, one common issue is the imbalanced distribution of data. This means that there are significantly more normal samples compared to attack samples. Unfortunately, this data imbalance can have a negative impact on the prediction results of the model. One technique used to address this issue is random oversampling, which involves duplicating samples from the minority class at random. However, this approach may lead to overfitting. To overcome this limitation, the synthetic minority oversampling technique (SMOTE) is widely used. SMOTE leverages the K-nearest neighbors (KNN) method to synthesize new and more representative samples in the minority class [28]. By applying SMOTE sampling, the model can effectively learn the features of the minority class and improve its detection rate for minority categories. The steps involved in generating new samples using SMOTE are as follows:
  • Calculate the desired number of new samples that need to be generated.
  • Determine the K nearest neighbors for each sample in the minority class.
  • Randomly select N samples from the K nearest neighbors and perform random linear interpolation to create a new sample in the minority class.

3.4. Bayesian Optimization-Tree Parzen Estimator (BO-TPE)

Hyperparameter tuning can be categorized into four main types: traditional manual tuning, grid search, random search, and Bayesian search [29]. Manual tuning relies heavily on experience and can be time-consuming. Grid search and random search do not effectively utilize the correlation between different hyperparameter combinations. On the other hand, Bayesian optimization is an adaptive method for hyperparameter search that predicts the next combination of hyperparameters likely to yield the greatest benefit based on the previously tested combinations. In this study, we utilize the Bayesian optimization-tree Parzen estimator (BO-TPE) technique [30] to tune the hyperparameters of the model. BO-TPE offers excellent global search capability and is resistant to becoming trapped in local optima. During the initial iteration, random search is employed, and samples are drawn from the response surface to establish the initial distribution { θ i , y i } ( i = 1,2 , , N i n i t ) , where θ and y represent the set of hyperparameters and their corresponding values on the response surface, respectively.
BO-TPE employs two density functions, P r o g ( θ ) and P r o b ( θ ) , as the generative model of variables [29]. These functions are used to differentiate good samples from bad samples based on a predefined threshold y’, as shown below:
p ( θ y ) = { P r o g ( θ ) i f   y < y P r o b ( θ ) i f   y y
Next, the expected improvement (EI) is calculated for each step.
E I ( θ ) = P r o g ( θ ) P r o b ( θ )
Finally, the optimal hyperparameter value is selected by maximizing the EI.
When optimizing the hyperparameters of the XGBoost model using BO-TPE, the key hyperparameters to consider are n_estimators, max_depth, and learning_rate. The hyperparameter n_estimators signifies the number of weak learners to be integrated, max_depth determines the maximum depth of the tree, and learning_rate represents the step size for each iteration.

4. Experiments and Results

4.1. Hardware and Environment Setting

Our experiments were conducted on a Windows Server 2019 operating system desktop, utilizing hardware specifications including 128GB of RAM, an Intel(R) Xeon(R) Silver 4214 processor, and an RTX 3090 graphics card. Python 3.7 was the programming language employed, with Scikit-Learn, NumPy, pandas, and Matplotlib providing data processing and visualization functionalities for our experiments. Further details of the experimental parameter configuration can be found in Table 1.

4.2. Evaluation Metrics

The evaluation metrics used to assess the performance of the proposed model in this paper include accuracy, recall, precision, and F1 score. These metrics are calculated based on true positives (TP), true negatives (TN), false positives (FP), and false negatives (FN).
Accuracy = T P + T N T P + T N + F P + F N
Precision = T P T P + F P
Recall = T P T P + F N
F 1 s c o r e = 2 * precision * recall precision + recall
The specific definitions of TP, FP, FN, and TN in the field of intrusion detection are as follows: TP refers to the classification of an actual attack category as an attack category. FP refers to the classification of an actual normal category as an attack category. FN refers to the classification of an actual attack category as a normal category. TN refers to the classification of an actual normal category as a normal category.

4.3. Data Preprocessing

After acquiring the data, preprocessing becomes essential. This stage primarily involves data cleaning, oversampling, feature selection, data normalization, and dataset partitioning, among others.

4.3.1. Data Cleaning

In the data set, we remove any duplicate values and replace empty values with zeros.

4.3.2. Oversampling

To address the issue of imbalanced data distribution and mitigate its impact on the experimental results, we employ the SMOTE method to oversample the samples belonging to the minority class.

4.3.3. Normalization

Following the conversion of all features into numerical types, the dataset undergoes normalization. In this paper, the min-max regularization method is employed to normalize the dataset, scaling the data within the range of [0, 1]. This normalization process enhances the convergence speed and training effectiveness of the model.
x = x x m i n x m a x x m i n

4.3.4. Train and Test Split

Finally, we split the transformed image set into an 80% training set and a 20% test set.

4.4. Dataset

We perform experiments on five datasets: N-BaIot [31] BoT-Iot [32], WUSTL-IIOT-2021 [33], WUSTL-EHMS-2020 [34], and NSL-KDD [35].

4.4.1. N-BaIoT

The N-BaIoT dataset, created by [31], is the latest dataset on IoT zombie network attack data and is freely available for research purposes in the field of network security. These data originate from nine commercial Internet of Things (IoT) devices that have been infected by real zombie networks. In the laboratory, two IoT zombie networks, namely BASHLITE and Mirai, were deployed to collect traffic data before and after infection. The dataset consists of 115 feature attributes, encompassing both normal traffic and 10 types of attack traffic. BASHLITE attacks include scanning the network for vulnerable devices (Scan), sending spam data (Junk), UDP flooding (UDP), TCP flooding (TCP), and sending spam data and opening a connection to a specified IP address and port (COMBO). The Mirai attacks include automatic scanning for vulnerable devices (Scan), Ack flooding (Ack), Syn flooding (Syn), UDP flooding (UDP), and optimized for higher packets per second (UDPplain). In this study, we selected the zombie network attack traffic data from the fifth device for experimentation. In our study, we focus on the botnet attack traffic data from the fifth device to conduct our experiments. However, due to imbalances within the dataset, we resample the data for each attack type and remove any duplicate values. The specific attack types and their corresponding distributions can be found in Table 2.

4.4.2. BoT-Iot

The BoT-IoT dataset, proposed by the Cyber Range Lab of UNSW Canberra, includes both normal traffic and zombie network traffic [32]. The BoT-IoT dataset consists of various attacks such as DDoS, DoS, OS and Service Scan, Keylogging, and Data exfiltration attacks. It encompasses 46 attribute features with a total of 3,668,522 data entries. The attack types and their specific distribution are illustrated in Table 3.

4.4.3. WUSTL-IIOT-2021

The WUSTL-IIOT-2021 dataset, developed through the IIoT testing platform, [33] consists of network data related to Industrial Internet of Things (IIoT) for research purposes. The dataset includes various types of traffic, namely normal traffic, command injection traffic, DoS traffic, reconnaissance traffic, and backdoor traffic. The attack types and their specific distribution can be found in Table 4.

4.4.4. WUSTL-EHMS-2020

The WUSTL-EHMS-2020 dataset is a dataset created by [34] using the Enhanced Healthcare Monitoring System (EHMS). It encompasses both normal traffic and attack traffic scenarios. The dataset includes various attack types, each with its own specific distribution. Table 5 provides detailed information about the attack types present in the WUSTL-EHMS-2020 dataset and their corresponding distribution.

4.4.5. NSL-KDD

The NSL-KDD dataset is an enhanced version of the KDDCup99 dataset, with duplicate data removed [35]. It was created to address some of the limitations of the KDDCup99 dataset. The NSL-KDD dataset consists of four major attack types, namely denial of service (DoS), probing attacks (Probe), remote to local (R2L), and user to root (U2R). Table 6 provides detailed information on the attack types present in the NSL-KDD dataset, including their specific distribution.

4.5. Experimental Results

4.5.1. Binary Classification

Table 7 and Table 8 present the experimental results of a proposed method for binary classification on two datasets: N-BaIoT and NSL-KDD. To assess the effectiveness of the proposed method, a comparison was made with other state-of-the-art models. However, since different papers utilize distinct experimental settings, we compared our method with the latest three state-of-the-art approaches: CNN-BiLSTM [36], CANET [37], and FNN-Focal [38]. Looking at Table 7, on the N-BaIoT dataset, XGBoost achieved a higher accuracy rate and F1 score of 0.999970 compared to the other three methods. As for the NSL-KDD dataset, the CANET method exhibited an accuracy of 0.9979 and a recall of 0.9990, surpassing CNN-BiLSTM and FNN-Focal but still falling short of XGBoost’s performance. In general, our proposed method outperformed the other three methods across all performance indicators on both datasets. Furthermore, Figure 4a,b illustrate the confusion matrices for N-BaIoT and NSL-KDD binary classification, respectively.

4.5.2. Multiclass Classification

Table 9, Table 10, Table 11, Table 12 and Table 13 display the experimental results of the proposed method for multi-classification on five datasets: N-BaIoT, BoT-IoT, WUSTL-IIOT-2021, WUSTL-EHMS-2020, and NSL-KDD. In order to validate the superiority of our proposed method, we compared it with the latest state-of-the-art methods: CNN-BiLSTM [36], CANET [37], FNN-Focal [38], and CNN-Focal [38].
Considering Table 9, on the N-BaIoT dataset, CNN-BiLSTM, CANET, and FNN-Focal achieved accuracy rates of around 0.90, while XGBoost achieved a significantly higher accuracy rate of 0.999941, surpassing the performance of the other three methods. According to Table 12, on the WUSTL-EHMS-2020 dataset, FNN-Focal achieved the highest accuracy rate among the three methods with a rate of 0.9326, which is lower than XGBoost’s accuracy rate of 0.988970. Examining Table 13, on the NSL-KDD dataset, CANET attained an accuracy of 0.9977 and a recall of 0.9972, CNN-BiLSTM achieved an accuracy of 0.9922 and a recall of 0.9888, FNN-Focal achieved an accuracy and recall of 0.996566, and our model obtained an accuracy and recall of 0.999427, clearly exhibiting the highest performance in terms of accuracy and recall.
Importantly, as depicted in Table 10 and Table 11, our proposed method achieved perfect accuracy, precision, recall, and an F1 score of 1.0 on the BoT-IoT and WUSTL-IIOT-2021 datasets.
To gain better insights into the model’s performance, the confusion matrices for multi-classification on the N-BaIoT, BoT-IoT, WUSTL-IIOT-2021, WUSTL-EHMS-2020, and NSL-KDD datasets are shown in Figure 5, Figure 6, Figure 7, Figure 8 and Figure 9, respectively. Overall, the proposed method outperformed other state-of-the-art methods across all indicators on the five datasets, demonstrating its effectiveness.
Our proposed method incorporates a two-stage feature selection process to select important features, utilizes SMOTE for oversampling the minority class, employs the XGBoost model for efficient detection, and applies hyperparameter optimization to further enhance the model’s performance.

4.5.3. Ablation Studies

In order to validate the effectiveness of the proposed method, we focused on conducting a detailed experimental analysis and investigation on the N-BaIoT dataset. We performed two experiments, the first one aimed to verify the performance improvement brought by optimizing hyperparameters, and the second one aimed to validate the benefits of feature selection.
For the optimization of hyperparameters, we used BO-TPE to optimize three hyperparameters of XGBoost, with the specific values shown in Table 14. We compared the model performance before and after hyperparameter optimization, as shown in Table 15. From Table 15, it can be seen that after hyperparameter optimization, the model demonstrated improvements in all four metrics, with an increase of 0.002791 in accuracy. This validates that the model’s performance can be enhanced to a certain extent through hyperparameter optimization.
The N-BaIoT dataset consists of 115 feature attributes and one label attribute. After applying the proposed two-stage feature selection method, the most important 25 feature attributes were selected. We compared the performance and runtime of the model before and after feature selection using the XGBoost model with hyperparameter optimization. From Table 16, it can be observed that after feature selection, the model’s runtime decreased by 9.2 s while maintaining the same level of performance. This validates the effectiveness of the proposed method. The advantages of BGWO include global search capability, adaptive adjustment of the fitness function, and the ability to avoid getting trapped in local optima. The advantages of RFE-XGBoost lie in ranking and selecting features based on their individual importance and contribution, which enables the acquisition of a more stable and robust feature subset while reducing feature dimensionality. The combination of these two methods allows for a good balance between accuracy and runtime.
In addition, the WUSTL-EHMS-2020 dataset consists of only two types of data: Normal and Attack. Therefore, we analyzed the F1 scores for both types of data in the WUSTL-EHMS-2020 dataset, as shown in Table 17 and Table 18.
From Table 17 and Table 18, it can be seen that the XGBoost model performs well for the “Normal” type data in the WUSTL-EHMS-2020 dataset, with an F1 score of 0.963933. After conducting hyperparameter optimization (XGBoost HPO), the F1 score improved to 0.992288. Furthermore, through feature selection and hyperparameter optimization (XGBoost HPO feature selection), the F1 score increased to 0.993675. However, for the “Attack” type data, the detection rate of the XGBoost model is significantly lower, with an F1 score of 0.673846. Although the F1 score improved to 0.946472 after hyperparameter optimization (XGBoost HPO), and further increased to 0.956937 after feature selection and hyperparameter optimization (XGBoost HPO feature selection), it still cannot match the performance of the “Normal” type data, possibly due to the small number of samples.

5. Conclusions

With the rapid development of the Internet of Things (IoT), the need to protect IoT network security has become increasingly urgent. In this paper, we propose an effective intrusion detection system to safeguard the security of IoT networks. The proposed intrusion detection system is based on the XGBoost classifier and utilizes the BGWO and RFE-XGBoost two-stage feature selection methods to identify the most important feature subsets. The class imbalance problem is addressed using the SMOTE method. The hyperparameters of the XGBoost classifier are optimized using the BO-TPE method. In our research, we conducted experiments on five commonly used public datasets in the field of IoT, involving binary and multi-class classification. The results demonstrate that our proposed method outperformed state-of-the-art methods in terms of accuracy, recall, precision, and F1 score on all five datasets, validating the effectiveness of our approach. While the proposed two-stage feature selection method is highly effective, extending this method to larger datasets presents challenges in terms of computational complexity, memory requirements, efficiency, generalization ability, and robustness. In the future, further research and solutions can be explored to address these issues and enhance the performance of feature selection algorithms.

Author Contributions

Author Contributions: Conceptualization, B.X. and L.S.; methodology, X.M. and B.X.; validation, B.X. and R.D.; formal analysis, B.X. and C.L.; investigation, B.X. and C.L.; resources, B.X. and L.S.; writing—original draft preparation, B.X. and C.L.; writing—review and editing, B.X. and X.M.;visualization, R.D. and X.M.; supervision, B.X. and C.L. All authors have read and agreed to thepublished version of the manuscript.

Funding

The authors received no specific funding for this study.

Data Availability Statement

Data will be made available on request.

Conflicts of Interest

The authors declare that they have no conflict of interest to report regarding the present study.

References

  1. Fraihat, S.; Makhadmeh, S.; Awad, M.; Al-Betar, M.A.; Al-Redhaei, A. Intrusion detection system for large-scale IoT NetFlow networks using machine learning with modified Arithmetic Optimization Algorithm. Internet Things 2023, 22, 100819. [Google Scholar] [CrossRef]
  2. The Growth in Connected IoT Devices Is Expected to Generate 79.4zb of Data in 2025, according to a New IDC Forecast. 2019. Available online: https://www.businesswire.com/news/home/20190618005012/en/The-Growth-in-Connected-IoT-Devices-is-Expected-to-Generate-79.4ZB-of-Data-in-2025-According-to-a-New-IDC-Forecast (accessed on 1 January 2020).
  3. Pinto, A. Ot/iot Security Report: Rising Iot Botnets and Shifting Ransomware Escalate Enterprise Risk. 2020. Available online: https://www.nozominetworks.com/blog/whatit-needs-to-know-about-ot-io-securitythreats-in-2020/ (accessed on 1 January 2020).
  4. Santhosh Kumar, S.V.N.; Selvi, M.; Kannan, A. A comprehensive survey on machine learning-based intrusion detection systems for secure communication in internet of things. Comput. Intell. Neurosci. 2023, 2023, 8981988. [Google Scholar] [CrossRef]
  5. Kponyo, J.J.; Agyemang, J.O.; Klogo, G.S.; Boateng, J.O. Lightweight and host-based denial of service (DoS) detection and defense mechanism for resource-constrained IoT devices. Internet Things 2020, 12, 100319. [Google Scholar] [CrossRef]
  6. Awajan, A. A novel deep learning-based intrusion detection system for IOT networks. Computers 2023, 12, 34. [Google Scholar] [CrossRef]
  7. Si-Ahmed, A.; Al-Garadi, M.A.; Boustia, N. Survey of Machine Learning based intrusion detection methods for Internet of Medical Things. Appl. Soft Comput. 2023, 140, 110227. [Google Scholar] [CrossRef]
  8. Elaziz, M.A.; Al-qaness, M.A.A.; Dahou, A.; Ibrahim, R.A.; El-Latif, A.A.A. Intrusion detection approach for cloud and IoT environments using deep learning and Capuchin Search Algorithm. Adv. Eng. Softw. 2023, 176, 103402. [Google Scholar] [CrossRef]
  9. Halim, Z.; Yousaf, M.N.; Waqas, M.; Sulaiman, M.; Abbas, G.; Hussain, M.; Ahmad, I.; Hanif, M. An effective genetic algorithm-based feature selection method for intrusion detection systems. Comput. Secur. 2021, 110, 102448. [Google Scholar] [CrossRef]
  10. Dubey, G.P.; Bhujade, R.K. Optimal feature selection for machine learning based intrusion detection system by exploiting attribute dependence. Mater. Today Proc. 2021, 47, 6325–6331. [Google Scholar] [CrossRef]
  11. Li, X.; Ren, J. MICQ-IPSO: An effective two-stage hybrid feature selection algorithm for high-dimensional data. Neurocomputing 2022, 501, 328–342. [Google Scholar] [CrossRef]
  12. Unler, A.; Murat, A. A discrete particle swarm optimization method for feature selection in binary classification problems. Eur. J. Oper. Res. 2010, 206, 528–539. [Google Scholar] [CrossRef]
  13. Mafarja, M.; Mirjalili, S. Whale optimization approaches for wrapper feature selection. Appl. Soft Comput. 2018, 62, 441–453. [Google Scholar] [CrossRef]
  14. Zhou, Y.Y.; Cheng, G.; Jiang, S.Q.; Dai, M. Building an efficient intrusion detection system based on feature selection and ensemble classifier. Comput. Netw. 2020, 174, 107247. [Google Scholar] [CrossRef]
  15. Hassan, I.H.; Abdullahi, M.; Aliyu, M.M.; Yusuf, S.A.; Abdulrahim, A. An improved binary manta ray foraging optimization algorithm based feature selection and random forest classifier for network intrusion detection. Intell. Syst. Appl. 2022, 16, 200114. [Google Scholar] [CrossRef]
  16. Hsu, H.H.; Hsieh, C.W.; Lu, M.D. Hybrid feature selection by combining filters and wrappers. Expert Syst. Appl. 2011, 38, 8144–8150. [Google Scholar] [CrossRef]
  17. Lazzarini, R.; Tianfield, H.; Charissis, V. A stacking ensemble of deep learning models for IoT intrusion detection. Knowl.-Based Syst. 2023, 279, 110941. [Google Scholar] [CrossRef]
  18. Alani, M.M. An explainable efficient flow-based Industrial IoT intrusion detection system. Comput. Electr. Eng. 2023, 108, 108732. [Google Scholar] [CrossRef]
  19. Nizamudeen, S.M.T. Intelligent Intrusion Detection Framework for Multi-Clouds–Iot Environment Using Swarm-Based Deep Learning Classifier. J. Cloud Comput. 2023, 12, 134. [Google Scholar] [CrossRef]
  20. Sharma, B.; Sharma, L.; Lal, C.; Roy, S. Anomaly based network intrusion detection for IoT attacks using deep learning technique. Comput. Electr. Eng. 2023, 107, 108626. [Google Scholar] [CrossRef]
  21. Kareem, S.S.; Mostafa, R.R.; Hashim, F.A.; El-Bakry, H.M. An effective feature selection model using hybrid metaheuristic algorithms for iot intrusion detection. Sensors 2022, 22, 1396. [Google Scholar] [CrossRef]
  22. Mohy-eddine, M.; Guezzaz, A.; Benkirane, S.; Azrour, M. An efficient network intrusion detection model for IoT security using K-NN classifier and feature selection. Multimed. Tools Appl. 2023, 82, 23615–23633. [Google Scholar] [CrossRef]
  23. Liu, X.; Du, Y. Towards Effective Feature Selection for IoT Botnet Attack Detection Using a Genetic Algorithm. Electronics 2023, 12, 1260. [Google Scholar] [CrossRef]
  24. Alweshah, M.; Hammouri, A.; Alkhalaileh, S.; Alzubi, O. Intrusion detection for the internet of things (IoT) based on the emperor penguin colony optimization algorithm. J. Ambient Intell. Humaniz. Comput. 2023, 14, 6349–6366. [Google Scholar] [CrossRef]
  25. Othman, S.M.; Ba-Alwi, F.M.; Alsohybe, N.T.; Al-Hashida, A.Y. Intrusion detection model using machine learning algorithm on Big Data environment. J. Big Data 2018, 5, 34. [Google Scholar] [CrossRef]
  26. Mirjalili, S.; Mirjalili, S.M.; Lewis, A. Grey wolf optimizer. Adv. Eng. Softw. 2014, 69, 46–61. [Google Scholar] [CrossRef]
  27. Chen, T.; Guestrin, C. Xgboost: A scalable tree boosting system. In Proceedings of the 22nd ACM SIGKDD International Conference on Knowledge Discovery and Data Mining, New York, NY, USA, 13–17 August 2016; pp. 785–794. [Google Scholar]
  28. Chawla, N.V.; Bowyer, K.W.; Hall, L.O.; Kegelmeyer, W.P. SMOTE: Synthetic minority over-sampling technique. J. Artif. Intell. Res. 2002, 16, 321–357. [Google Scholar] [CrossRef]
  29. Yang, L.; Shami, A. On hyperparameter optimization of machine learning algorithms: Theory and practice. Neurocomputing 2020, 415, 295–316. [Google Scholar] [CrossRef]
  30. Bergstra, J.; Bardenet, R.; Bengio, Y.; Kegl, B. Algorithms for hyper-parameter optimization. In Proceedings of the 24th International Conference on Neural Information Processing Systems, Granada, Spain, 12–15 December 2011; pp. 2546–2554. [Google Scholar]
  31. Meidan, Y.; Bohadna, M.; Mathov, Y.; Mirsky, Y.; Shabtai, A.; Elovici, Y. N-BaIoT—Network-based detection of IoT botnet attacks using deep autoencoders. IEEE Pervasive Comput. 2018, 17, 12–22. [Google Scholar] [CrossRef]
  32. Koroniotis, N.; Moustafa, N.; Sitnikova, E.; Turnbull, B. Towards the development of realistic botnet dataset in the internet of things for network forensic analytics: Bot-iot dataset. Future Gener. Comput. Syst. 2019, 100, 779–796. [Google Scholar] [CrossRef]
  33. Zolanvari, M.; Teixeira, M.A.; Gupta, L.; Khan, K.M.; Jain, R. Machine learning-based network vulnerability analysis of industrial Internet of Things. IEEE Internet Things J. 2019, 6, 6822–6834. [Google Scholar] [CrossRef]
  34. Hady, A.A.; Ghubaish, A.; Salman, T.; Unal, D.; Jain, R. Intrusion detection system for healthcare systems using medical and network data: A comparison study. IEEE Access 2020, 8, 106576–106584. [Google Scholar] [CrossRef]
  35. Tavallaee, M.; Bagheri, E.; Lu, W.; Ghorbani, A.A. A detailed analysis of the KDD CUP 99 data set. In Proceedings of the 2009 IEEE Symposium on Computational Intelligence for Security and Defense Applications (CISDA), Ottawa, ON, Canada, 8–10 July 2009. [Google Scholar]
  36. Sinha, J.; Manollas, M. Efficient deep CNN-BiLSTM model for network intrusion detection. In Proceedings of the 2020 3rd International Conference on Artificial Intelligence and Pattern Recognition, Chengdu, China, 28–30 August 2020; pp. 223–231. [Google Scholar]
  37. Ren, K.Y.; Yuan, S.; Zhang, C.; Shi, Y.; Huang, Z.Q. CANET: A hierarchical CNN-Attention model for Network Intrusion Detection. Comput. Commun. 2023, 205, 170–181. [Google Scholar] [CrossRef]
  38. Dina, A.S.; Siddique, A.B.; Manivannan, D. A deep learning approach for intrusion detection in Internet of Things using focal loss function. Internet of Things 2023, 22, 100699. [Google Scholar] [CrossRef]
  39. Nimbalkar, P.; Kshirsagar, D. Feature selection for intrusion detection system in Internet-of-Things (IoT). ICT Express 2021, 7, 177–181. [Google Scholar] [CrossRef]
  40. Gaber, T.; Awotunde, J.B.; Folorunso, S.O.; Ajagbe, S.A.; Eldesouky, E. Industrial internet of things intrusion detection method using machine learning and optimization techniques. Wirel. Commun. Mob. Comput. 2023, 2023, 3939895. [Google Scholar] [CrossRef]
Figure 1. Architectures implemented in this research.
Electronics 12 04289 g001
Figure 2. Social class.
Electronics 12 04289 g002
Figure 3. Recursive feature elimination process workflow.
Electronics 12 04289 g003
Figure 4. Confusion matrix for binary classification of N-BaIoT and NSL-KDD datasets.
Electronics 12 04289 g004
Figure 5. Confusion matrix for N-BaIoT multi-classification.
Electronics 12 04289 g005
Figure 6. Confusion matrix for BoT-Iot multi-classification.
Electronics 12 04289 g006
Figure 7. Confusion matrix for WUSTL-IIOT-2021 multi-classification.
Electronics 12 04289 g007
Figure 8. Confusion matrix for WUSTL-EHMS-2020 multi-classification.
Electronics 12 04289 g008
Figure 9. Confusion matrix for NSL-KDD multi-classification.
Electronics 12 04289 g009
Table 1. Experimental environment.
EnvironmentValue
Operating SystemWindows Server 2019
ProcessorIntel(R) Xeon(R) Silver 4214
GPURTX 3090
RAM128 GB
Programing LanguagePython 3.7
Table 2. Distribution of N-BaIot dataset.
ClassSamplesResampling RatioSampled Data
mirai_udp156,2480.1015,625
gafgyt_tcp104,5100.1515,485
gafgyt_udp104,0110.1515,461
mirai_scan96,7810.1514,517
mirai_syn65,7460.2516,436
benign62,1540.2514,894
gafgyt_combo61,3800.2515,345
mirai_ack60,5540.2515,138
mirai_udpplain 56,6180.2715,304
gafgyt_junk30,8980.5015,449
gafgyt_scan 29,2970.5014,648
Table 3. Distribution of BoT-Iot dataset.
ClassSamplesDistribution (%)
DDoS1,926,62452.52
DoS1,650,26044.98
Reconnaissance91,0822.483
Normal4770.013
Theft790.002
Total3,668,522100
Table 4. Distribution of WUSTL-IIOT-2021 dataset.
ClassSamplesDistribution (%)
Normal1,106,74792.71
DoS78,3046.559
Reconn82400.690
CommInj2580.018
Backdoor2120.018
Total1,193,761100
Table 5. Distribution of WUSTL-EHMS-2020 dataset.
ClassSamplesDistribution (%)
Normal14,27287.46
Attack204612.54
Total16,318100
Table 6. Distribution of NSL-KDD dataset.
ClassSamplesDistribution (%)
Normal77,05451.88
DoS53,38535.95
Probe14,0779.478
U2R37492.524
R2L2520.170
Total148,517100
Table 7. Performance of the evaluated methods on N-BaIoT (binary classification).
ModelAccuracyPrecisionRecallF1 Score
CNN-BiLSTM0.9997260.9997260.9997260.999726
CANET0.9997260.9997260.9997260.999726
FNN-Focal0.9996910.9996910.9996910.999690
Our Model0.9999700.9999700.9999700.999970
Table 8. Performance of the evaluated methods on NSL-KDD (binary classification).
ModelAccuracyPrecisionRecallF1 Score
CNN-BiLSTM0.9940-0.9904-
CANET0.9979-0.9990-
FNN-Focal0.9978310.9978340.9978310.997831
Our Model0.9994270.9994270.9994270.999427
Table 9. Performance of the evaluated methods on N-BaIoT.
ModelAccuracyPrecisionRecallF1 Score
CNN-BiLSTM0.9073710.8798460.9073710.876788
CANET0.9073350.9073860.9073350.907335
FNN-Focal0.9074070.8959800.9074070.876837
Our Model0.9999410.9999410.9999410.999941
Table 10. Performance of the evaluated methods on BoT-Iot.
ModelAccuracyPrecisionRecallF1 Score
CNN-BiLSTM0.9999180.9998960.9999180.999899
CANET0.9999970.9999970.9999970.999997
CNN-Focal0.86770.61650.63250.5853
FNN-Focal0.91550.55590.63800.5784
RFS-1 [39]0.999993-0.995798-
Our Model1.01.01.01.0
Table 11. Performance of the evaluated methods on WUSTL-IIOT-2021.
ModelAccuracyPrecisionRecallF1 Score
CNN-BiLSTM0.9999440.9999440.9999440.999943
CANET0.9999560.9999560.9999560.999955
BA [40]0.99990.9960.9960.996
CNN-Focal0.98210.88540.66510.7050
FNN-Focal0.98950.77220.64060.6848
Our Model1.01.01.01.0
Table 12. Performance of the evaluated methods on WUSTL-EHMS-2020.
ModelAccuracyPrecisionRecallF1 Score
CNN-BiLSTM0.9286670.9298240.9286670.917534
CANET0.9284220.9293300.9284220.917309
CNN-Focal0.93080.94230.73380.6431
FNN-Focal0.93260.95240.73690.8011
Our Model0.9889700.9889230.9889700.988846
Table 13. Performance of the evaluated methods on NSL-KDD.
ModelAccuracyPrecisionRecallF1 Score
CNN-BiLSTM0.9922-0.9888-
CANET0.9977-0.9972-
FNN-Focal0.9965660.9966110.9965660.996576
Our Model0.9994270.9994260.9994270.999426
Table 14. Hyper-parameter configuration of XGBoost model.
Hyper-ParameterOptimal Value
n_estimators95
max_depth10
learning_rate0.55987
Table 15. Comparison of the performance of the model in N-BaIoT before and after using hyperparameter optimization.
ModelAccuracyPrecisionRecallF1 Score
XGBoost0.9971190.9971550.9971190.997118
XGBoost-HPO0.9999100.9999100.9999100.999910
Table 16. Comparison of the performance of the model in N-BaIoT using feature selection.
ModelAccuracyPrecisionRecallF1 ScoreTime
XGBoost-HPO0.9999100.9999100.9999100.99991023.2s
XGBoost-HPO-feature-selection0.9999410.9999410.9999410.99994114s
Table 17. The F1 score for the “Normal” type in the WUSTL-EHMS-2020 dataset.
ModelF1 Score
XGBoost0.963933
XGBoost-HPO0.992288
XGBoost-HPO-feature-selection0.993675
Table 18. The F1 score for the “Attack” type in the WUSTL-EHMS-2020 dataset.
ModelF1 Score
XGBoost0.673846
XGBoost-HPO0.946472
XGBoost-HPO-feature-selection0.956937
Disclaimer/Publisher’s Note: The statements, opinions and data contained in all publications are solely those of the individual author(s) and contributor(s) and not of MDPI and/or the editor(s). MDPI and/or the editor(s) disclaim responsibility for any injury to people or property resulting from any ideas, methods, instructions or products referred to in the content.

