Abstract
We aimed to determine whether the hemorrhage risks of cerebral arteriovenous malformation (AVM), evaluated through digital subtraction angiography (DSA) using a neural network, were superior to those assessed through angioarchitecture. We conducted a retrospective review of patients with cerebral AVM who underwent DSA from 2011 to 2017. Angioarchitecture parameters, age, and sex were analyzed using univariate and multivariate logistic regression. Additionally, a neural network was trained using a combination of convolutional neural network (CNN) and recurrent neural network (RNN) architectures. The training dataset consisted of 118 samples, while 29 samples were reserved for testing. After adjusting for age at diagnosis and sex, single venous drainage (odds ratio [OR] = 2.48, p = 0.017), exclusive deep venous drainage (OR = 3.19, p = 0.005), and venous sac (OR = 0.43, p = 0.044) were identified as independent risk factors for hemorrhage. The angioarchitecture-based hemorrhagic prediction model achieved 69% accuracy with an AUC (area under the ROC curve) of 0.757, while the CNN–RNN-based model achieved 76% accuracy with an AUC of 0.748. We present a diagnostic performance for hemorrhagic risk assessment of AVMs that is comparable to the angioarchitectural analysis. By leveraging larger datasets, there is significant potential to enhance prediction accuracy further. The CNN–RNN algorithm not only can potentially streamline workflow within the angio-suite but also serves as a complementary approach to optimize diagnostic accuracy and treatment strategies.
1. Introduction
The prevalence of cerebral arteriovenous malformations (AVM) is approximately 18 per 100,000 people [1]. AVMs contribute to 4–33% of primary intracerebral hemorrhage, with case fatality up to 20% at 30 days following hemorrhage [1,2]. The crude annual risk of initial hemorrhage occurrence is approximately 2%; however, within the first year, the risk of hemorrhage recurrence can escalate significantly, reaching as high as 18% [1,2]. Various treatment options are available for AVMs, such as medication, embolization, microsurgery, and stereotactic radiosurgery. The risk of hemorrhage associated with AVMs has been a focus of research, since the ARUBA (A randomized trial of unruptured brain arteriovenous malformations) study demonstrated that medical therapy alone is superior to any interventional therapy for unruptured AVMs [3]. However, concerns have arisen regarding the potential underestimation of hemorrhagic risk due to the insufficient follow-up interval in the ARUBA study, which is 33 months [3]. Therefore, it is crucial to carefully assess the risk of hemorrhages to achieve the goals of precision medicine.
The Spetzler–Martin grade, widely used worldwide, is employed to predict the prognosis of patients with AVM undergoing microsurgery. However, flaws were observed in this approach in terms of assessment of hemorrhagic risk. For example, some studies have reported a positive association between AVM size and hemorrhage risk, while others have found no significant association or even indicated that smaller size AVMs are more prone to rupture [4,5,6,7,8,9,10,11]. Previous research has explored risk factors for AVM-associated hemorrhage, including age, deep location, flow-associated aneurysm, single venous drainage, exclusive deep venous drainage, venous stenosis, venous sac, and nidus size. However, results based on these factors have been inconsistent across studies [4,6,9,12,13,14,15,16].
Studies have also explored the hemodynamics of cerebral AVMs, measured by quantitative digital subtraction angiography (QDSA), in relation to hemorrhage, but conclusions have been inconsistent primarily because of limited case number and differences in imaging modalities [17,18]. In Lin et al., the latest research on hemorrhagic risk prediction using quantitative digital subtraction angiography (QDSA), the findings indicated comparable predictive capabilities between QDSA and conventional DSA angioarchitecture. [15].
Artificial intelligence (AI) has been shown to be successful in medical imaging applications, such as feature detection or survival estimation [19,20]. However, only very few studies were conducted with regard to AI implementation in medical imaging interpretation of AVMs [21]. The performance of AI prediction models utilizing logistic regression and random forest with angioarchitecture parameters obtained from DSA was found to be suboptimal in Tao et al. [22]. On the contrary, Hong et al. showed promising results in detection of hemorrhagic brain AVMs using quantitative parameters derived from QDSA and random forest algorithm [23]. The study achieved a significantly higher level of accuracy, even in comparison with experienced neuroradiologists [23]. Furthermore, Allison et al. demonstrated a successful development of a deep learning model for detecting clinically significant intracranial aneurysms on computed tomographic angiography (CTA) [24]. In Huang et al., unsupervised machine learning was effectively employed to introduce a novel concept called the “compactness index”. This index proved valuable as a predictive factor for radiosurgery outcomes in individuals with unruptured brain arteriovenous malformations [25]. Based on these successes, it is evident that integrating an AI-assisted diagnostic model has the potential to improve clinician performance by offering reliable and accurate predictions, thereby optimizing patient care.
In view of this, the aim of this study was to evaluate the feasibility of utilizing neural network analysis of DSA to produce results comparable to traditional assessments based on angiographic anatomical characteristics.
2. Materials and Methods
2.1. Patient Selection
In this retrospective study, we recruited patients with cerebral AVMs who had undergone DSA studies between 2011 and 2017, based on available records in the radiology system in Taipei Veterans General Hospital. Patients who had received prior treatments including microsurgery, embolization, or gamma knife radiosurgery were excluded from this study. Additionally, patients with suboptimal angiographic imaging due to poor visualization of the AVM, severe motion artifacts, or non-standardized protocols, were also excluded. We further excluded patients who had experienced cerebral hemorrhage within one month prior to the angiographic study, as increased intracranial pressure could potentially influence hemodynamic measurements [11]. This study received approval from the local institutional review board, and informed consent was waived as per the approval.
2.2. Study Parameters
The clinical presentation and morphological characteristics obtained for AVMs were collected for analysis. The clinical presentation included age at diagnosis, sex, seizure history, headache, and focal neurologic deficits. Notable angioarchitecture features related to hemorrhage were identified in previous studies [4,6,14,26]. All parameters were interpreted by two neuroradiologists with 12 and 25 years of experience, respectively. AVM-related hemorrhage was analyzed using magnetic resonance (MR) or computed tomography (CT) images. Clinical data, including hemorrhagic outcome, were blinded until morphological identification was complete.
2.3. DSA Acquisition
DSA acquisition was carried out using a standardized clinical protocol in the same angio-suite (Artis zee®, Siemens Healthcare, Forchheim, Germany). A power injector (Liebel-Flarsheim Angiomat®, Illumena, San Diego, CA, USA) was utilized to administer a contrast bolus following the placement of a 4-French angiocatheter in the common carotid artery at the level of the C4 vertebral body. A bolus of 12–14 mL of diluted iodine contrast medium was injected in 1.5 s. No additional contrast medium or radiation was employed. Image acquisition commenced 0.2 s prior to the injection of the contrast medium. Image capture was conducted with a progressive frame rate during the DSA acquisition. Specifically, the images were initially captured at a rate of 7.5 frames per second for the first 5 s. This was followed by a reduced frame rate of 4 frames per second for 3 s, 3 frames per second for 2 s, and finally, 2 frames per second for 2 s. The complete DSA acquisition lasted 12 s, but it was manually extended if necessary to visualize opacification of the internal jugular vein from the normal brain parenchyma [15,27].
2.4. Angioarchitecture
In accordance with the terminology provided by a joint committee led by the American Society of Interventional and Therapeutic Neuroradiology, our investigation focused on several characteristics associated with cerebral AVMs. These characteristics included single venous drainage, the presence of a flow-related aneurysm, deep location of the nidus, exclusive superficial or deep venous drainage, periventricular drainage, venous stenosis, venous sac, and intranidal venous sac [4,26].
To provide more specific definitions, deep location is defined as basal ganglia, internal capsule, thalamus, corpus callosum, cerebellum, and brain stem. Deep venous drainage was considered any drainage through the internal cerebral veins, basal veins, or precentral cerebellar vein [26]. A flow-related aneurysm was considered if an aneurysm was present upstream of the ipsilateral internal carotid artery. The main drainage vein was identified as the vein with the shortest peak time among all drainage veins. Venous stenosis was defined as any focal luminal narrowing to less than 50% of the adjacent normal venous diameter in the main drainage vein. A venous sac was defined as a more than 200% change in venous diameter in any drainage vein.
2.5. Neural Network Analysis
To analyze visual imagery, deep learning employs the convolutional neural network (CNN), whereas sequential data is commonly analyzed using the recurrent neural network (RNN). To achieve our objective of predicting the hemorrhagic risk of cerebral AVM using DSA, a dynamic medical imaging technique, we employed a methodology that involved combining CNN with RNN.
Our analysis of DSA series using neural networks consists of two main parts: data pre-processing and model training. To build the model, we utilized TensorFlow 2.6 as the library and executed the code on the Google Collaboration platform. For each individual, both anterior-posterior and lateral views of the DSAs were collected. The hemorrhagic and non-hemorrhagic groups were randomly divided into training and test sets. Out of 147 patient data, 118 were used for training, and the remaining 29 were used for testing (see Table 1). Owing to the limited number of cases, we did not create a validation set. We only used the first 50 frames of DSA for each series, as the later frames contained normal venous structures. Additionally, we resized the images to 120 × 120 pixels to optimize subsequent processes. Each DSA series was classified as 1 if it belonged to a hemorrhagic individual and 0 if it belonged to a non-hemorrhagic individual.

Table 1.
The composition of training set and test set.
The CNN–RNN model comprised a total of eight layers, including two input layers, two time-distributed layers (each consisting of four convolution layers, three max-pooling layers, and one flatten layer), two LSTM layers (long short-term memory), one concatenate layer, and one dense layer. Figure 1 illustrates the overall structure of the CNN–RNN model. As depicted in the figure, the CNN–RNN model could be divided into four parts in order: the input layer, the time-distributed layer, the LSTM layer, and the final part used to generate prediction. The time-distributed layer included several convolutional layers and maximum-pooling layers, which constituted the “CNN” part of the CNN–RNN model, while LSTM constituted the “RNN” part of the model. The anterior–posterior and lateral views of the DSA series were processed separately. Thereafter, the concatenate layer combined the results from both views and passed the information to the fully connected layer to generate the prediction, which ranged from 0 to 1.
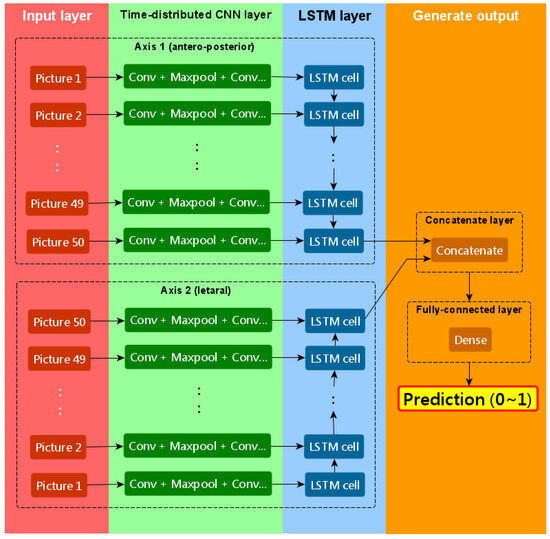
Figure 1.
The schematic diagram of our CNN–RNN model.
The parameters for each layer of our CNN–RNN model are described in detail below.
The neural network includes two input layers: one for the anterior-posterior view of the DSA series and another for the lateral view. The shape of the input layer is (none, 50, 120, 120, 1), indicating that each patient has 50 grayscale images of size 120 × 120 pixels, with one color channel. The “none” dimension represents the batch dimension.
Following the input layers, there is a time-distributed layer and an LSTM layer, as depicted in Figure 1. The time-distributed layer operates on each of the 50 time-steps of the DSA series and consists of four 2D convolutional layers, three 2D max-pooling layers, and one flatten layer. Three convolutional layers are followed by a max-pooling layer, while one convolutional layer is followed by a flatten layer at the end of the time-distributed layer. In each of the four convolutional layers, convolutional filters of size 3 × 3 are applied to the data, with the number of filters set as 16, 16, 32, and 8, respectively. The padding is set to ‘SAME’, and no activation function is applied. Each of the three max-pooling layers uses a pooling size of 2 × 2.
After the time-distributed layer extracts important features from each image in the DSA series, the LSTM layer is employed to capture time-dependent features. The last cell in the LSTM layer has 32 output units, and only the output of the last cell is utilized.
Subsequent to the time-distributed and LSTM layers, a concatenate layer combines the extracted information from both the anterior-posterior and lateral DSA series. This is followed by a fully connected layer at the end of the model. The fully connected layer consists of a single unit with the sigmoid activation function, which provides the output indicating the likelihood of hemorrhage in the patient.
During the model compilation, the loss function is set as ‘binary cross-entropy’, and the optimizer is ‘Adam’. The learning rate of the optimizer is 0.00001. The input data is trained for 50 epochs, with a batch size of 5.
2.6. Statistical Analysis
To assess differences related to categorical variables such as sex, presentation of seizures, history of headache, focal neurologic deficit, and Spetzler–Martin grades, Pearson’s chi-square test was employed. In order to determine significant associations with AVM-associated hemorrhage, univariate logistic regression was performed on all parameters. The angioarchitecture parameters with p values less than 0.1 in the univariate logistic regression were subsequently analyzed with multivariate logistic regression, adjusting for age, sex, and AVM nidus volume.
To compare the diagnostic performance of the angioarchitecture predictive model with that of the CNN–RNN analysis, ROC curve analysis was employed. The data analysis was conducted using IBM SPSS 20 statistical software (2010; IBM SPSS, Chicago, IL, USA).
3. Results
A total of 199 patients with cerebral AVMs who had undergone both angiographic evaluations were initially identified. After excluding 36 patients with prior AVM treatment, 11 patients with suboptimal DSA image quality and 5 patients who experienced hemorrhage within one month before angiography, a final cohort of 147 patients remained for subsequent analysis (Figure 2). Among these patients, 85 (58%) were male and 62 (42%) were female. The range of their age spanned from 12 to 80 years. Out of the cohort, 48 (33%) patients presented with hemorrhage at the time of initial diagnosis. Comparing the two groups, the hemorrhagic group exhibited more frequent headaches and a lower incidence of seizure history compared to the non-hemorrhagic group. Table 2 provides a summary of patient characteristics. Notably, the average age of the hemorrhagic group was significantly lower (33.7 ± 16.9 years) than that of the non-hemorrhagic group (39.9 ± 14.4) (p = 0.019). Seizures were more common in the non-hemorrhagic group (38%) than in the hemorrhagic group (12%).
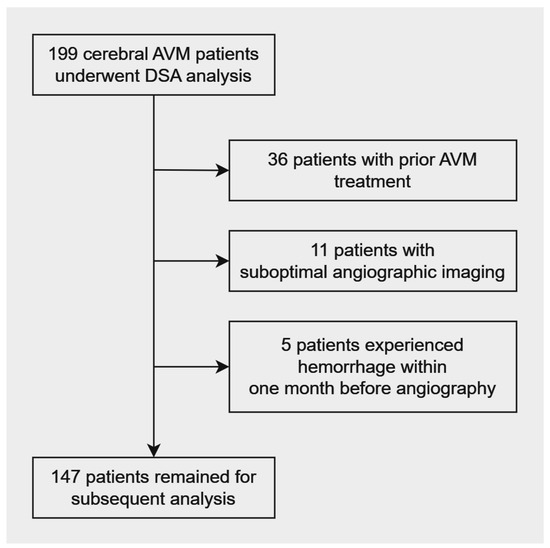
Figure 2.
Patient selection flowchart.
Table 2.
Characteristics of study population.
3.1. Logistic Regression
In univariate logistic regression, age at diagnosis (odds ratio [OR] ≤ 0.04, 95% confidence interval [CI] ≤ 0.04 to 0.05; p = 0.019) exhibited a correlation with AVM hemorrhage. For angioarchitectures, single venous drainage (OR = 3.61, 95% CI = 1.82–7.19; p = 0.001) and exclusive deep venous drainage (OR = 4.46, 95% CI = 1.98–10.07; p = 0.001) were associated with a high chance of bleeding. On the contrary, the venous sac (OR = 0.34, 95% CI = 0.16−0.72; p = 0.005) was less associated with hemorrhage. The significance of the angioarchitecture parameters was tested using multivariate logistic regression with adjustment for age at diagnosis and sex (Table 3). Age was an insignificant predictor, while single venous drainage, exclusive deep venous drainage, and venous sac were independent predictors of hemorrhage.
Table 3.
Univariate and multivariate logistic regression of age, sex, and angioarchitecture in association with hemorrhage in cerebral arteriovenous malformation.
3.2. Neural Network Analysis
Before we trained the neural network, we preprocessed the data by enhancing the contrast of each image. We multiplied the pixel values of the images in each DSA series by a certain value, so that the maximal pixel value of each DSA series was equal to 255. Owing to the RAM constraint on Google Collaboration, we reshaped the images from 960 × 960 to 120 × 120. Figure 3 shows the representative images before preprocessing (a) and after preprocessing (b). The original image (a) was from the radiology system in Taipei Veterans General Hospital.
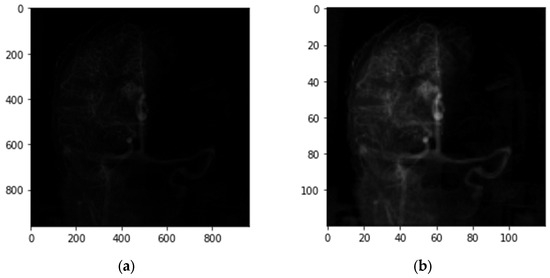
Figure 3.
Representative images of the DSA series, before and after preprocessing. (a) Original image acquired by DSA; (b) obtained after contrast enhancement and image reshaping, and was used in the CNN–RNN model.
The diagnostic performance levels of our CNN–RNN model compared with the multivariate regression model are shown in Table 4. Our neural network model had an accuracy of 100% on the training set and 76% on the test set, while the regression model had an accuracy of 69%. The optimized threshold was set to 0.500, which means that the patient was considered hemorrhagic if the output was greater than or equal to 0.500, or vice versa. Our neural network model had an area under curve (AUC) of the ROC of 0.999 in the training set and 0.748 in the test set, while the regression model had an AUC of 0.757 (Figure 4). The datasets generated and analyzed during the current study are available from the corresponding author on reasonable request.
Table 4.
Performance level of the multivariate regression model and our neural network model.
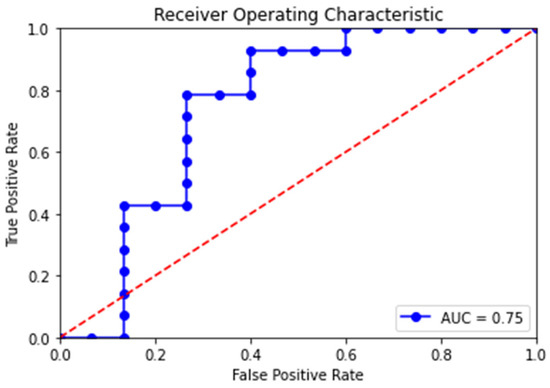
Figure 4.
Receiver operating characteristic (ROC) curves of our neural network model in the test set. The blue line is the ROC curve with each dot representing a candidate threshold value. The red dotted diagonal line represents perfect guessing chance. The area under the ROC curve (AUC) is 0.748.
4. Discussion
The prevalence of cerebral AVMs is estimated at only 0.2%, which is likely underestimated given the asymptomatic nature of many lesions and the lack of routine screening [1,16]. Despite its low prevalence, cerebral AVMs contribute to up to 33% of primary intracerebral hemorrhage, with case fatality up to 20% at 30 days following hemorrhage [1,2]. The overall risk of hemorrhage for cerebral AVMs is 2–4% per year [16]. However, hemorrhagic risk among individuals varies. Since the ARUBA study demonstrated that medical therapy alone is superior to any interventional therapy for unruptured AVMs [3], reliable and accurate individualized evaluation of AVM-related hemorrhagic risk is crucial to optimize patient outcome. Despite numerous research that has examined risk factors for AVM-associated hemorrhage based on angioarchitecture, results have been inconsistent across studies [4,6,9,12,13,14,15,16].
In our study, we demonstrated that age was an insignificant predictor, while single venous drainage, exclusive deep venous drainage, and venous sac were independent predictors of hemorrhage. In line with previous meta-analyses, we found a significant association between exclusive deep venous drainage and AVM-related hemorrhage [12,28]. However, our study contradicted the notion that deep location is a significant risk factor. Our study supports the results of Costa et al. and Lin et al. [15,29]. This finding is further corroborated by the microcatheter measurements of feeder-artery pressure reported by Duong et al. [7]. We believed that the main reason for inconsistent results among research was that the definition of deep location for the nidus has varied across studies. While all studies included the thalamus, basal ganglia, and corpus callosum as deep locations, Stefani et al., Yamada et al., and Lin et al. also included the cerebellum and brainstem [4,15,30]. Stapf et al. and Costa et al., on the other hand, classified the cerebellum and brainstem as separate factors under the infratentorial location [6,29].
Hemodynamic studies of AVM had been conducted during microsurgery in the late 1990s and early 2000s. Through direct intraluminal intraoperative measurement, Young et al. reported that feeding-artery pressure was correlated with a relatively high risk of bleeding [31]. High drainage venous pressure has also been observed in ruptured AVMs [32,33]. In the present study, the dilated venous sac implied better remodeling in response to increased venous pressure and therefore was less likely to rupture compared to undilated venous outlets. Given a fixed volume of the nidus, the pressure was also higher intra-luminally in the single venous drainage system than in the multiple venous drainage system. As a result, this provides the rationale behind this study’s suggestion that single vein drainage is a risk factor for rupture.
Given the recent success of implementing AI in medical imaging [19,20,21,22,23,24], we assessed the feasibility of using neural network analysis of DSA to generate results that are comparable to traditional assessment methods based on angioarchitecture. Owing to the dynamic nature of DSA in medical imaging, we devised a CNN–RNN model structure. Fine-tuning of the model’s hyperparameters was conducted to minimize the decreased accuracy from our training set to test set, including the learning rate, number of layers, neurons, and filters. We also experimented with the inclusion or exclusion of normalization layers, activation layers, and dropout layers. Although we were unable to completely eliminate the issue of overfitting, we achieved a relatively favorable outcome when compared to the regression model based on angioarchitecture. Our test set yielded an accuracy of 76% and an AUC of 0.75, while angioarchitecture-based analysis yielded an accuracy of 69% and an AUC of 0.76 (Figure 4).
As of our current understanding, only two studies have delved into the integration of AI in the interpretation of medical imaging related to cerebral AVMs, with a particular focus on the prediction of hemorrhagic risk. The pioneering study conducted by Lin et al. in 2020 employed logistic regression as the algorithm to enhance the predictive precision of their AI model designed for assessing hemorrhagic risk [15]. Their methodology was grounded in the analysis of hemodynamics utilizing QDSA. They achieved an AUC of 0.73 using QDSA, which was on par with the results from conventional angioarchitectural analysis based on DSA [15]. Nevertheless, their model’s validity was not established for infratentorial AVMs due to their exclusion from the study. Additionally, patients under 18 years old were excluded due to distinct hemodynamics compared to adult AVMs [15]. The subsequent study by Tao et al. in 2021 employed both logistic regression and random forest techniques to augment the predictive capability of hemorrhagic risk assessment [22]. Their analysis yielded average AUC values of 0.70 and 0.68, respectively, from the two algorithms. It is noteworthy that their model relied on hemorrhagic risk predictors extracted from every DSA series, with interpretations conducted by two experienced neuro-radiologists [22]. The interpretation of DSA series is a skill demanding years of professional training due to the intricate nature of cerebral angioarchitecture. In contrast, our proposed CNN–RNN model enables immediate and automated assessment of hemorrhagic risk without necessitating expert interpretation, while still maintaining accuracy levels comparable to those achieved through angioarchitectural analysis.
The primary challenge in our research was the limited availability of images. After excluding ineligible data, we were left with a relatively small dataset consisting of only 147 patients with cerebral AVM. This size was insufficient for a neural network, which typically requires a larger dataset to produce reliable results. The decrease in accuracy observed from the training set to the test set further confirmed the limitations imposed by the sample size. In the future, the model’s optimization is expected to improve with a larger input of AVM data.
Overfitting occurs when a model fits the training data too closely, resulting in strong classification performance on the training data but poor performance on independent testing data. An extensive review of the most recent AI applications and challenges in cerebrovascular diseases was made in Chen et al. [21]. They concluded that when it comes to cerebrovascular diseases, associated medical imaging datasets often have small sample sizes and lack sufficient patient-level data, given the low prevalence of certain diseases such as brain AVMs [21]. This inherent characteristic renders models susceptible to overfitting. Even though some studies used scanning slices or sliding patches as inputs [21], the count of medical imaging samples remained significantly lower than that of natural images. To address overfitting, neural networks commonly employ various strategies. These include K-fold cross-validation, regularization, and applying appropriate data augmentation techniques such as generative adversarial networks (GANs). However, these methods might not be as effective for deep learning models. From a foundational standpoint, using a large amount of training data remains one of the primary ways to tackle overfitting [21]. Thus, we propose that future efforts concentrate on gathering extensive data from multiple centers, as well as adjusting the structure of neural networks to prevent overfitting. This approach would enable the development of a more precise, dependable, and unbiased model.
This study has a few limitations worth noting. Firstly, due to the retrospective nature of this study, while we managed to identify risk factors for AVM-associated hemorrhage, establishing causal relationships was not feasible. Therefore, further longitudinal studies are necessary to delve into this matter. Secondly, while previous studies have highlighted the significance of hemorrhage presentation as a risk factor for future AVM bleeding, our analysis only considered associated risk factors at the time of initial diagnosis [4,6,12,14,28,29]. Furthermore, we did not account for rebleeding during the follow-up period. Additional studies are needed to customize models for different cerebral hemodynamic conditions.
To the best of our knowledge, this study is one of the few to apply the CNN–RNN structure to dynamic medical imaging. Conventionally, interpreting DSA requires years of professional training due to the complexity of cerebral hemodynamics and angioarchitectures. With the assistance of AI, accurate diagnoses and hemorrhage risk assessments can be obtained immediately within the angio-room. AI-assisted diagnosis not only allows interventionists to focus on procedures but also assists radiologists in making comprehensive differential diagnoses. In general, the integration of AI helps reduce human errors and has the potential to improve patient outcomes.
5. Conclusions and Future Work
Our CNN–RNN model demonstrated a diagnostic performance for hemorrhagic risk assessment of AVMs that is comparable to those achieved through angioarchitecture analysis. This represents a promising complementary, non-invasive, and automated approach to augment the intricate hemodynamic and anatomic insights obtained from DSA, without necessitating expert interpretation, as well as without the need for additional radiation or contrast media.
To facilitate the development of a more precise and unbiased model, we recommend that future efforts concentrate on two pivotal aspects. Firstly, comprehensive data should be gathered from multiple medical centers, as AI models typically require extensive datasets for the production of dependable outcomes. Given the low incidence of cerebral AVM, it is imperative to undertake large-scale studies. Secondly, it is also crucial to refine the model structure to mitigate overfitting, which may be achieved by implementing techniques such as K-fold cross-validation, regularization, and the appropriate application of data augmentation. Through the utilization of larger datasets and the optimization of model architecture, there exists significant potential to further enhance prediction accuracy.
Consequently, we advocate for the incorporation of AI algorithms in a comprehensive hemorrhagic risk assessment of cerebral AVMs. This inclusion can potentially enhance the precision and efficacy of treatment planning for patients with cerebral AVMs, ultimately leading to improved clinical outcomes.
Author Contributions
Conceptualization, J.-C.C.; Methodology, K.-Y.W. and J.-C.C.; Validation, K.-Y.W.; Formal analysis, K.-Y.W.; Resources, J.-C.C.; Data curation, K.-Y.W. and J.-C.C.; Writing—original draft, K.-Y.W.; Writing—review & editing, K.-Y.W. and J.-C.C.; Supervision, J.-C.C.; Project administration, J.-C.C. All authors have read and agreed to the published version of the manuscript.
Funding
This study was funded by the Ministry of Science and Technology (grant number: MOST-106-2314-B-010-015-MY2).
Institutional Review Board Statement
The study was conducted in accordance with the Declaration of Helsinki and approved by the Institutional Review Board of the Taipei Veteran’s General Hospital (protocol code 2019-01-010C on 23 January 2019).
Informed Consent Statement
Patient consent was waived due to the retrospective nature of the study, which used anonymized data without any personally identifiable information.
Data Availability Statement
Data available on request due to privacy and ethical restrictions.
Acknowledgments
The authors thank Chung-Jung Lin (Department of Radiology, Taipei Veterans General Hospital, Taipei, Taiwan) for collecting and providing patients’ data, giving insight on the medical radiology, and conducting univariate and multivariate logistic regression.
Conflicts of Interest
The authors declare no conflict of interest.
References
- Al-Shahi, R.; Warlow, C. A systematic review of the frequency and prognosis of arteriovenous malformations of the brain in adults. Brain 2001, 124 Pt 10, 1900–1926. [Google Scholar] [CrossRef]
- Berman, M.F.; Sciacca, R.R.; Pile-Spellman, J.; Stapf, C.; Connolly, E.S., Jr.; Mohr, J.P.; Young, W.L. The epidemiology of brain arteriovenous malformations. Neurosurgery 2000, 47, 389–396. [Google Scholar] [CrossRef]
- Mohr, J.P.; Parides, M.K.; Stapf, C.; Moquete, E.; Moy, C.S.; Overbey, J.R.; Salman, R.A.-S.; Vicaut, E.; Young, W.L.; Houdart, E.; et al. Medical management with or without interventional therapy for unruptured brain arteriovenous malformations (ARUBA): A multicentre, non-blinded, randomised trial. Lancet 2014, 383, 614–621. [Google Scholar] [CrossRef]
- Stefani, M.A.; Porter, P.J.; terBrugge, K.G.; Montanera, W.; Willinsky, R.A.; Wallace, M.C. Angioarchitectural factors present in brain arteriovenous malformations associated with hemorrhagic presentation. Stroke 2002, 33, 920–924. [Google Scholar] [CrossRef]
- Pollock, B.E.; Flickinger, J.C.; Lunsford, L.D.; Bissonette, D.J.; Kondziolka, D. Factors that predict the bleeding risk of cerebral arteriovenous malformations. Stroke 1996, 27, 1–6. [Google Scholar] [CrossRef]
- Stapf, C.; Mast, H.; Sciacca, R.R.; Choi, J.H.; Khaw, A.V.; Connolly, E.S.; Pile-Spellman, J.; Mohr, J.P. Predictors of hemorrhage in patients with untreated brain arteriovenous malformation. Neurology 2006, 66, 1350–1355. [Google Scholar] [CrossRef]
- Duong, D.H.; Young, W.L.; Vang, M.C.; Sciacca, R.R.; Mast, H.; Koennecke, H.-C.; Hartmann, A.; Joshi, S.; Mohr, J.P.; Pile-Spellman, J. Feeding artery pressure and venous drainage pattern are primary determinants of hemorrhage from cerebral arteriovenous malformations. Stroke 1998, 29, 1167–1176. [Google Scholar] [CrossRef]
- Stefani, M.A.; Porter, P.J.; terBrugge, K.G.; Montanera, W.; Willinsky, R.A.; Wallace, M.C. Large and deep brain arteriovenous malformations are associated with risk of future hemorrhage. Stroke 2002, 33, 1220–1224. [Google Scholar] [CrossRef]
- Hernesniemi, J.A.; Dashti, R.; Juvela, S.; Vaart, K.; Niemela, M.; Laakso, A. Natural history of brain arteriovenous malformations: A long-term follow-up study of risk of hemorrhage in 238 patients. Neurosurgery 2008, 63, 823–829. [Google Scholar] [CrossRef]
- Spetzler, R.F.; Hargraves, R.W.; McCormick, P.W.; Zabramski, J.M.; Flom, R.A.; Zimmerman, R.S. Relationship of perfusion pressure and size to risk of hemorrhage from arteriovenous malformations. J. Neurosurg. 1992, 76, 918–923. [Google Scholar] [CrossRef]
- Todaka, T.; Hamada, J.; Kai, Y.; Morioka, M.; Ushio, Y. Analysis of mean transit time of contrast medium in ruptured and unruptured arteriovenous malformations: A digital subtraction angiographic study. Stroke 2003, 34, 2410–2414. [Google Scholar] [CrossRef]
- Abecassis, I.J.; Xu, D.S.; Batjer, H.H.; Bendok, B.R. Natural history of brain arteriovenous malformations: A systematic review. Neurosurg. Focus 2014, 37, E7. [Google Scholar] [CrossRef]
- Ellis, M.J.; Armstrong, D.; Vachhrajani, S.; Kulkarni, A.V.; Dirks, P.B.; Drake, J.M.; Smith, E.R.; Scott, R.M.; Orbach, D.B. Angioarchitectural features associated with hemorrhagic presentation in pediatric cerebral arteriovenous malformations. J. Neurointerv. Surg. 2013, 5, 191–195. [Google Scholar] [CrossRef]
- Kim, H.; Al-Shahi Salman, R.; McCulloch, C.E.; Stapf, C.; Young, W.L.; Coinvestigators, M. Untreated brain arteriovenous malformation: Patient-level meta-analysis of hemorrhage predictors. Neurology 2014, 83, 590–597. [Google Scholar] [CrossRef]
- Lin, T.M.; Yang, H.C.; Lee, C.C.; Wu, H.M.; Hu, Y.S.; Luo, C.B.; Guo, W.Y.; Kao, Y.H.; Chung, W.Y.; Lin, C.J. Stasis index from hemodynamic analysis using quantitative DSA correlates with hemorrhage of supratentorial arteriovenous malformation: A cross-sectional study. J. Neurosurg. 2020, 132, 1574–1582. [Google Scholar] [CrossRef]
- Mark, D.J.; Brittany, S.; Mario, Z. A Rational Approach to the Management of Cerebral Arteriovenous Malformations. World Neurosurg. 2022, 159, 338–347. [Google Scholar]
- Shakur, S.F.; Brunozzi, D.; Hussein, A.E.; Linninger, A.; Hsu, C.-Y.; Charbel, F.T.; Alaraj, A. Validation of cerebral arteriovenous malformation hemodynamics assessed by DSA using quantitative magnetic resonance angiography: Preliminary study. J. Neurointerv. Surg. 2018, 10, 156–161. [Google Scholar] [CrossRef]
- Chang, W.; Loecher, M.W.; Wu, Y.; Niemann, D.B.; Ciske, B.; Aagaard-Kienitz, B.; Kecskemeti, S.; Johnson, K.M.; Wieben, O.; Mistretta, C.; et al. Hemodynamic changes in patients with arteriovenous malformations assessed using high-resolution 3D radial phase-contrast MR angiography. AJNR Am. J. Neuroradiol. 2012, 33, 1565–1572. [Google Scholar] [CrossRef]
- Feng, R.; Badgeley, M.; Mocco, J.; Oermann, E.K. Deep learning guided stroke management: A review of clinical applications. J. Neurointerv. Surg. 2017, 10, 358–362. [Google Scholar] [CrossRef]
- Waljee, A.K.; Higgins, P.D.R. Machine learning in medicine: A primer for physicians. Am. J. Gastroenterol. 2010, 105, 1224–1226. [Google Scholar] [CrossRef]
- Chen, X.; Lei, Y.; Su, J.; Yang, H.; Ni, W.; Yu, J.; Gu, Y.; Mao, Y. A Review of Artificial Intelligence in Cerebrovascular Disease Imaging: Applications and Challenges. Curr. Neuropharmacol. 2022, 20, 1359–1382. [Google Scholar] [CrossRef]
- Tao, W.G.; Yan, L.C.; Zeng, M.; Chen, F.H. Factors affecting the performance of brain arteriovenous malformation rupture prediction models. BMC Med. Inform. Decis. Mak. 2021, 21, 142. [Google Scholar] [CrossRef]
- Hong, J.-S.; Lin, C.-J.; Lin, Y.-H.; Lee, C.-C.; Yang, H.-C.; Meng, L.-H.; Lin, T.-M.; Hu, Y.-S.; Guo, W.-Y.; Chu, W.-F.; et al. Machine learning application with quantitative digital subtraction angiography for detection of hemorrhagic brain arteriovenous malformations. IEEE Access 2020, 8, 204573. [Google Scholar] [CrossRef]
- Park, A.; Chute, C.; Rajpurkar, P.; Lou, J.; Ball, R.L.; Shpanskaya, K.; Jabarkheel, R.; Kim, L.H.; McKenna, E.; Tseng, J.; et al. Deep Learning-Assisted Diagnosis of Cerebral Aneurysms Using the HeadXNet Model. JAMA Netw. Open 2019, 2, 195600. [Google Scholar] [CrossRef]
- Huang, P.-W.; Peng, S.-J.; Pan, D.H.-C.; Yang, H.-C.; Tsai, J.-T.; Shiau, C.-Y.; Su, I.-C.; Chen, C.-J.; Wu, H.-M.; Lin, C.-J.; et al. Compactness index: A radiosurgery outcome predictor for patients with unruptured brain arteriovenous malformations. J. Neurosurg. 2022, 138, 241–250. [Google Scholar] [CrossRef]
- Joint Writing Group of the Technology Assessment Committee American Society of Interventional and Therapeutic Neuroradiology; Joint Section on Cerebrovascular Neurosurgery a Section of the American Association of Neurological Surgeons and Congress of Neur; Atkinson, R.P.; Awad, I.A.; Batjer, H.H.; Dowd, C.F.; Furlan, A.; Giannotta, S.L.; Gomez, C.R.; Gress, D.; et al. Reporting terminology for brain arteriovenous malformation clinical and radiographic features for use in clinical trials. Stroke 2001, 32, 1430–1442. [Google Scholar] [CrossRef]
- Guo, W.-Y.; Lee, C.-C.; Lin, C.-J.; Yang, H.-C.; Wu, H.-M.; Wu, C.-C.; Chung, W.-Y.; Liu, K.-D. Quantifying the Cerebral Hemodynamics of Dural Arteriovenous Fistula in Transverse Sigmoid Sinus Complicated by Sinus Stenosis: A Retrospective Cohort Study. AJNR Am. J. Neuroradiol. 2016, 38, 132–138. [Google Scholar] [CrossRef]
- Gross, B.A.; Du, R. Natural history of cerebral arteriovenous malformations: A meta-analysis. J. Neurosurg. 2013, 118, 437–443. [Google Scholar] [CrossRef]
- Costa, L.; Wallace, M.C.; Ter Brugge, K.G.; O’Kelly C’ Willinsky, R.A.; Tymianski, M. The natural history and predictive features of hemorrhage from brain arteriovenous malformations. Stroke 2009, 40, 100–105. [Google Scholar] [CrossRef]
- Yamada, S.; Takagi, Y.; Nozaki, K.; Kikuta, K.-I.; Hashimoto, N. Risk factors for subsequent hemorrhage in patients with cerebral arteriovenous malformations. J. Neurosurg. 2007, 107, 965–972. [Google Scholar] [CrossRef]
- Young, W.L.; Kader, A.; Pile-Spellman, J.; Ornstein, E.; Stein, B.M. Arteriovenous malformation draining vein physiology and determinants of transnidal pressure gradients. The Columbia University AVM Study Project. Neurosurgery 1994, 35, 389–395, discussion 95–96. [Google Scholar] [CrossRef]
- Miyasaka, Y.; Kurata, A.; Tokiwa, K.; Tanaka, R.; Yada, K.; Ohwada, T. Draining vein pressure increases and hemorrhage in patients with arteriovenous malformation. Stroke 1994, 25, 504–507. [Google Scholar] [CrossRef]
- Miyasaka, Y. Arteriovenous malformation draining vein physiology and determinants of transnidal pressure gradients. Neurosurgery 1995, 36, 1234–1236. [Google Scholar] [CrossRef]
Disclaimer/Publisher’s Note: The statements, opinions and data contained in all publications are solely those of the individual author(s) and contributor(s) and not of MDPI and/or the editor(s). MDPI and/or the editor(s) disclaim responsibility for any injury to people or property resulting from any ideas, methods, instructions or products referred to in the content. |
© 2023 by the authors. Licensee MDPI, Basel, Switzerland. This article is an open access article distributed under the terms and conditions of the Creative Commons Attribution (CC BY) license (https://creativecommons.org/licenses/by/4.0/).