Article

Accuracy Analysis of Visual Odometer for Unmanned Rollers in Tunnels

National Engineering Laboratory for Highway Maintenance Equipment, Chang’an University, Xi’an 710064, China
*
Author to whom correspondence should be addressed.
Electronics 2023, 12(20), 4202; https://doi.org/10.3390/electronics12204202
Submission received: 7 September 2023 / Revised: 30 September 2023 / Accepted: 5 October 2023 / Published: 10 October 2023
(This article belongs to the Section Electrical and Autonomous Vehicles)

Abstract

:
Rollers, integral to road construction, are undergoing rapid advancements in unmanned functionality. To address the specific challenge of unmanned compaction within tunnels, we propose a vision-based odometry system for unmanned rollers. This system solves the problem of tunnel localization under conditions of low texture and high noise. We evaluate and compare the performance of various feature extraction and matching methods, followed by the application of random sample consensus (RANSAC) to eliminate false matches. Subsequently, Perspective-n-Points (PnP) was employed to establish a minimal-error analysis for pose estimation and trajectory analysis. The findings reveal that binary robust invariant scalable key points (BRISK) exhibits larger errors due to fewer correctly matched feature points, while scale invariant feature transform (SIFT) falls short of real-time requirements. Compared to Oriented FAST and Rotated BRIEF (ORB) and the direct method, the maximum relative error and the median error between the compaction trajectory estimated by speed-up robust features (SURF) and the actual trajectory were the smallest. Consequently, the unmanned rollers employing SURF + PnP improved the accuracy and robustness. This research contributes valuable insights to the development of autonomous road construction equipment, particularly in challenging tunnels.

1. Introduction

As a typical form of pavement machinery, the roller is a very important piece of rolling equipment in roadworks [1,2]. However, there are many problems with manually operated rollers [2,3,4,5], such as the fact that the vibration of the roller can cause discomfort to the driver; the rolling speed cannot be constant; the overlapping width of compaction depends on the driver’s proficiency, etc. Therefore, numerous construction machinery companies are committed to developing unmanned rollers.
This paper focuses on the study of unmanned driving in tunnels. Due to the unstable geological conditions in this environment [6], unmanned rollers can reduce direct exposure of personnel, thereby improving construction safety. At the same time, they can be combined with online real-time compaction detection technology [7] to ensure that the construction quality meets the standards and reduces errors caused by human factors.
In recent advancements, several enterprises have pioneered the development of unmanned rollers, leveraging the global navigation satellite system (GNSS) [1,2,4] for precise positioning in open terrains, subsequently facilitating real-time supervision and control of the rollers. However, due to the absence of GNSS signals in tunnels, unmanned driving systems that rely on GNSS positioning are ineffective. Developing a positioning method that does not rely on GNSS has become the key to solving the problem of unmanned driving in tunnels.
There are three primary localization methods that do not rely on GNSS: vision-based [8], laser-based [9], and multi-sensor fusion-based [10]. In comparison to the latter two methods, vision-based approaches offer significant economic advantages (i.e., they are affordable for many construction contractors). Furthermore, vision-based methods can provide comprehensive road construction information, enabling the rapid and precise completion of construction projects. Therefore, from the perspectives of work efficiency, construction safety, and economic costs, this paper proposes a vision-based unmanned roller system tailored to tunnels. It evaluates different feature extraction and matching methods, comparing their performance metrics, and demonstrates the system’s accuracy by analyzing the relative errors in the roller’s movement.
As shown in Figure 1a, the system comprises a stereo camera: ZED 2i, a vehicle controller: Rexroth BODAS 22 series, and an embedded platform: Nvidia TX2. To control the forward and backward movement of the roller, the hydraulic pump’s input and output oil volumes are regulated through the installation of proportional solenoid valves. Similarly, proportional solenoid valves are employed to adjust the input and output oil volumes of the steering cylinder, thereby enabling precise control of the roller’s steering angle. In Figure 1b, the testing site is situated within an indoor laboratory, replicating tunnels.
This work presents the following contributions: Firstly, the author proposes a system of unmanned rollers based on visual localization in tunnels. Secondly, concerning feature point extraction and matching, various evaluation metrics for ORB, SIFT, SURF, and BRISK are compared, providing standards for the real-time performance and accuracy of subsequent pose estimation. Lastly, a minimum error model is established through the PnP method for pose estimation and trajectory analysis, demonstrating the feasibility of this approach in practical applications.
The remaining parts of this paper are organized as follows: Section 2 reviews related research on visual localization; Section 3 introduces the workflow of feature-based visual odometry, as well as the principles and evaluation metrics of various feature extraction and matching algorithms; and Section 4 presents the experimental results and discussion. Finally, the author’s conclusions and prospects for future work are summarized in Section 5.

2. Related Work

Visual simultaneous localization and mapping (V-SLAM) [11] was introduced to address indoor positioning. The front end of V-SLAM is called visual odometry (VO), which can be traced back to the 1980s, when NASA scientist Moravec used VO in NASA’s Mars Exploration Program [12]. Nister [13] has made outstanding contributions to VO, including the first real-time application of VO and putting forward the classic framework for monocular and stereo. It can be categorized into two forms: direct methods and indirect methods.
The direct method uses the pixel grayscale values of images and employs nonlinear optimization techniques to minimize photometric errors, ultimately determining the pose of the camera. The earliest direct method, dense tracking and mapping (DTAM), was proposed by Newcombe et al. [14], which used the RGB-D camera to restore a dense map. It had strong robustness for missing features and blurred images, but required the graphic processing unit (GPU) for real-time operation due to high computational complexity. Engel et al. [15,16,17] proposed a semi-dense method, large-scale direct monocular SLAM (LSD-SLAM), which only calculates pixels with image gradients greater than a given threshold to ensure real-time performance. LSD-SLAM also uses trajectory tracking in similar transformation spaces to detect and correct scale drift. Engel et al. [18,19] proposed direct sparse odometry (DSO) based on the sparse direct method, which incorporates all parameters, such as internal camera parameters, pose, and inverse depth values of map point clouds, into the optimization algorithm. It adopts a camera photometric calibration model, fully considering the camera’s exposure parameters, which results in higher accuracy and stronger robustness.
The indirect method is used to extract corner and block features of the images, and then describes them based on the grayscale gradient or binary features of the feature points. ORB-SLAM [20] is one of the indirect SLAM systems, including three parallel threads for tracking, local map construction, and loop closure detection, and it can operate in real time in both large and small scenes and both indoor and outdoor environments. The system uses the ORB algorithm [21] for the extraction and description of feature points, which are proposed based on the Features from Accelerated Segment Test (FAST) [22] and Binary Robust Independent Elementary Features (BRIEF) [23]. However, in low-texture environments, ORB-SLAM performs poorly. Zhang et al. [24] proposed a point-line, vision-based inertial localization method based on the PL-VIO algorithm. A bilateral filtering algorithm and the speed-up robust features (SURF) algorithm were adopted, combined with the fast nearest neighbor algorithm for feature matching. He et al. [25] conducted an analysis of the three main approaches to implementing visual odometry: the feature-based method, the direct method, and the semi-direct method. They examined and compared ORB-SLAM2, DSO, and SVO, delving into the commonly addressed concerns of robustness and real-time operation in visual odometry. Wu et al. [26] proposed stereo-visual odometry using point-line features for underground tunnels. This system integrates both ORB features and LSD line features. By utilizing the angular relationship of line projection, a new method was introduced to calculate the re-projection error of line features. It added angular constraints to the re-projection of line features, addressing the instability caused by line projection errors and proving more advantageous in low-texture environments.
Previous works have shown promising results in terms of visual positioning. A thorough analysis of the mentioned literature reveals that, when compared to semi-direct and direct approaches, the feature-based technique stands out for its superior stability and robustness. This method remains effective in texture-deficient environments and exhibits commendable resistance to image noise and disturbances. Rather than processing the entire image, the feature-based method hinges on the extraction and matching of a limited set of feature points, streamlining data processing. As a result, it surpasses the direct method in efficiency and delivers enhanced real-time performance. The tunnels are unstructured and low-textured, needing both stability and robustness. Given the real-time demands of the unmanned rollers, this paper proposes a localization system that relies on feature-based visual odometry.

3. Feature-Based Visual Odometer System

Feature-based visual odometry relies on extracting and tracking feature points from images to estimate motion. A visual odometry system for autonomous rollers in tunnels has been proposed. The steps are as follows:
  • Image pre-processing: Image distortion removal and calibration.
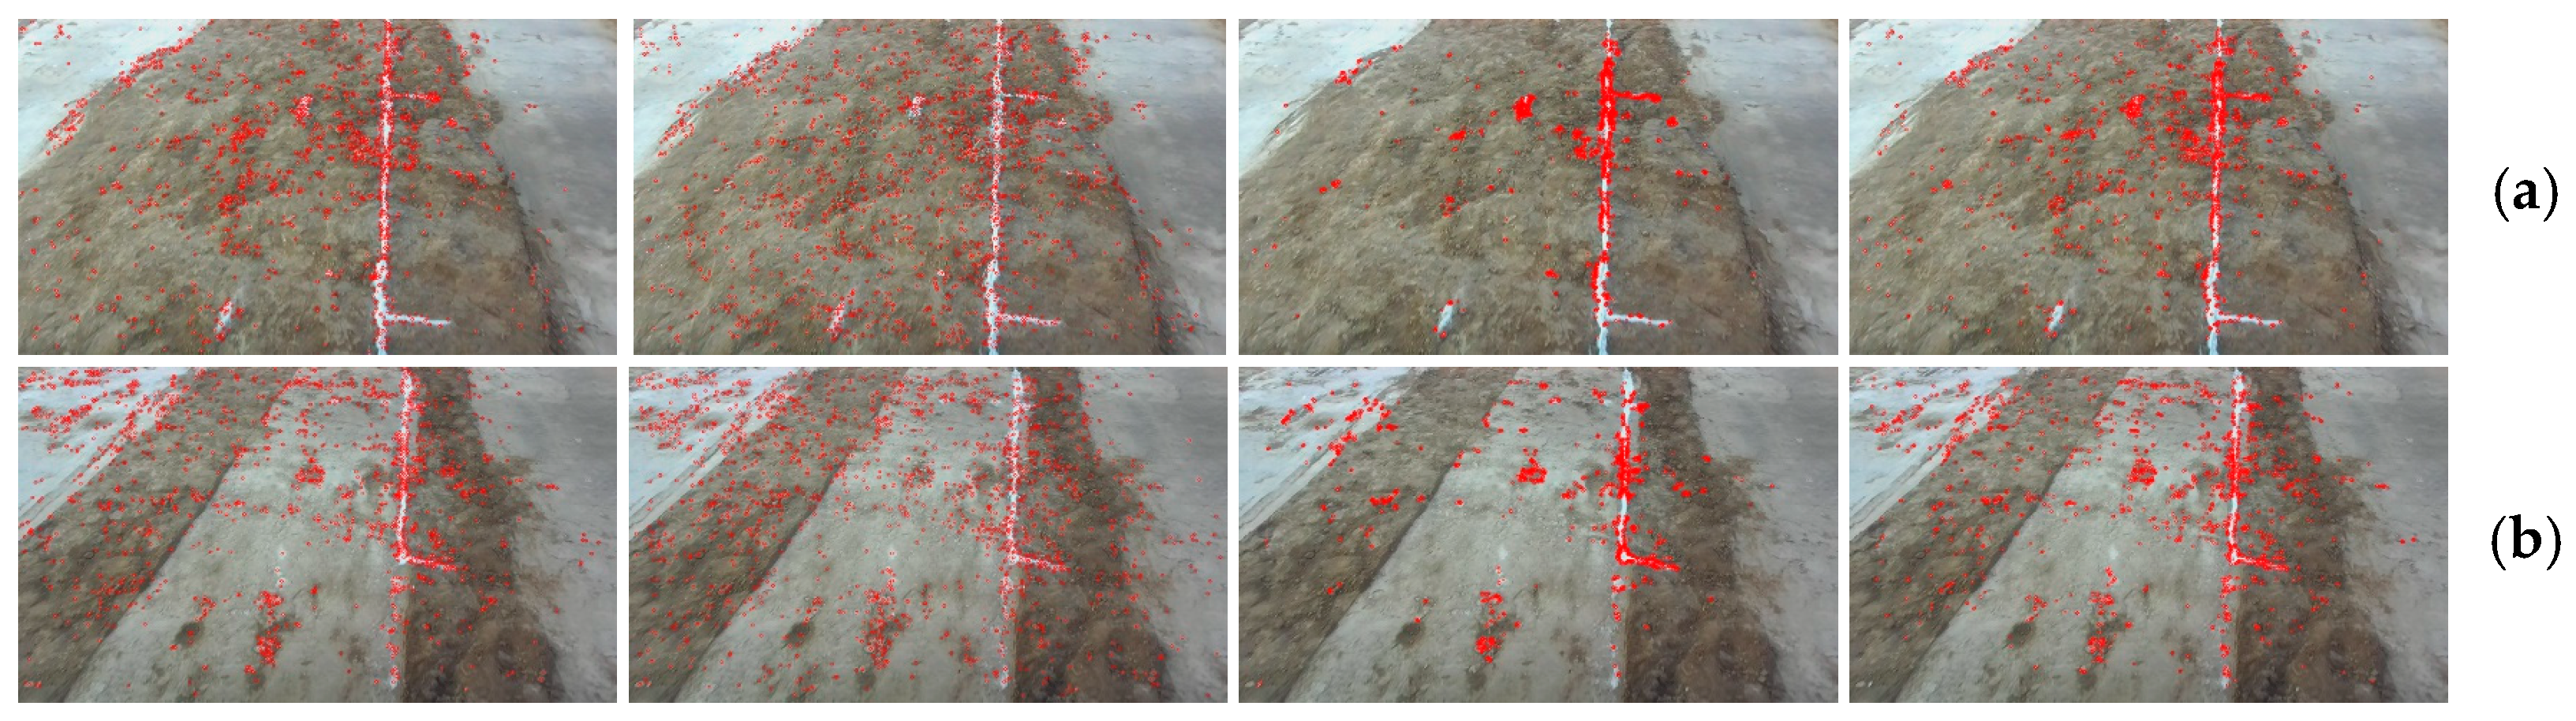
  • Feature extraction: Corners, edges, and patches in each frame are chosen as the feature points.
  • Feature description: The appearance of the neighboring region is described, producing descriptors.
  • Feature matching: Each descriptor is matched with all descriptors in the adjacent image frame using brute-force matching. The one with the shortest distance is chosen as the matching point. Mismatches are then eliminated through random sample consensus (RANSAC).
  • Motion estimation: The pose updates between adjacent frames are computed using the filtered, matched features.
  • Pose tracking: The camera pose from the previous frame is combined with the pose update to calculate the current frame’s pose, which gives the actual pose of the roller, representing the compaction trajectory.

3.1. Feature Detection and Description

Feature detection serves as the second step of this system. Its role is to identify distinct and trackable points within an image. Typically, these points manifest as corners, edges, or other salient structures present in the imagery. As the system’s third step, feature description is invoked. It necessitates generating a descriptor for the identified features, facilitating their recognition and matching across disparate images. Prominent methodologies associated with feature detection and description encompass scale-invariant feature transform (SIFT) [27], speed-up robust features (SURF) [28], oriented FAST and rotated BRIEF (ORB), and binary robust invariant scalable key points (BRISK) [29]. Specifically, the procedures of the SURF algorithm are delineated as follows:
  • Constructing a scale space and the Hessian matrix: The H matrix is a square matrix composed of the second-order partial derivatives of a multivariate function, providing local curvature information of the function at a given point. The Hessian matrix of a pixel in the image is shown as in (1):
H f x , y = 2 f x 2 2 f x y 2 f x y 2 f y 2
  • Since the feature points need to be scale-independent, Gaussian filtering is required before building the Hessian matrix [28], as shown in (2):
H ( x , σ ) = L x x ( x , y , σ ) L x y ( x , y , σ ) L x y ( x , y , σ ) L y y ( x , y , σ )
where L x x ( x , σ ) is the convolution of the Gaussian second-order partial derivatives at pixel point x , y .
2.
Key points detection: Key points are detected by finding extreme points in the scale space and image plane. SURF uses the determinant and trace of the Hessian matrix to determine whether it is a key point and performs non-maximum suppression to retain a unique and stable key point.
3.
Principal direction allocation of feature points: For each detected key point, its main direction is calculated so that the feature has rotational invariance. SURF uses the direction of the Haar wavelet response to estimate the principal direction.
4.
Generating feature point descriptors: Taking the feature points as the center, the image is divided into 4 × 4 sub-blocks along the principal direction, and each sub-block statistically contains four values of Haar wavelet features, forming a 64-dimensional vector as a feature descriptor.

3.2. Feature Matching

After extracting features using the method described in Section 3.1 for two consecutive image frames, feature matching is performed using the brute-force [30] approach. Firstly, all the feature points are traversed, and feature points x t m with m = 1 , 2 M are extracted from image It, while feature points x t + 1 n with n = 1,2 N are extracted from image It+1. For each feature point x t m , the distance to all x t + 1 n descriptors is measured and sorted, selecting the closest one as the matching point. The distance between descriptors represents the similarity between two features, and for binary descriptors, the Hamming distance is used as the metric.
In tunnels, the rollers undergo vibrational compaction, making them susceptible to disturbances such as vibrational noise and fluctuations in illumination. Such disturbances can lead to mismatches of features, which can introduce substantial inaccuracies in pose estimations. To address this, the random sample consensus (RANSAC) algorithm [31] is adopted for outlier removal. Drawing from the set of feature points extracted in Section 3.1, a subset is randomly sampled to compute a motion model, serving as a hypothesis. This model is then utilized to validate the remaining feature points. Points that align closely with this model are retained as matched feature points, while others, considered as outliers, are eliminated.

3.3. Pose Estimation

Matched feature points are utilized to estimate the changes in the camera’s pose. In this study, a stereo camera was employed, and the depth map was known. This allows for the use of the perspective-n-point (PnP) method for pose estimation and the formulation of a bundle adjustment [32] problem to optimize the camera’s pose. Let the coordinates of a point in the world coordinate system be represented as P i = [ X i , Y i , Z i ] T , and its projected pixel coordinates be u i = [ u i , v i ] T . The relationship between the pixel position and the spatial point’s position is given by s i u i = K T P i , where K denotes the camera’s intrinsic parameters: K   = [ f x , 0 , c x ; 0 , f y , c y ; 0,0 , 1 ] and T represents the camera’s pose. Due to the unknown camera pose and noise from observation points, errors were generated. A least-squares problem was constructed to find a suitable camera pose and minimize the error, as shown in Equation (3):
T * = a r g m i n 1 2 i = 1 n u i 1 s i K T P i 2 2
e δ T = lim δ T 0 e δ T T e ( T ) δ T = e P P δ T
e δ T = f x Z 0 f x X Z 2 f x X Y Z 2 f x + f x X 2 Z 2 f x Y Z 0 f x Z f y Y Z 2 f y f y Y 2 Z 2 f y X Y Z 2 f y X Z
Optimization was performed on the camera pose T . In the camera coordinate system, the coordinates of the spatial point are represented as P = ( T P ) 1 : 3 = [ X , Y , Z ] T , u = f x X Z + c x , v = f y Y Z + c y . The goal was to compute its Jacobian matrix, representing the first-order variation of the reprojection error with respect to the camera pose, as illustrated in Equations (4) and (5).

3.4. Evaluation Indicators

The evaluation criteria examine the invariance of the system’s feature extraction and description algorithms during motion, as well as robustness to factors such as illumination and vibration noise. The evaluation metrics for feature extraction and description include matching accuracy and real-time performance. For the vibratory compaction of rollers in tunnels, we chose feature extraction and detection algorithms with higher matching accuracy and real-time performance that meet the requirements for unmanned driving.
Matching accuracy denotes the likelihood that two images will correctly match feature points. It typically encompasses two metrics, precision and recall, defined by four statistics: true positive (TP) is the number of correctly matched feature points; true negative (TN) is the number of correctly rejected matching feature points; false positive (FP) is the number of feature points that should be rejected, but produce a match; and false negative (FN) is the number of feature points that should have been matched, but were rejected. The definition of precision is p r e c i s i o n = T P / T P + F P . The recall formula is r e c a l l = T P / T P + F N .

4. Result & Discussion

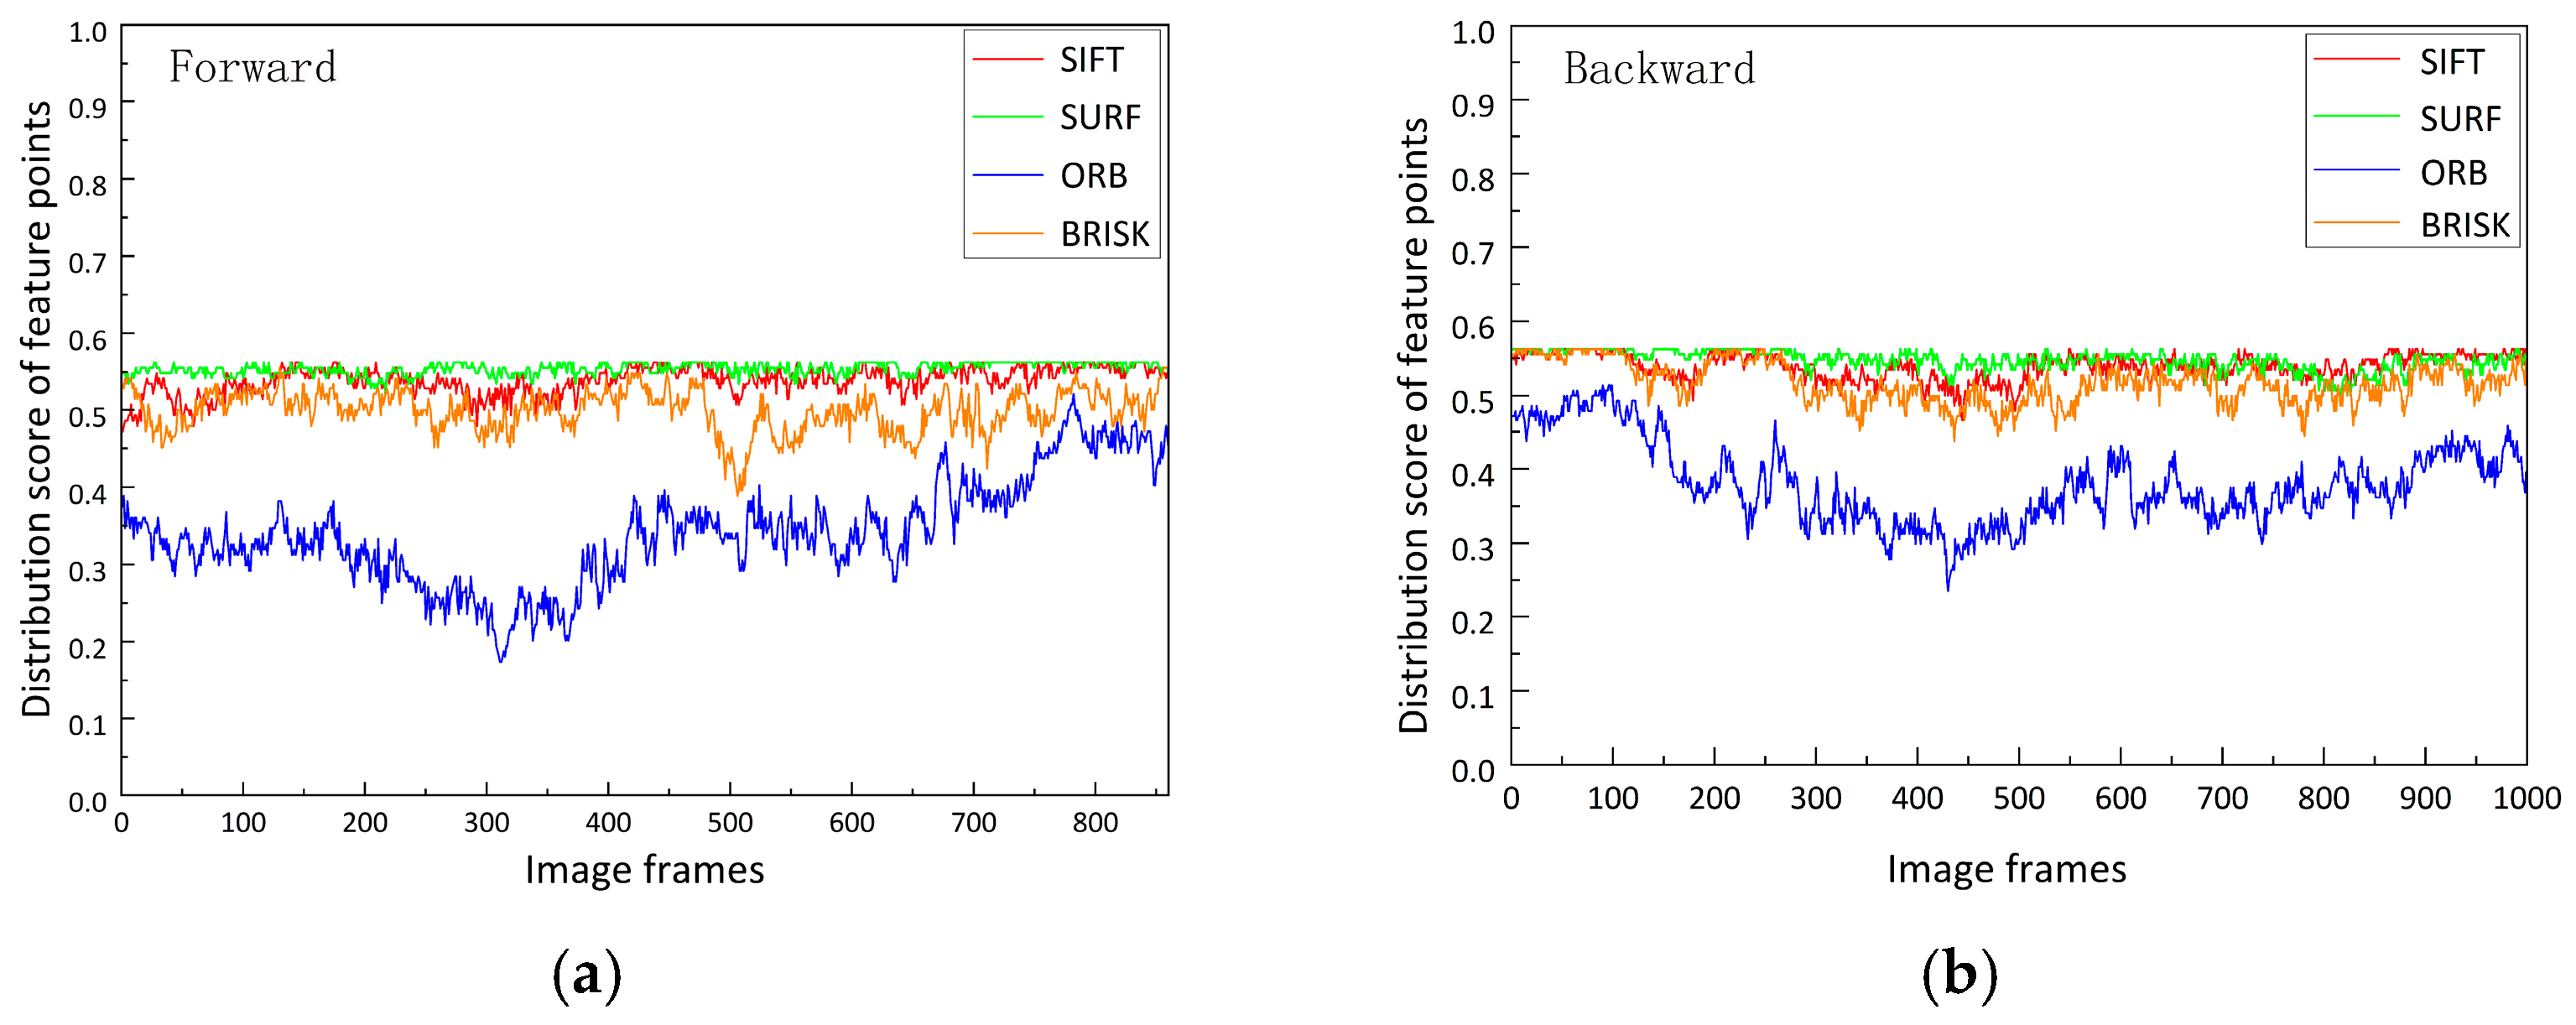
4.1. Feature Extraction

Prior to the experiment, a 10 m white line was delineated on the loose soil within the testing area. The roller, operated manually, compacted along this path, while continuous image frames were captured by a stereo camera. During the compaction, where the roller operated within a low-texture setting with active vibrational compaction, feature extraction was executed using the SIFT, SURF, ORB, and BRISK algorithms. Each method identified 1000 feature points, represented as red markers in Figure 2. Specifically, Figure 2a illustrates the result of feature extraction from a frame in the forward trajectory, while Figure 2b represents the result from the backward direction. Figure 2 shows that the feature points extracted by ORB and BRISK were relatively concentrated, mainly distributed in areas with obvious landmarks and compaction marks. In contrast, the distribution of feature points by SURF was the most uniform. An excessive concentration of such features could result in an insufficiency in other zones, compromising the robustness and precision of the visual odometry. As such, it is imperative to ensure a balanced distribution of features.
When quantitatively analyzing the effect of feature extraction, the same two frames of images were still selected. The images, sized at 1280 × 720, were divided into 16 × 9 image blocks, with each block measuring 80 × 80 pixels. The number of feature points within each image block was meticulously counted, and the results were used to create two-dimensional scatter plots depicting the feature point distribution, as illustrated in Figure 3. Each bin in the scatter plot represented an 80 × 80 image block. Counting the number M of bins that were not zero in the histogram, the corresponding feature point distribution performance index was ω ~ = M / ( 16 × 9 ) , and the closer the value of ω ~ was to 1, the better the feature point distribution performance.
The distributions of feature points in a frame when the roller moves forward and backward are illustrated in Figure 3a,b. Due to the impact of the low texture and vibration noise, the feature points extracted by the ORB and BRISK algorithms were concentrated in certain areas with distinct features, showing poor uniformity. This can lead to reduced accuracy in pose estimation. In contrast, the feature distributions obtained by the SIFT and SURF algorithms were more uniform. Building on this, a scoring analysis of the feature distribution in consecutive frames during the forward and backward movement is depicted in Figure 4. The distribution scores ω ~ for the SIFT and SURF algorithms were greater than those for ORB and BRISK, and this value consistently remained around 0.55 in successive images. They indicated better robustness, ensuring accuracy in feature matching and subsequently enhancing the precision of pose estimation.

4.2. Feature Matching

To ensure the consistency of the experiment, the SIFT, SURF, ORB, and BRISK algorithms were used to perform feature matching on the two consecutive frames described in Section 4.1. Subsequently, RANSAC was employed to eliminate mismatched points. The matching results are presented in Figure 5a,b, where the left image displays matches in the forward direction and the right image shows those in the backward direction. The number of matches for both directions, obtained by the four algorithms, is depicted in Figure 6. After outlier removal with RANSAC, SIFT yielded 538 and 670 feature points, respectively. The corresponding values for ORB were 329 and 312. SURF achieved the highest number of feature points, totaling 869 and 725, whereas BRISK had the fewest, with only 94 and 93 in the respective directions. Combining the analyses from Figure 5 and Figure 6, it can be deduced that in tunnels, SURF yields the highest number of correct feature points, thereby providing a solid foundation for subsequent pose estimation.

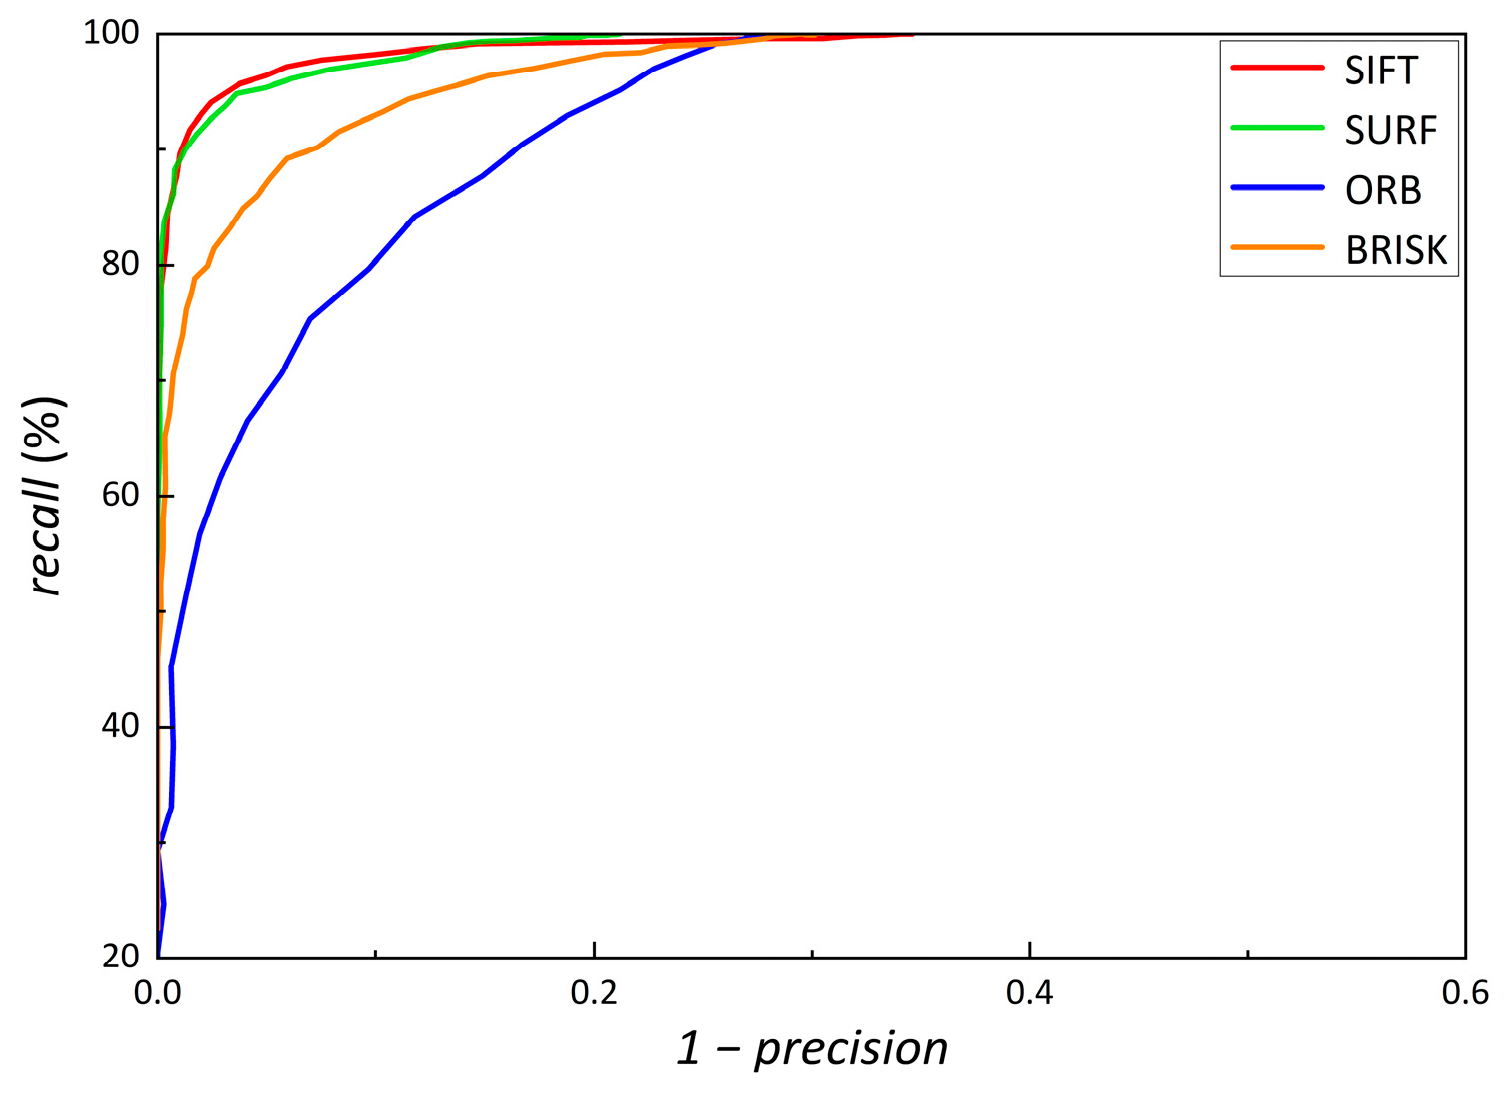
4.3. Precision and Recall

Based on the precision and recall in Section 3.4, the TP and FP values were computed by adjusting the thresholds of Euclidean distance or Hamming distance between the matched image and the reference image. Subsequently, precision and recall were calculated to compare the performances of SIFT, SURF, ORB, and BRISK, as illustrated in Figure 7. Ideally, any value of 1 p r e c i s i o n would correspond to a recall of 1. In practice, the closer the curve comes to approaching the upper left corner, the better the matching performance was. In the current experimental setting, the recall performances of the SIFT and SURF algorithms were comparable. When precision was around 80%, the recall was close to 100%. This indicates that SIFT and SURF introduce fewer mismatches in feature matching, rendering them more robust. However, the recall of the ORB was scenario-dependent. At approximately 70% precision, the recall was close to 100%, but it introduced more mismatches, leading to reduced robustness. BRISK was in the middle position.

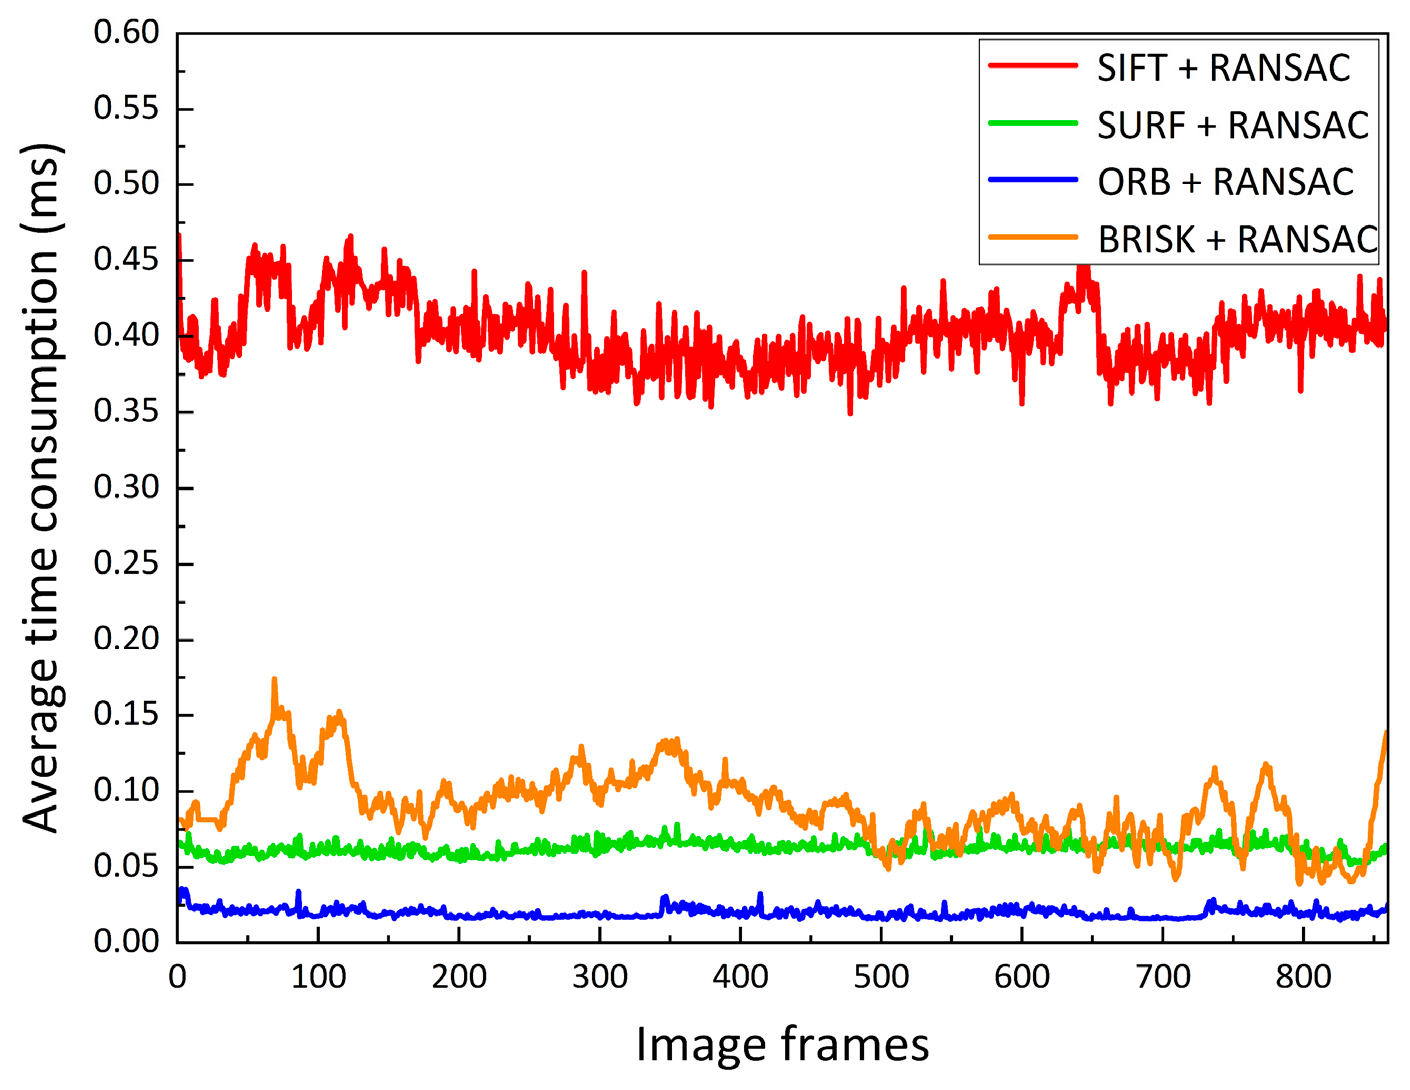
4.4. Real-Time Performance

Feature point extraction, description, and matching were performed on adjacent pairs of images. The time taken for each step was recorded, and the number of feature points extracted in each image was known, allowing us to calculate the average time of extraction, description, and matching for per individual feature point. The average times for each step of the SIFT, SURF, ORB, and BRISK methods were compiled and are presented in Table 1. By summing up these average times, the overall average processing time was obtained. Subsequently, continuous images of the roller in the forward direction were collected, and the frame-by-frame processing times for each algorithm are thoughtfully plotted in Figure 8. Based on the comprehensive data, it is evident that ORB exhibited the least processing time, while SIFT took the longest, and BRISK showed more significant fluctuations in performance. Considering a camera frequency of 15 Hz, it is essential for the total processing time per feature point to be less than 0.1 ms. As a result, SIFT and BRISK failed to meet the real-time requirements, while SURF and ORB confidently met them.

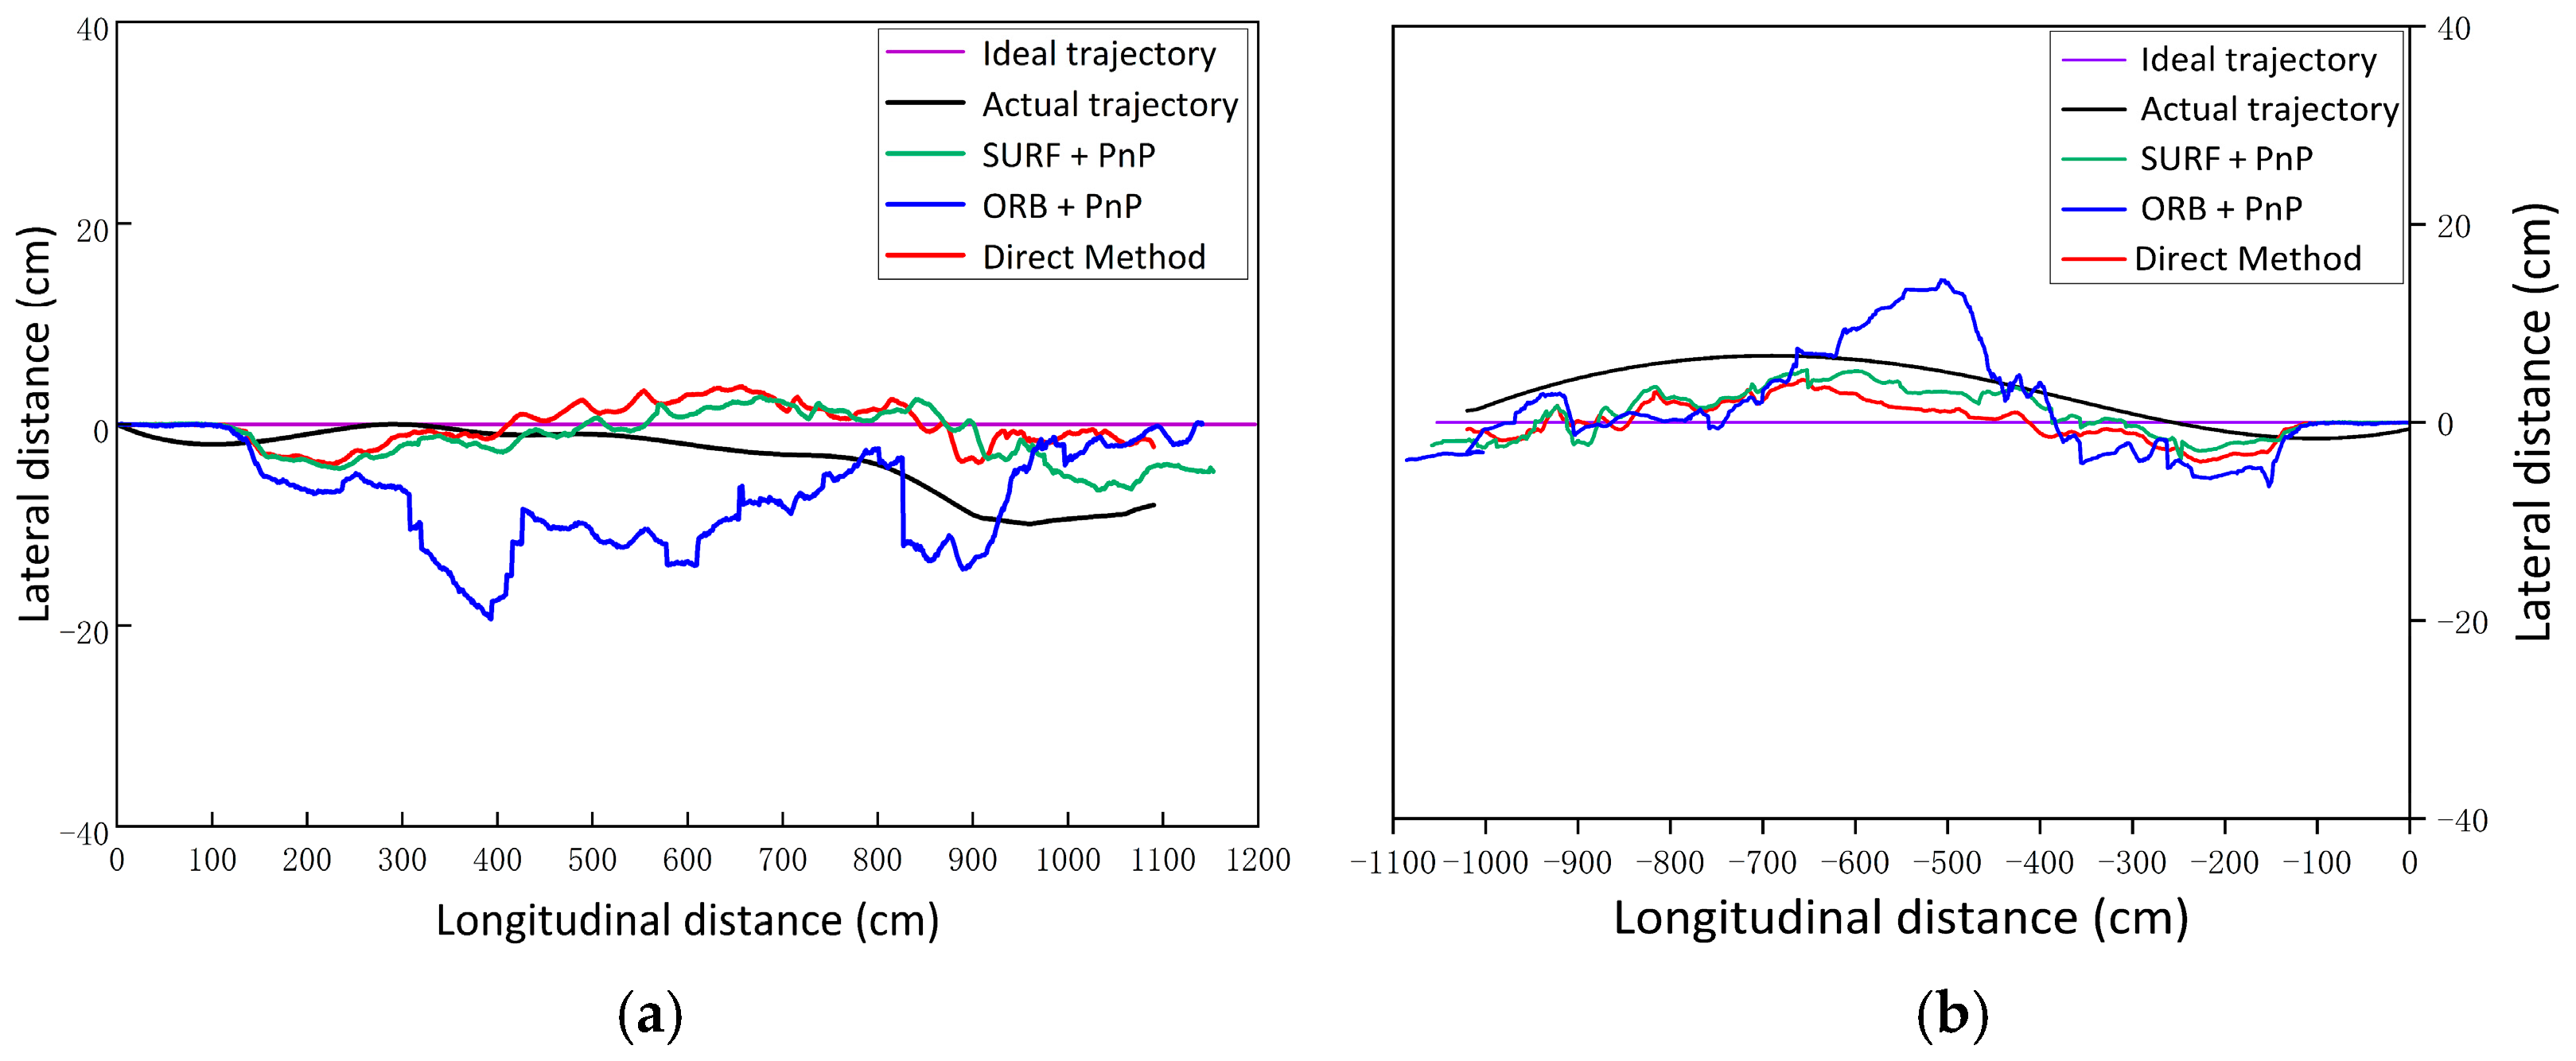
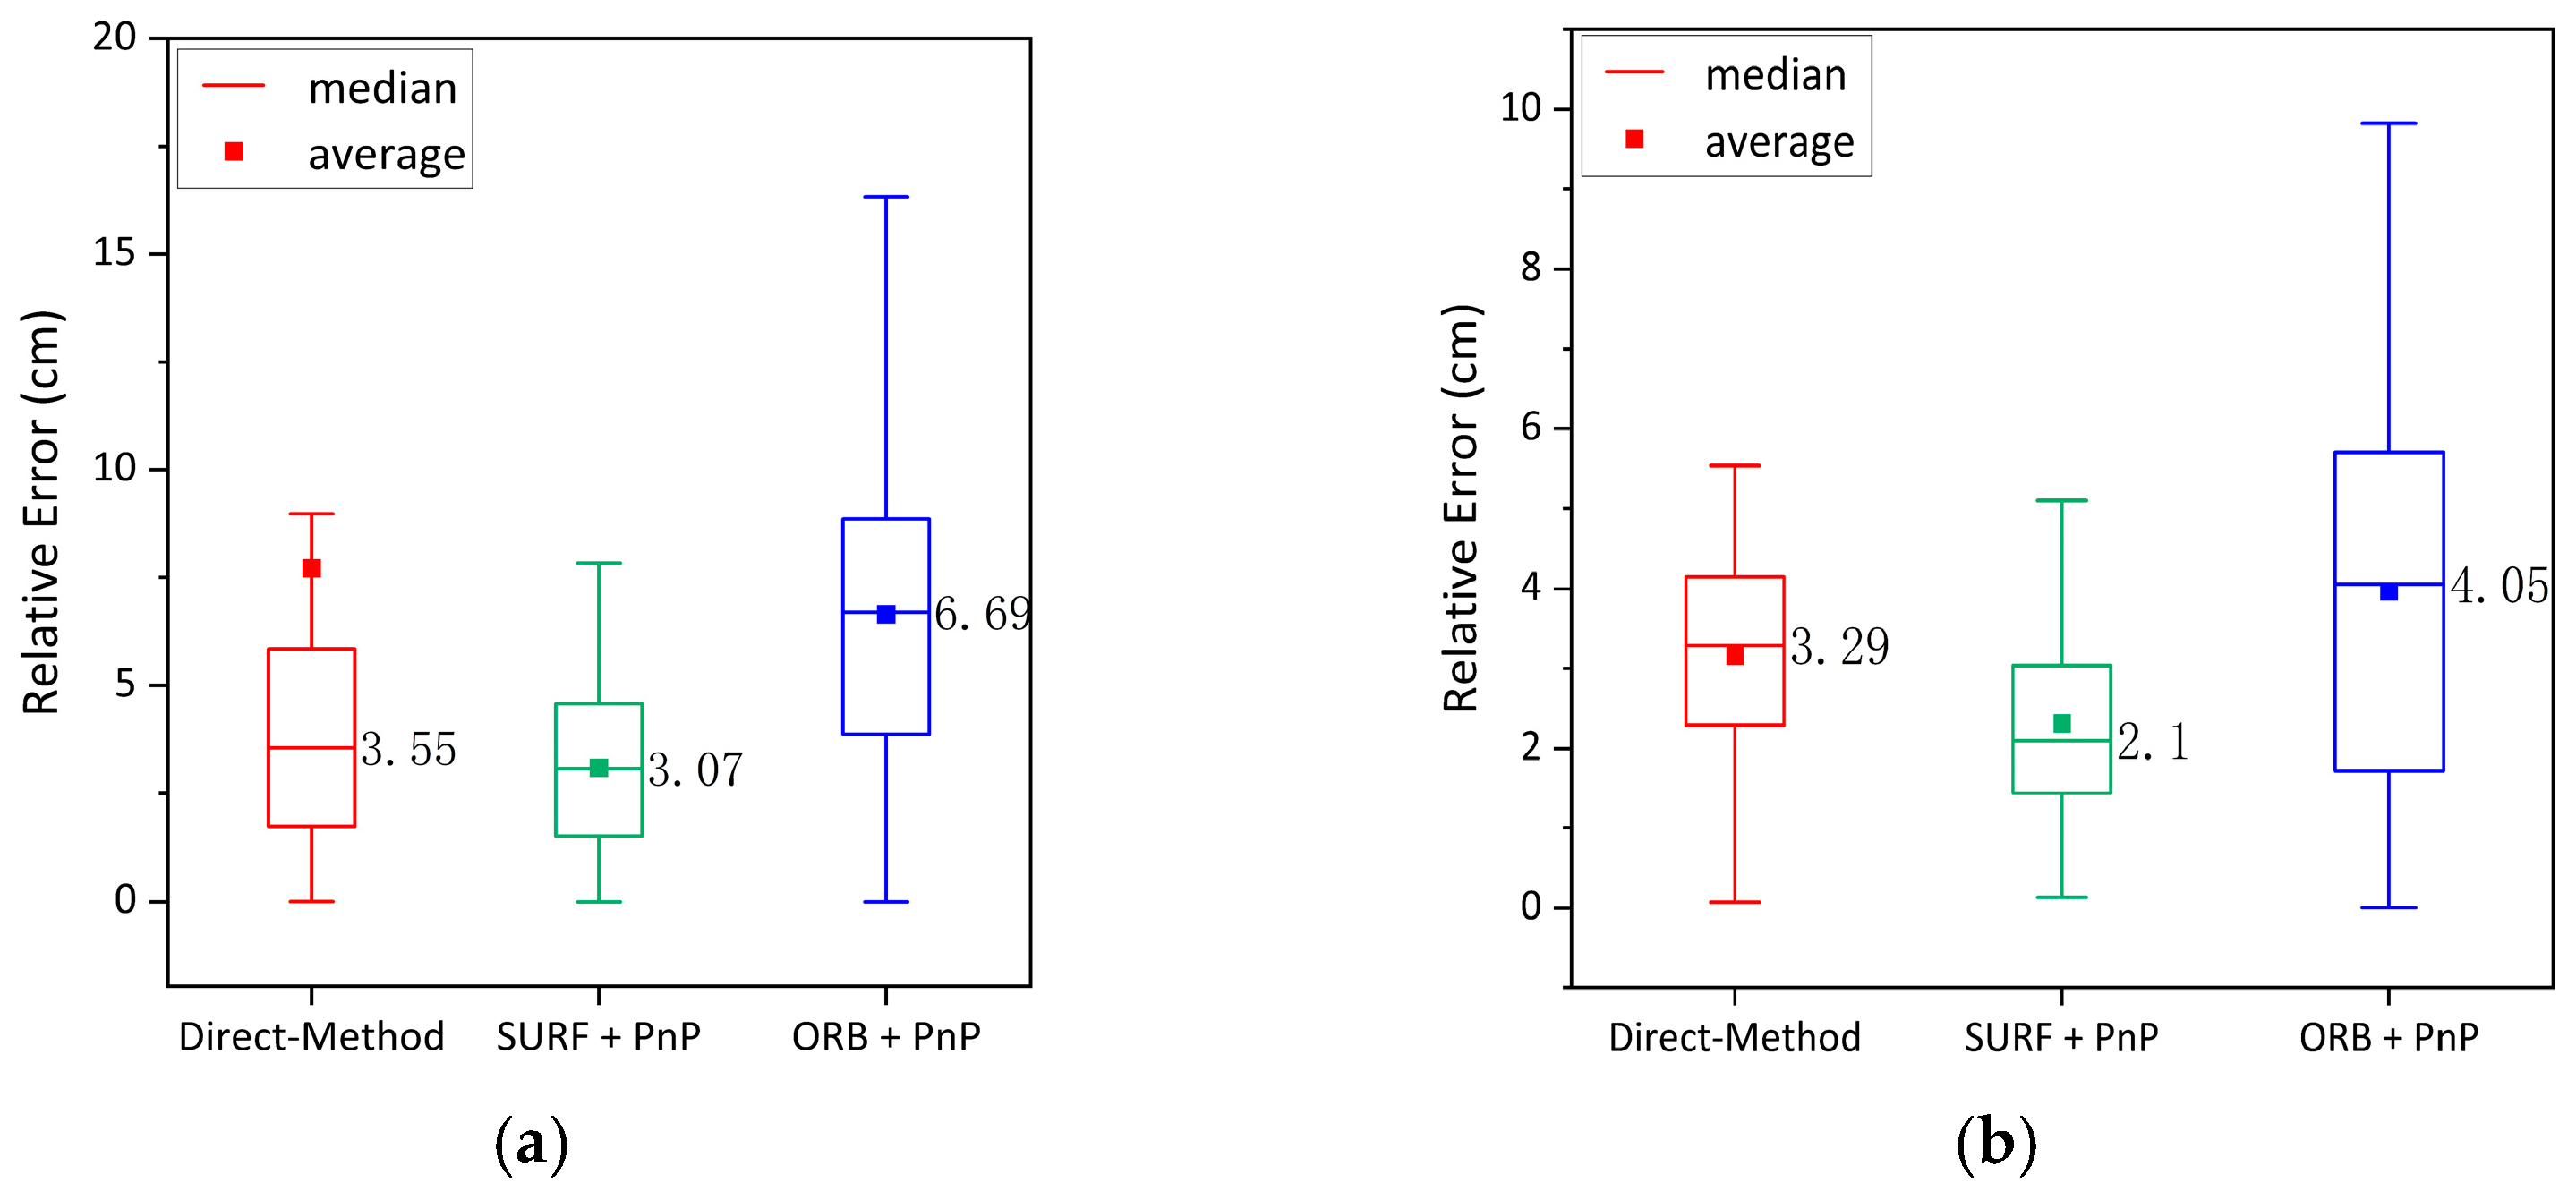
4.5. Pose Estimation

During the compaction phase, the roller compacted in both the forward and backward directions. After Section 4.1, Section 4.2, Section 4.3 and Section 4.4, the roller’s 3D compaction trajectory was solved by pose estimation. The roller’s construction scenario can be approximated as a 2D plane, and the elevation information from the 3D trajectory was omitted, resulting in Figure 9a,b. The trajectories determined by the SURF + PnP and ORB + PnP algorithms are delineated by the green and blue lines, respectively, while the trajectory derived from the direct method is indicated by the red line. Under optimal conditions, the roller should conform to a compaction path devoid of any lateral deviations, as represented by the purple line in Figure 9. However, in practice, the roller’s steering cylinder affects its ability to follow a purely straight path. Consequently, within our simulated tunnel milieu, the real-time compaction trajectory of the roller was meticulously documented, as evidenced by the black line in Figure 9.
The trajectories delineated from three distinct visual odometry methodologies during the roller’s forward and backward movements were juxtaposed against actual trajectories, revealing the lateral relative error, as depicted in Figure 10a,b. During the forward compaction, the trajectory derived from the SURF + PnP method had a maximum relative error of 7.91 cm and a median error of 3.07 cm. In comparison, the direct method yielded values of 9.03 cm and 3.55 cm, respectively, while the ORB + PnP method produced values of 17.16 cm and 6.69 cm. During the backward compaction, the trajectory derived from the SURF + PnP method showed a maximum relative error of 5.24 cm and a median error of 2.1 cm. In contrast, the direct method resulted in values of 5.62 cm and 3.29 cm, respectively, and the ORB + PnP method recorded values of 9.89 cm and 4.05 cm. Consequently, the trajectory determined by the SURF + PnP method exhibited the smallest maximum relative error and the narrowest range of relative errors, indicating the best algorithmic stability.

5. Conclusions

In the compaction of rollers, except compaction speed and the number of rolling passes, the overlapping width emerges as a paramount metric. It refers to the repeated compaction width between adjacent rolling passes. Consequently, this study emphasizes the significance of the lateral deviation. By comparing the theoretical trajectory of the roller, the actual rolling trajectory, and the trajectories estimated by three types of visual odometers, the performance indicators of different feature extraction and matching methods were analyzed. The analysis aided us in selecting a visual odometry algorithm for unmanned rollers that offers higher accuracy, robustness, and real-time performance. The visual odometry predicated on BRISK, owing to its limited correctly matched feature points, led to significant errors in pose estimation. In addition, SIFT failed to satisfy the real-time performance requirements. Due to the camera being situated in tunnels characterized by low texture and vibrations, the visual odometry estimates based on ORB and the direct method resulted in larger relative errors in the compaction. This made it challenging to meet the overlapping width in autonomous compaction. Conversely, the compaction trajectory derived using SURF exhibited the smallest lateral relative error and was the most stable. Therefore, the system used SURF + PnP as a visual odometer method for unmanned rollers in tunnels. As the focal point of this manuscript revolves around the precision analysis of visual odometry in tunnels, backend optimization and loop closure detection were not incorporated, potentially leading to the accrual of errors. In future work, we will integrate the aforementioned steps to further enhance the accuracy and performance of the unmanned roller’s SLAM system.

Author Contributions

Conceptualization, H.H., X.W. and Y.H.; methodology, H.H., P.T. and Y.H; software, H.H.; validation, H.H. and P.T.; formal analysis, H.H.; writing—original draft preparation, H.H.; writing—review and editing, H.H. and P.T.; supervision, X.W. and Y.H.; project administration, X.W. and Y.H.; funding acquisition, X.W. and Y.H. All authors have read and agreed to the published version of the manuscript.

Funding

This research was funded by the National Natural Science Foundation of China, grant number 61901056, and the Youth Science Foundation of the National Natural Science Foundation of China, grant number 52005048.

Data Availability Statement

Data sharing is not applicable.

Acknowledgments

Thank you for the support from the National Natural Science Foundation of China (61901056) and the Youth Science Foundation of the National Natural Science Foundation of China (52005048). The author would like to thank the reviewers and editors for their insightful comments, which have helped to improve the quality of this article.

Conflicts of Interest

The authors declare no conflict of interest.

Abbreviations

BRIEFBinary robust independent elementary features
BRISKBinary robust invariant scalable key-points
CenSurECenter surround extremas
DSODirect sparse odometry
DTAMDense tracking and mapping
FASTFeatures from accelerated segment test
FLANNFast library for approximate nearest neighbors
FNFalse negative
FPFalse positive
FREAKFast retina key point
GNSSGlobal navigation satellite system
GPUGraphic processing unit
LSD-SLAMLarge-scale direct monocular SLAM
NASANational Aeronautics and Space Administration
ORBOriented FAST and rotated BRIEF
ORB-SLAM2Oriented FAST and rotated BRIEF simultaneous localization and mapping 2
PnPperspective-n-point
RANSACRandom sample consensus
RGB-DRGB-depth
RTKReal-time kinematic
SURFSpeed-up robust features
SIFTScale-invariant feature transform
SVOSemi-direct visual odometry
TPTrue positive
TNTrue negative
V-SLAMVisual simultaneous localization and mapping
VOVisual odometry

References

  1. Zhang, Q.; An, Z.; Liu, T.; Zhang, Z.; Huangfu, Z.; Li, Q.; Yang, Q.; Liu, J. Intelligent rolling compaction system for earth-rock dams. Autom. Constr. 2020, 116, 103246. [Google Scholar] [CrossRef]
  2. Shi, M.; Wang, J.; Li, Q.; Cui, B.; Guan, S.; Zeng, T. Accelerated Earth-Rockfill Dam Compaction by Collaborative Operation of Unmanned Roller Fleet. J. Constr. Eng. Manag. 2022, 148, 04022046. [Google Scholar] [CrossRef]
  3. Fang, X.; Bian, Y.; Yang, M.; Liu, G. Development of a path following control model for an unmanned vibratory roller in vibration compaction. Adv. Mech. Eng. 2018, 10, 1687814018773660. [Google Scholar] [CrossRef]
  4. Zhang, Q.; Liu, T.; Zhang, Z.; Huangfu, Z.; Li, Q.; An, Z. Unmanned rolling compaction system for rockfill materials. Autom. Constr. 2019, 100, 103–117. [Google Scholar] [CrossRef]
  5. Yang, M.; Bian, Y.; Liu, G.; Zhang, H. Path Tracking Control of an Articulated Road Roller with Sideslip Compensation. IEEE Access 2020, 8, 127981–127992. [Google Scholar] [CrossRef]
  6. Tak, S.; Buchholz, B.; Punnett, L.; Moir, S.; Paquet, V.; Fulmer, S.; Marucci-Wellman, H.; Wegman, D. Physical ergonomic hazards in highway tunnel construction: Overview from the Construction Occupational Health Program. Appl. Ergon. 2011, 42, 665–671. [Google Scholar] [CrossRef] [PubMed]
  7. Chen, C.; Hu, Y.; Jia, F.; Wang, X. Intelligent compaction quality evaluation based on multi-domain analysis and artificial neural network. Constr. Build. Mater. 2022, 341, 127583. [Google Scholar] [CrossRef]
  8. Lu, T.; Liu, Y.; Yang, Y.; Wang, H.; Zhang, X. A Monocular Visual Localization Algorithm for Large-Scale Indoor Environments through Matching a Prior Semantic Map. Electronics 2022, 11, 3396. [Google Scholar] [CrossRef]
  9. Xuexi, Z.; Guokun, L.; Genping, F.; Dongliang, X.; Shiliu, L. SLAM Algorithm Analysis of Mobile Robot Based on Lidar. In Proceedings of the 2019 Chinese Control Conference, Guangzhou, China, 27–30 July 2019; pp. 4739–4745. [Google Scholar] [CrossRef]
  10. Xia, X.; Bhatt, N.P.; Khajepour, A.; Hashemi, E. Integrated Inertial-LiDAR-Based Map Matching Localization for Varying Environments. IEEE Trans. Intell. Veh. 2023, 1, 1–12. [Google Scholar] [CrossRef]
  11. Fuentes-Pacheco, J.; Ruiz-Ascencio, J.; Rendón-Mancha, J.M. Visual simultaneous localization and mapping: A survey. Artif. Intell. Rev. 2015, 43, 55–81. [Google Scholar] [CrossRef]
  12. Cheng, Y.; Maimone, M.; Matthies, L. Visual odometry on the Mars exploration rovers. In Proceedings of the 2005 IEEE Inter-national Conference on Systems, Man and Cybernetics, Waikoloa, HI, USA, 10–12 October 2005; pp. 903–910. [Google Scholar]
  13. Nistér, D.; Naroditsky, O.; Bergen, J. Visual odometry. In Proceedings of the 2004 IEEE Computer Society Conference on Computer Vision and Pattern Recognition, Washington, DC, USA, 27 June–2 July 2004; p. I-I. [Google Scholar]
  14. Newcombe, R.A.; Lovegrove, S.J.; Davison, A.J. DTAM: Dense tracking and mapping in real-time. In Proceedings of the 2011 International Conference on Computer Vision, Barcelona, Spain, 6–13 November 2011; pp. 2320–2327. [Google Scholar]
  15. Engel, J.; Schöps, T.; Cremers, D. LSD-SLAM: Large-scale direct monocular SLAM. In Proceedings of the 13th European Con-ference on Computer Vision, Zurich, Switzerland, 6–12 September 2014; pp. 834–849. [Google Scholar]
  16. Engel, J.; Stückler, J.; Cremers, D. Large-scale direct SLAM with stereo cameras. In Proceedings of the 2015 IEEE/RSJ Interna-tional Conference on Intelligent Robots and Systems (IROS), Hamburg, Germany, 28 September–2 October 2015; pp. 1935–1942. [Google Scholar]
  17. Caruso, D.; Engel, J.; Cremers, D. Large-scale direct SLAM for omnidirectional cameras. In Proceedings of the 2015 IEEE/RSJ International Conference on Intelligent Robots and Systems (IROS), Hamburg, Germany, 28 September–2 October 2015; pp. 141–148. [Google Scholar]
  18. Engel, J.; Sturm, J.; Cremers, D. Semi-dense visual odometry for a monocular camera. In Proceedings of the IEEE International Conference on Computer Vision, Sydney, Australia, 1–8 December 2013; pp. 1449–1456. [Google Scholar]
  19. Forster, C.; Pizzoli, M.; Scaramuzza, D. SVO: Fast semi-direct monocular visual odometry. In Proceedings of the 2014 IEEE International Conference on Robotics and Automation (ICRA), Hong Kong, China, 31 May–7 June 2014; pp. 15–22. [Google Scholar]
  20. Mur-Artal, R.; Montiel, J.M.M.; Tardos, J.D. ORB-SLAM: A Versatile and Accurate Monocular SLAM System. IEEE Trans. Robot. 2015, 31, 1147–1163. [Google Scholar] [CrossRef]
  21. Rublee, E.; Rabaud, V.; Konolige, K.; Bradski, G. ORB: An efficient alternative to SIFT or SURF. In Proceedings of the 2011 International Conference on Computer Vision, Barcelona, Spain, 6–13 November 2011; pp. 2564–2571. [Google Scholar]
  22. Lin, M.; Yang, C.; Li, D.; Zhou, G. Intelligent Filter-Based SLAM for Mobile Robots with Improved Localization Performance. IEEE Access 2019, 7, 113284–113297. [Google Scholar] [CrossRef]
  23. Calonder, M.; Lepetit, V.; Strecha, C.; Fua, P. BRIEF: Binary robust independent elementary features. In Proceedings of the 11th European Conference on Computer Vision, Heraklion, Greece, 5–11 September 2010; pp. 778–792. [Google Scholar]
  24. Zhang, T.; Liu, C.; Li, J.; Pang, M.; Wang, M. A New Visual Inertial Simultaneous Localization and Mapping (SLAM) Algorithm Based on Point and Line Features. Drones 2022, 6, 23. [Google Scholar] [CrossRef]
  25. He, M.; Zhu, C.; Huang, Q.; Ren, B.; Liu, J. A review of monocular visual odometry. Vis. Comput. 2019, 36, 1053–1065. [Google Scholar] [CrossRef]
  26. Wu, D.; Wang, M.; Li, Q.; Xu, W.; Zhang, T.; Ma, Z. Visual Odometry with Point and Line Features Based on Underground Tunnel Environment. IEEE Access 2023, 11, 24003–24015. [Google Scholar] [CrossRef]
  27. Gupta, S.; Kumar, M.; Garg, A. Improved object recognition results using SIFT and ORB feature detector. Multimed. Tools Appl. 2019, 78, 34157–34171. [Google Scholar] [CrossRef]
  28. Bay, H.; Tuytelaars, T.; Van Gool, L. Surf: Speeded up robust features. In Proceedings of the 9th European Conference on Computer Vision, Graz, Austria, 7–13 May 2006; pp. 404–417. [Google Scholar]
  29. Leutenegger, S.; Chli, M.; Siegwart, R.Y. BRISK: Binary robust invariant scalable keypoints. In Proceedings of the 2011 International Conference on Computer Vision, Barcelona, Spain, 6–13 November 2011; pp. 2548–2555. [Google Scholar]
  30. Jakubovic, A.; Velagic, J. Image Feature Matching and Object Detection Using Brute-Force Matchers. In Proceedings of the 2018 International Symposium ELMAR, Zadar, Croatia, 16–19 September 2018; pp. 83–86. [Google Scholar] [CrossRef]
  31. Guo, G.; Dai, Z.; Dai, Y. Robust stereo visual odometry: A comparison of random sample consensus algorithms based on three major hypothesis generators. J. Navig. 2022, 75, 1298–1309. [Google Scholar] [CrossRef]
  32. Eudes, A.; Lhuillier, M.; Naudet-Collette, S.; Dhome, M. Fast Odometry Integration in Local Bundle Adjustment-Based Visual SLAM. In Proceedings of the 20th International Conference on Pattern Recognition, Istanbul, Turkey, 23–26 August 2010; pp. 290–293. [Google Scholar]
Figure 1. (a) Sensor distribution of roller; (b) test site.
Electronics 12 04202 g001
Figure 2. Distribution of features for SIFT, SURF, ORB, and BRISK. (a) Forward; (b) backward.
Electronics 12 04202 g002
Figure 3. Distribution of feature points in image blocks. (a) Forward; (b) backward.
Electronics 12 04202 g003
Figure 4. Distribution score of feature points in continuous images. (a) Forward; (b) backward.
Electronics 12 04202 g004
Figure 5. Feature matching of SIFT, SURF, ORB, and BRISK. (a) Forward; (b) backward.
Electronics 12 04202 g005
Figure 6. Number of matched features of SIFT, SURF, ORB, and BRISK.
Electronics 12 04202 g006
Figure 7. Precision and recall of SIFT, SURF, ORB, and BRISK.
Electronics 12 04202 g007
Figure 8. Average time consumption of continuous images.
Electronics 12 04202 g008
Figure 9. 2D compaction trajectory of the roller. (a) Forward; (b) backward.
Electronics 12 04202 g009
Figure 10. Lateral relative error. (a) Forward; (b) backward.
Electronics 12 04202 g010
Table 1. The average time spent on each step of SIFT, SURF, ORB and BRISK.
AlgorithmFeature Extraction (ms)Feature Description (ms)Feature Matching (ms)Average Total Time Consumption (ms)
SIFT 0.22590.19420.01840.4386
SURF0.03160.02050.01250.0646
ORB0.01980.00930.00150.026
BRISK0.04270.02750.03920.1094
Disclaimer/Publisher’s Note: The statements, opinions and data contained in all publications are solely those of the individual author(s) and contributor(s) and not of MDPI and/or the editor(s). MDPI and/or the editor(s) disclaim responsibility for any injury to people or property resulting from any ideas, methods, instructions or products referred to in the content.

