Article

Rolling Bearing Fault Feature Selection Method Based on a Clustering Hybrid Binary Cuckoo Search

1
Key Laboratory of Grain Information Processing and Control, Ministry of Education, Henan University of Technology, Zhengzhou 450001, China
2
Zhengzhou Key Laboratory of Machine Perception and Intelligent System, Henan University of Technology, Zhengzhou 450001, China
3
School of Electrical Engineering, Henan University of Technology, Zhengzhou 450001, China
*
Author to whom correspondence should be addressed.
Electronics 2023, 12(2), 459; https://doi.org/10.3390/electronics12020459
Submission received: 7 December 2022 / Revised: 4 January 2023 / Accepted: 14 January 2023 / Published: 16 January 2023

Abstract

:
In order to solve the low accuracy in rolling bearing fault diagnosis caused by irrelevant and redundant features, a feature selection method based on a clustering hybrid binary cuckoo search is proposed. First, the measured motor signal is processed by Hilbert–Huang transform technology to extract fault features. Second, a clustering hybrid initialization technique is given for feature selection, combining the Louvain algorithm and the feature number. Third, a mutation strategy based on Levy flight is proposed, which effectively utilizes high-quality information to guide subsequent searches. In addition, a dynamic abandonment probability is proposed based on population sorting, which can effectively retain high-quality solutions and accelerate the convergence of the algorithm. Experimental results from nine UCI datasets show the effectiveness of the proposed improvement strategy. The open-source bearing dataset is used to compare the fault diagnosis accuracy of different algorithms. The experimental results show that the diagnostic error rate of this method is only 1.13%, which significantly improves classification accuracy and effectively realizes feature dimension reduction in fault datasets. Compared to similar methods, the proposed method has better comprehensive performance.

1. Introduction

With the development of modern industry, motors are ubiquitous in manufacturing applications [1]. Rolling bearings are the core components and vulnerable parts of machinery. Their health directly affects the performance, efficiency, stability, and life of the machine. According to statistics from the American Electric Power Research Institute, 41% of motor faults are caused by bearing damage, which is the primary cause of motor faults [2]. In order to maintain the safe operation of equipment, early identification of rolling bearing defects is essential [3].
Traditional bearing fault diagnosis is mainly based on model analysis and signal processing [4]. However, these two methods often rely on the accumulation of experience. Due to the limitations of these two methods, they cannot meet the reliability requirements of modern production equipment. With the development of artificial intelligence technology, fault diagnosis methods based on machine learning show good performance in terms of motor health detection. Machine learning-based bearing fault diagnosis can be divided into three steps. The first step is to extract features, the second step is feature selection, and the third step is classifier recognition [5].
Extraction of the running data of the bearings is an important step in the realization of rolling bearing condition monitoring. Feature extraction is the process of extracting attributes from motor signals [6]. So far, researchers have studied various information analysis techniques, such as the fast Fourier transform (FFT), envelope analysis (EA), wavelet transform (WT), and Hilbert–Huang transform (HHT) [7]. The HHT is one of the most widely used signal analysis tools in nonlinear and nonstationary signal analysis. Therefore, this paper uses HHT technology to extract fault features. Not all the time–frequency domain features extracted by HHT technology are conducive to fault diagnosis. Irrelevant and redundant features not only reduce the efficiency of model operation, but also lead to a decline in model recognition performance [8]. Therefore, in order to avoid the interference of redundant and irrelevant features, it is necessary to use effective methods that select the optimal feature subset from multi-dimensional features.
Feature selection is an essential data preprocessing method, which can effectively reduce data dimensionality and improve classification performance by removing redundant or irrelevant features [9]. Currently, two widely used strategies in feature selection methods are the filter and wrapper methods [10]. The filter method obtains the intrinsic correlation of features through univariate statistics. This method is independent of the learning algorithm, so filter calculation is cheaper than calculation using the wrapper method [11]. The wrapper method uses the classifier as part of the evaluation function, so it usually works better than filters. Recently, swarm intelligence algorithms such as the genetic algorithm (GA) [12], particle swarm optimization (PSO) [13], grey wolf optimization (GWO) [14], and crow search algorithm (CSA) [15] have been widely used in the search process of wrapper-based methods. Furthermore, the cuckoo search algorithm (CS) [16] is inspired by cuckoo production and breeding behavior. It is a promising metaheuristic algorithm due to having fewer adjustment parameters and good search ability. The CS algorithm has a more effective search ability than the GA and PSO [17]. However, the CS algorithm still faces the problems of slow convergence speed and random initialization when solving feature selection problem.
Based on the problems mentioned above, a feature selection method based on a clustering hybrid binary cuckoo search (CHBCS) is proposed. The main contributions of this study are briefly presented as follows:
  • Propose a strategy to extract the time–frequency domain features of motor signals based on the Hilbert–Huang transform.
  • In order to reduce redundant features in a population, a clustering hybrid initialization method is presented. The method uses the Louvain algorithm to cluster features and initializes the population according to the clustering information and the number of features, which can effectively remove redundant features.
  • A mutation strategy based on Levy flights is proposed to improve the update formula. This strategy can effectively utilize the high-quality information of the population by guiding the subsequent search with several high-quality individuals.
  • The proposed dynamic (Pa) probability strategy adaptively adjusts the (Pa) probability based on population rankings to preserve the high-quality solution of the current population.
This article is organized as follows. The related work is discussed in Section 2. Section 3 introduces the feature extraction method. Section 4 describes the proposed algorithm in detail. In Section 5, the effectiveness of the proposed CHBCS algorithm is verified by experiments. Finally, Section 6 provides the conclusion.

2. Related Work

Machine learning-based bearing fault diagnosis has been widely used in rotating machinery health condition monitoring. In machine learning, feature selection plays an important role in improving classifier performance [18].
Some researchers have previously studied filter-based feature selection methods. Cui et al. [19] selected fault features accurately according to approximate entropy and correlation parameters and applied this method to the fault diagnosis of gear reducers. Zheng et al. [20] proposed a bearing failure diagnosis method using Laplacian scores for the selection of features. The method uses multi-scale fuzzy entropy to characterize the complexity and irregularity of rolling bearing vibration signals and sorts the feature vectors according to the importance of features and their correlation with fault information. Tang et al. [21] proposed a feature selection method based on the maximum information coefficient to improve bearing fault diagnosis. This method uses the maximum information coefficient to consider the correlation between features and the correlation between features and fault categories for feature selection. Tang et al. [22] proposed the GL-mRMR-SVM feature selection model, which uses maximum correlation and minimum redundancy as feature selection criteria.
Compared to the above filtering-based feature selection methods, more research has focused on wrapper-based feature selection methods. Lu et al. [23] proposed a genetic algorithm feature selection method based on a dynamic search strategy and applied it to rotating machinery fault diagnosis. This method uses empirical mode decomposition and variable range coding to establish the feature set. The improved genetic algorithm with the dynamic search strategy is used to process the initial feature set. Finally, a support vector machine is used for classification. Rauber et al. [24] studied heterogeneous feature models and feature selection in bearing fault diagnosis. The signal features were extracted by a complex envelope spectrum, statistical time–frequency domain parameters, and wavelet packet analysis. A feature selection method based on the greedy method is used to process the feature set. Finally, a k-nearest neighbor classifier, feedforward network, and support vector machine are used for fault diagnosis. Shan et al. [25] proposed a rotating machinery fault diagnosis method based on improved variational mode decomposition (IVMD) and the hybrid artificial herd algorithm (HASA). This method uses IVMD to decompose the signal and extract the signal characteristics. The HASA is used for feature selection to improve the performance of the classifier. Nayana et al. [26] first extracted a set of six time-dependent spectral features (TDSF) to diagnose bearing faults. A feature selection algorithm combining particle swarm optimization and wheeled differential evolution was used to select effective features, and the final feature subset contained most of the TDSF features. Lee et al. [27] proposed a bearing fault diagnosis model based on the feature selection optimization method. By using the Hilbert–Huang transform and envelope analysis, the motor signal is recovered. A feature selection method based on improved binary particle swarm optimization is proposed to improve classification accuracy.
The swarm intelligence algorithm has been widely used in feature selection methods, but there are still some problems. The CS algorithm uses Levy flights to search for the solution space. Due to the heavy-tailed distribution of Levy flights, the large search step size of the algorithm is not conducive to convergence. Some researchers have improved the CS algorithm so that it has better performance when solving feature selection problems. Rodrigues et al. [28] proposed a feature selection method based on the binary cuckoo search (BCS) algorithm and verified the robustness of the BCS algorithm. Salesi and Cosma [29] proposed embedding a pseudo-binary mutation neighborhood search procedure into the BCS algorithm, but the randomness of this strategy is not conducive to algorithm convergence. In order to solve the stability problem of the CS algorithm, Pandey et al. [30] used two analysis techniques to perform double data transformation on the original features. The processed data eliminates the high-order correlation between features, which is conducive to subsequent searches. Aziz et al. [31] presented a feature selection method based on a rough set and an improved CS algorithm to deal with high-dimensional data. Kelidari et al. [32] proposed a chaotic cuckoo optimization algorithm (CCOALFDO). This algorithm improves the performance of the algorithm through chaotic mapping, an elite preservation strategy, and a uniform mutation strategy. Alia and Taweel [33] proposed a new feature selection method by combining rough set theory with the binary cuckoo search algorithm. This method improves the binary cuckoo search algorithm by developing a new initialization and global update mechanism to improve the convergence efficiency of high-dimensional datasets.
Although the above improved algorithm can remedy some shortcomings of the CS algorithm, it still faces the problems of slow convergence speed and random initialization. Therefore, based on the simple binary cuckoo search algorithm, this paper proposes a feature selection method based on a clustering hybrid binary cuckoo search to overcome the above shortcomings.

3. Feature Extraction

In this paper, the Hilbert–Huang transform is used to extract the features of bearing signals. This technique first decomposes a column of time series data using the empirical mode decomposition (EMD) algorithm. It then obtains the operating characteristics of the time series data using the Hilbert transform [34].
The vibration signal obtained from rotating machinery is usually nonstationary, complex, and nonlinear, which does not meet the preconditions of the Hilbert transform [35]. Therefore, it is necessary to use EMD to decompose the nonlinear stationary signal into a stationary signal. The Hilbert transform is then performed on the intrinsic mode function (IMF) obtained by decomposition, and the complex signal is obtained for further analysis. For the given signal x(t), the signal decomposition process in the EMD method is shown in Figure 1.
According to the IMF and the residual component r(t), the original signal x(t) can be reconstructed, as shown in Equation (1).
x ( t ) = i = 1 n c i ( t ) + r n ( t ) .
Each IMF component ci(t) obtained via EMD of the signal is subjected to the Hilbert transform to generate H[ci(t)]. The equation is as follows:
H [ c i ( t ) ] = 1 π c i ( t ) t τ d τ ,
where H[ci(t)] and ci(t) are conjugate complex pairs. The analysis signal zi(t) is shown in Equation (3).
z i ( t ) = a i ( t ) e j θ i ( t ) ,
where ai(t) and θi(t) are time functions, as shown in Equations (4) and (5).
a i ( t ) = c i 2 ( t ) + H 2 [ c i ( t ) ] ,
θ i ( t ) = arctan H [ c i ( t ) ] c i ( t ) .
The Hilbert time–frequency spectrum matrix of the motor operation signal is obtained by the above calculation. The features of the signal of the time–frequency domain are extracted according to the information of the Hilbert time–frequency spectrum matrix [27]. In the time domain, this paper obtained five characteristic curves by calculating the maximum (T-max), mean (T-mean), mean square error (T-mse), root mean square (T-rms), and standard deviation (T-std) of each column of the Hilbert time spectrum matrix. For each characteristic curve, the maximum value, mean value, mean square error, root mean square value, and standard deviation can be calculated. Thus, a total of 25 statistical features were obtained from five characteristic curves, recorded as F1–F25. Using the same program in the frequency domain, the five characteristic curves of F-max, F-mean, F-mse, F-rms, and F-std are obtained. A total of 25 statistical features from the frequency domain were extracted and recorded as F26–F50. Figure 2 shows the process of the Hilbert–Huang transform establishing a feature set containing 50 statistical features.

4. Feature Selection of the Clustering Hybrid Binary Cuckoo Search

4.1. Binary Cuckoo Search Algorithm

Feature selection obtains a subset by selecting appropriate features, which is essentially a binary problem. This paper uses a binary vector to define the solution of the feature selection problem. The formulas are as follows:
x k = ( x 1 k , x 2 k , , x N k ) , x i k { 0 , 1 } ,
x i k = { 1 s e l e c t s   t h e   i t h   f e a t u r e , 0 o t h e r w i s e .
The new generation of the bird nest location is based on a global random search and its update formula is as follows:
x i k + 1 = x i k + α 0 × ϕ × μ | ν | 1 / λ × ( x i k x b e s t k ) ,
in which x b e s t k is the best contemporary solution, α0 is a constant, α0 = 0.01, μ and ν are two random numbers generated from a normal distribution, and ϕ is a random number extracted from the normal distribution. It can be seen from Equation (8) that the CS searches for new solutions around the current optimal solution.
In the BCS, we effectively convert each dimension of a position vector in a continuous space into a binary code through a V-shaped transfer function, as shown in Equations (9) and (10).
V ( x i k ) = | x i k 1 + ( x i k ) 2 | ,
x i k + 1 = { 1 V ( x i k ) 0.5 0 o t h e r w i s e .

4.2. Clustering Hybrid Initialization Method

The initial nest position is an important part of the CS algorithm and has a great influence on the convergence speed and the final solution. The random ‘0’ or ‘1’ operation in the random initialization method does not guarantee the stability and quality of the initial population. Therefore, this paper proposes a clustering mixture (CH) initialization method based on feature similarity. Based on the similarity between features, this method uses the community division algorithm to complete the clustering. Using clustering information to select features reduces the randomness of selection. In addition, this method can effectively filter out redundant features during the initialization process and improve the quality of the initial population to a certain extent. The clustering hybrid initialization includes two steps: feature clustering and hybrid initialization.

4.2.1. Feature Clustering

Based on the commonality of information between features, an undirected weighted feature map is established with each feature as the vertex. The similarity between features is determined by the symmetric uncertainty (SU) [36], which is used as the weight of the edge. The larger the SU value of the two features, the greater the similarity between the features. The calculation formula for SU is shown in Equation (11).
S U ( X , Y ) = 2 × I G ( X , Y ) H ( X ) + H ( Y ) ,
in which X and Y are two random variables and H(X) is the entropy of X, which is calculated by Equation (12). IG(X,Y) is the information gain of X under the Y condition, which is obtained by Equation (13).
H ( X ) = p ( x i ) log 2 ( p ( x i ) ) ,
I G ( X , Y ) = H ( X ) H ( X | Y ) ,
H ( X | Y ) = p ( y i ) p ( x i | y i ) log 2 ( p ( x i | y i ) ) ,
where p(xi) represents the probability when x equals xi, H(X|Y) describes the information gain of X under the Y condition, and p(xi|yi) represents conditional probability when x equals xi and y equals yi.
For the d-dimensional dataset, the similarity matrix α of d × d is obtained by calculating SU. The similarity matrix is processed by the OTSU algorithm [37] to obtain the reasonable threshold g. For any element αij in the similarity matrix, if the corresponding element of the adjacency matrix αij > g, it is set to ‘1’ (otherwise it is set to ‘0’). The transformation from similarity matrix to adjacency matrix is implemented. In this matrix, ‘1’ means that two features are connected in the feature adjacency graph, with ‘0’ indicating they are not connected.
The Louvain algorithm [38] clusters the features according to the feature adjacency graph to obtain the feature clustering group Group = {group1, group2,…, groupS}, where S is the total number of clusters. Figure 3 is a visualization of the clustering process of the Louvain algorithm. The same clustering group contains repetitive information relevant to the final classification task. A feature selected from a cluster will hold most of the information of the entire clustering feature.

4.2.2. Hybrid Initialization

The number of features is a significant factor affecting population quality. When the characteristics of clustering groups are selected through quantitative regularity, the small-scale initialization method and the large-scale initialization method are defined.
The small-scale initialization method selects any number of groups less than or equal to the total number of clusters S. The initial population containing SN features is then obtained by randomly selecting one feature from each group. This method selects a small number of features, which can effectively reduce redundant features.
The large-scale initialization method selects any number of SN features that are less than or equal to the total number of features N. If SNS, the same operation as that used in small-scale initialization is performed. If SN > S, a feature is selected from each cluster and then this selection is continued according to the above operation until the number of features satisfies SN. When the optimal feature subset contains relatively more features, the large-scale initialization method is more likely to obtain the optimal solution.
A hybrid initialization method is proposed by combining the two methods. Most cuckoos use the small-scale initialization method to reduce the number of features effectively. Other cuckoos use large-scale initialization methods to supplement the possibility of an optimal feature subset with multiple feature numbers. The hybrid initialization method considers multiple possibilities and can effectively combine the advantages of the two initializations. This paper sets 2/3 of the population using the small-scale initialization method. Figure 4 shows the clustering hybrid initialization procedure.

4.3. Mutation Strategy Based on Levy Flight

The cuckoo searches for the optimal solution based on its position and the current optimal position of the bird’s nest in the CS algorithm. However, in the contemporary population, useful information about quality nests can be obtained in addition to the best modern solutions. By using the location information of multiple quality nests, cuckoos can identify the global optimal nest faster. Therefore, this paper introduces three randomly selected high-quality individuals ( x r 1 k ,   x r 2 k ,   x r 3 k ) into the update equation. This improvement enables the algorithm to explore more of the entire search space.
Furthermore, the CS algorithm has strong global exploration ability due to the addition of Levy flight. However, the heavy-tailed distribution of the Levy flight makes the jump step of the algorithm larger in the iterative process, which is not conducive to approximating the optimal solution. This article presents the spawning range ω, which specifies that each cuckoo should lay between 2 and 5 eggs in this range. The spawning range of each cuckoo is calculated by Equation (15).
ω = β × e g g s t o t a l _ e g g s ,
where β is the constant, β = 0.25, eggs is the number of eggs laid per cuckoo, and total_eggs represents total egg laying amount. The larger the nest yield, the larger the spawning range.
To effectively utilize useful information from the whole population and accelerate the convergence of the algorithm, a new global search formula is proposed, as shown in Equation (16).
x i k + 1 = x r 1 k + α 0 ϕ μ | ν | 1 / λ ( x i k x b e s t k ) + ω ( x r 2 k x r 3 k ) ,
in which x r 1 k ,   x r 2 k ,   x r 3 k are three individuals randomly selected from the top 20% of the individuals in the population.
In the new global search formula, the solution will not be strongly attracted by the current optimal solution, reducing the speed at which the algorithm falls toward the local optimum. The laying range ω can control the cuckoos so that they walk randomly in different amplitude steps. Furthermore, massive offspring nests can improve local development ability. Finally, only the optimal offspring is retained as the next generation nest.

4.4. Dynamic Pa Probability Strategy

The probability Pa in the standard cuckoo search algorithm is a fixed value. A fixed probability of discarding the nest indiscriminately may cause the loss of a better solution, which is not conducive to convergence. A dynamic Pa probability strategy based on population fitness sorting is proposed, which can preserve the possible optimal solution with high probability. The population number is set to M and the nests are sorted according to fitness. After sorting, each nest is assigned to a level, with the optimal solution being level one and the worst solution being level M. The assignment level and DPa are shown in Equations (17) and (18).
r a n k i = i , i = 1 , 2 , , M ,
D P a i = P a min + ( P a max P a min ) r a n k i M ,
where Pamin is the minimum probability and Pamax is the maximum Pa probability.
x i k + 1 = { CH i f   r < D P a x i k o t h e r w i s e ,
where r is a random decimal that obeys the normal distribution. According to Equation (19), when DPa is less than r, a new nest is generated using the clustering hybridization initialization method to replace the original nest; otherwise, the contemporary nest is kept. The lower the DPa value corresponding to each nest, the higher the probability of preservation. After discarding poor nests, a new nest generated by the CH initialization method can prevent the algorithm from falling toward the local optimum.

4.5. k-Nearest Neighbors Classifier and Fitness Function

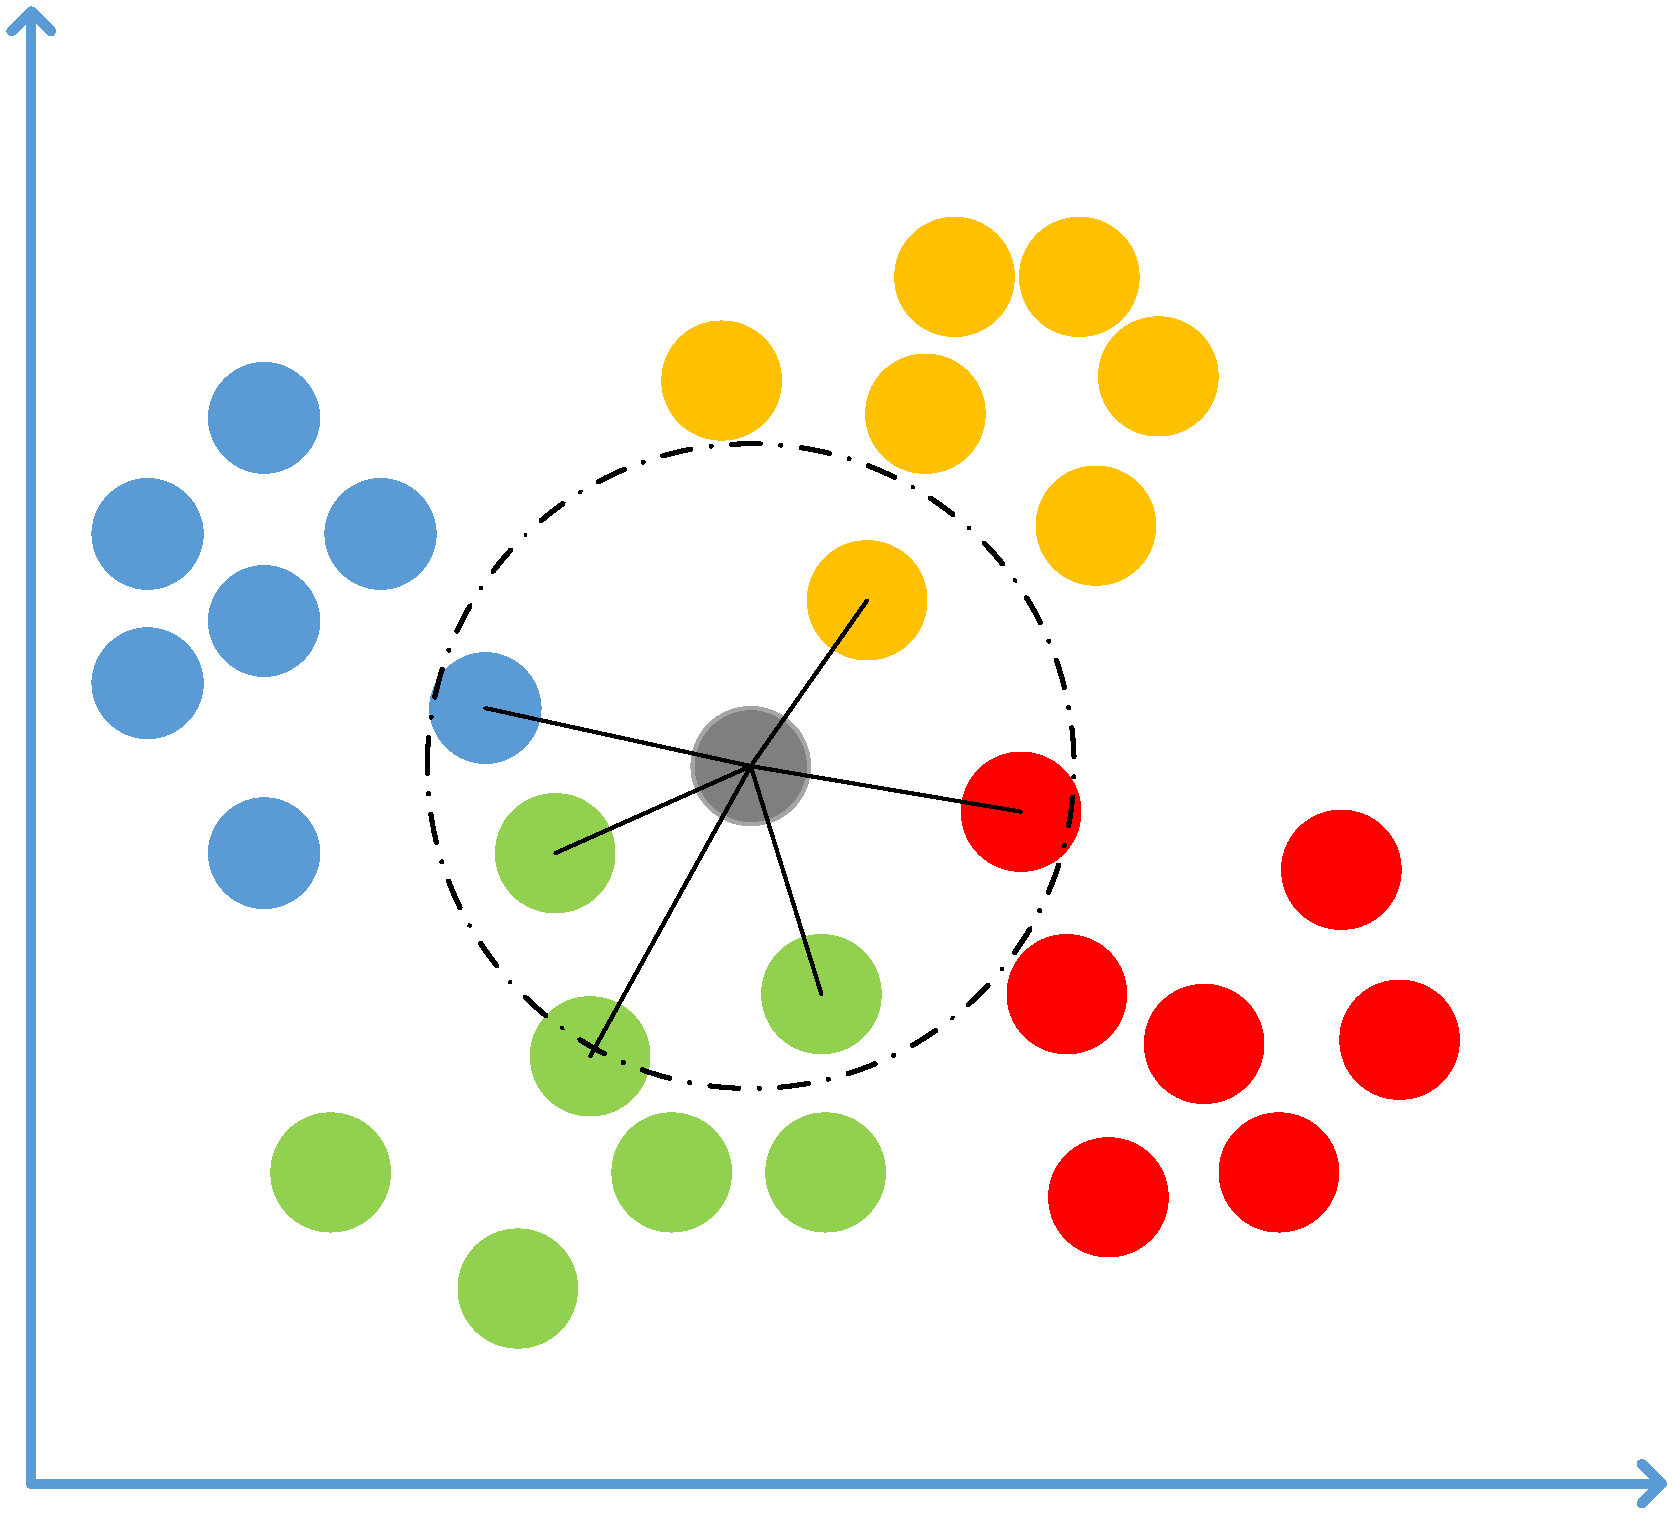
The k-nearest neighbors (KNN) classifier is a machine learning method for multi-classification [39]. For unknown samples, the distance between the unknown sample and all existing samples needs to be calculated. The k samples nearest to the unknown sample are selected and the category of the unknown sample is judged according to the k sample types. The basic principle of the KNN classifier is shown in Figure 5.
A key point in the KNN algorithm is to determine the distance function. The existing distance functions include Euclidean distance, cosine distance, Hamming distance, and Manhattan distance. The most widely used is the Euclidean distance, as shown in Equation (20).
d ( r , R ) = i = 1 n ( r i R i ) 2 .
In this paper, the classification error rate Error obtained by calling the KNN classifier is used to evaluate the feature set. When setting the k parameter to 5, the description formula is as follows.
E r r o r = 1 correct   classificationrate   with   k   Neighbors     Classifier   ( N _ neighbors = 5 ) .
The fitness value is applied to assess the effectiveness of the cuckoo nest solution. The classification error rate and the number of features are two essential criteria for evaluating classification performance. The fitness function is obtained by weighting them, as shown in Equation (22).
f i t n e s s ( x ) = q × E r r o r ( x ) + ( 1 q ) ( | x | N ) ,
in which q∈[0, 1] corresponds to the weight of the classification error rate, q = 0.9, and |x| represents the number of features.

4.6. Feature Selection Based on the Clustering Hybrid Binary Cuckoo Search

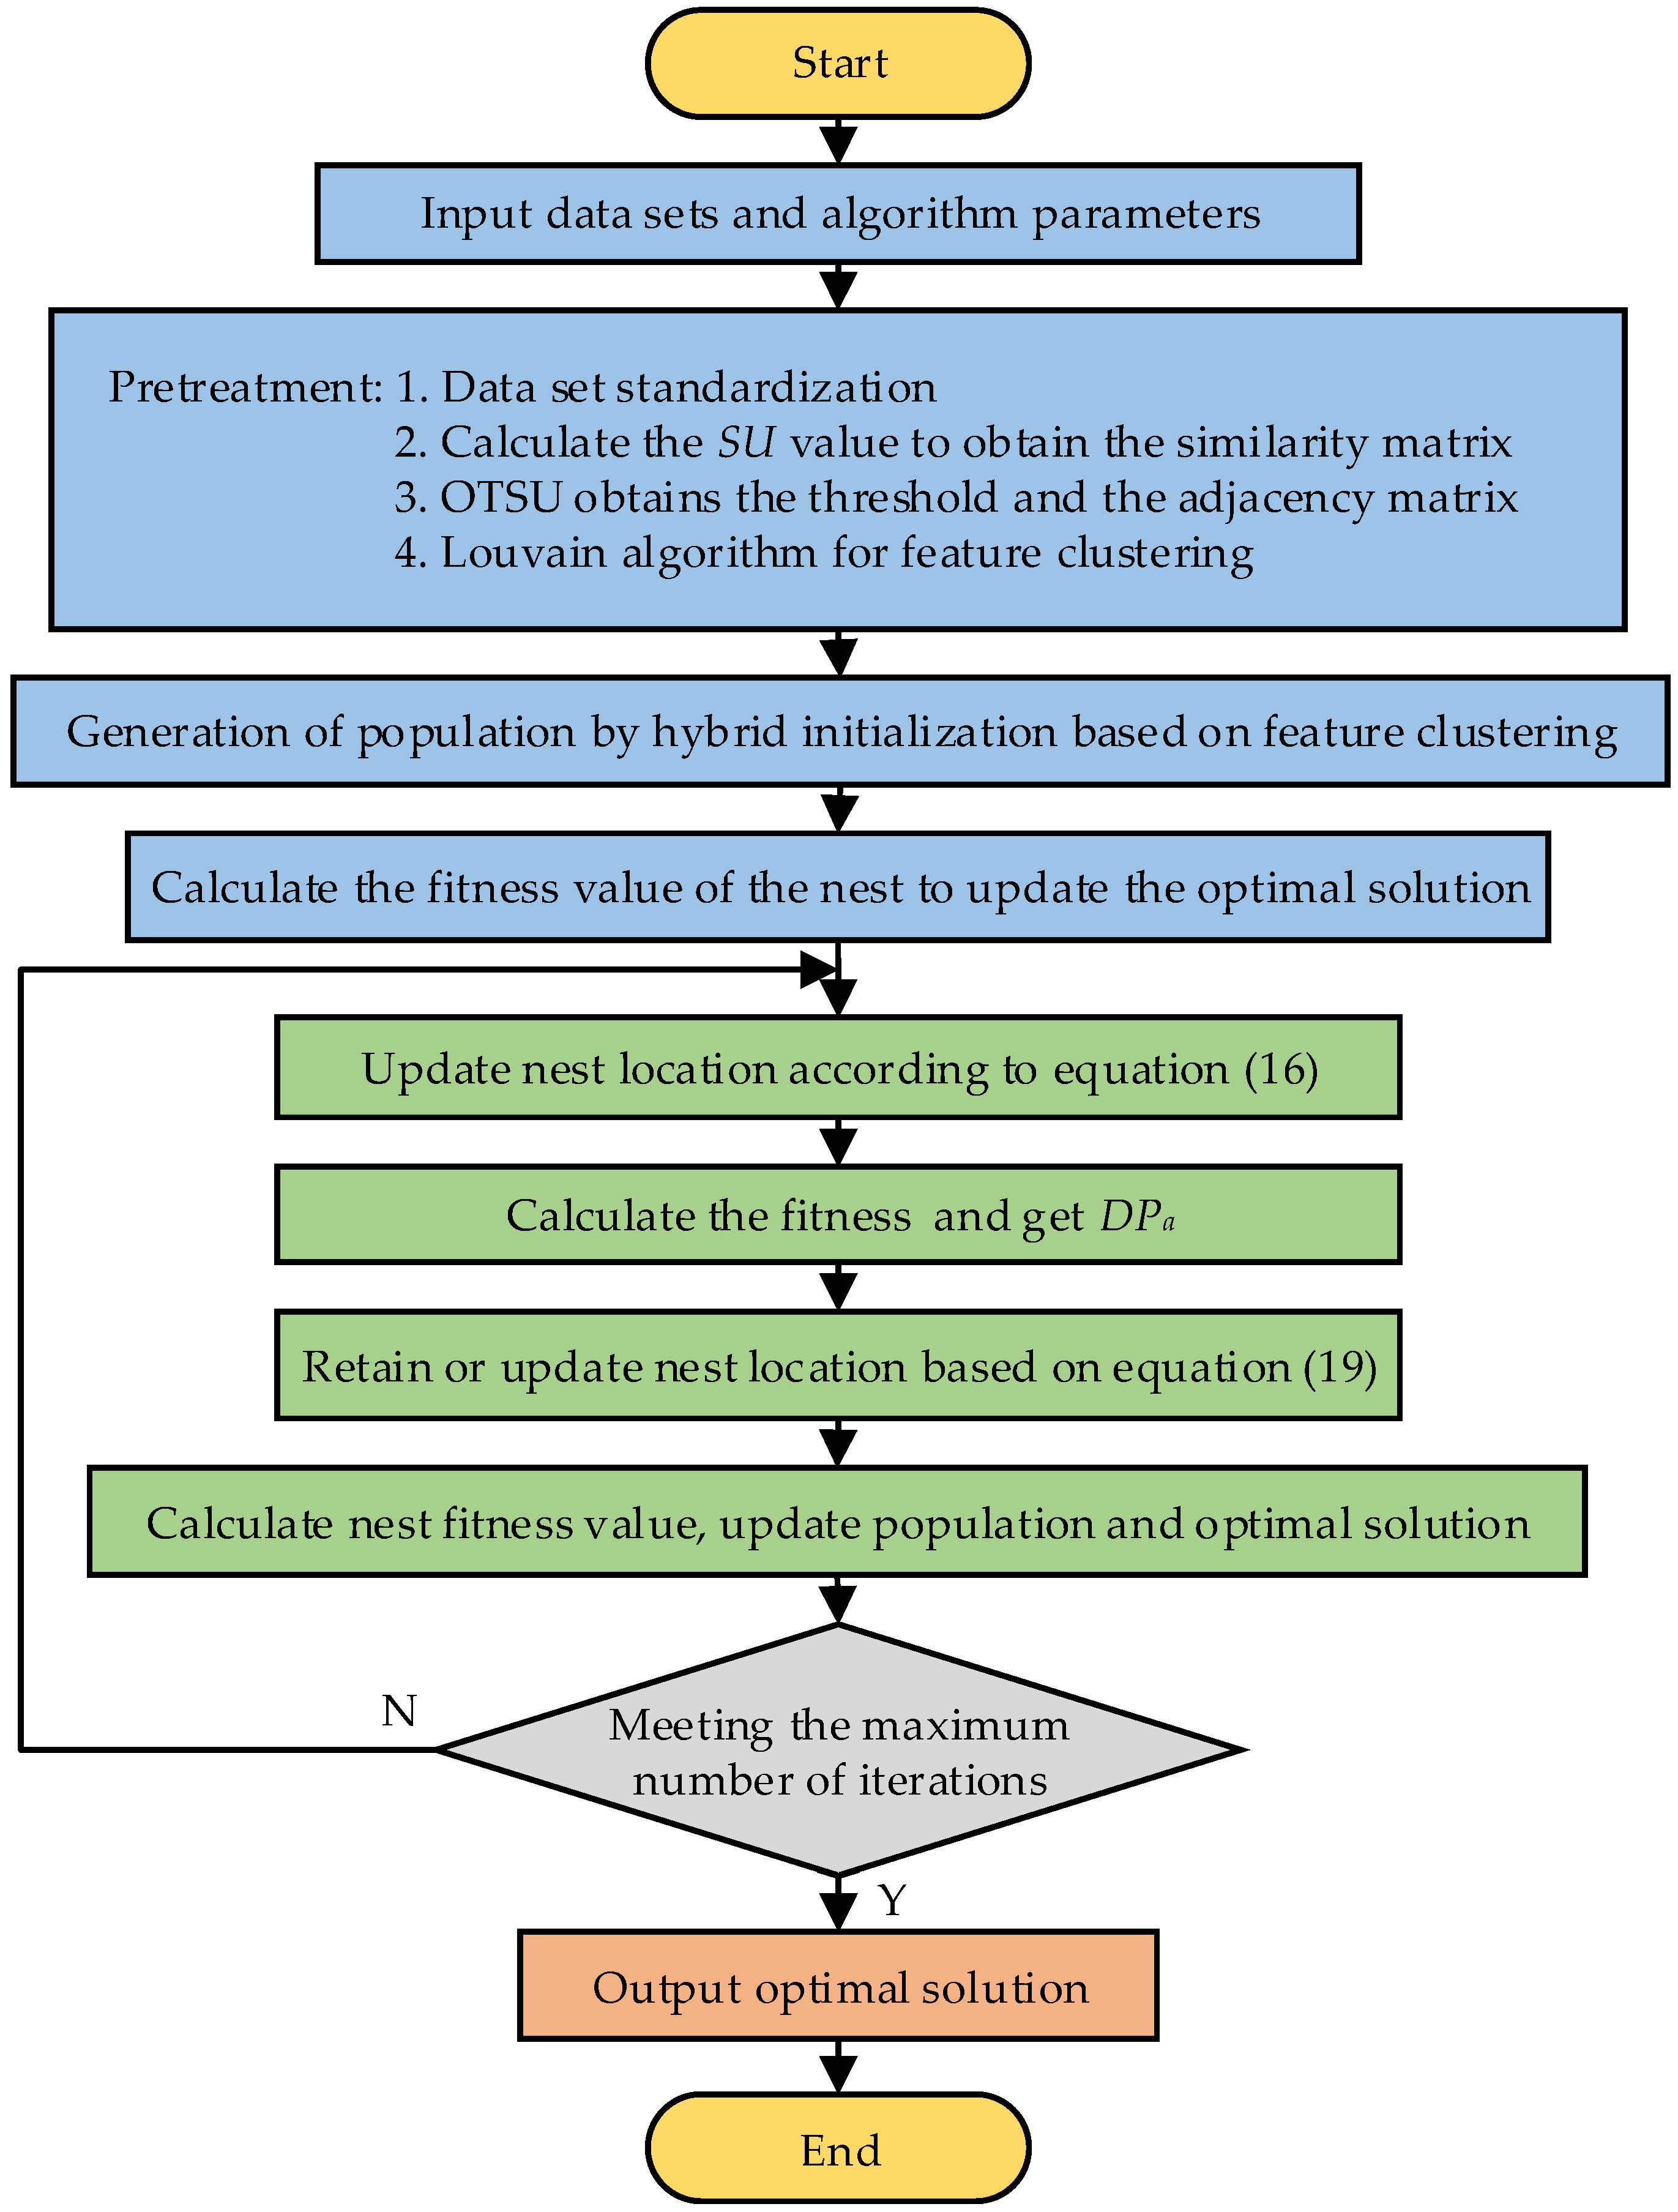
Combined with the above-improved strategy, a feature selection method based on the clustering hybrid binary cuckoo search is proposed. This method introduces the clustering hybrid initialization strategy, a mutation strategy based on Levy flight, and the dynamic Pa probability strategy into the CS algorithm to improve the classification performance of the algorithm. A flow diagram of the CHBCS algorithm is shown in Figure 6.

5. Experiments and Analysis

This section verifies the feasibility of the proposed method through two experiments. First, the performance of feature selection method was verified using the famous UCI benchmark dataset. To confirm the efficacy of the improved method, the suggested CHBCS algorithm is contrasted with other feature selection algorithms based on the cuckoo search. Second, fault diagnosis tasks were performed on the bearing fault dataset. In bearing fault diagnosis, the CHBCS algorithm is compared to the classical optimization algorithm.

5.1. Performance Analysis of the CHBCS Algorithm

5.1.1. UCI Dataset

This experiment tested the performance of the suggested method using nine well-known benchmark datasets from the UCI database [40]. These datasets are widely used for performance comparisons of feature selection. The number of features, samples, and classifications in the datasets are shown in Table 1.
The range difference between the original data will affect the classification results of the classifier. The feature sample χij is normalized by the maximum and minimum normalization method to obtain χij.
χ i j = χ i j χ i min χ i max χ i min ,
where χimax and χimin represent the maximum values and minimum values of the i-th feature in the sample.

5.1.2. Experiment Setting

This section of the experiment is divided into two steps to study the impact of the proposed improvement strategy on the performance of the algorithm. First, the clustering hybrid initialization method is compared to other initialization methods. In the second stage, the CHBCS algorithm is compared to other BCS algorithms to verify the effectiveness of the improved strategy in improving classification performance and convergence speed.
A 10-fold cross-validation [41] was used to generate a training set and a test set from the normalized dataset. The feature subset was evaluated using a KNN classifier (in this article k = 5). The maximum number of iterations for all experiments in this paper was 100, the population size was 50, and the probability Pa was set to 0.25. All algorithms were implemented in Python, and all experiments were conducted on a PC with an Intel (R) Core (TM) i5-8500T CPU @ 2.10 GHz and 8.0 GB of RAM.

5.1.3. Effect of Initialization Strategy on Feature Selection

To validate the validity of the clustering hybrid initialization strategy proposed in this paper, random (Rand) initialization and initialization based on clustering (BC) [42] are compared to the clustering hybrid (CH) initialization method proposed in this paper. These three methods use the standard BCS algorithm for a subsequent search.
Table 2 shows the average classification error rate of BCS algorithms with different initialization strategies. Results show that CH initialization achieves the lowest error rate for the nine datasets. Its classification performance is improved compared to other initialization methods.
Figure 7 intuitively reflects the quantitative relationship between the number of features of the three initialization strategies in the nine datasets. Table 2 and Figure 7 show that the CH initialization method not only reduces the number of features by a significant amount, but also achieves a lower classification error rate. In all datasets, the BCS (CH) algorithm obtains fewer features than the other two algorithms. The CH initialization method can effectively reduce redundant features by using clustering information and a hybrid initialization strategy. The advantages are evident in datasets with a high number of features, such as Hillvalley, Libras, and Musk1.
The clustering hybrid initialization method considers the similarity between features, which can effectively avoid the influence of redundant features and reduce the number of features. Thus, while maintaining the classification error rate, clustering hybrid initialization can effectively minimize the number of features.

5.1.4. Comparison with Other Cuckoo Search Algorithms

This section verifies the impact of the mutation strategy based on Levy flight and the dynamic Pa probability strategy on algorithm performance. The CHBCS algorithm is compared to the binary cuckoo search algorithm (BCS) [28] and the enhanced binary cuckoo search (EBCS) [29] under unified use of the CH initialization strategy.
Experimental results for the three algorithms after being run independently 20 times in the nine datasets are shown in Table 3. The results show that the CHBCS algorithm achieves the lowest average classification error rate for all datasets and obtains the lowest average number of features for eight datasets. In the Musk1 dataset, the average error rate of the CHBCS algorithm is 29.51% and 38.17% lower than that of the BCS algorithm and the EBCS algorithm, respectively, and the average number of features is the lowest. In the Exactly dataset, the CHBCS algorithm achieves 100% accuracy and the lowest average number of features in 20 experiments, with classification performance and stability also being better than other algorithms. The two proposed improvement strategies can effectively improve the classification performance of the CS algorithm.
Furthermore, Figure 8 displays the convergence curves of the three algorithms for each of the nine datasets. In the iterative process, the CHBCS algorithm can search for a better solution than the other two algorithms. On datasets such as Hillvalley, Libras, and Musk1, the convergence curve drops rapidly and performance is significantly improved. In the Exactly dataset, the convergence curve of the CHBCS algorithm converges faster than the curves for the BCS algorithm and the EBCS algorithm, and the curve is smoother. In the HeartEW dataset, the fitness value of the BCS algorithm stops decreasing after 30 iterations, and its classification performance is far from that of the CHBCS algorithm.
The CHBCS algorithm can effectively search for the optimal solution, mainly because the mutation strategy based on Levy flight improves the exploration ability of the BCS algorithm and DPa can effectively retain high-quality solutions and accelerate the algorithm’s convergence. Therefore, the above results prove that the CHBCS algorithm can effectively enhance the search ability of cuckoos and improve the convergence performance of the BCS algorithm.

5.2. Bearing Fault Diagnosis Experiment

5.2.1. Data Sources

The experimental data for rolling bearings used in this paper come from the Bearing Data Center of Case Western Reserve University (CWRU) [5]. The CWRU benchmark is a common dataset that is widely used in bearing fault research. The experimental bearing adopts artificial single point electric spark damage. The damage diameter is divided into three groups (0.007 inches, 0.014 inches, and 0.021 inches). Fault location can be divided into rolling ball (B), inner ring (IR), and outer ring (OR) groups. There are ten bearing states, including the normal state and different fault states. The vibration signal data are obtained from the acceleration sensor of the drive end under the no-load condition of the motor, with a sampling frequency of 12 kHz. The measurement data in the dataset are provided as a single file, with each file containing about 120,000 data points that correspond to each bearing state. The length of each signal sample was set to 2000 sample points. A total of 50 test samples were obtained for each health state. This information for the CWRU dataset is shown in Table 4.
Figure 9 shows the time domain waveforms of the motor vibration signals under 10 bearing conditions. It can be seen from the diagram that it is difficult to distinguish fault types using only vibration signals. Therefore, the signal was analyzed using the feature extraction method in Section 3, and a50-dimensional fault feature set was extracted.

5.2.2. Experimental Design

To prove the effectiveness of the CHBCS feature selection method in rolling bearing fault diagnosis, the CHBCS was compared to the BCS [28], EBCS [29], BPSO [43], GA [44], HHO [45], WOA [46], SSA [47], GWO [48], and a method using all features (ALL) using the CWRU dataset. The parameter settings of the nine algorithms are shown in Table 5.
The overall fault diagnosis model is shown in Figure 10. During feature selection training, the KNN classifier (in this article k = 5) and a 10-fold cross-validation were used to assess the classification performance of the feature subset.

5.2.3. Experimental Results and Analysis

The t-distributed stochastic neighbor embedding (t-SNE) manifold learning algorithm [49] transforms the feature set before and after feature selection into a two-dimensional distribution, which can more intuitively show the quality of the feature subset. The resulting distribution map is shown in Figure 11. When feature selection is not performed, fault types two, three, four, six, and nine are tightly distributed and overlap. After feature selection based on the CHBCS algorithm, irrelevant interference features are eliminated and all fault states are effectively separated. Therefore, the method proposed in this paper can effectively remove the redundant features that affect classification and improve the performance of the classifier.
Table 6 shows the diagnostic performance obtained using the nine algorithms and all feature (ALL) methods.
From the perspective of diagnostic performance, the nine algorithms shown in Table 6 achieve better diagnostic accuracy than when using all features. The average diagnostic error rate of the CHBCS algorithm was only 1.13%, which is 81.17% lower than the ALL method and the lowest diagnostic error rate among the nine algorithms. In the CWRU dataset, 50 features were extracted. The nine algorithms reduced dimensionality to varying degrees. The average number of selected features with the CHBCS algorithm was 4.75, and the feature selection rate was only 9.5%. The Compared to the ALL, BCS, EBCS, BPSO, GA, HHO, WOA, SSA, and GWO algorithms, the fitness value of the CHBCS algorithm was 87.20%, 55.02%, 50.62%, 61.87%, 40.84%, 50.25%, 42.23%, 68.23%, and 40.30% lower, respectively. The experimental results show that the CHBCS algorithm can significantly improve diagnostic performance.
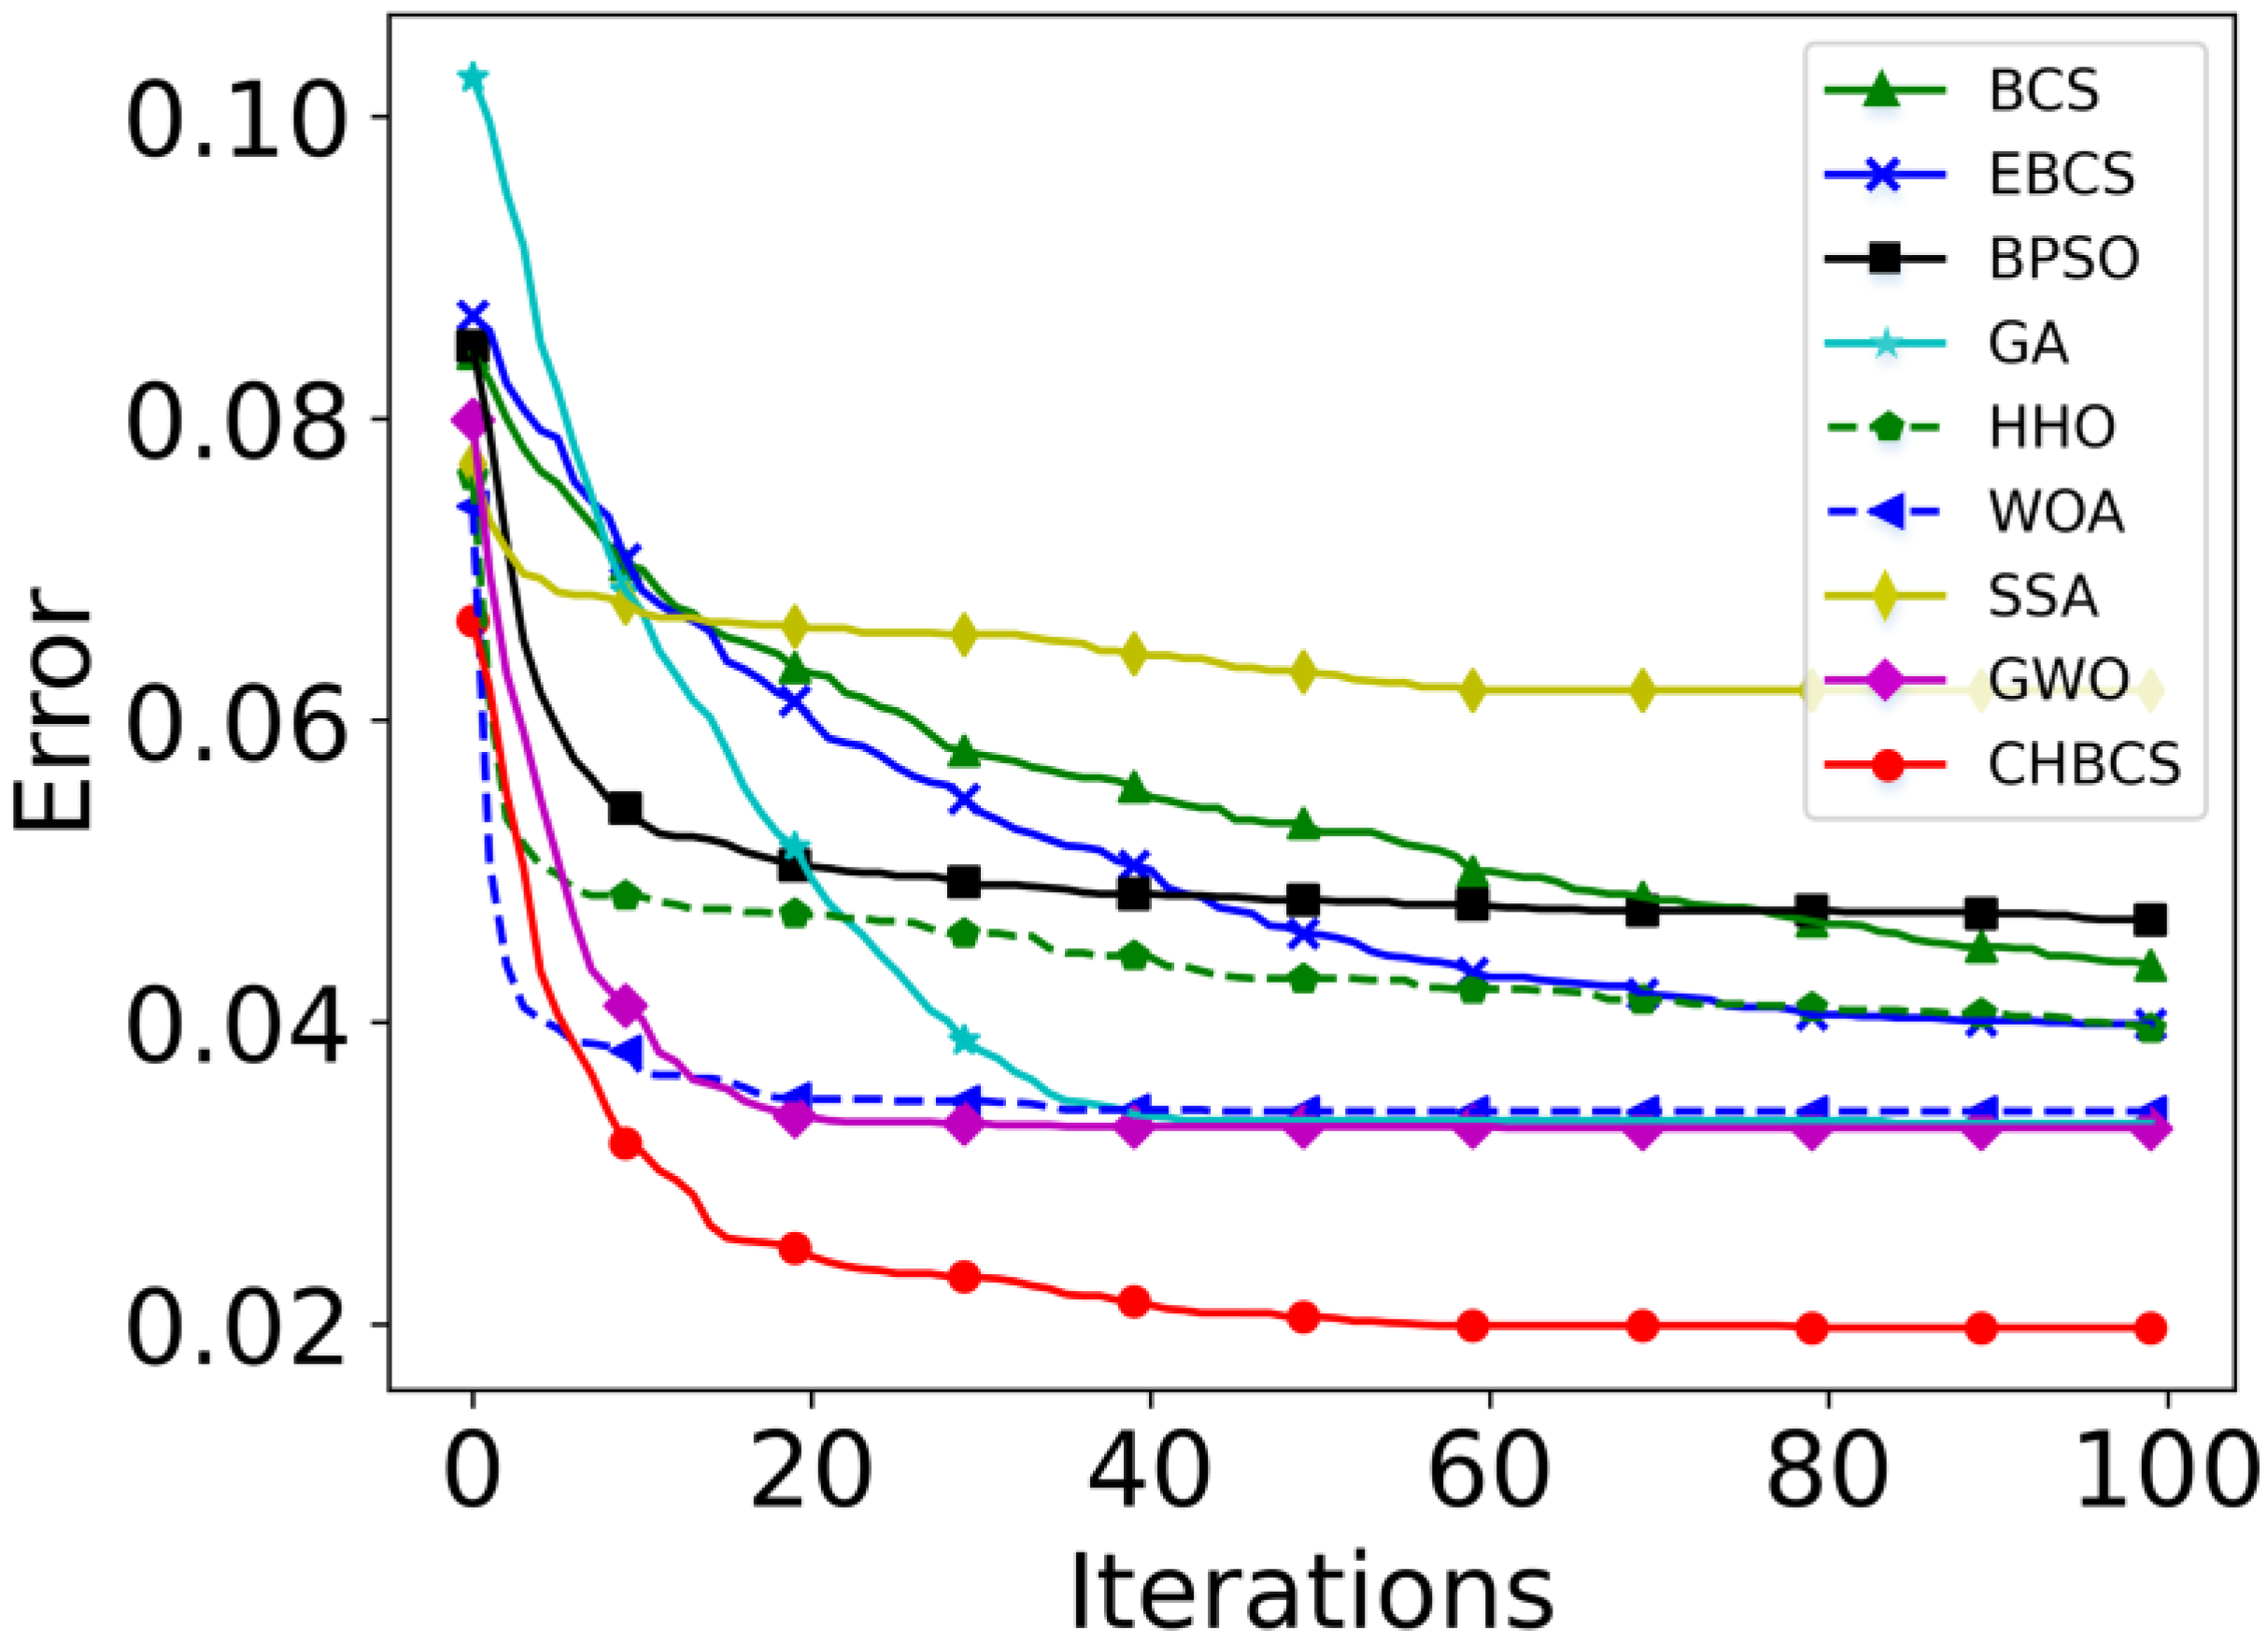
Convergence performance analysis of the algorithm was also performed. The fitness convergence curves obtained by the nine algorithms after being run 20 times independently are shown in Figure 12. The average fitness of the SSA is 0.0620, which is the worst among the nine algorithms. It converges to the global optimum before the 10th iteration, indicating that the SSA algorithm easily falls toward the local optimum. The quality of the feature subset searched by the CHBCS algorithm is significantly better than the other eight algorithms. By comparing the iterative curves of the CHBCS, BCS, and EBCS, it can be seen that the CHBCS algorithm can effectively improve the convergence speed of the CS algorithm. In addition, the initial value of the convergence curve of the CHBCS algorithm is less than 0.07, and the quality of the initial population is improved. The results prove the effectiveness of the clustering hybrid initialization method.
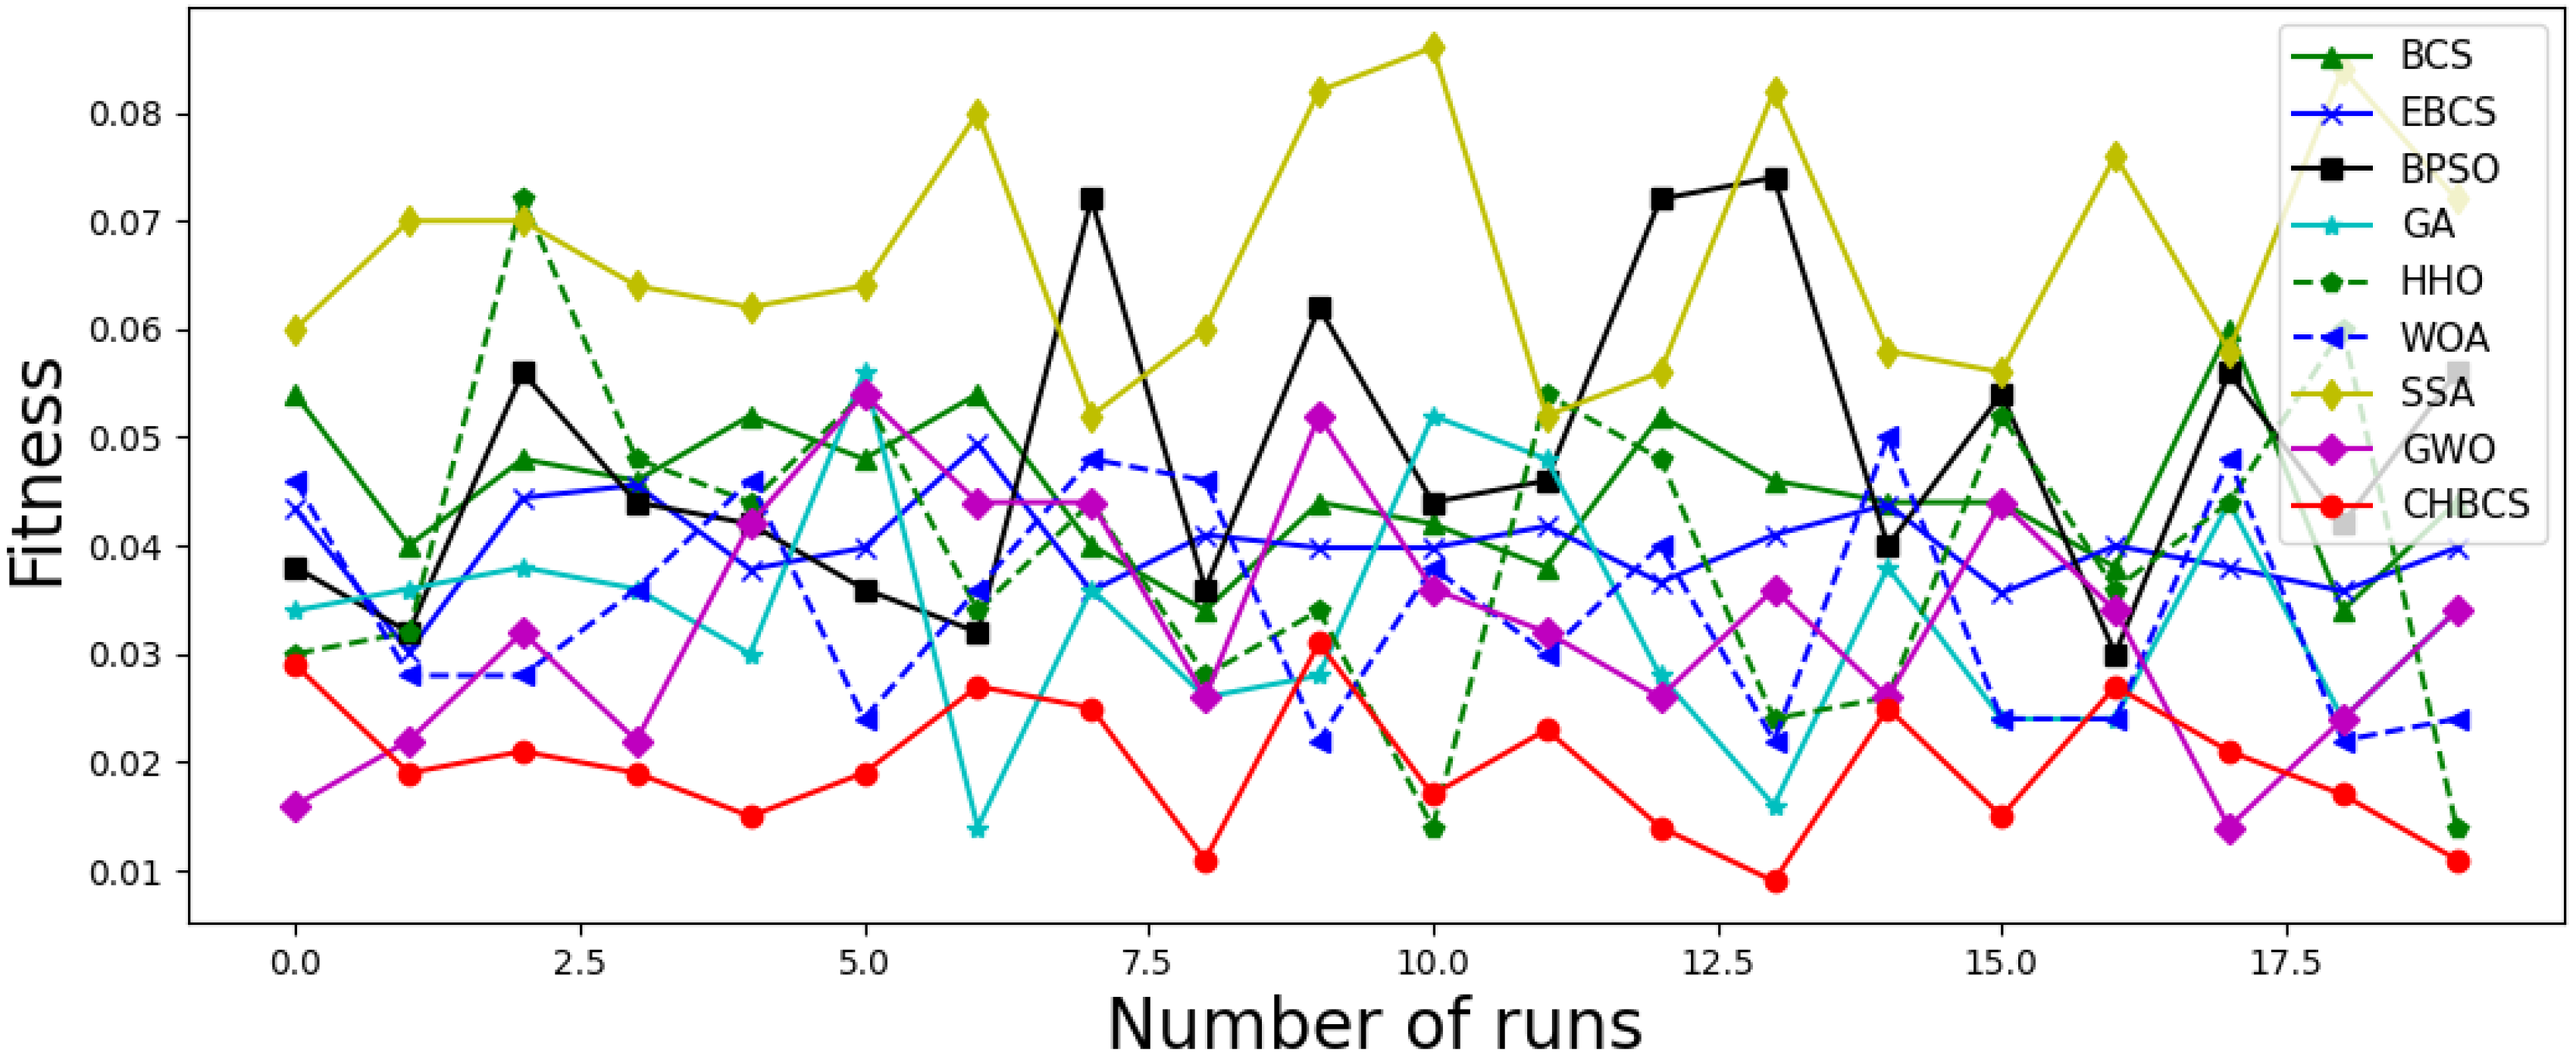
The optimal fitness values obtained by the nine algorithms after being run 20 times independently are shown in Figure 13. The fitness value of the CHBCS algorithm is the lowest among the nine broken lines, mainly falling between 0.03 and 0.01. Compared to the other eight algorithms, the fluctuations in the line chart of the CHBCS algorithm are the smallest. The above analysis shows that the CHBCS algorithm has better stability than the BCS, EBCS, BPSO, GA, HHO, WOA, SSA, and GWO algorithms.
In rolling bearing fault diagnosis, the CHBCS method can effectively identify various bearing fault types. In terms of diagnostic accuracy, feature number, convergence speed, and stability, it has outperformed other traditional optimization algorithms. Therefore, the CHBCS feature selection method can effectively solve the problem of bearing fault diagnosis.

6. Conclusions

This paper proposes a feature selection method based on the clustering hybrid binary cuckoo search to address the problem of low accuracy in rolling bearing fault diagnosis that is caused by irrelevant and redundant features. Hilbert–Huang transform technology effectively realizes the strategy of extracting features from the signal time–frequency domain. The clustering hybrid initialization method proposed by the CHBCS algorithm uses the similarity between features to cluster, effectively reducing redundant features and controlling the number of features through a hybrid initialization method. In addition, the proposed mutation strategy based on Levy flight and the dynamic Pa probability strategy can effectively promote the algorithm’s convergence. Finally, an experiment was carried out on the CWRU rolling bearing data. The results show that the diagnostic error rate of the CHBCS algorithm was only 1.13% and that a low-dimensional feature subset that is more sensitive to the fault state could be obtained, which thus provides an effective solution for rolling bearing fault diagnosis. The method will be further improved in future studies and field measured data will be used for experiments to eliminate simulation errors.

Author Contributions

Conceptualization, L.S. and Y.X.; methodology, Y.X.; software, T.C.; validation, L.S., Y.X. and T.C.; formal analysis, Y.X.; resources, L.S. and T.C.; data curation, B.F.; writing—original draft preparation, Y.X.; writing—review and editing, L.S. and T.C.; visualization, B.F. All authors have read and agreed to the published version of the manuscript.

Funding

This research was funded by the National Natural Science Foundation of China (Grant nos. 62173127 and 61973104); the Scientific and Technological Innovation Leaders in Central Plains (No. 224200510008); the Henan Excellent Young Scientists Fund (No. 212300410036); the Program for Science and Technology Innovation Talents in Universities of Henan Province (Grant no. 21HASTIT029); the Training Program for Young Backbone Teachers in Universities of Henan Province (Grant no. 2019GGJS089); the Innovative Funds Plan of Henan University of Technology (Grant no. 2020ZKCJ06); the Zhengzhou Science and Technology Collaborative Innovation Project (No. 21ZZXTCX06); and the Cultivation Program of Young Backbone Teachers in Henan University of Technology (Grant chentianfei).

Institutional Review Board Statement

Not applicable.

Data Availability Statement

Not applicable.

Acknowledgments

The authors thank Case Western Reserve University for providing free access to the bearing vibration experimental data on their website.

Conflicts of Interest

The authors declare no conflict of interest.

References

  1. Neupane, D.; Seok, J. Bearing Fault Detection and Diagnosis Using Case Western Reserve University Dataset With Deep Learning Approaches: A Review. IEEE Access 2020, 8, 93155–93178. [Google Scholar] [CrossRef]
  2. Nyanteh, Y.; Edrington, C.; Srivastava, S.; Cartes, D. Application of artificial intelligence to real-time fault detection in permanent-magnet synchronous machines. IEEE Trans. Ind. Appl. 2013, 49, 1205–1214. [Google Scholar] [CrossRef]
  3. Lin, S.L. Application of Machine Learning to a Medium Gaussian Support Vector Machine in the Diagnosis of Motor Bearing Faults. Electronics 2021, 10, 2266. [Google Scholar] [CrossRef]
  4. Hou, J.B.; Wu, Y.; Ahmad, A.S.; Gong, H.; Liu, L. A Novel Rolling Bearing Fault Diagnosis Method Based on Adaptive Feature Selectionand Clustering. IEEE Access 2021, 9, 99756–99767. [Google Scholar] [CrossRef]
  5. Zhang, X.; Zhao, B.Y.; Lin, Y. Machine Learning Based Bearing Fault Diagnosis Using the Case Western Reserve University Data: A Review. IEEE Access 2021, 9, 155598–155608. [Google Scholar] [CrossRef]
  6. Dhamande, L.S.; Chaudhari, M.B. Compound gear-bearing fault feature extraction using statistical features based on time-frequency method. Measurement 2018, 125, 63–77. [Google Scholar] [CrossRef]
  7. Tian, J.; Morillo, C.; Azarian, M.H.; Pecht, M. Motor Bearing Fault Detection Using Spectral Kurtosis-Based Feature Extraction Coupled With K -Nearest Neighbor Distance Analysis. IEEE Trans. Ind. Electron. 2016, 63, 1793–1803. [Google Scholar] [CrossRef]
  8. Guan, X.Y.; Chen, G. Sharing pattern feature selection using multiple improved genetic algorithms and its application in bearing fault diagnosis. J. Mech. Sci. Technol. 2019, 33, 129–138. [Google Scholar] [CrossRef]
  9. Xue, B.; Zhang, M.; Browne, W.N.; Yao, X. A survey on evolutionary computation approaches to feature selection. IEEE Trans. Evol. Comput. 2016, 20, 606–626. [Google Scholar] [CrossRef] [Green Version]
  10. Mao, W.T.; Wang, L.Y.; Feng, N. A New Fault Diagnosis Method of Bearings Based on Structural Feature Selection. Electronics 2020, 8, 1406. [Google Scholar] [CrossRef]
  11. Liu, H.; Yu, L. Toward integrating feature selection algorithms for classification and clustering. IEEE Trans. Knowl. Data Eng. 2005, 17, 491–502. [Google Scholar]
  12. Tam, W.; Cheng, L.; Wang, T.; Xia, W.; Chen, L. An improved genetic algorithm based robot path planning method without collision in confined workspace. Int. J. Model. Identif. Control 2019, 33, 120–129. [Google Scholar] [CrossRef]
  13. Shafqat, W.; Malik, S.; Lee, K.T.; Kim, D.H. PSO Based Optimized Ensemble Learning and Feature Selection Approach for Efficient Energy Forecast. Electronics 2021, 10, 2188. [Google Scholar] [CrossRef]
  14. Al-tashi, Q.; Kadir, S.J.A.; Rais, H.M.; Mirjalili, S.; Alhussian, H. Binary Optimization Using Hybrid Grey Wolf Optimization for Feature Selection. IEEE Access 2019, 7, 39496–39508. [Google Scholar] [CrossRef]
  15. Anter, A.M.; Muntaz, A. Feature selection strategy based on hybrid crow search optimization algorithm integrated with chaos theory and fuzzy c-means algorithm for medical diagnosis problems. Soft Comput. 2020, 24, 1565–1584. [Google Scholar] [CrossRef]
  16. Yang, X.S.; Deb, S. Cuckoo Search via Lévy flights. In Proceedings of the 2009 World Congress on Nature & Biologically Inspired Computing, Coimbatore, India, 9–11 December 2009. [Google Scholar]
  17. Gandomi, A.H.; Yang, X.S.; Alavi, A.H. Cuckoo search algorithm: A metaheuristic approach to solve structural optimization problems. Eng. Comput. 2013, 29, 17–35. [Google Scholar] [CrossRef]
  18. Xue, B.; Zhang, M.J.; BrowneSchool, W.N. Particle swarm optimisation for feature selection in classification: Novel initialisation and updating mechanisms. Appl. Soft Comput. 2014, 18, 261–276. [Google Scholar] [CrossRef]
  19. Cui, B.; Pan, H.; Wang, Z. Fault diagnosis of roller bearings base on the local wave and approximate entropy. J. North Univ. China 2012, 33, 552–558. [Google Scholar]
  20. Zheng, J.; Cheng, J.; Yang, Y.; Luo, S. A rolling bearing fault diagnosis method based on multi-scale fuzzy entropy and variable predictive model-based class discrimination. Mech. Mach. Theory 2014, 78, 187–200. [Google Scholar] [CrossRef]
  21. Tang, X.H.; Wang, J.C.; Lu, J.G.; Liu, G.K.; Chen, J.D. Improving Bearing Fault Diagnosis Using Maximum Information Coefficient Based Feature Selection. Appl. Sci. 2018, 8, 2143. [Google Scholar] [CrossRef] [Green Version]
  22. Tang, X.H.; He, Q.; Gu, X.; Li, C.J.; Zhang, H.; Lu, J.G. A novel bearing fault diagnosis method based on GL-mRMR-SVM. Processes 2020, 8, 784. [Google Scholar] [CrossRef]
  23. Lu, L.; Yan, J.H.; de Silva, C.W. Dominant feature selection for the fault diagnosis of rotary machines using modified genetic algorithm and empirical mode decomposition. J. Sound Vib. 2015, 344, 464–483. [Google Scholar] [CrossRef]
  24. Rauber, T.W.; De, A.B.F.; Varejao, F.M. Heterogeneous Feature Models and Feature Selection Applied to Bearing Fault Diagnosis. IEEE Trans. Ind. Electron. 2015, 62, 637–646. [Google Scholar] [CrossRef]
  25. Shan, Y.H.; Zhou, J.Z.; Jiang, W.; Liu, J.; Xu, Y.H.; Zhao, Y.J. A fault diagnosis method for rotating machinery based on improved variational mode decomposition and a hybrid artificial sheep algorithm. Meas. Sci. Technol. 2019, 30, 055002. [Google Scholar] [CrossRef]
  26. Nayana, B.R.; Geethanjali, P. Improved Identification of Various Conditions of Induction Motor Bearing Faults. IEEE Trans. Instrum. Meas. 2020, 69, 1908–1919. [Google Scholar] [CrossRef]
  27. Lee, C.Y.; Le, T.A. An Enhanced Binary Particle Swarm Optimization for Optimal Feature Selection in Bearing Fault Diagnosis of Electrical Machines. IEEE Access 2021, 9, 102671–102686. [Google Scholar] [CrossRef]
  28. Rodrigues, D.; Pereira, L.A.M.; Almeida, T.N.S.; Papa, J.P.; Souza, A.N.; Ramos, C.C.O.; Yang, X.S. BCS: A Binary Cuckoo Search algorithm for feature selection. In Proceedings of the 2013 IEEE International Symposium on Circuits and Systems, Beijing, China, 19–23 May 2013. [Google Scholar]
  29. Salesi, S.; Cosma, G. A novel extended binary cuckoo search algorithm for feature selection. In Proceedings of the 2017 2nd International Conference on Knowledge Engineering and Applications 2017, London, UK, 21–23 October 2017. [Google Scholar]
  30. Pandey, A.C.; Rajipoot, D.S.; Saraswat, M. Feature selection method based on hybrid data transformation and binary binomial cuckoo search. J. Ambient. Intell. Humaniz. Comput. 2019, 11, 719–738. [Google Scholar] [CrossRef]
  31. Abd El Aziz, M.; Hassanien, A.E. Modified cuckoo search algorithm with rough sets for feature selection. Neural. Comput. Appl. 2018, 29, 925–934. [Google Scholar] [CrossRef]
  32. Kelidari, M.; Hamidzadeh, J. Feature selection by using chaotic cuckoo optimization algorithm with levy flight, opposition-based learning and disruption operator. Soft Comput. 2021, 25, 2911–2933. [Google Scholar] [CrossRef]
  33. Alia, A.; Taweel, A. Enhanced Binary Cuckoo Search with Frequent Values and Rough Set Theory for Feature Selection. IEEE Access 2021, 9, 119430–119453. [Google Scholar] [CrossRef]
  34. Kabla, A.; Mokrani, K. Bearing fault diagnosis using Hilbert-Huang transform (HHT) and support vector machine (SVM). Mech. Ind. 2016, 17, 3. [Google Scholar] [CrossRef]
  35. Chegini, S.N.; Bagheri, A.; Najafi, F. A new intelligent fault diagnosis method for bearing in different speeds based on the FDAF-score algorithm, binary particle swarm optimization, and support vector machine. Soft Comput. 2019, 24, 10005–10023. [Google Scholar] [CrossRef]
  36. Sosa-Cabrera, G.; García-Torres, M.; Gómez-Guerrero, S.; Schaerer, C.E.; Divina, F. A Multivariate approach to the Symmetrical Uncertainty Measure: Application to Feature Selection Problem. Inf. Sci. 2019, 2019, 494. [Google Scholar] [CrossRef]
  37. Chen, Q.; Zhao, L.; Lu, J.; Kuang, G.; Wang, N.; Jiang, Y. Modified two-dimensional Otsu image segmentation algorithm and fast realisation. IET Image Process. 2012, 6, 426–433. [Google Scholar] [CrossRef]
  38. Traag, V.A. Faster unfolding of communities: Speeding up the Louvain algorithm. Phys. Rev. E 2015, 92, 032801. [Google Scholar] [CrossRef] [PubMed] [Green Version]
  39. Wang, Q.F.; Wang, S.; Wei, B.K.; Chen, W.W.; Zhang, Y.F. Weighted K-NN Classification Method of Bearings Fault Diagnosis with Multi-Dimensional Sensitive Features. IEEE Access 2021, 9, 45428–45440. [Google Scholar] [CrossRef]
  40. Ouadfel, S.; Elaziz, M.A. Enhanced Crow Search Algorithm for Feature Selection. Expert Syst. Appl. 2020, 159, 113572. [Google Scholar] [CrossRef]
  41. Fushiki, T. Estimation of prediction error by using K-fold cross-validation. Stat. Comput. 2011, 21, 137–146. [Google Scholar] [CrossRef]
  42. Li, W.; Chao, X.Q. Improved particle swarm optimization method for feature selection. J. Front. Comput. Sci. Technol. 2019, 13, 990–1004. [Google Scholar]
  43. Mirjalili, S.; Lewis, A. S-shaped versus V-shaped transfer functions for binary particle swarm optimization. Swarm Evol. Comput. 2013, 9, 1–14. [Google Scholar] [CrossRef]
  44. Tan, F.; Fu, X.Z.; Zhang, Y.P. A genetic algorithm-based method for feature subset selection. Soft Comput. 2008, 12, 111–120. [Google Scholar] [CrossRef]
  45. Heidari, A.A.; Mirjalili, S.; Faris, H.; Aljarah, I.; Mafarja, M.; Chen, H.L. Harris hawks optimization: Algorithm and applications. Future Gener. Comput. Sys. 2019, 97, 849–872. [Google Scholar] [CrossRef]
  46. Mirjalili, S.; Lewis, A. The whale optimization algorithm. Adv. Eng. Softw. 2016, 95, 51–67. [Google Scholar] [CrossRef]
  47. Mirjalili, S.; Gandomi, A.H.; Mirjalili, S.Z.; Saremi, S.; Faris, H.; Mirjalili, S.M. Salp swarm algorithm: A bio-inspired optimizer for engineering design problems. Adv. Eng. Softw. 2017, 114, 163–191. [Google Scholar] [CrossRef]
  48. Mirjalili, S.; Mirjalili, S.M.; Lewis, A. Grey wolf optimizer. Adv. Eng. Softw. 2014, 69, 46–61. [Google Scholar] [CrossRef] [Green Version]
  49. Jiang, W.; Xu, Y.H.; Chen, Z.; Zhang, N.; Zhou, J.Z. Fault diagnosis for rolling bearing using a hybrid hierarchical method based on scale-variable dispersion entropy and parametric t-SNE algorithm. Measurement 2022, 191, 110843. [Google Scholar] [CrossRef]
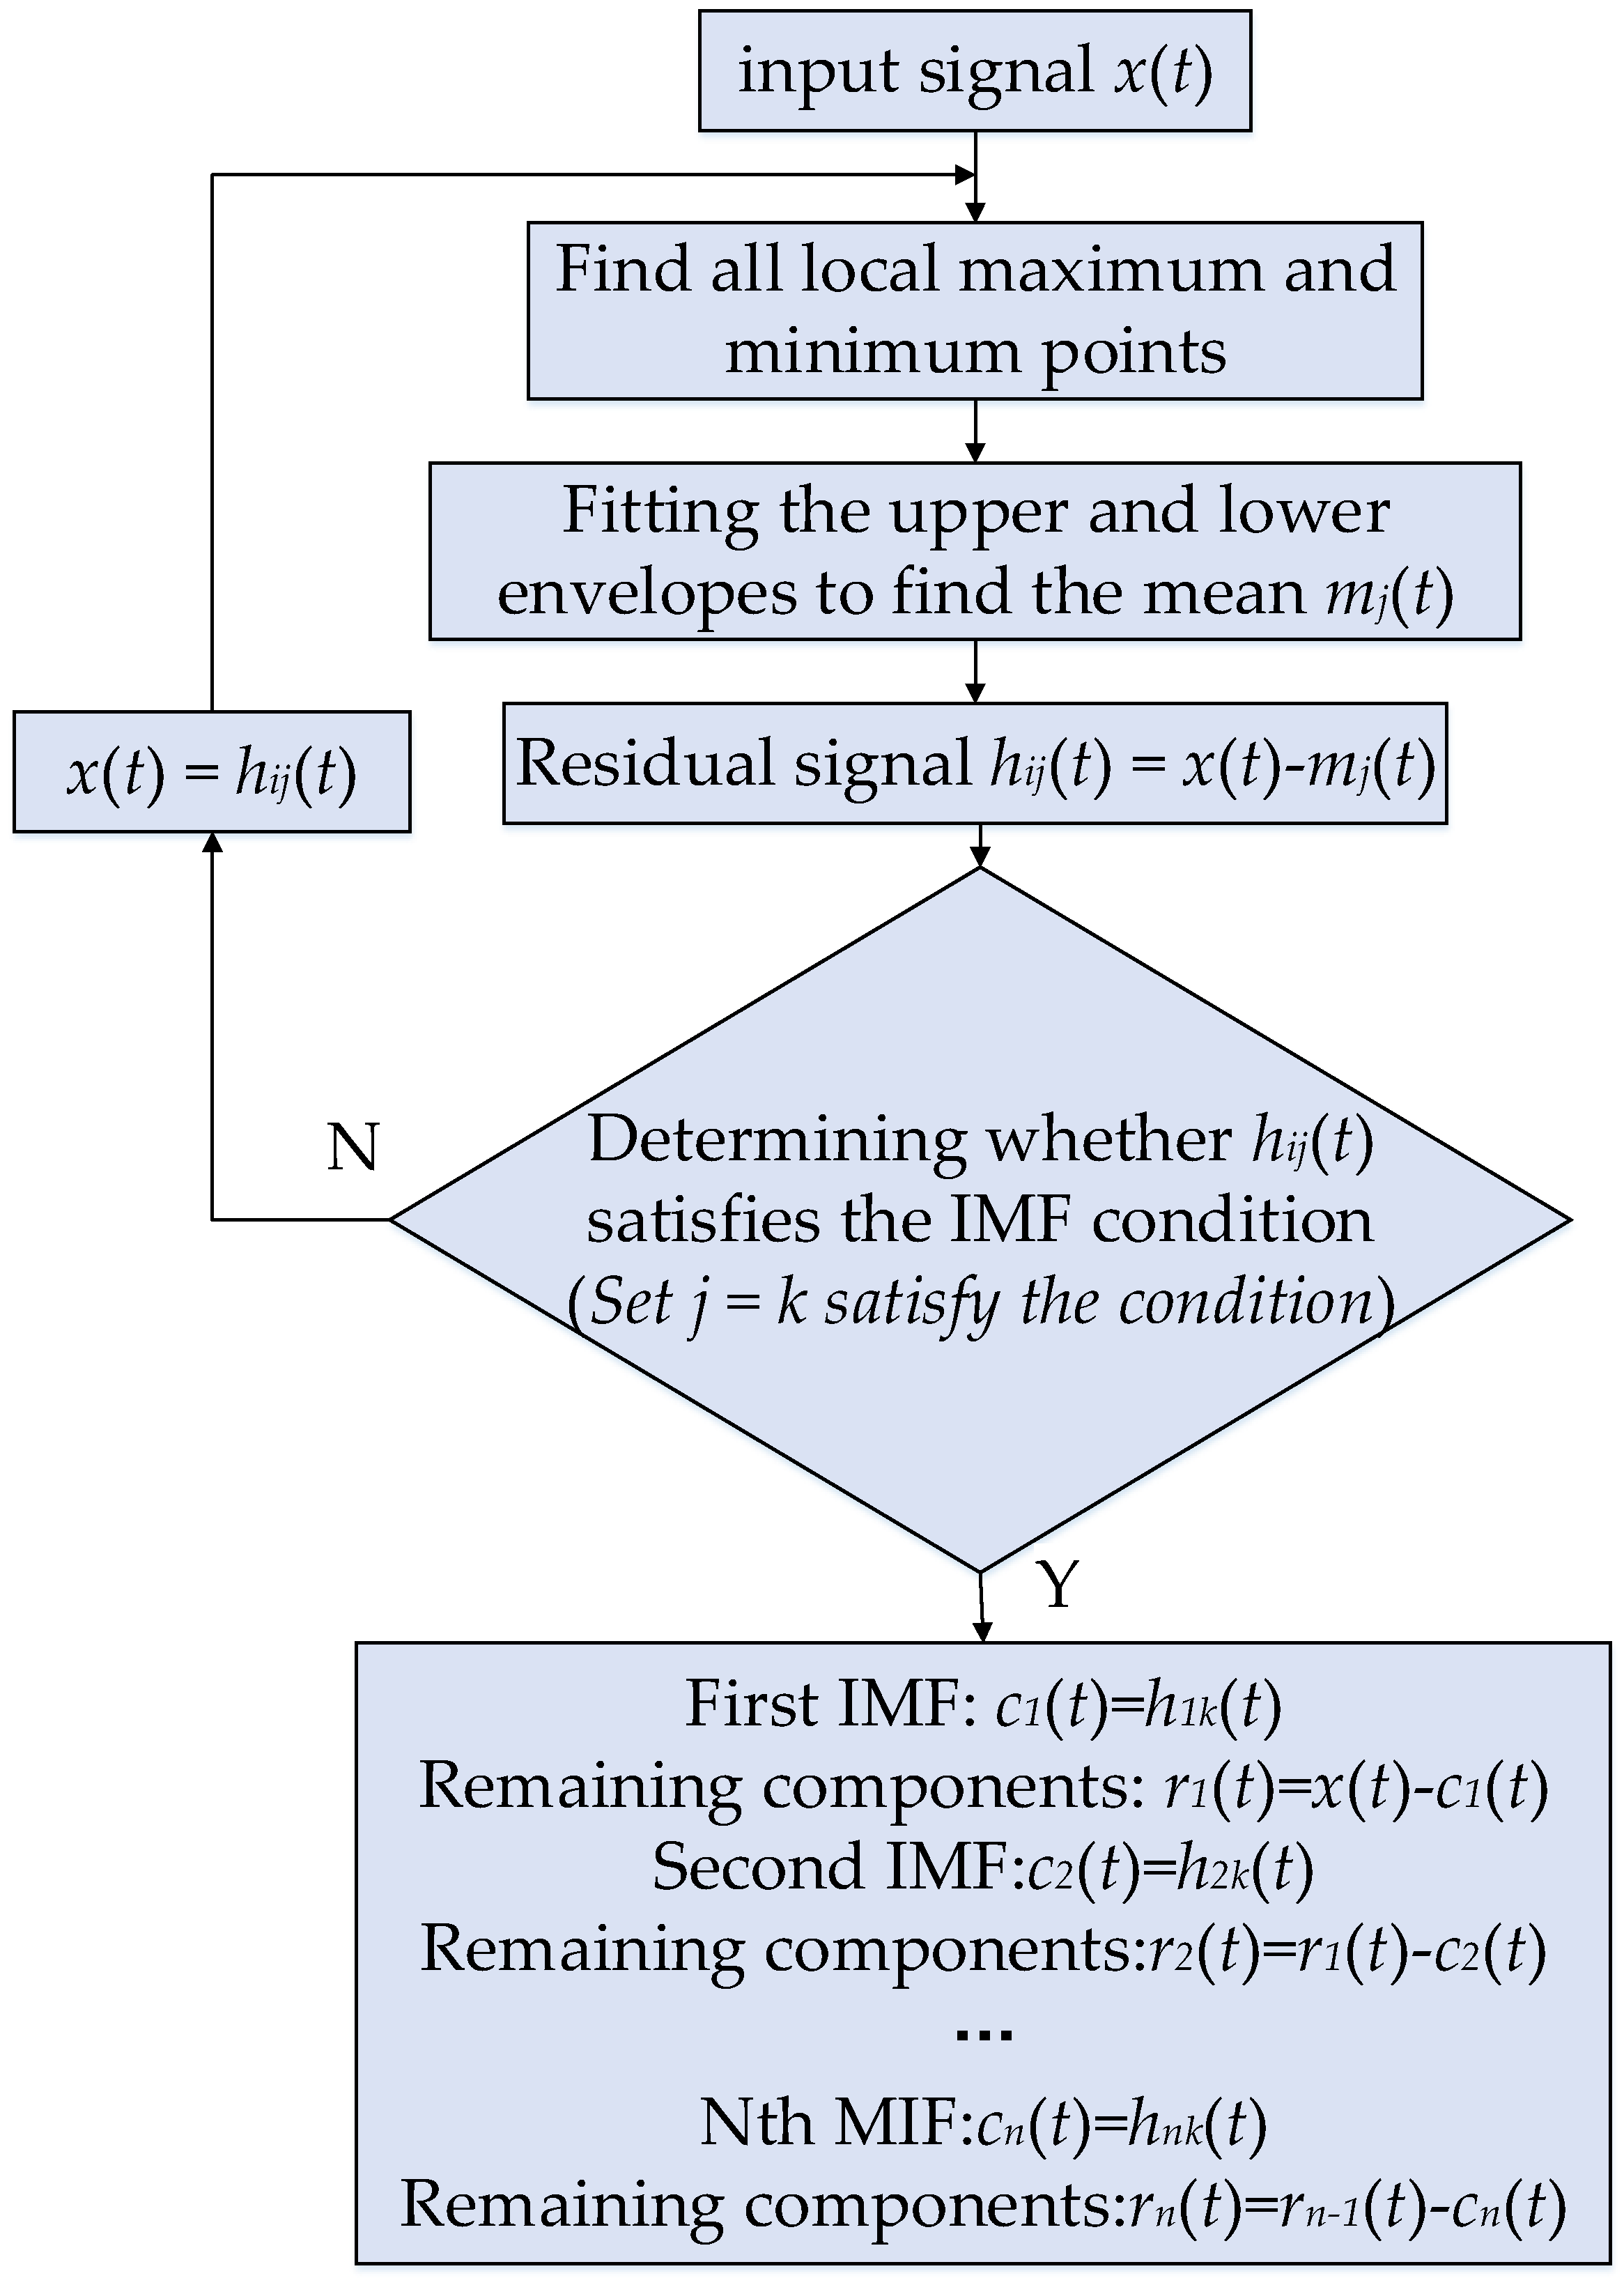
Figure 1. Signal decomposition flow chart of the EMD method.
Electronics 12 00459 g001
Figure 2. Feature extraction process diagram.
Electronics 12 00459 g002
Figure 3. Louvain algorithm clustering visualization. Different numbers represent different features.
Electronics 12 00459 g003
Figure 4. Flowchart of the clustering hybrid initialization method.
Electronics 12 00459 g004
Figure 5. Diagram of the basic principle of the KNN classifier. Blue, orange, green and red colors represent different categories of known samples. Grey represents unknown samples.
Electronics 12 00459 g005
Figure 6. Flowchart of the CHBCS algorithm.
Electronics 12 00459 g006
Figure 7. Average histogram of the number of features for the three algorithms.
Electronics 12 00459 g007
Figure 8. Iterative fitness curves of the three algorithms.
Electronics 12 00459 g008
Figure 9. Vibration signal of ten bearing states.
Electronics 12 00459 g009
Figure 10. Diagram of the fault diagnosis model.
Electronics 12 00459 g010
Figure 11. Two-dimensional distribution map of t-SNE.
Electronics 12 00459 g011
Figure 12. Fitness convergence curves for nine kinds of algorithm.
Electronics 12 00459 g012
Figure 13. The optimal fitness value of nine algorithms after being run 20 times.
Electronics 12 00459 g013
Table 1. Dataset information.
DatasetThe Number of FeaturesThe Number of SamplesThe Number of Classes
BreastEW305692
Exactly1310002
HeartEW132702
Hillvalley10060615
Libras903603
Musk11664762
Sonarall602082
Spectf442672
WDBC305692
Table 2. Classification error rate of three initialization strategies.
DatasetBCS (Rand)BCS (BC)BCS (CH)
BreastEW0.02910.02890.0281
Exactly0.00110.00350.0006
HeartEW0.14370.14700.1425
Hillvalley0.39320.39010.3865
Libras0.22960.22720.2264
Musk10.78900.09040.0730
Sonarall0.11870.11730.1170
Spectf0.16020.16510.1589
WDBC0.03000.02910.0271
Table 3. Classification results of three algorithms.
DatasetAlgorithmError ± StdNO. ± Std
BreastEWBCS0.0276 ± 4.68 × 10−35.50 ± 1.11
EBCS0.0277 ± 4.53 × 10−35.35 ± 1.10
CHBCS0.0252 ± 4.33 × 10−34.85 ± 1.52
ExactlyBCS0.0111 ± 2.50 × 10−36.65 ± 0.72
EBCS0.0006 ± 1.62 × 10−36.15 ± 0.35
CHBCS0.0000 ± 0.006.00 ± 0.00
HeartEWBCS0.1451 ± 6.58 × 10−33.80 ± 0.87
EBCS0.1436 ± 7.00 × 10−33.12 ± 0.30
CHBCS0.1399 ± 2.51 × 10−33.10 ± 0.30
HillvalleyBCS0.3956 ± 6.53 × 10−38.75 ± 4.81
EBCS0.3889 ± 6.87 × 10−36.55 ± 3.15
CHBCS0.3679 ± 8.15 × 10−36.10 ± 2.87
LibrasBCS0.1947 ± 0.85 × 10−320.15 ± 6.77
EBCS0.1968 ± 1.07 × 10−216.80 ± 7.17
CHBCS0.1797 ± 0.99 × 10−318.80 ± 4.31
Musk1BCS0.0820 ± 5.59 × 10−39.52 ± 2.52
EBCS0.0891 ± 1.10 × 10−210.05 ± 2.43
CHBCS0.0578 ± 1.26 × 10−28.20 ± 3.16
SonarallBCS0.0916 ± 1.14 × 10−217.95 ± 5.01
EBCS0.1007 ± 9.80 × 10−316.40 ± 2.98
CHBCS0.0822 ± 1.19 × 10−215.15 ± 5.43
SpectfBCS0.1584 ± 1.23 × 10−27.50 ± 3.00
EBCS0.1631 ± 7.71 × 10−36.55 ± 1.73
CHBCS0.1456 ± 1.02 × 10−25.15 ± 2.35
WDBCBCS0.0287 ± 4.45 × 10−35.70 ± 1.14
EBCS0.0286 ± 4.78 × 10−35.15 ± 1.28
CHBCS0.0262 ± 4.87 × 10−34.80 ± 1.45
Table 4. CWRU bearing data.
NO.Failure ModeFault LocationFault Size (Inches)Number of Samples
1B07B0.00750
2B14B0.01450
3B21B0.02150
4IR07IR0.00750
5IR14IR0.01450
6IR21IR0.02150
7OR07OR(6:00)0.00750
8OR14OR(6:00)0.01450
9OR21OR(6:00)0.02150
0normal--50
Table 5. Parameter settings.
AlgorithmParameter Setting
BCSN = 50; Tmax = 100; Pa = 0.25
EBCSN = 50; Tmax = 100; Pa = 0.25
BPSON = 50; Tmax = 100; c1 = 0.9; c2 = 0.5
GAN = 50; Tmax = 100; Cp = 0.8; Mp = 0.01
HHON = 50; Tmax = 100; β = 0.25
WOAN = 50; Tmax = 100; α decreases linearly from 2 to 0
SSAN = 50; Tmax = 100; c1 and c2 are randomly distributed
GWON = 50; Tmax = 100; α decreases linearly from 2 to 0
CHBCSN = 50; Tmax = 100
Table 6. Classification results of the CHBCS algorithm and other algorithms.
AlgorithmErrorNo.Fitness
ALL0.060050.000.1540
BCS0.019713.050.0438
EBCS0.02499.050.0399
BPSO0.024312.450.0468
GA0.02296.300.0333
HHO0.023205.400.0396
WOA0.02565.500.0341
SSA0.028318.250.0620
GWO0.02574.950.0330
CHBCS0.01134.750.0197
Disclaimer/Publisher’s Note: The statements, opinions and data contained in all publications are solely those of the individual author(s) and contributor(s) and not of MDPI and/or the editor(s). MDPI and/or the editor(s) disclaim responsibility for any injury to people or property resulting from any ideas, methods, instructions or products referred to in the content.