Abstract
When micro-expressions are mixed with normal or macro-expressions, it becomes increasingly challenging to spot them in long videos. Aiming at the specific time prior of micro-expressions (MEs), an ME spotting network called AEM-Net (adaptive enhanced ME detection network) is proposed. This paper is an extension of the conference paper presented at the Chinese Conference on Biometric Recognition (CCBR). The network improves spotting performance in the following five aspects. Firstly, a multi-stage channel feature extraction module is constructed to extract the features at different depths. Then, an attention spatial-temporal module is leveraged to obtain salient and discriminative micro-expression segments while suppressing the generation of excessively long or short suggestions. Thirdly, a ME-NMS (non-maximum suppression) network is developed to reduce redundancy and decision errors. Fourthly, a multi-scale feature fusion module is introduced to fuse up-sampling features of high-level maps and fine-grained information, which obtains meaningful information on feature distribution and contributes to a good representation of MEs. Finally, two spotting mechanisms named anchor-based and anchor free were integrated to get final spotting. Extensive experiments were conducted on prevalent and the SAMM-Long ME databases to evaluate the spotting performance. The results show that the AEM-Net achieves competitive performance, outperforming other state-of-the-art methods.
1. Introduction
Facial expressions, as alternative presentations of human emotion apart from speech, specifically their recognition, is a hot direction of affective computing. In addition to the macro-expressions (MaEs) that occur usually, micro-expressions can appear in the context of certain special situations. Micro-expressions (MEs), which arise in high-risk environments, are involuntary facial movements that occur spontaneously when an individual encounters certain emotions but try to suppress facial expressions [1]. Therefore, MEs can be widely applied in a series of fields. For example, when assessing the performance of a lecture session based on a student’s emotions, a transitory ME can reveal emotions normally hidden by the student. In business situations, a salesman can use ME to estimate a client’s real reaction during the showcasing of goods. Border control agents can detect unusual patterns of behavior by asking questions. The U.S. transportation security administration developed a spotting program, whereby airport staff are trained to monitor suspicious behaviors by analyzing MEs and signs in conversations [2]. In the medical field, especially in psychotherapy, doctors can use MEs as a guide to know how patients really feel [3]. Briefly, MEs analysis plays a vital role in analyzing people’s hidden emotions in various situations.
The duration of a ME is very short (generally no more than 500 ms) [4], and the intensities of involved muscle movements are subtle [5]. The automatic computing and analysis of ME is a new field in facial analysis, which began to arouse great interest from 2014 [6,7,8,9]. Generally speaking, facial ME analysis includes two tasks: recognition and spotting. The ME recognition has to do with determining the emotional states causing MEs, and the spotting is to locate the temporal positions of MEs in a video. Based on our survey, most ME researches focus on the recognition task, and ME spotting is given limited attention. This work aims to develop the ME spotting approach. For real-world applications, MEs, MaEs and no-expressions may exist simultaneously in long video sequences. Thus, the prerequisite for identifying categories of expression clips is to spot them accurately. As a video usually contains several expression clips, the purpose of the spotting is to predict the onset frame and offset frame, then keep the intersection over union (IoU) of ground truths (GTs) and proposals no less than the specified threshold. The principle of ME spotting with four scales is visualized in Figure 1. A clip of MaE or ME implies the complete process of certain emotion, which typically contains an onset frame, an apex frame and an offset frame. Based on this viewpoint, the onset frame is the starting point of an expression. The apex frame means the peak of facial muscles’ motions. The offset frame defines the point back to the initial state of the expression.
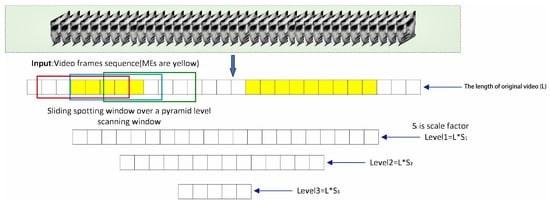
Figure 1.
Visualization of micro-expression spotting with four scales.
Recent advances in deep learning have witnessed widespread popularity in the recognition task, though limited efforts have been made for the spotting task, especially on long “untrimmed” videos. Owing to the similarity between temporal action spotting and object detection, many temporal action detection methods adopt a framework similar to object detection methods. One-stage detection of long videos was proposed firstly in SSAD [10], which detects the time boundaries and confidence scores of multiple categories directly. However, most long-video detection methods implement two-stage detectors, such as Faster RCNN, which will first obtain the proposals and then identify the category. Considering the low time cost of small ME data, this work concentrates on the two-stage framework for ME localization in long videos.
At present, ME spotting in long videos is still a worthwhile research topic with extraordinary attentions. However, several key challenges remain unresolved.
- The existing ME spotting samples are very limited; without abundant data, the deep neural network will fully “drain” the training data and over-absorb the information from the training set, resulting in performance degradation in the testing set.
- Due to the subtle movements of MEs, it is difficult to find MEs integrally in long video sequences; in other words, it is difficult to determine the boundaries of MEs.
- The temporal extent of expression varies dramatically compared to the sizes of objects in an image (from a fraction of 0.04 to 4 s). The significant distinction in duration also makes it very challenging to locate MEs and MaEs.
To improve the performance of ME spotting in long videos from the aforementioned three folds, we propose an adaptive enhanced micro-expression detection network based on a specific prior of ME. The main contributions of this paper are summarized as follows:
- We propose a multi-stage channel feature extraction module, named Prelayer, which is capable of fusing optical flow modality and RGB information and alleviating the problem of insufficient samples.
- A multi-scale network with the fusion of multiple scale features and an anchor-free-based mechanism was developed to locate each ME’s boundaries accurately.
- A new post-processing network for MEs, named ME-NMS (non-maximum suppression), is utilized to enhance the detection accuracy of some extremely short fragments.
This work is an extended version of our conference paper in the sixteenth Chinese Conference on Biometric Recognition (CCBR) [11], in which the multi-scale feature fusion network was shown to improve the spotting performance. Our code for this work is available at https://github.com/sijiacheng-0827/AEM-Net (accessed on 16 October 2022).
2. Related Work
In this section, we introduce the work related to the proposed spotting method. The related studies include action location, micro-expression spotting and non-maximum suppression.
2.1. Action Localization
The main purpose of action localization is to learn how to spot action instances in untrimmed videos, where boundaries and categories of action instances have been annotated. There are two kinds of action localization pipelines, the first being the one-stage pipeline, such as SSAD, and the other, the two-stage pipeline. Faster R-CNN is a typical example of a two-stage pipeline, which introduces a region proposal network (RPN) to generate proposals and also introduces an anchor box to cope with the changes in target shape. TAL [12] combined the two-stage pipeline with action localization and proposed an improved multi-scale-architecture, video-based action localization method which can accommodate extreme variation in action duration. While the aforementioned anchor-based methods severely rely on default anchors, which constrains the anchor point to be the center of the action instance. The anchor-based method limits the flexibility of dealing with action instances with drastic changes, especially for very short or long action instances. In order to address this problem, A2Net [13] uses an anchor-free module combined with the traditional anchor-based method for time-action positioning tasks, which assists action localization by temporal points and is capable of predicting the action instances whose durations are either extremely short or extremely long. In this paper, the mechanism proposed by A2Net is introduced into the localization of expression videos, so that very short micro-expression clips and very long macro-expression clips are localized precisely.
2.2. Micro-Expression Spotting
In micro-expression spotting, the duration of the micro-expression can be located by sliding the time window. Deep learning was used to perform ME localization for the first time in [14]. Their method uses 2D convolution to extract spatial features, 1D convolution to extract temporal features and the network module to generate clip proposals in the time domain. The clip proposal corresponds to the region proposal in the spatial domain. Moilanen et al. used local binary patterns (LBP) to extract feature differences (FD) between each frame of the video sequence to analyze the changes in facial motion and calculate the feature Chi-square () to generate the magnitude of the differences [15]. Davison et al. [16,17] spotted micro-expressions by histograms of oriented gradients. They represented all sequences detected within 100 frames as true positives, including blinks and fixations. Motion sequences that were detected but not encoded were classified as false positives. Patel et al. proposed a method to compute optical flow vectors over a small range and integrate them into the incorporated Spatio-temporal region to determine onset and offset times [18]. Tran et al. [19] constructed a multiscale benchmark based on a sliding-window multiscale assessment to fairly and better evaluate micro-expression identification methods. Wang et al. [20] implemented the same approach to spot micro-expressions in . SOFTNet [21] proposed a multi-scale network model to predict a score, which captures the possibility of a frame in an expression interval by taking the location task as a regression problem and introducing pseudo-tags to promote learning efficient. Yifei Guo et al. proposed a ME spotting method [22] based on a magnitude and angle-combined optical flow feature, exploiting the angle information. LSSNet [23] compared the effect of localization frames or segments in the 2021 micro-expression contest. They also introduced a position-suppression module, which is similar to a non-local neural network [24]. It aims to suppress too-long and too-short proposals. The AEMNet proposed in this paper is an improvement on LSSNet, in which a deep feature adaptive enhancement module and a multi-level feature extraction module are integrated to focus on more subtle feature changes. Moreover, a feature pre-processing network named ME-NMS was designed, which combines the micro-expression prior to suppress the false detections and sets a suitable threshold for micro-expressions.
2.3. Non-Maximum Suppression
Non-maximum suppression (NMS) is an important part of the object detection process. NMS and its variants have been extraordinarily explored in recent years [25,26,27]. Specifically, the detection box is sorted by score, and then the box with the highest score is retained; other boxes whose overlap area with the box is larger than a certain proportion are deleted. If an object is within the preset overlap threshold, the object to be detected may not be detected. That is, when the two target boxes are close to each other, the box with a lower score will be deleted because the overlap area is too large. In most cases, there is no strong correlation between IoU and classification scores, and many boxes with high confidence in classification tags are not very accurate. In this regard, Navaneeth Bodlaand et al. proposed an approach, namely, Softnmsin, whose main function is to reduce confidence. This method greatly reduces the false detection rate for video clips. Seq-NMS proposed a modification of the post-processing phase that uses high-scoring object detection from nearby frames to boost scores of weaker detection within the same clip.
Inspired by these methods above, it is necessary to tune a post-processing network for ME-aware representation. More importantly, a new network namely, ME-NMS, was designed to add a prior of ME for good learning capacity.
3. Our Method
This section will introduce the AEM-Net in detail. First, the architecture of AEM-Net is outlined, and then the corresponding modules in the model are described.
3.1. Network Architecture
AEM-Net mainly consists of four parts: the multi-stage channel feature extraction module, multi-scale fused-feature localization network, position suppression and adaptive deep feature enhancement module and post-processing module (ME-NMS). The entire network structure is shown in Figure 2. Yu et al. [23] used the I3D model to extract micro-expression features in the LSSNet framework. The convolutional kernels and pooling kernels in the image classification network are extended from 2D to 3D, and the effective features can be extracted. However, the flow information and the RGB information extracted from the I3D model do not sufficiently interact. In order to extract richer and more robust features, a multi-stage channel feature extraction module named Prelayer was introduced. After obtaining the features that contain rich information, a sliding-window operation is performed on these feature sequences on four scales, in which the downsampling step of each scale is set to 2, and the feature maps of the next layer with larger receptive fields are upsampled and used to guide feature prediction in this layer. The number of frames contained in a micro-expression clip is often a relatively limited range, and the proposals obtained by the sliding-window operation may contain too many or too few frames, which will seriously interfere with the normal prediction and affect the detection performance. In order to suppress too-long and too-short proposals, and to make our network pay more attention to tiny motion features, a spatio-temporal attention module should be set up. The spatial attention mechanism is used to screen the proposals in a certain range, so as to improve the feature expression of crucial regions. The channel attention mechanism automatically obtains the importance of each feature channel by learning the network so that it adaptively strengthens the essential features and suppresses the non-important features. Finally, the ME-NMS module is proposed to search for the optimal candidate segment of the clip and suppress the false detection segment.
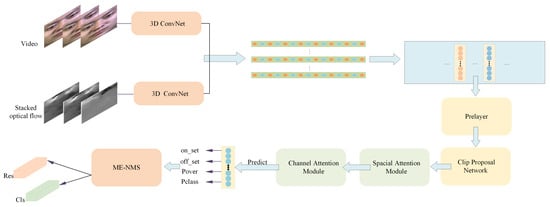
Figure 2.
Backbone network: AEM-net consists of four parts, which are the multi-stage channel feature extraction module (Prelayer, introduced in Section 3.1.1); the multi-scale fused-feature localization network (clip proposal network, elaborated in Section 3.2.1); the position suppression and adaptive deep feature enhancement module (spatial attention block, elaborated in Section 3.2.2; channel attention module, explained in Section 3.2.2) and the ME-NMS module (described in Algorithm 1).
Given a video with MaEs or MEs or both, AEM-Net aims to locate all the MaE and ME instances appropriately. Suppose that all expressions in this video, where and represent onset and offset frames of the expression, respectively; indicates the category label.
3.1.1. Multi-Stage Channel Feature Extraction
For a ME long video, LSSNet uses the dual-stream inflated 3D convolutional network (I3D) [28] to extract features from both the original images and the optical flow. On the one hand, the convolutional and pooling kernels in the image classification network are extended from 2D to 3D so as to learn spatio-temporal features by the 3D convolution network directly. On the other hand, the performance of ME spotting will be improved through the operation of fusing optical flow features. The features obtained through the I3D network contain some micro-expression information. However, the model simply concatenates the spatio-temporal and optical flow features. The insufficient fusion of them will lead to the loss of a lot of useful information and greatly increase the probability of negative samples. In order to extract richer and more robust features, a multi-stage channel feature extraction module was designed. The detailed structure of the module is shown in Figure 3.
| Algorithm 1 ME-NMS loss calculating procedure. |
Output: Correct process
|
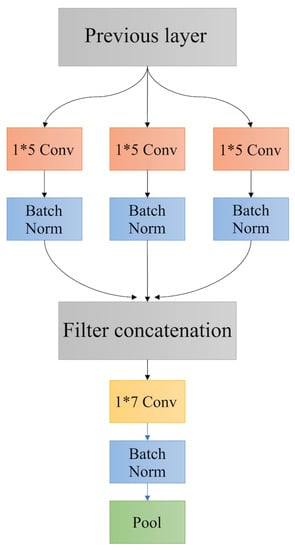
Figure 3.
The structure of multi-stage channel feature extraction: Each convolution kernel is set up with 384, 640, and 1024 filters, respectively, to capture multi-stage channel features.
3.2. Modules
Specifically, three one-dimensional convolutional layers with different numbers of convolutional kernels were used to convolute the spatio-temporal and the optical flow features from the I3D model to obtain feature sequences with different channel numbers. The difference in the number of channels makes each feature sequence focus on different information. The parameter error of the convolutional layer will cause the offset of the estimated mean value, so a max pooling layer is needed to reduce the offset error and retain more facial texture information after each convolutional layer. Then, the feature sequences that pass through the max pooling operation are fused to obtain a richer feature expression.
3.2.1. Clip Proposal Network
In the field of object detection, researchers use segmentation algorithms to generate proposal regions. Micro-expression spotting is different from target detection. Figure 4 presents the effects of different lengths of clips using anchor-based and anchor-free methods, which were measured by MAP (mean average precision) [29].
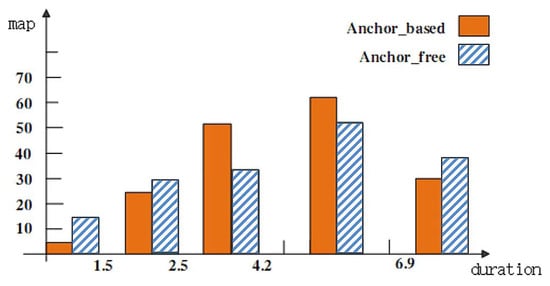
Figure 4.
The investigation of a suitable detector for clips of different durations.
For fragments with a duration between [2.5–4.9], the anchor-based detector head contributes to better results, and for fragments with a duration in the range of [0–2.5] or [4.9–6.9], the anchor-free detector head leads to better results. As the duration of the micro-expression sequence is generally in the range of [0–0.5] and the duration of the macro-expression sequence is generally in the range of [0.5–4], we combine the two detector heads as the detector in our method. The threshold was set as 0.1:0.1:0.7. The performance comparison focuses on the score under the threshold 0.5. It can be found that the anchor-free mechanism is more suitable for very short clips and the anchor-based mechanism is more suitable for medium-length clips. For the positioning of mixed-length clip sets, it is necessary to consider an effective combination of the two detectors. Hence, we follow the method of generating proposal regions in LSSNet. Specifically, anchor-based and anchor-free methods are employed in generating proposals. The detailed clip proposal network is shown in Figure 5.
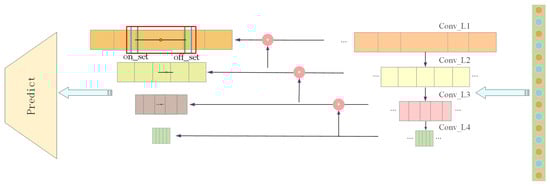
Figure 5.
The structure of the clip proposal network.
The lengths of MaEs and MEs in the datasets range from 3 to 117 frames. To be exact, the length of MEs range from 8 to 16 frames, and the lengths of MaEs range from 3 to 117. In view of this attribute of MaEs and MEs, it is necessary to ensure that the generated proposals are between 2 and 128. However, the generated feature sequence is too large when the proposal scale is set to two, leading to considerable computational complexity. Therefore, the case of scale two is discarded. In addition, five ratios [0.5, 0.75, 1, 1.5, 2] are set for the anchor of each scale, so we finally selected four scales from to as the anchor template. A convolutional layer with stride is used to reduce the temporal length at each hierarchy. Subsequently, the feature maps from the upper layer are up-sampled with the ratio of two. We also took a feature map from earlier in the network and merge it with our up-sampled features using the adding operator. This method enables our model to get more meaningful semantic information from the up-sampled features and finer-grained information from the earlier feature maps. In addition, several convolutional layers are embedded to eventually predict a similar tensor. Suppose the regression output of layer i is , is the ratio of anchors, and the frame number of the sliding window is . The number of anchors can be defined as follows:
The anchor-based module selects the closest-matched anchor and regresses the boundary step by step. This mechanism enhances the capability to dispose of action instances with various lengths. Unlike the method of anchor-based, the proposed anchor-free module regresses the distances from the center of an action instance to its boundaries. Compared with previous prediction methods over action proposals, anchor-free regression is more flexible and robust, especially for action instances with extremely short or long durations. In more detail, the action instances are divided into several levels according to the actions’ temporal length. After mapping back, if the calculation result falls into the action’s scope, it is said to be the foreground point; otherwise, a background point. The anchor-free module predicts the classification score to determine whether a point falls into an action instance and its category label.
It can be found that the anchor-free module performs well for relatively short or long action instances, though the anchor-based module is more suitable for medium or long action instances. In essence, the reason for this phenomenon lies in the inherent flexibility of the anchor-free module and the stability of the classification and detection process adopted by the anchor-based module. As the duration of a micro-expression is short, the action is small, and there is a lot of interference in the facial expression. The duration of a macro-expression is longer and the action is larger. Thus, we use the detector combined with the anchor-based and the anchor-free modules. Combined with its detection ability, the weights of the two detectors in the detection are adjusted.
3.2.2. Spatio-Temporal Attention Block
In order to spot expression intervals of different duration (0.04–4 s) accurately, three down-sampling layers, that is, the convolution with four scales, were designed to comply with the intervals of expressions with a large duration span. However, it can lead to data redundancy and an increase in negative samples. The main reason is that the fewer down-sampling times are captured, the fewer scales and more proposals are generated. As a result, the attention to short-time duration samples is weaker. Thus, an attention module is introduced to alleviate this situation. Firstly, following the feature processing network, the clips in the dataset are restructured with some videos shorter than corresponding clips of MaE or some videos longer than the length of the whole video. Thus, the location-suppression module is built to suppress the too-long and too-short proposals. Secondly, the channel-wise feature recalibrating module is applied to focus on the adaptive local receptive field sizes of neurons. The detail of the channel attention block is shown in Figure 6. This will increase the attention of the network on short time samples and enhances the performance of ME spotting.
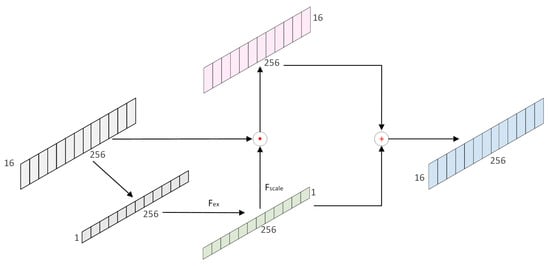
Figure 6.
The detail of the channel attention block.
For the implementation of the position suppression part, assuming that the length of the sliding window is ; the sampling frequency of this sliding window is f; the strides of the current layer are ; and the input of sliding windows is , where is the batch size, is the channel number and is the length of the current proposals.
A position enhancer is calculated by scale variation, which is activated with softmax as the weight of for different lengths of .
where the size of position is , the size of is and the number of is . The network structure is shown in Figure 7.
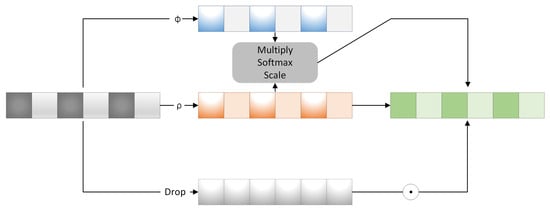
Figure 7.
The detail of the spatio-attention block.
At the same time, to explore the relations among channels, the model proposes an architecture to recalibrate channel-wise feature responses by explicitly considering inter-dependencies between channels. Each weight value corresponds to each channel. It can present the correlation in channels by forming a bottleneck structure and outputting the same weights as the input features. Concretely, the global spatial information is first squeezed into the channel descriptors, which is average-pooled to 1, then recalibrated by , which contains two fully connected layers, and then the weight matrix is obtained. Finally, the weights are assigned to the sequence features. The weight of the channel is ; is the original feature sequence.
is the compression of the global spatial information into the channel descriptor. The global-average pooling is utilized to generate channel interaction. The operation is to squeeze the information in the time domain to a single point, which will take advantage of the information gathered in the compression operation. Then, a simple gating mechanism with a sigmoid activation is followed. Layer normalization is used to balance the data distribution. In the end, the additional gain in performance is obtained by adding dropout in the convolutional layers.
3.2.3. ME-NMS Module
NMS is the abbreviation of non-maximum suppression. In traditional object detection, the closer the positions of the two boxes, the higher the score used for the benchmark. Specifically, the IoU (intersection of union) of two boxes is calculated by Equation (10).
If the IoU exceeds the threshold, it will suppress the box with a smaller score. As there is no need to output two similar boxes, the one with a large score is kept. In this paper, in order to reduce category decision errors, a ME-NMS module is proposed for ME spotting. In the post-processing process, we can set the box with the highest score as the candidate object and then sort the candidate boxes according to their scores from big to small; we intersect the current candidate segment with the union of the number n of first best candidates, and those with scores lower than the threshold are discarded ( is set to 0.2). As a result, the false detection samples can be filtered out. As the micro-expression duration is extremely short and susceptible to interference, a threshold of ME should be set based on a short duration prior of ME. Through this operation, our multi-scalar localization process allows for a more accurate location of ME. Taking into account a video sequence, the anchor-based spotting module predicts anchors at each time position. By contrast, the anchor-free mechanism considers a temporal location on feature map ; the accumulated stride of the current layer is . Therefore, we can map it back onto the input sequence:
Since the length of micro-expressions in the dataset ranges from 3 to 16, considering the mapping mechanism, a threshold was set for micro-expression localization during the post-processing process to filter candidate clips:
where is the number of frames in the longest micro-expression video clip and is the slider box size of layer 2. When the duration of the obtained candidate segment is larger than this threshold, the candidate segment will be taken as the final result. The algorithm implementation is elaborated in Algorithm 1.
4. Experiments
4.1. Database
[30] and SAMM-LV [31] were used for evaluating the proposed method. is composed of 57 MEs and 300 MaEs, of which 57 ME samples are in 97 videos from 22 subjects with 30 frames percent second (FPS). Meanwhile, SAMM-LV includes 343 MaEs and 159 MEs in 147 long videos from 32 subjects with 200 FPS. Both the MaEs and MEs are labeled with corresponding types. Before extracting optical flow components, SAMM-LV was reconstructed by merging short videos and downsampling. Then, the features with 1024 dimensions were extracted from the optical flow information and raw images by I3D models with a frequency of eight and an interval of two. Figure 8 shows the partial samples in two databases.
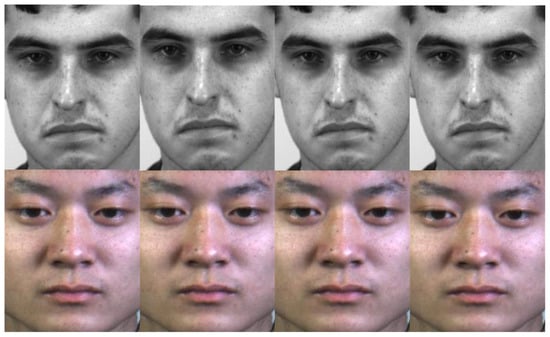
Figure 8.
Partial ME samples. The above is SAMM-LV; below is .
4.2. Method
In our experiments, the TV-L1 optical flow operator was captured to extract the motion-related information for ME. Then, the I3D network, which is used to set fixed sliding windows, was constructed to extract the fixed-length features from the extracted optical flow and the original image. Finally, a multi-stage channel feature extraction module was added in front of the clip proposal network to make the network more sensitive to tiny motion features, and integrated the spatio-temporal information to alleviate the problem of insufficient samples. Three groups of comparative experiments were carried out to test the performance of AEM-net. To maintain fairness, we adopted the popular F1-score index for micro-expression spotting [32].
4.3. Loss Function Settings (Videos of Different Lengths)
In this paper, the detector exploits both the anchor-based and the anchor-free positioning modules. The classification loss generated by the previous module is , the regression loss is , and the overlap loss is . The classification loss generated by the latter module is ; the regression loss is . We combined the loss of the anchor-free module and the loss of the anchor-based module to train AEMNet. The total loss L is defined by Equation (13)
where and are the weights to balance these two kinds of losses. and are provided as follows:
where , and are weights to balance the three losses.
- Anchor-free classification loss: based on the classification scores , AEMNet contributes the by the standard cross-entropy loss.
- The positioned time fragments are regressed to the start and end frames of micro-expressions and expressions . The regression loss adopts the smooth loss [33].
- Anchor-based classification loss: is calculated via cross-entropy loss.
- Anchor-based overlap loss: The overlap is the calculation of intersection over union between the predicted instances and its closest ground truth; it is evaluated with mean-square error loss.
- Anchor-based regression loss: Given regression target and the prediction , the anchor-based regression loss be defined as follows:
4.4. Experimental Parameters and Configurations
All experiments were conducted on Pytorch 1.8.1. The initial learning rate was 0.0008, and the learning rate was decayed by a factor 0.1 with the interval of 30 epochs. The batch size was set to 32. The trade-off parameters were set as .
4.5. Results and Comparisons
The performance of AEM-Net is compared with those of some recent methods. The benchmarks were two public ME long-video datasets, and SAMM-LV. The comparison’s results are listed in Table 1, demonstrating how the AEM-Net approach greatly improves the performance of micro-expression localization. AEM-SE is a network in which the attention module of channel features is added to AEM-Net. AEM-F is a network in which the multiscale feature fusion operation is in a clip proposal module. In Table 1, it can be seen that by changing the attention to channel features, the network pays more attention to detailed features but pays less attention to structural features. The network has an improved ability to localize micro-expressions but less ability to localize macro-expressions. Structural information from large-receptive-field feature maps fused with fine-grained information enables more accurate ME localization.

Table 1.
Comparison with other spotting methods.
Due to the characteristics of short duration and subtle motion in micro-expressions, the proposed method fuses the anchor-based and anchor-free localization mechanisms. We compared the method with the use of anchor-free and anchor-based methods on . The results are shown in Table 2. It is experimentally concluded that the anchor-based+anchor-free method not only improves the accuracy of macro-expression localization, but also improves the accuracy of micro-expression localization, and the combination of these two detectors not only makes the localization of expression segments with different durations more accurate but also solves the problem of classes imbalance.
Table 2.
Different spotting methods used for micro-expression spotting.
To further verify the contribution of the multi-stage channel feature extraction module (Prelayer), the ablation experiments for this module were conducted on . The spotting results are listed in Table 3. As shown in Table 3, compared with a network without Prelayer(Non_pre), the localization performance is better. Therefore, it can be inferred that Prelayer can further optimize the feature sequences extracted from the I3D network by fusing feature-clustering information.
Table 3.
The performance when adding Prelayer.
The impact of ME-NMS on network spotting performance is demonstrated in Table 4. The NMS method represents the same post-processing method without adding a threshold of MEs. NMS-Nom is our network using the traditional NMS algorithm. ME-NMS enables a certain enhancement in micro-expression spotting by setting a prior threshold that fits micro-expressions. However, there is no significant effect on macro-expression detection.
Table 4.
Performance of ME-NMS.
In forward propagation, the activation value of a certain neuron stops working with a certain probability. This makes the model more generalizable because it does not depend too much on certain local features. Following this fact, we did drop out of the output features and did a comparison experiment to explore the dropout rate to obtain optimal results. Specifically, we took (0:0.1:0.4) five groups of comparison experiments; the results are shown in Figure 9. The experimental results show that the best dropout rate is 0.1, which can suppress the overfitting problem of the spotting network.
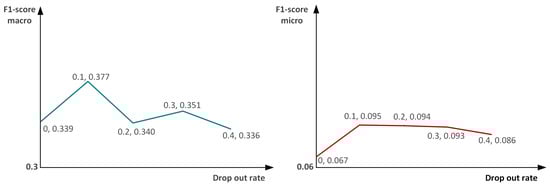
Figure 9.
Exploration of dropout rate. The left graph shows the curves of macro-expression indicators, and the right graph shows the curves of micro-expression indicators.
In the evaluation phase, the top-threshold was used as the evaluation metric. Top-threshold is the top threshold (n%) predicted value of one video at a time for the leave-one-subject-out (LOSO) learning method, which was taken as the evaluation criterion. As the number of positive samples for a video is usually less than eight, we chose the threshold from 0.30 to 0.60 with an interval of 0.05 for testing. Each metric is compared for the dataset and listed in Table 5. As shown in Table 5, the best result for the F1-score on was a threshold of 0.45, which is also used for model training for SAMM-LV.
Table 5.
F1-scoresof MaE and ME spotting on using different top threshold values, one video at a time.
5. Conclusions
In this paper, a Prelayer model was developed for ME spatial-temporal feature fusion, aiming to improve the processing of micro-motion samples. This module combines the anchor-free mechanism with the anchor-based mechanism using fused multi-scale localization to accurately locate the onset and offset frames of expressions, avoiding prior biases regarding localization and duration. Moreover, the ME-NMS module is integrated to further reduce a priori-based false-positive micro-expression samples. In addition, channel attention and spatial attention jointly enhance the adaptive learning of key areas and deep features of the network. Comprehensive experiments demonstrated the effectiveness of our method. AEM-Net is capable of improving localized ME and MaE instances with various durations. It achieved improved performances on and SAMM-LV datasets. However, due to the brief and subtle nature of ME, the F1-score of our ME spotting is not satisfactory yet for real-world applications. Powerful feature learning and action localization in an end-to-end ME spotting framework are promising directions in future research. In addition, we will also study the bioinformatics principle of micro-expressions and further improve the performance of ME spotting.
Author Contributions
Methodology, S.C. and Z.X.; supervision, Z.X.; validation, Z.X. and S.C.; writing—original draft, S.C.; writing—review and editing, Z.X. All authors have read and agreed to the published version of the manuscript.
Funding
This research was funded by the National Nature Science Foundation of China (No. 61861020), the Natural Science Foundation of Jiangxi Province of China (No. 20224ACB202011), the Jiangxi Province Graduate Innovation Special Fund Project (No. YC2021-X06) and the Nanchang Educational Big Data and Intelligent Technology Key Laboratory (No. 2020NCZDSY-012).
Data Availability Statement
Data can be provided upon request.
Acknowledgments
The authors would like to thank the reviewers for their valuable comments.
Conflicts of Interest
The authors declare no conflict of interest.
References
- Ben, X.; Ren, Y.; Zhang, J.; Wang, S.J.; Kpalma, K.; Meng, W.; Liu, Y.J. Video-based Facial Micro-Expression Analysis: A Survey of Datasets, Features and Algorithms. IEEE Trans. Pattern Anal. Mach. Intell. 2021. [Google Scholar] [CrossRef] [PubMed]
- Li, X.; Wei, G.; Wang, J.; Zhou, Y. Multi-scale joint feature network for micro-expression recognition. Comput. Vis. Media 2021, 7, 407–417. [Google Scholar] [CrossRef]
- Cai, L.; Li, H.; Dong, W.; Fang, H. Micro-expression recognition using 3D DenseNet fused Squeeze-and-Excitation Networks. Appl. Soft Comput. 2022, 119, 108594. [Google Scholar] [CrossRef]
- Zhou, L.; Mao, Q.; Huang, X.; Zhang, F.; Zhang, Z. Feature refinement: An expression-specific feature learning and fusion method for micro-expression recognition. Pattern Recognit. 2022, 122, 108275. [Google Scholar] [CrossRef]
- Porter, S.; Brinke, L. Reading between the lies identifying concealed and falsified emotions in universal facial expressions. Psychol. Sci. 2008, 19, 508–514. [Google Scholar] [CrossRef] [PubMed]
- Davison, A.K.; Yap, M.H.; Costen, N.; Tan, K.; Lansley, C.; Leightley, D. Micro-facial movements: An investigation on spatiotemporal descriptors. In Proceedings of the European Conference on Computer Vision, Zurich, Switzerland, 6–12 September 2014; pp. 111–123. [Google Scholar] [CrossRef]
- Liong, S.-T.; See, J.; Phan, R.C.-W.; Le Ngo, A.C.; Oh, Y.-H.; Wong, K. Subtle expression recognition using optical strain weighted features. In Proceedings of the Asian Conference on Computer Vision, Singapore, 1–5 November 2014; pp. 644–657. [Google Scholar] [CrossRef]
- Wu, J.; Xu, J.; Lin, D.; Tu, M. Optical Flow Filtering-Based Micro-Expression Recognition Method. Electronics 2020, 9, 2056. [Google Scholar] [CrossRef]
- Wang, S.J.; Yan, W.J.; Li, X.; Zhao, G.; Fu, X. Micro-expression recognition using dynamic textures on tensor independent color space. Pattern Recognit. 2014, 4678–4683. [Google Scholar] [CrossRef]
- Lin, T.; Zhao, X.; Shou, Z. Single shot temporal action detection. In Proceedings of the ACM Multimedia Conference, Mountain View, CA, USA, 23–27 October 2017; pp. 988–996. [Google Scholar] [CrossRef]
- Xie, Z.H.; Cheng, S.J.; Liu, X.Y.; Fan, J.W. Adaptive enhanced micro-expression spotting network based on multi-stage features extraction. In Proceedings of the Chinese Conference on Biometric Recognition (CCBR), Beijing, China, 11–13 November 2022; Lecture Notes in Computer Science. Volume 13628, pp. 289–296. [Google Scholar] [CrossRef]
- Chao, Y.W.; Vijayanarasimhan, S.; Seybold, B.; Ross, D.A.; Deng, J.; Sukthankar, R. Rethinking the faster R-CNN architecture for temporal action localization. In Proceedings of the IEEE/CVF Conference on Computer Vision and Pattern Recognition, Seattle, WA, USA, 13–19 June 2018; pp. 1130–1139. [Google Scholar] [CrossRef]
- Le, Y.; Houwen, P.; Dingwen, Z.; Jianlong, F.; Junwei, H. Revisiting anchor mechanisms for temporal action localization. IEEE Trans. Image Process. 2020, 29, 8535–8548. [Google Scholar] [CrossRef]
- Zhang, Z.; Chen, T.; Meng, H.; Liu, G.; Fu, X. Smeconvnet: A convolutional neural network for spotting spontaneous facial micro-expression from long videos. IEEE Access 2018, 6, 143–171. [Google Scholar] [CrossRef]
- Antti, M.; Guoying, Z.; Matti, P. Spotting rapid facial movements from videos using appearance-based feature difference analysis. In Proceedings of the International Conference on Pattern Recognition, Stockholm, Sweden, 24–28 August 2014; pp. 1722–1727. [Google Scholar] [CrossRef]
- Adrian, D.K.; Moi, Y.H.; Cliff, L. Micro-facial movement detection using individualised baselines and histogram based descriptors. In Proceedings of the International Conference on Systems, Man, and Cybernetics, San Antonio, TX, USA, 2–5 October 2015; pp. 1864–1869. [Google Scholar] [CrossRef]
- Adrian, D.; Walied, M.; Cliff, L.; Choon, N.C.; Moi, Y.H. Objective micro-facial movement detection using facs-based regions and baseline evaluation. In Proceedings of the International Conference on Automatic Face and Gesture Recognition (FG), Xi’an, China, 15–19 May 2018; pp. 642–649. [Google Scholar] [CrossRef]
- Devangini, P.; Guoying, Z.; Matti, P. Spatiotemporal integration of optical flow vectors for micro-expression detection. In Proceedings of the International Conference on Advanced Concepts for Intelligent Vision Systems, Auckland, New Zealand, 10–14 February 2015; pp. 369–380. [Google Scholar] [CrossRef]
- Thuong, T.K.; Xiaopeng, H.; Guoying, Z. Sliding window based micro-expression spotting: A benchmark. In Proceedings of the International Conference on Advanced Concepts for Intelligent Vision Systems, Antwerp, Belgium, 18–21 September 2017; pp. 542–553. [Google Scholar] [CrossRef]
- Sujing, W.; Shuhuang, W.; Xingsheng, Q.; Jingxiu, L.; Xiaolan, F. A main directional maximal difference analysis for spotting facial movements from long-term videos. Neurocomputing 2017, 230, 382–389. [Google Scholar] [CrossRef]
- Genbing, L.; See, J.; Laikuan, W. Shallow optical flow three-stream CNN for macro- and micro-expression spotting from long videos. In Proceedings of the 2021 IEEE International Conference on Image Processing, Anchorage, AK, USA, 19–22 September 2021; pp. 2643–2647. [Google Scholar] [CrossRef]
- Guo, Y.; Li, B.; Ben, X.; Ren, Y.; Zhang, J.; Yan, R.; Li, Y. A Magnitude and Angle Combined Optical Flow Feature for Microexpression Spotting. IEEE Multimed. 2021, 28, 29–39. [Google Scholar] [CrossRef]
- Wangwang, Y.; Jingwen, J.; Yongjie, L. LSSNET: A two-stream convolutional neural network for spotting macro-and micro-expression in long videos. In Proceedings of the ACM Conference on Multimedia, Virtual, 24 October 2021; pp. 4745–4749. [Google Scholar] [CrossRef]
- Xiaolong, W.; Girshick, R.; Gupta, A.; Kaiming, H. Non-local neural networks. In Proceedings of the IEEE Conference on Computer Vision and Pattern Recognition, Salt Lake City, UT, USA, 18–23 June 2018; pp. 7794–7803. [Google Scholar] [CrossRef]
- Bodla, N.; Singh, B.; Chellappa, R.; Davis, L.S. SoftNMS–Improving Object Detection with One Line of Code. In Proceedings of the IEEE International Conference on Computer Vision, Venice, Italy, 22–29 October 2017; pp. 5561–5569. [Google Scholar] [CrossRef]
- Songtao, L.; Di, H.; Yunhong, W. Adaptive NMS: Refining pedestrian detection in a crowd. In Proceedings of the IEEE/CVF Conference on Computer Vision and Pattern Recognition, Long Beach, CA, USA, 15–20 June 2019; pp. 6459–6468. [Google Scholar] [CrossRef]
- Xin, H.; Zheng, G.; Zequn, J.; Yoshie, O. NMS by Representative Region: Towards Crowded Pedestrian Detection by Proposal Pairing. In Proceedings of the IEEE/CVF Conference on Computer Vision and Pattern Recognition, Seattle, WA, USA, 13–19 June 2020; pp. 10750–10759. [Google Scholar]
- Carreira, J.; Zisserman, A. Quo vadis, action recognition? A new model and the kinetics dataset. In Proceedings of the IEEE Conference on Computer Vision and Pattern Recognition (CVPR), Honolulu, HI, USA, 21–26 July 2017. [Google Scholar] [CrossRef]
- Gaidon, A.; Harchaoui, Z.; Schmid, C. Temporal localization of actions with actoms. IEEE Trans. Pattern Anal. Mach. Intell. 2013, 35, 2782–2795. [Google Scholar] [CrossRef]
- Qu, F.; Wang, S.J.; Yan, W.J.; Li, H.; Wu, S.; Fu, X. CAS(ME)2: A database for spontaneous macro-expression and micro-expression spotting and recognition. IEEE Trans. Affect. Comput. 2017, 9, 424–436. [Google Scholar] [CrossRef]
- Yap, C.; Kendrick, C.; Yap, M. Samm long videos: A spontaneous facial micro-and macro-expressions dataset. In Proceedings of the 2020 15th IEEE International Conference on Automatic Face and Gesture Recognition, Buenos Aires, Argentina, 16–20 November 2020; pp. 194–199. [Google Scholar] [CrossRef]
- Redmon, J.; Farhadi, A. YOLO9000: Better, Faster, Stronger. In Proceedings of the CVPR, Honolulu, HI, USA, 21–26 July 2017; pp. 7263–7271. [Google Scholar] [CrossRef]
- Tian, Z.; Shen, C.; Chen, H.; He, T. FCOS: Fully convolutional one-stage object detection. In Proceedings of the IEEE Conference on Computer Vision, Seoul, Republic of Korea, 27 October–2 November 2019; pp. 9627–9636. [Google Scholar] [CrossRef]
- Yap, C.; Yap, M.; Davison, A.; Cunningham, R. 3D-CNN for Facial Micro- and Macro-expression Spotting on Long Video Sequences using Temporal Oriented Reference Frame. arXiv 2021, arXiv:2105.06340. [Google Scholar]
- Sujing, W.; Ying, H.; Jingting, L.; Xiaolan, F. MESNet: A convolutional neural network for spotting multi-scale micro-expression intervals in long videos. IEEE Trans. Image Process. 2021, 3956–3969. [Google Scholar] [CrossRef]
- Zhang, L.; Li, J.; Wang, S.; Duan, X.; Yan, W.; Xie, H.; Huang, S. Spatio-temporal fusion for macro-and micro-expression spotting in long video sequences. In Proceedings of the 2020 15th IEEE International Conference on Automatic Face and Gesture Recognition, Buenos Aires, Argentina, 16–20 November 2022; pp. 245–252. [Google Scholar] [CrossRef]


Disclaimer/Publisher’s Note: The statements, opinions and data contained in all publications are solely those of the individual author(s) and contributor(s) and not of MDPI and/or the editor(s). MDPI and/or the editor(s) disclaim responsibility for any injury to people or property resulting from any ideas, methods, instructions or products referred to in the content. |
© 2023 by the authors. Licensee MDPI, Basel, Switzerland. This article is an open access article distributed under the terms and conditions of the Creative Commons Attribution (CC BY) license (https://creativecommons.org/licenses/by/4.0/).