Article

Eye Shielding against Electromagnetic Radiation: Optimal Design Using a Reduced Model of the Head

by
Jarosław Kawecki
1,*,
Łukasz Januszkiewicz
1,
Paolo Di Barba
2 and
Karol Kropidłowski
1
1
Institute of Electronics, Lodz University of Technology, Al. Politechniki 10, 93-590 Lodz, Poland
2
Department of Electrical, Computer and Biomedical Engineering, University of Pavia, Via Ferrata 5, 27100 Pavia, Italy
*
Author to whom correspondence should be addressed.
Electronics 2023, 12(2), 291; https://doi.org/10.3390/electronics12020291
Submission received: 29 November 2022 / Revised: 29 December 2022 / Accepted: 1 January 2023 / Published: 6 January 2023

Abstract

:
This article presents the design process of a structure that shields the electromagnetic field from the fifth-generation transmitter operating in the 3.5 GHz band. The purpose of this project is the limitation of power density in the eye region. For this reason, the structure is made of conducting wires forming a grid that is semitransparent to the light. The design was performed using computer simulations with a finite-difference time-domain method and an evolutionary-based optimization methodology. A simplified model of the face and eyes was developed to reduce the amount of time needed for the simulation. The construction of the shielding structure presented here can be easily fabricated in the form of protective goggles. The results of the computer simulations show that the power density in the eye region can be reduced by almost seven times compared with the unshielded case.

Graphical Abstract

1. Introduction

Recently, a growing interest in issues related to the influence of electromagnetic waves (EM) on the human body can be observed. This topic is particularly important for people who are afraid of the effects of EM radiation emitted by wireless communication systems, especially in the case of fifth-generation (5G) systems [1]. This is mainly due to the change in the telecommunication infrastructure, which requires the placement of new base station equipment for the next generation of the wireless system. These situations may, in a certain group of people, cause the development of irrational behaviors that are also the subject of research for psychologists. Many of these people are considered particularly sensitive to radiation and are looking for a way to minimize their exposure to EM fields.
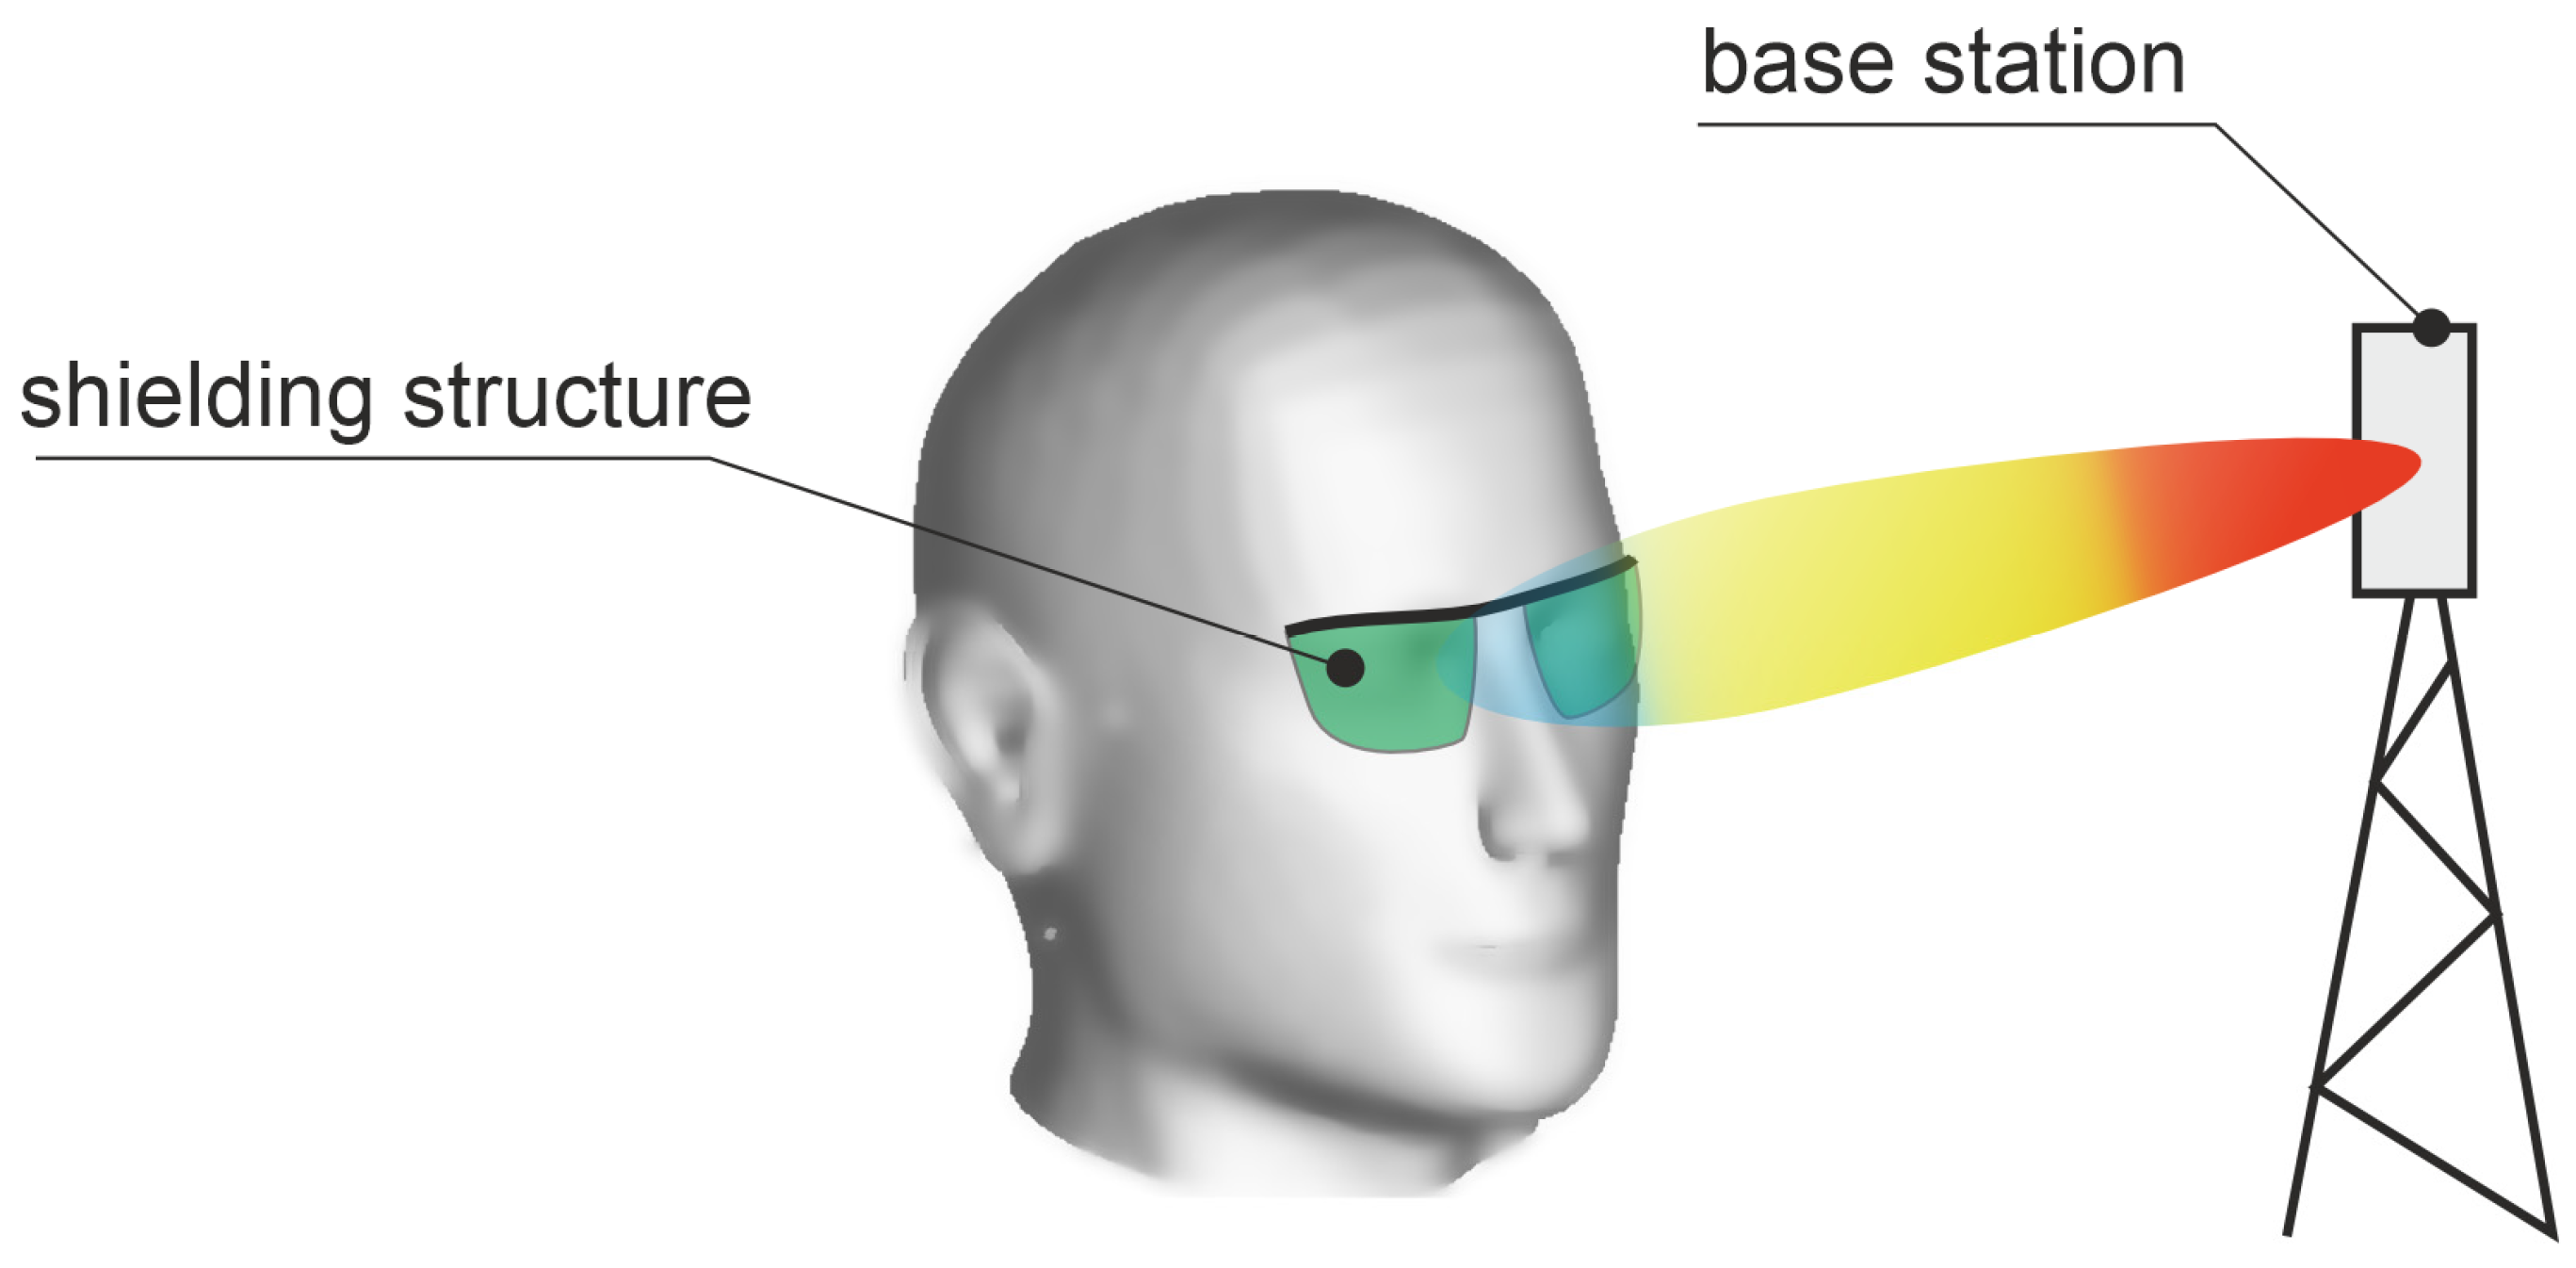
The literature describes structures that can shield the human body from electromagnetic (EM) waves. Such structures are developed to minimize the thermal effect of EM waves interacting with the human body. This effect occurs when the power absorbed is so great that the thermoregulatory mechanism of the human body cannot compensate for the increasing temperature of the tissues. This generally applies to those cases where the power level is at least ten times higher than allowed by the standards. Among other organs of the human body, the eyes are particularly sensitive to EM radiation [2]. In fact, the cornea and lens of the eye lack vascularization; therefore, the blood cannot effectively receive the additional heat released in the tissues. In the case of excessive thermal effect, significant damage may take place in this particular organ. This was a motivation to develop the eye-shielding structure presented in this paper. As presented in Figure 1, this could be placed in front of the eyes in the form of protective goggles and could mitigate the radiation from the base station.
The research on the structures that reduce the impact of EM waves on the human body presented in the literature shows that both the geometry of the structure and the materials used to cover the human body have an impact on their performance. A typical solution for the design of body shields is the use of electrically conductive textiles that adhere to the body [3,4,5]. These are materials containing nano-additives [6] or, in simpler variants, composites containing metal plates [7] or multi-layer materials with controlled conductivity [8]. Such shielding structures cannot be used for screening eyes due to their opacity.
Various periodic structures for frequency-selective protection are described in the literature. They do not require covering the entire surface of the body with a conductive material and can therefore be adapted to the construction of eye-shielding structures. In their case, a dielectric base material is used, on which numerous elementary structures made of conductive materials are mounted [9,10]. For this purpose, technologies developed for the implementation of conductive structures of various shapes in textile materials can be used [11]. The technologies of printing with conductive ink or embroidery with conductive yarns used for textile antennas can also be used [12]. Particularly interesting, it appears that the use of the technology of physical metal vapor deposition on dielectric substrates as well as graphene oxide technology is possible, both of which allow for the production of very thin (even partially transparent) conductive structures with complex shapes, therefore enabling their use in the production of eye shields.
The article describes a design of a narrow-band eye-shielding structure using linear elements of controlled length and conductivity. It was designed for EM waves of the 3.5 GHz frequency with vertical and horizontal polarization. Due to the simplicity of the structure, it is possible to make it partially transparent, thanks to which it can disturb the field of view to a minimum extent.

2. Materials and Methods

2.1. Human Body Models

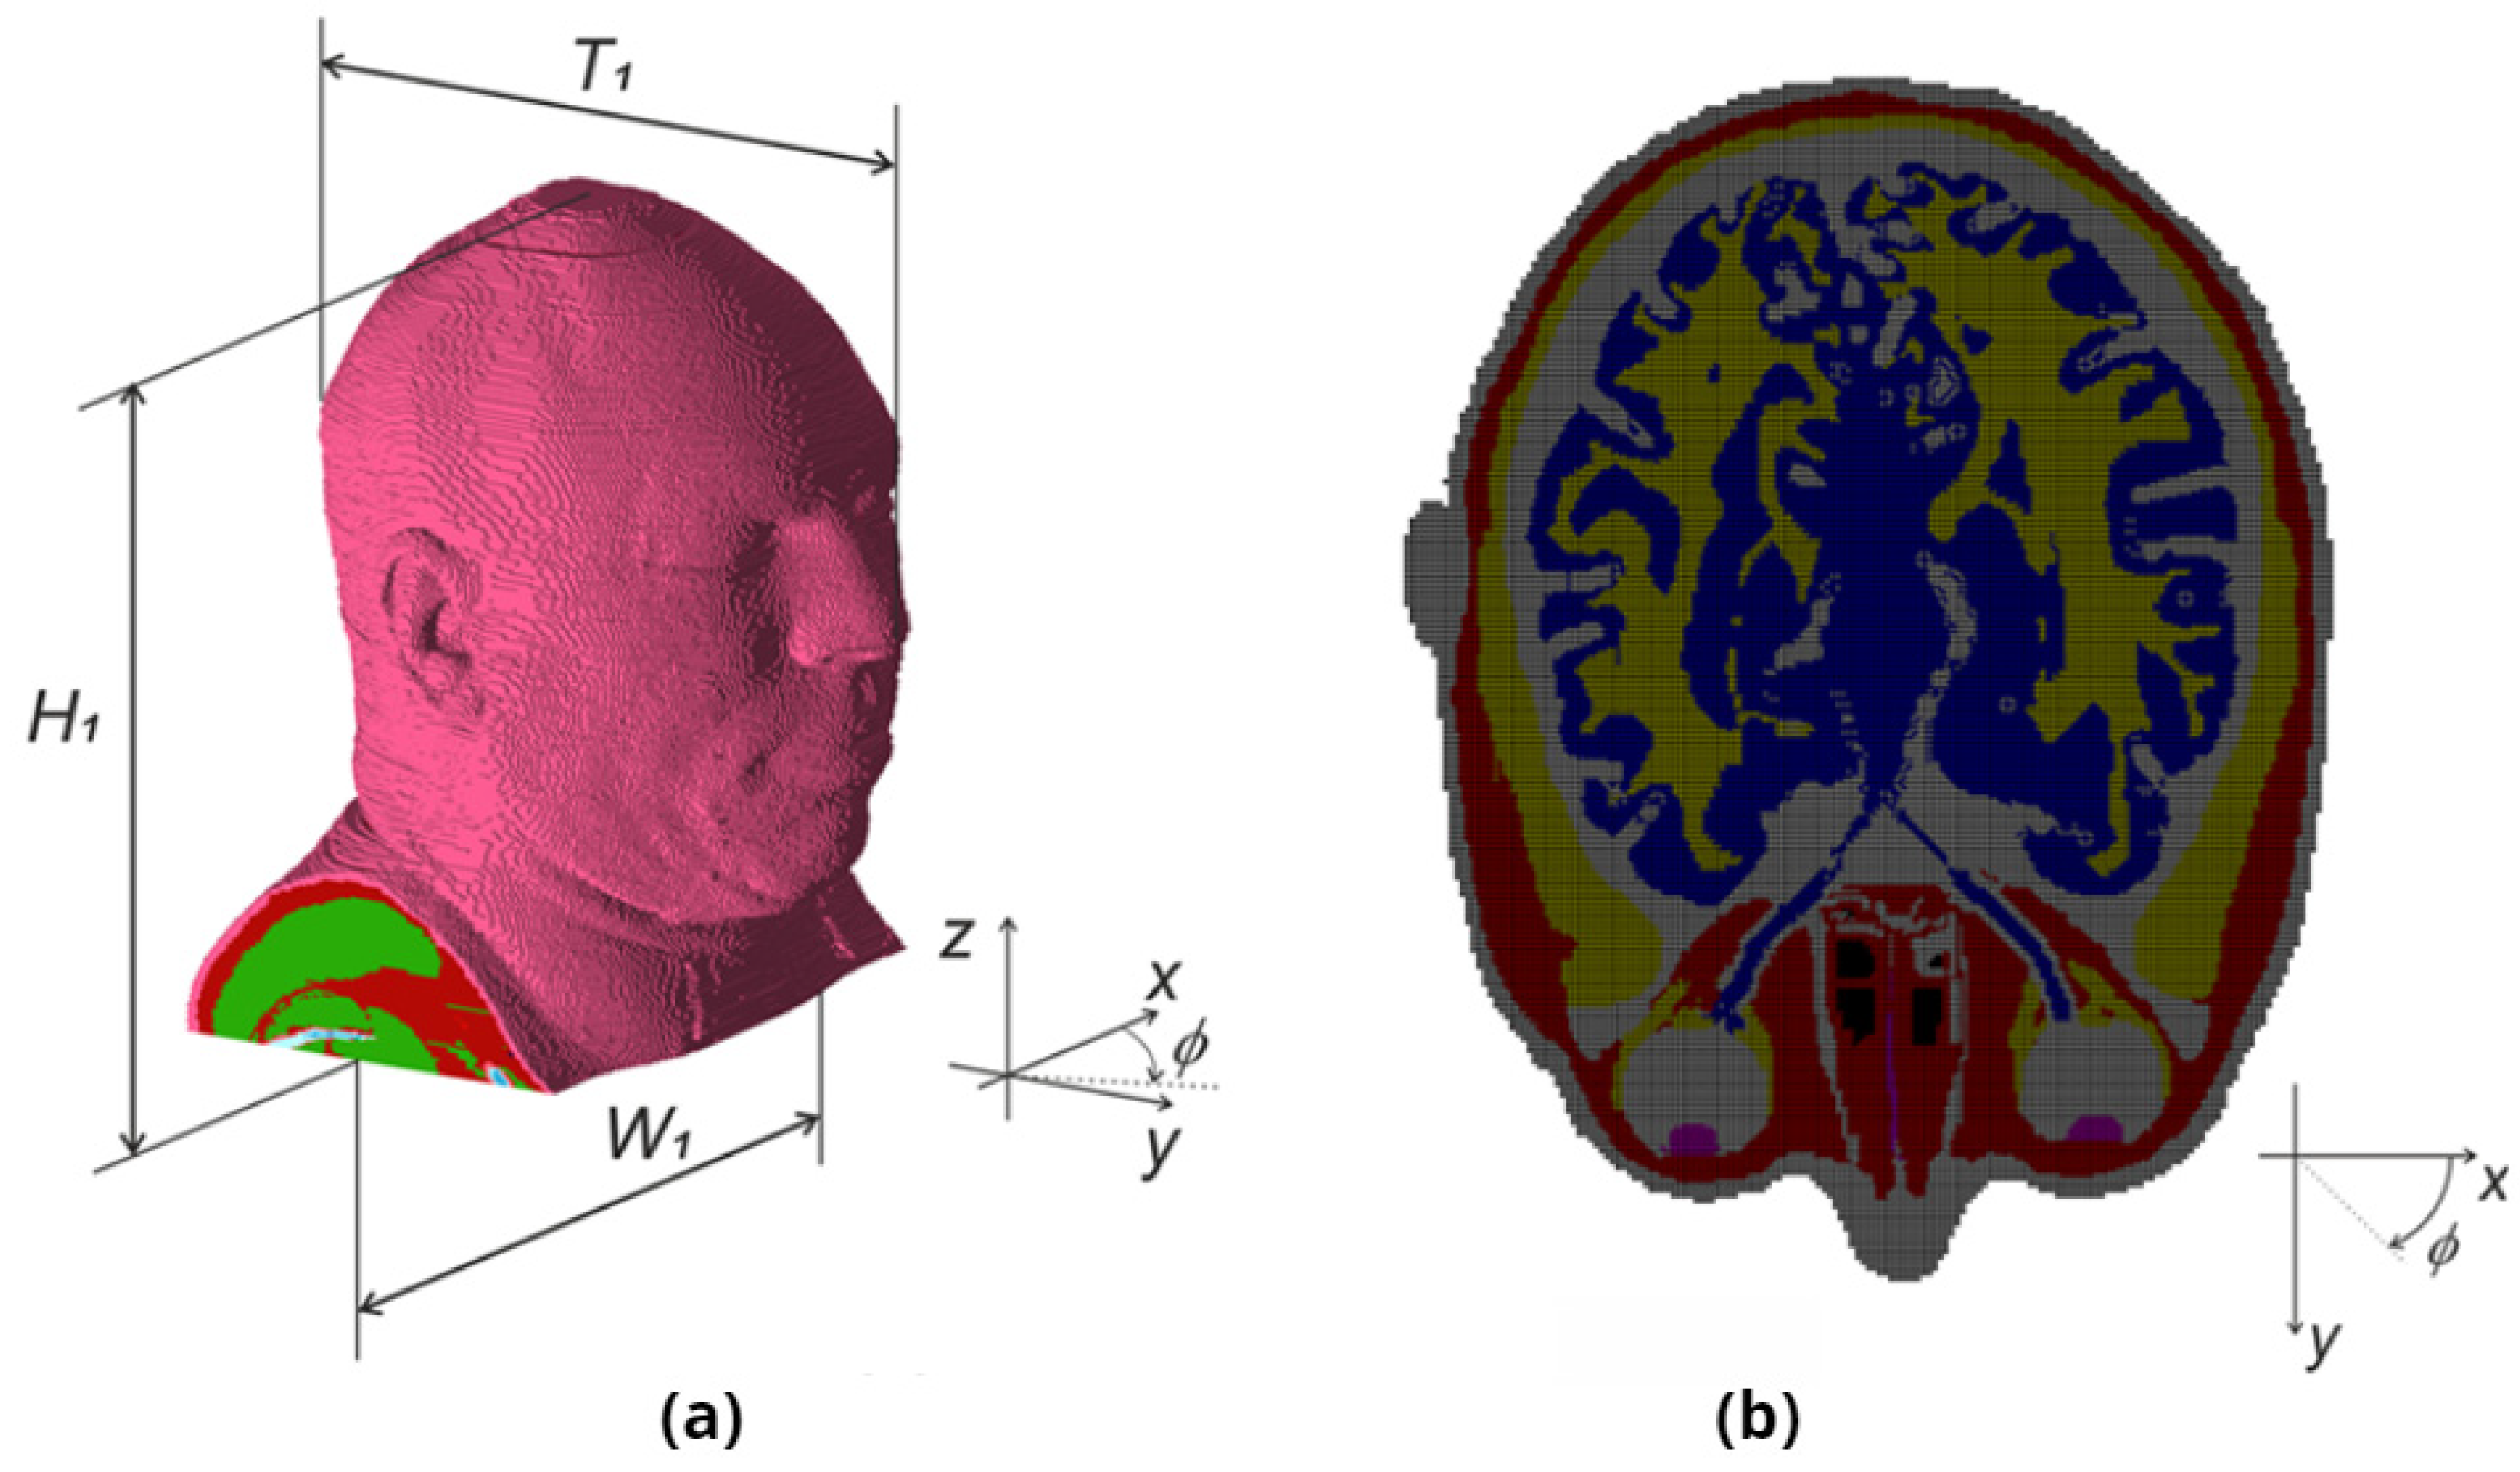
The study of the interaction between electromagnetic waves and the body requires the determination of the power density in the tissue area. This parameter is typically calculated with computer simulations using a numerical model of the human body. The recommended method, in this case, is the finite-difference time-domain (FDTD) method [13]. The research described in this article was carried out using the Remcom XFdtd program [14], which implements the FDTD method. It provides access to a heterogeneous human head model that consists of 24 tissues and is divided into unit cells (voxels) with a size of 1 mm. The model and its horizontal cross-section in the eye plane are presented in Figure 2. The dimensions of the model (referring to Figure 2) were the following: W1 = 484 mm, T1 = 277 mm, and H1 = 300 mm. Computer simulation of the body’s exposure to EM waves of a 3.5 GHz frequency, with the use of this model, requires 1.5 GB of computer memory. Moreover, it is quite time-consuming and takes about 6 min on a computer equipped with a graphics card with a GPU computing unit having 16 GB of memory. Such a long simulation time can be a limitation in the design process of a shielding structure, which requires many iterations. As it was planned to use an optimization algorithm in this research, we aimed to reduce the time required for the simulation that utilized the head model.
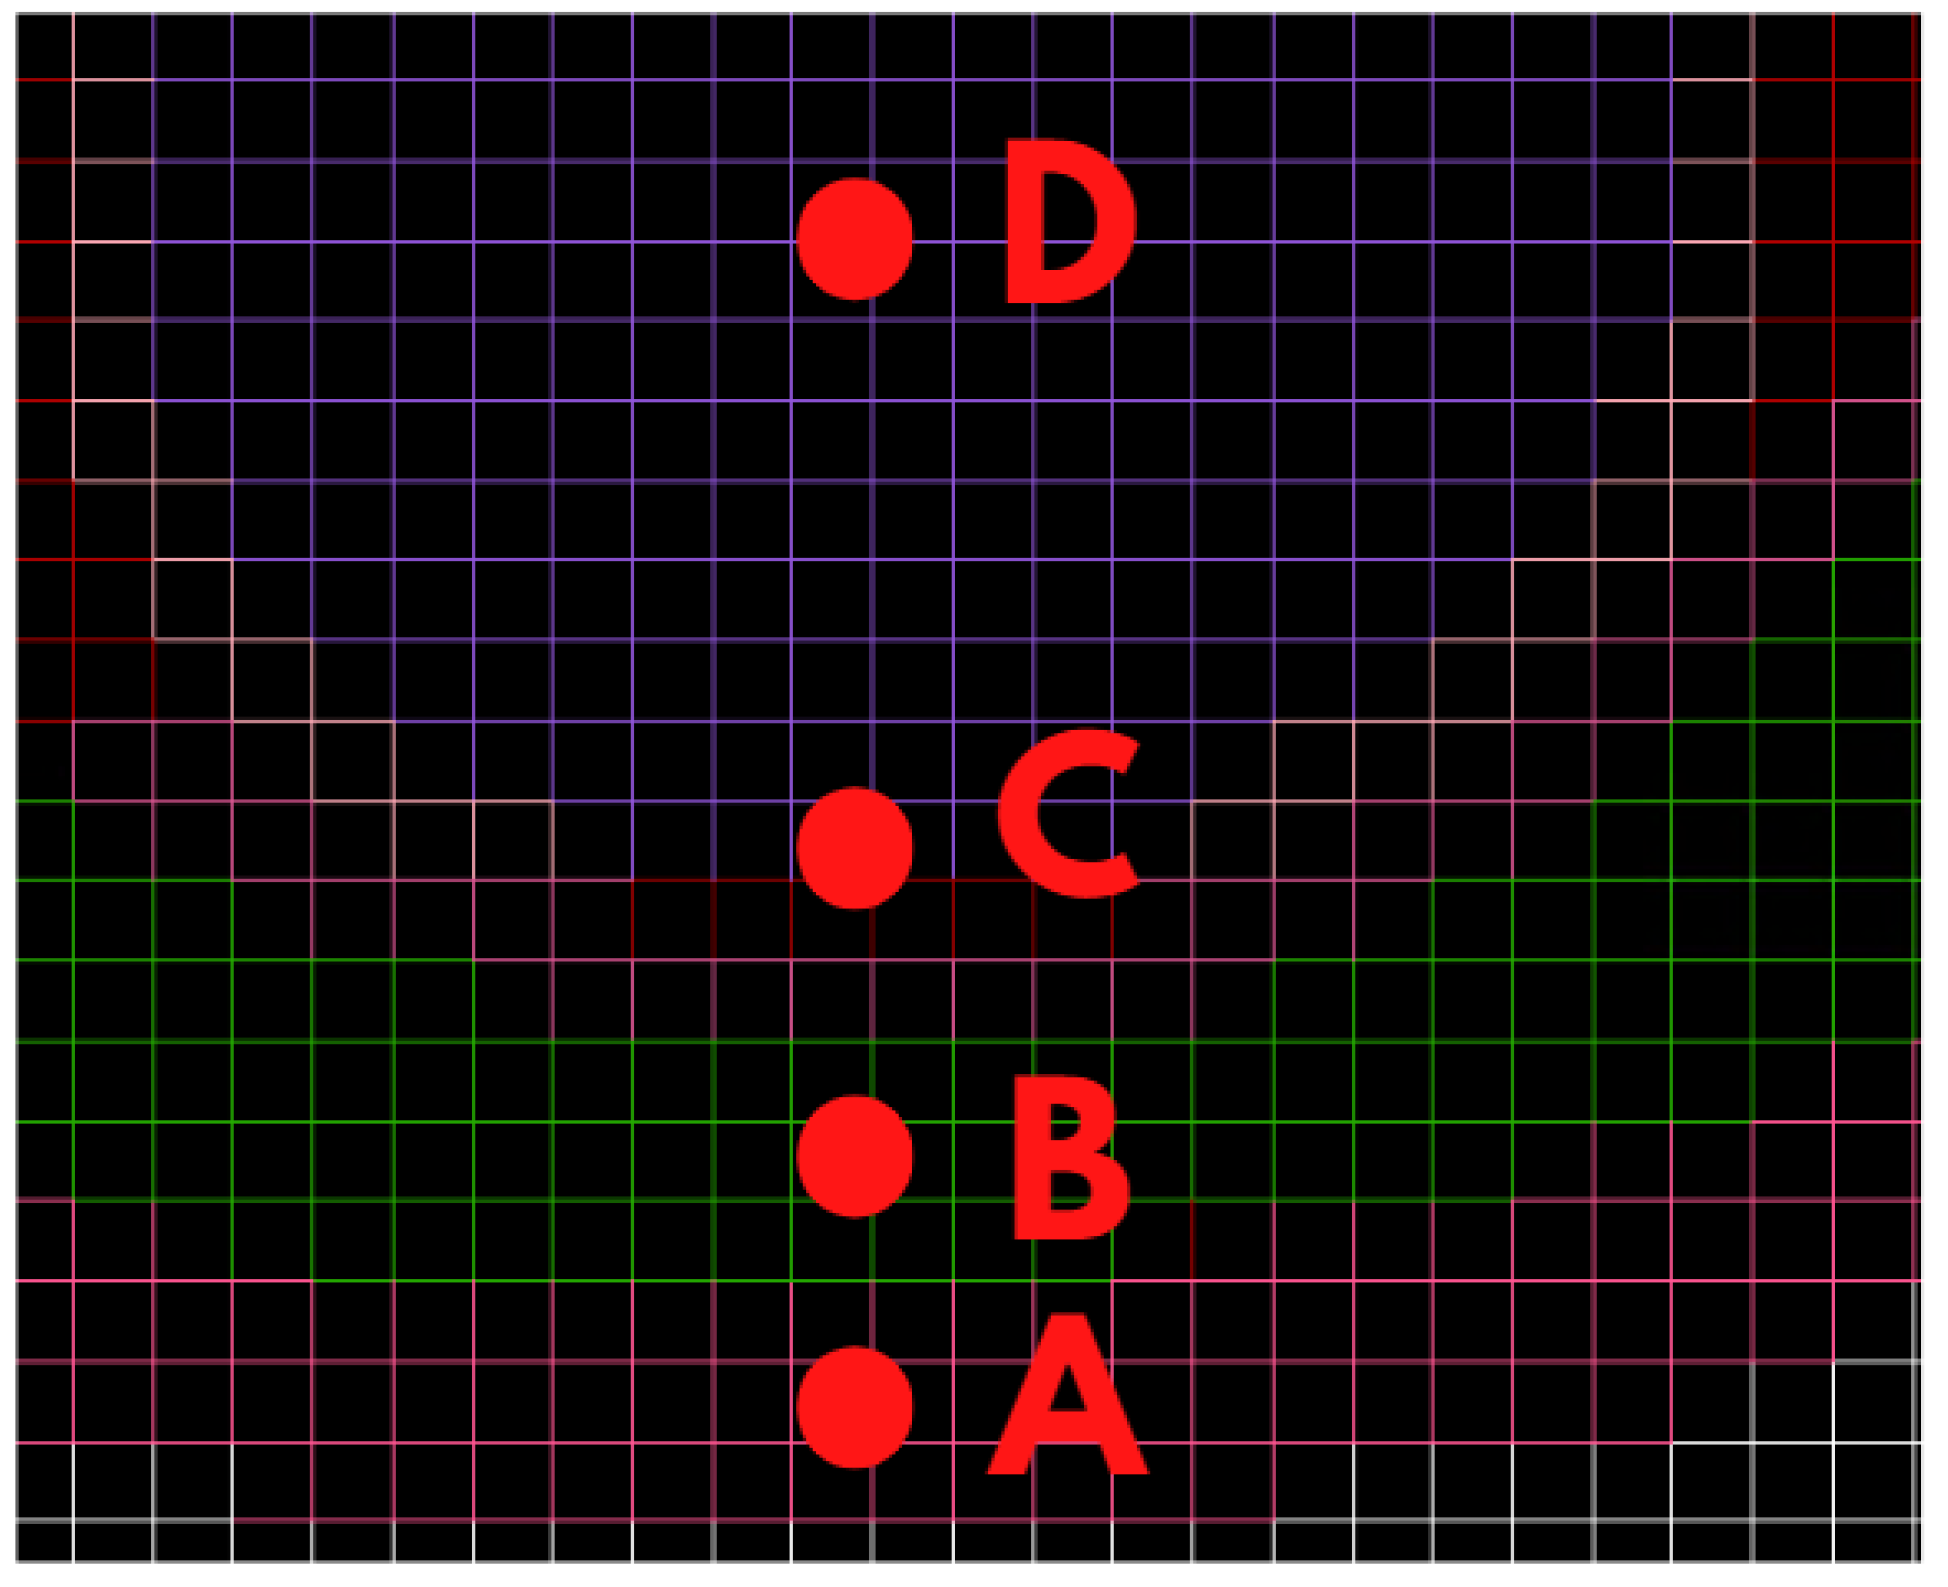
As the eye region is our main interest in this paper, we used 4 test points located inside the eyeball to obtain the values of power density. At each point, we simulated the absolute value of the Poynting vector. The placement of test points is presented in Figure 3 in which it is shown that the test points are located in the following regions of eye tissues: eyelid (A), muscle (B), lens (C), and eye vitreous (D).
The values of the Poynting vector in the test points were verified and compared for different angles of incidence of the electromagnetic wave, relevant to the face. Table 1 presents the values of the Poynting vector computed for the source of the electromagnetic wave directed towards the face for different values of the angle ϕ (defined in Figure 2). The direction of ϕ = 90° refers to the case of the EM wave coming from the front. Other cases were studied to cover the EM wave coming from a side direction with an angle of ϕ = 67.5°, as well as at 45°. Based on the analysis of the data presented in Table 1, it can be concluded that the highest power density occurs in the eye region in the case where the energy source is located in front of the face. For this reason, in further studies of eye shields, it was assumed that the head would be exposed to a wave propagating from the ϕ = 90° direction.
Therefore, in order to study this phenomenon, it is necessary to develop a model that mainly maps the eyeballs. Due to the fact that the heterogeneous model of the whole head contains many voxels that also mimic the posterior part of the head and the top part of the shoulders, we investigated how limiting the volume of this model to only the facial region would affect the simulation results.
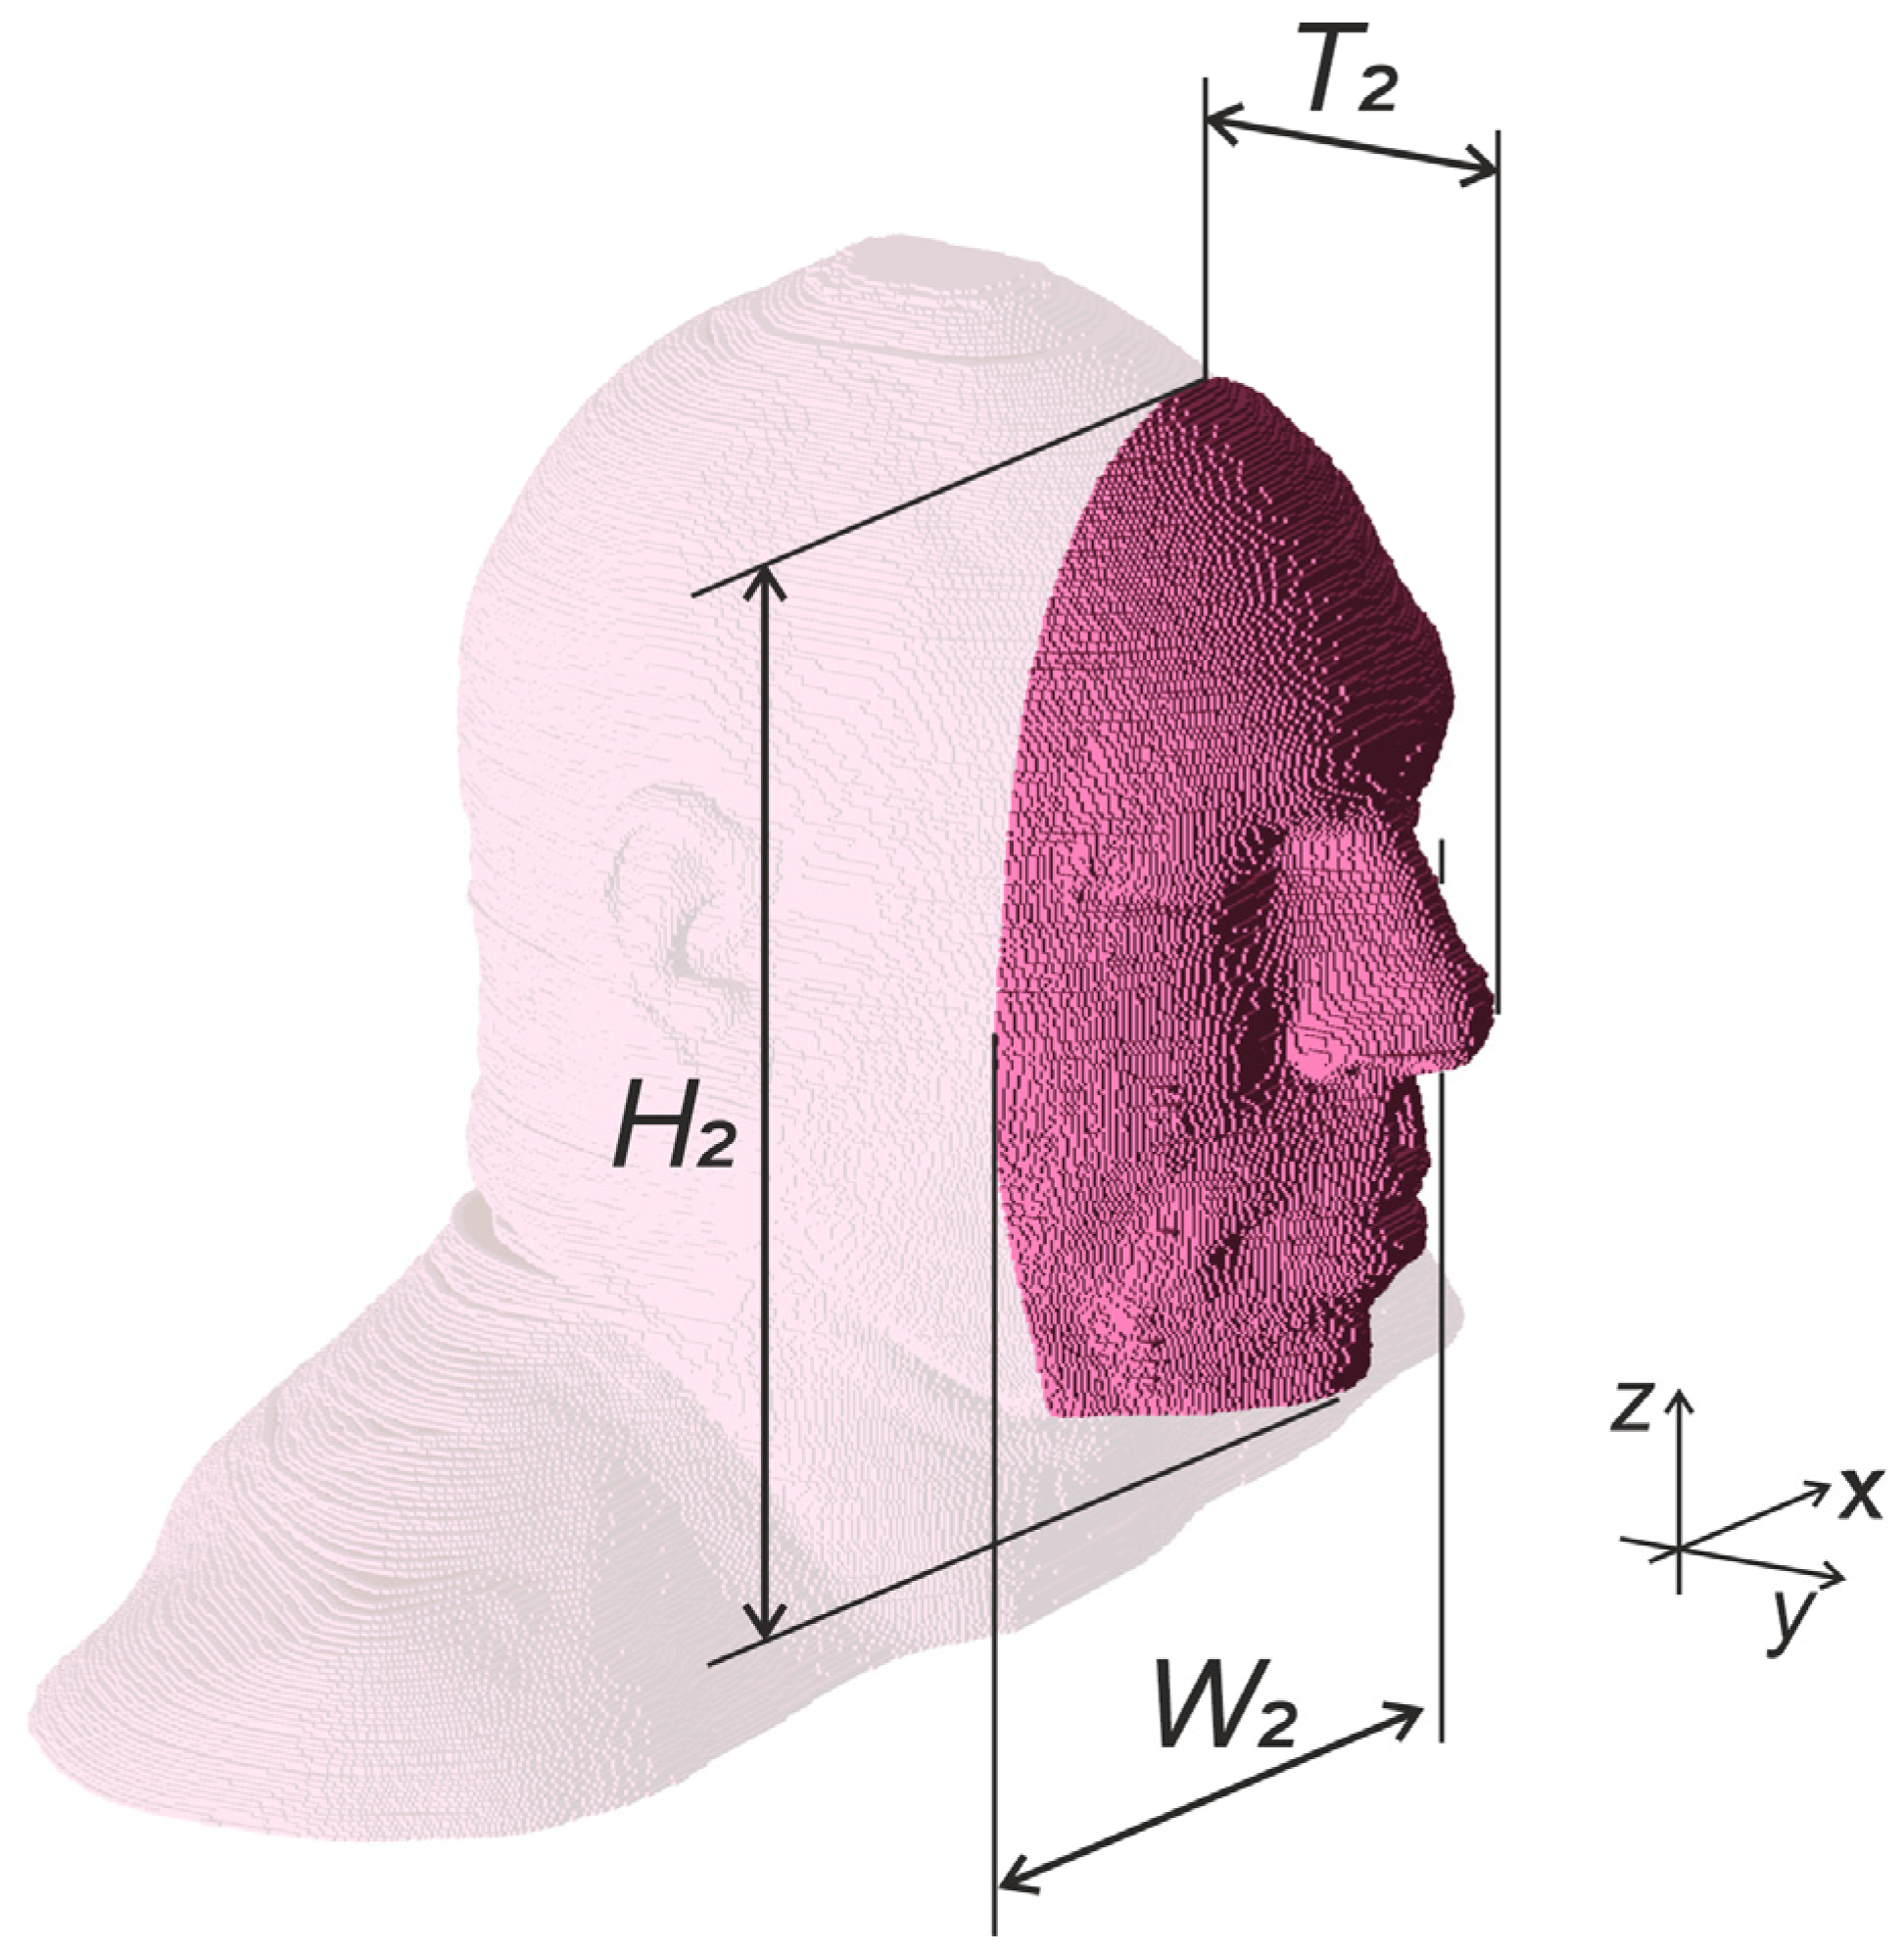
Figure 4 shows a heterogeneous model of the head fragment, which was made by cutting out a part of the Hershey NMR heterogeneous model (Figure 2), available in the XFdtd program. The cutout fragment had the following dimensions: W2 = 147 mm, T2 = 70 mm, and H2 = 204 mm. While it preserves the shape of the face and the tissues properties, it was used to investigate whether limiting the size of the heterogenous model without changing its electric properties can result in faster simulations with acceptable accuracy in reference to the full model. To investigate this, a numerical experiment was performed in which the human head was exposed to an EM wave of linear vertical polarity and 3.5 GHz frequency. The wave was propagating from the ϕ = 90° direction, and the amplitude of the electric field component was equal to 87 V/m. Table 2 presents a comparison of the Poynting vector module (S) obtained for the 4 points located in the layers of the eye for the reference model (heterogeneous, full size) and the cutout model, respectively.
The above data prove that the geometric reduction of the heterogeneous model results in a high discrepancy between the values of the Poynting vector module obtained between the full-size reference model and the reduced model. The whole head reference model contained 40.2 million voxels and covered an area of 484 × 300 × 277 mm3. The cutout model was limited to an area of 147 × 204 × 70 and thus contained only 2.1 million voxels. It allowed for the reduction of the simulation time by 40%. Unfortunately, however, the results of the simulation of power density in the eyeball area obtained with the use of the whole head model differed by even 30 times from the results obtained with the cutout model.

2.2. Optimal Synthesis of the Simplified Model of the Face

The next stage of the research was devoted to the development of a simplified model of the face and eyes, which would consist of a smaller number of voxels compared with the whole head model; at the same time, it would allow us to obtain similar values of power density. For this purpose, the model shown in Figure 5 was developed. The face is represented by a fragment of an ellipsoid, and the eyes are represented by spheres and concentric surfaces. The dimensions of the model were selected for the best representation of the eye area in relation to the heterogeneous model. This model had the dimensions of W3 = 147 mm, T3 = 70 mm, and H3 = 204 mm, and it contained only 2.1 million voxels of 1 mm size.
The selection of the material parameters for the simplified model was carried out with the use of the Remcom XFdtd software and EStra automatic optimization algorithm [15,16]. This new model requires solving for the optimal design problem. Generally, optimal shape design problems might be classified according to five types, as follows:
  • Searching for the best shape of an object among an admissible set of shapes;
  • Searching for the best location of an object, given its shape;
  • Searching for the material property values, given the shape and location of an object;
  • Searching for the part of the boundary that is not accessible to the physical measurement, given the remaining part of the boundary;
  • Free boundary problems.
In this study, we used the same algorithm of numerical optimization for subsequently solving type 3 and type 2 problems, respectively.
An algorithm based on a single-objective (1 + 1)-evolution strategy (EStra) inspired by Darwinian evolution was used [15,16]. The algorithm was implemented in such a way that a new design vector x = m + du (offspring) was accepted if and only if x dominates the current design vector m (parent), i.e., f(x) < f(m), subject to the problem constraints. This means that the offspring was only accepted if it simultaneously improved the objective function and fulfilled constraints. In turn, d was the standard deviation vector associated with m, while u [ 0 , 1 ] was a normally distributed perturbation. Vector d was initialized as do, and the value of its elements was proportional to the feasible range of the corresponding design variable. Vector d, which drives the search, was updated according to the prescribed rate of success in improving the objective function; that is where the self-adaptation of the strategy parameter comes in. d itself undergoes a modification, which is ruled by a randomized process. In fact, given the correction rate q ( 0 , 1 ) , considering the kth iteration, d k + 1 = q 1 · d k (or d k + 1 = q · d k ) is set to force a larger (or smaller) standard deviation of Gaussian distribution associated with x in the next iteration, respectively. In other words, the solution vector x and the standard deviation vector d are both subject to random mutation. In a basic, cost-effective (1 + 1) implementation, the operator of selection allows for the best individual out of parent m and offspring x to survive to the next generation. In other words, an offspring individual is selected to survive if and only if it is better, or at least non-worse, than the parent individual against objectives and constraints. This way, given an initial point, there is a non-zero probability that the optimization trajectory eventually leads to a point close to the optimal solution point. The algorithm converges when the ratio of the largest value of d vector elements to the corresponding element of the initial standard deviation vector do is smaller than a prescribed search tolerance.
The basic computational cost c of the EStra algorithm can be a priori estimated as
c c 0 · n i · n p · n c
where c0 is the hardware-dependent time necessary to run a single solution of the direct problem associated with the optimization problem, ni is the number of convergence iterations for a prescribed search accuracy, np is the number of evolving solutions (in our case, np = 1), and nc is the number of constraints.
The most important parameters that influence the performance of the EStra algorithm are p and q; in a sense, they are the ‘tuning knobs’ ruling the algorithm performance. In particular, p is the prescribed probability of a successful iteration: an iteration is considered to be successful if the values of the objective function improve, and the ratio of the number of successful iterations to the current number of iterations is the actual probability; in turn, q is the rate of correction of the standard deviation
Remarkably, the algorithm is derivative-free, and this is a great advantage for solving non-convex optimization problems.
In summary, the evolutionary algorithm starts from a guess solution, which can be either user-supplied or randomly generated, and iteratively originates a search trajectory driven by the concept of a non-dominated solution, eventually converging to a quasi-optimal solution.
As far as the case study is concerned, the unknowns in the identification process were εk—electrical permittivity of the kth model layer, σk—electrical conductivity of the kth model layer, and k = 1, 3; layers refer to the region of skin, muscle, and eye sclera, respectively. The results of this identification process are non-physical, meaning that there is such material in the human body that results from the identification process. As we are designing the equivalent model, the materials are made to model the interaction of EM waves in a similar way to the human body, but only for the simulation of power density in the region of the eyes.
The target function f1 that was minimized was the largest difference between the data obtained from the reference model (heterogeneous model of the whole head) and the simplified model. The Poynting vector modules obtained at 4 test points located in areas of different eye tissues (see Figure 3) were compared.
f 1 ( ε k , σ k ) = max n = 1 , 4 | | S r e f ( n ) | | S s i m p ( n , ε k , σ k ) | |   ,   k = 1 , 3
where:
  • Sref—Poynting vector values obtained from the reference model (W/m2)
  • Ssimp—Poynting vector values obtained from the simplified model (W/m2)
  • n—Number of test points
  • k—Layer index
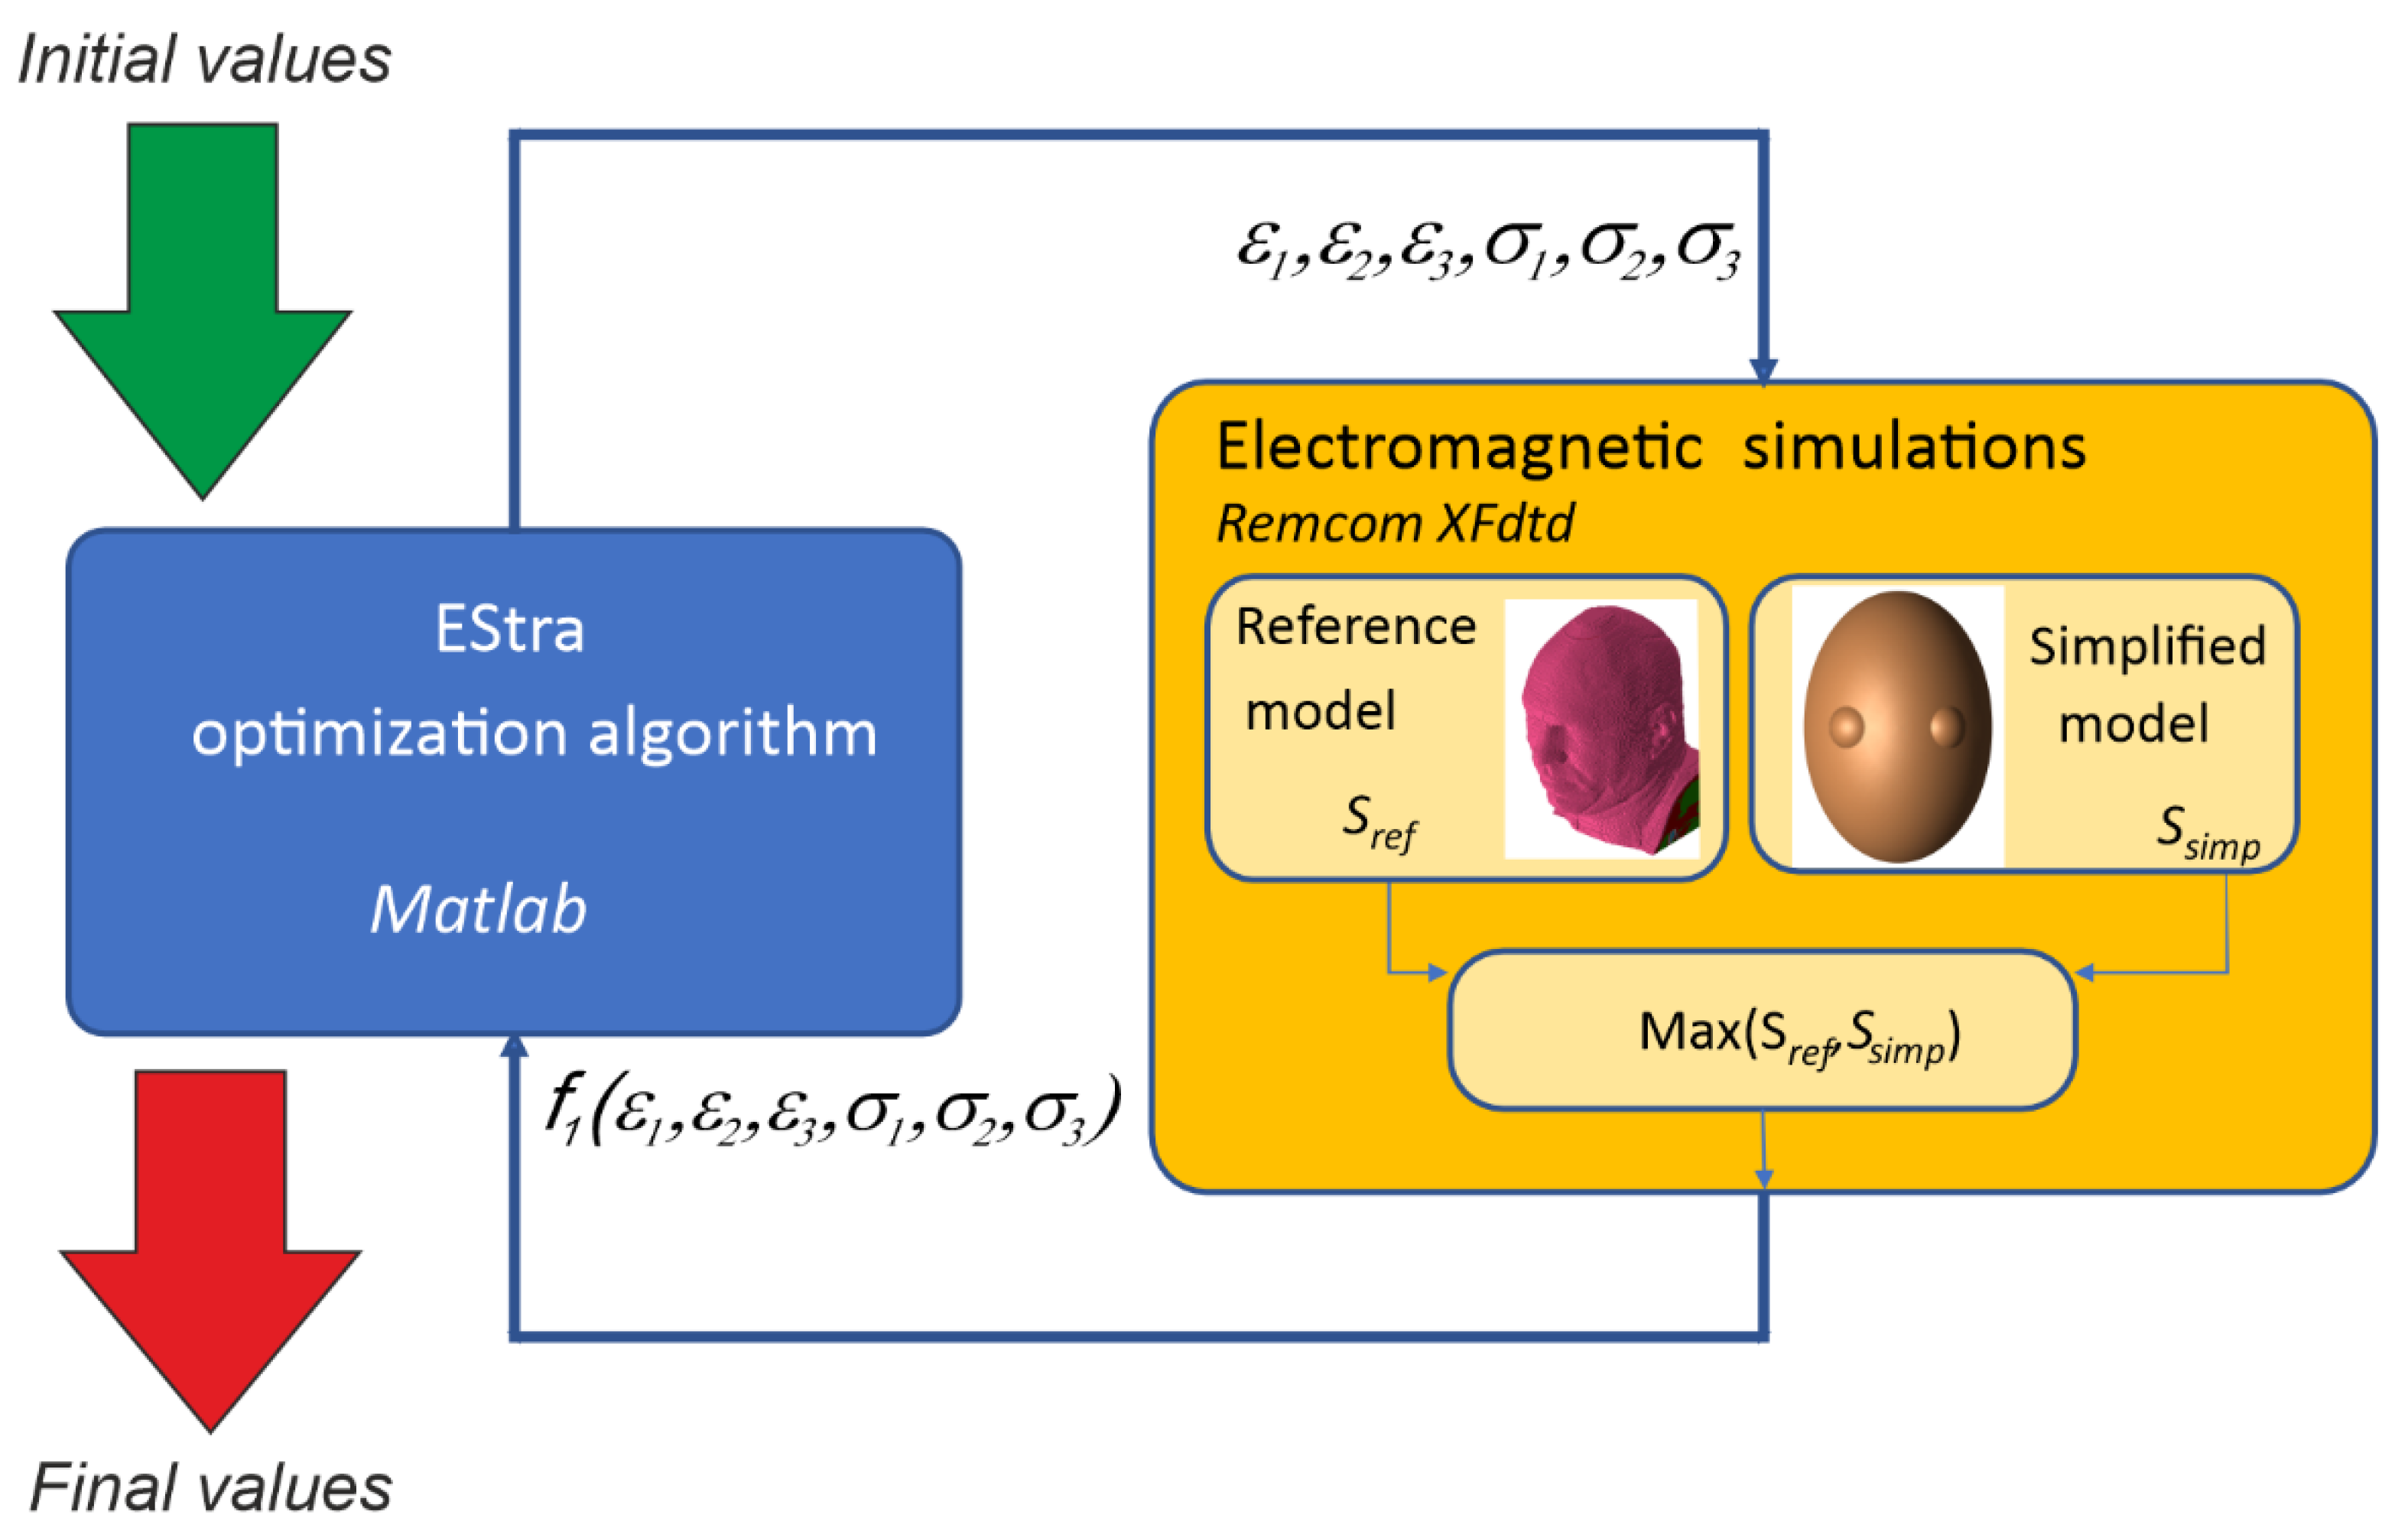
The problem reads: starting from the initial guess, find the design parameters (εk,σk) that minimize (1) subject to suitable constraints, for instance 1 < εk < 100, 1 < σk < 100. In Figure 6, the procedure of the identification of the head model parameters is presented. The optimization algorithm was implemented in a Matlab environment, while the evaluation of the objective function was performed with the XFdtd program.
The values of the material parameters identified in the optimization process are presented in Table 3. For the purpose of model assessment, the values of the power density obtained for the reference model and simplified model are presented in Table 4. The initial values were identical to the parameters of the actual head tissues (skin, muscle, and eye sclera). The initial value of the objective function f1 was 5.64, and the final value obtained as a result of 47 iterations was 1.58. It is the value of the maximum difference between the power density obtained with the reference and the simplified model, and this discrepancy is acceptable for the purpose of a shielding structure design. Due to the limited size of the simplified model, it uses only 2.1 million voxels, thanks to which the calculation time was reduced by about 50% in relation to the whole head model. The simplified model developed in this way was used in further research to design the shielding structure.

2.3. Shielding Structure Optimal Design

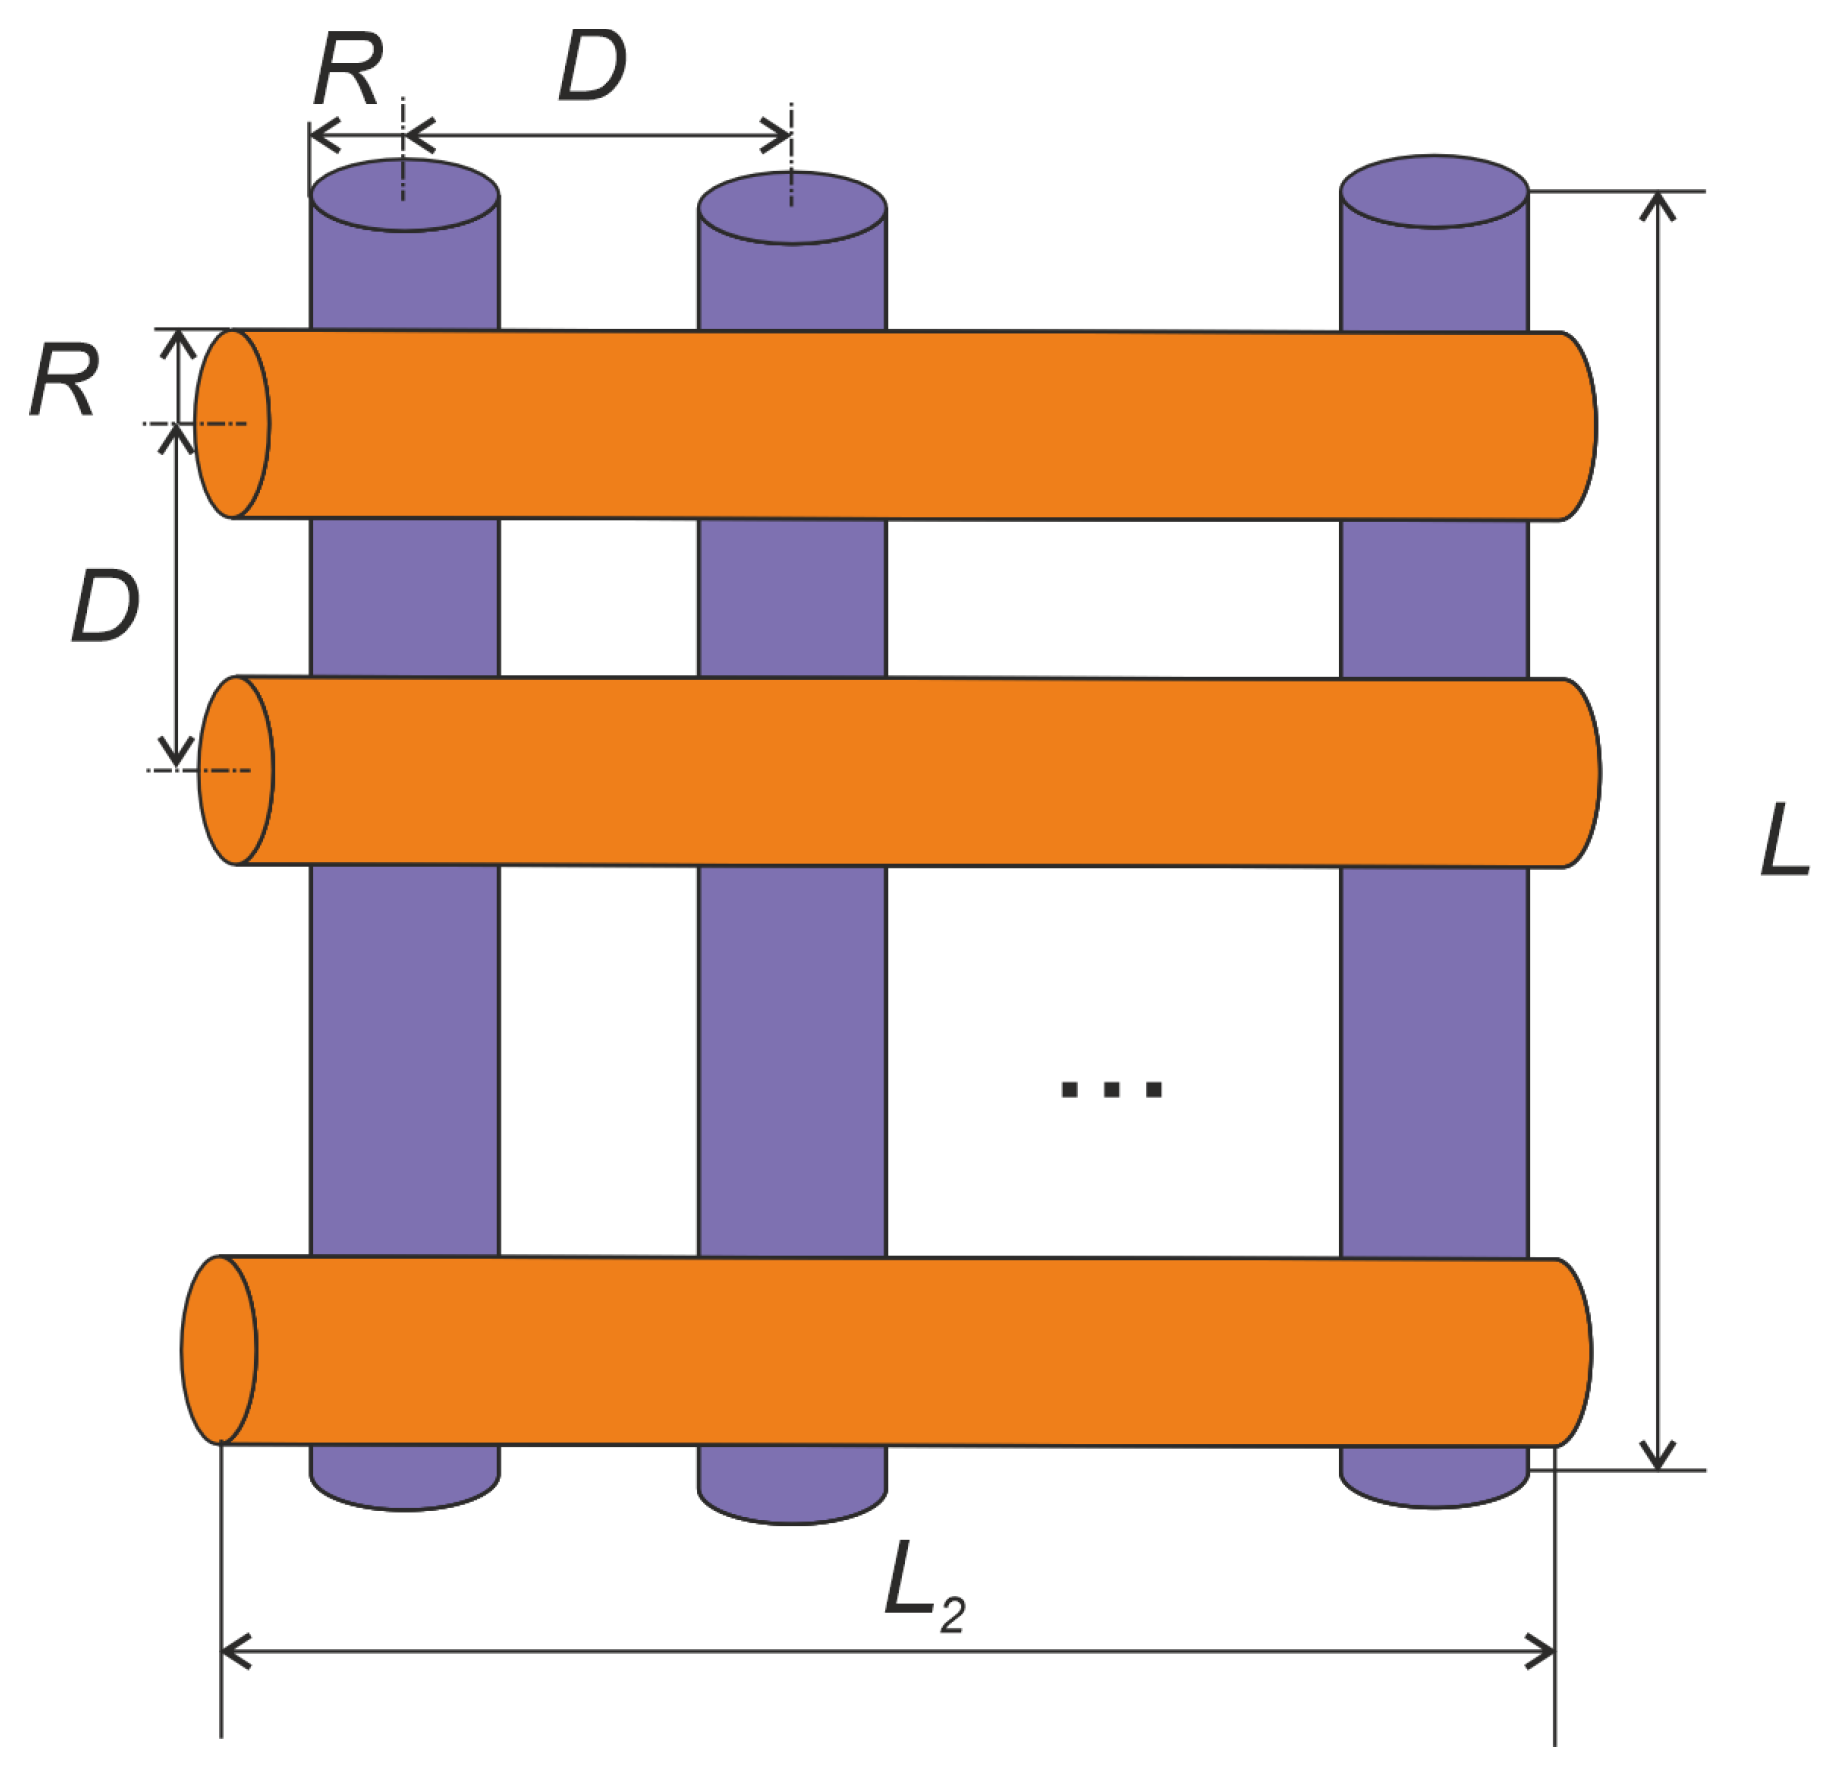
The developed shielding structure was designed to limit the power density in the eye region when the body is exposed to a wave of 3.5 GHz frequency for both linear vertical and linear horizontal polarization. In order to not restrict visibility, such a cover cannot be made of a solid conductive material. Accordingly, a system of thin rectilinear wires was used [17], the conductivity and length of which were selected to partially absorb the wave energy. Such elements can be made in the form of sputtered tracks on transparent plastic, which will minimize the reduction of the user’s visibility. The structure of the screen is shown in Figure 7. The distance between the shield and the eye was fixed in our research; it results from our assumption that the shield will be incorporated into the protective glasses. In such a case, the distance between the glass lens and the eye is fixed and defined by the back vertex distance. The latter is the distance between the front face of the cornea/corneal vertex and the back side of the glass lens. Normally, this parameter varies from 13 mm to approximately 16 mm according to standard ophthalmology practice.
In this study, we investigated how the conductivity of the elements and their length influence the performance of a shielding structure without assuming the technology of the structure fabrication. For simplicity, we assumed that the wires are cylindrical in shape, as their exact cross-sectional shape does not affect the effectiveness of the design. Accordingly, the structure consists of 20 vertical and 20 horizontal wires that were placed 32 mm from the eye. The radius of the conductors is R = 0.5 mm, and the distance between them is D = 4 mm. The design variables (L, L2, σ), where σ is the conductivity of the material, were synthesized using the EStra automatic optimization algorithm and Remcom XFdtd program. The objective function f2 minimized in the optimization process was the maximum value of the power density in the eye area, similarly obtained to the previous case for 4 points inside the eye.
f 2 ( L , L 2 , σ ) = max { max n = 1 , 4 | | S E z ( n , L , L 2 , σ ) | | ,   max n = 1 , 4 | | S E x ( n ,   L , L 2 , σ ) | | }
where:
  • SEz—Vector values in the eye area for vertical polarization (W/m2)
  • SEx—Poynting vector values in the eye area for horizontal polarization (W/m2)
  • L—Length of vertical wire in the shielding structure (mm)
  • L2—Length of horizontal wire in the shielding structure (mm)
  • σ—Conductivity of the material (S/m)
The problem reads: starting from the initial guess, find the design parameters (L, L2, σ) minimizing (2) subject to suitable constraints. The geometrical constraints were resulting from the location of the structure in the proximity of the face. The length of vertical elements could change from 10 mm to 70 mm; in the case of horizontal elements, the length could change from 10 mm to 50 mm. The material conductivity could change from 1 S/m to 900 S/m. Figure 8 presents the procedure of the shield design. Again, the optimization algorithm was implemented in a Matlab environment, while the evaluation of the objective function relied on the XFdtd program. At each iteration, two simulations of the shielding structure were performed, located in front of a simplified model of the face. One field analysis was run for the vertical polarization of EM waves, and another one for the horizontal polarization. In both cases, the frequency was equal to 3.5 GHz, and the amplitude of the electric field component was equal to 87 V/m. The greatest overall value of the Poynting vector was sent to the EStra algorithm as the updated value of the objective function.
3. Results

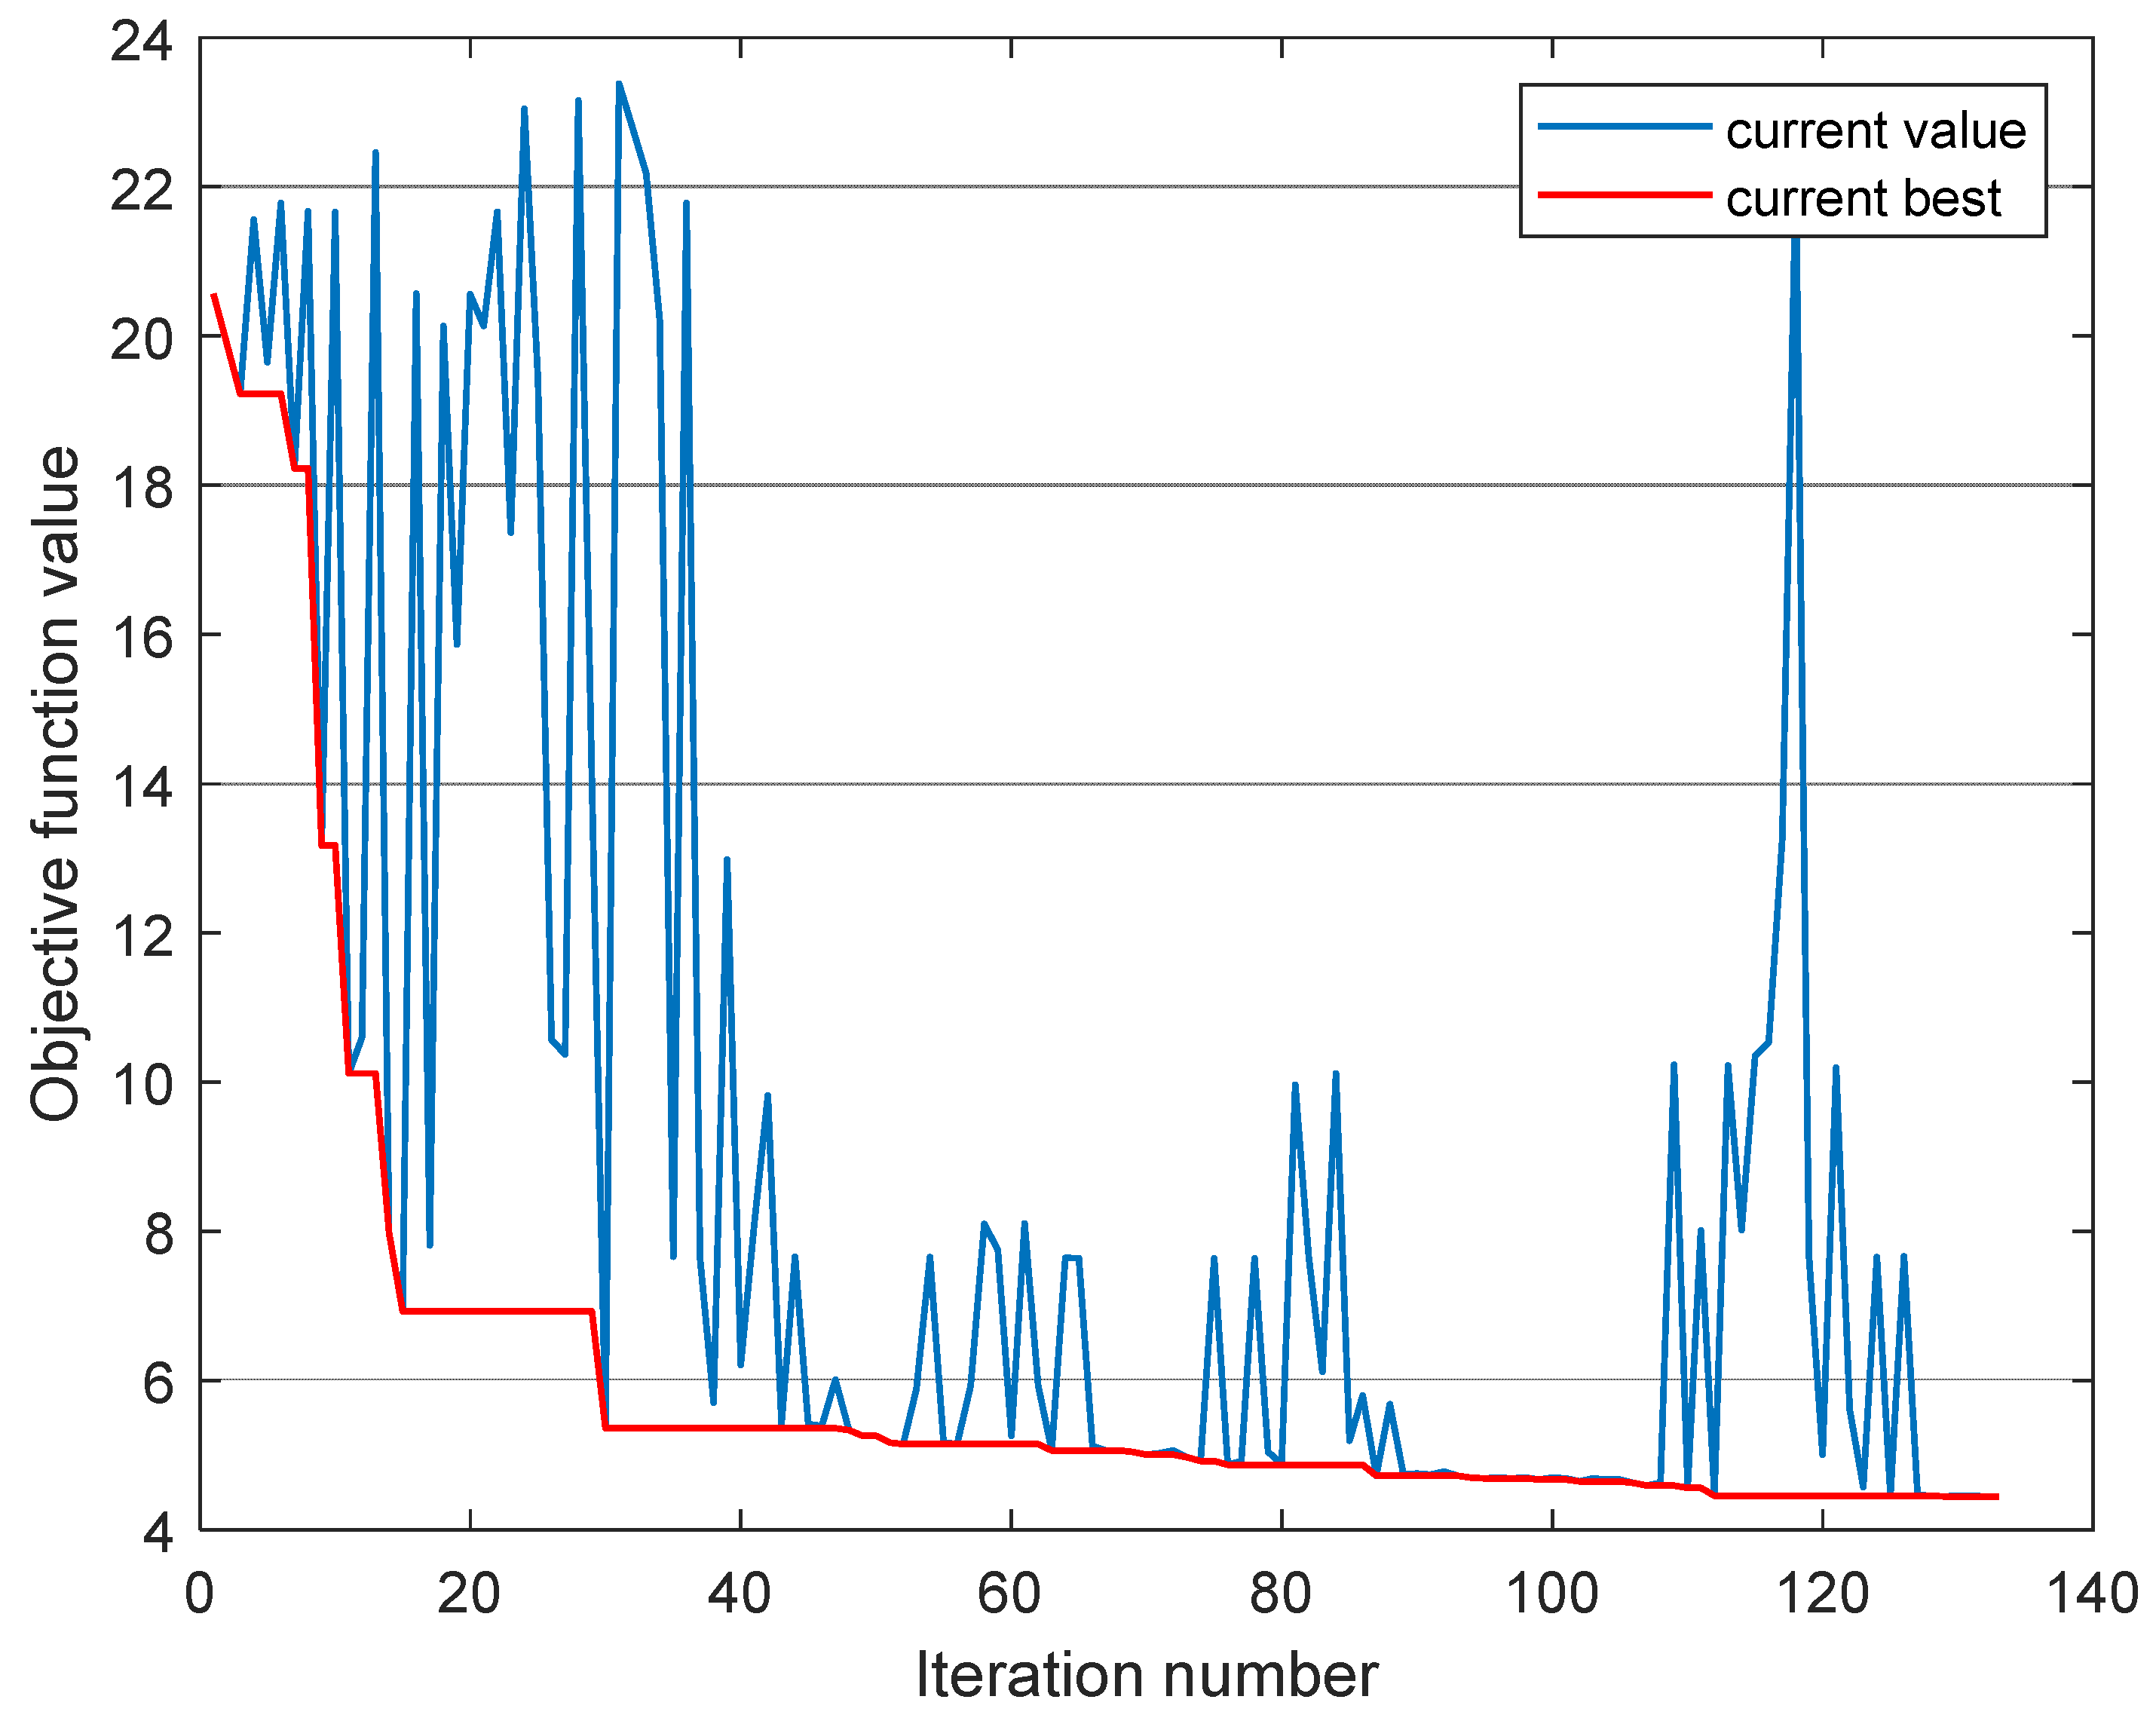
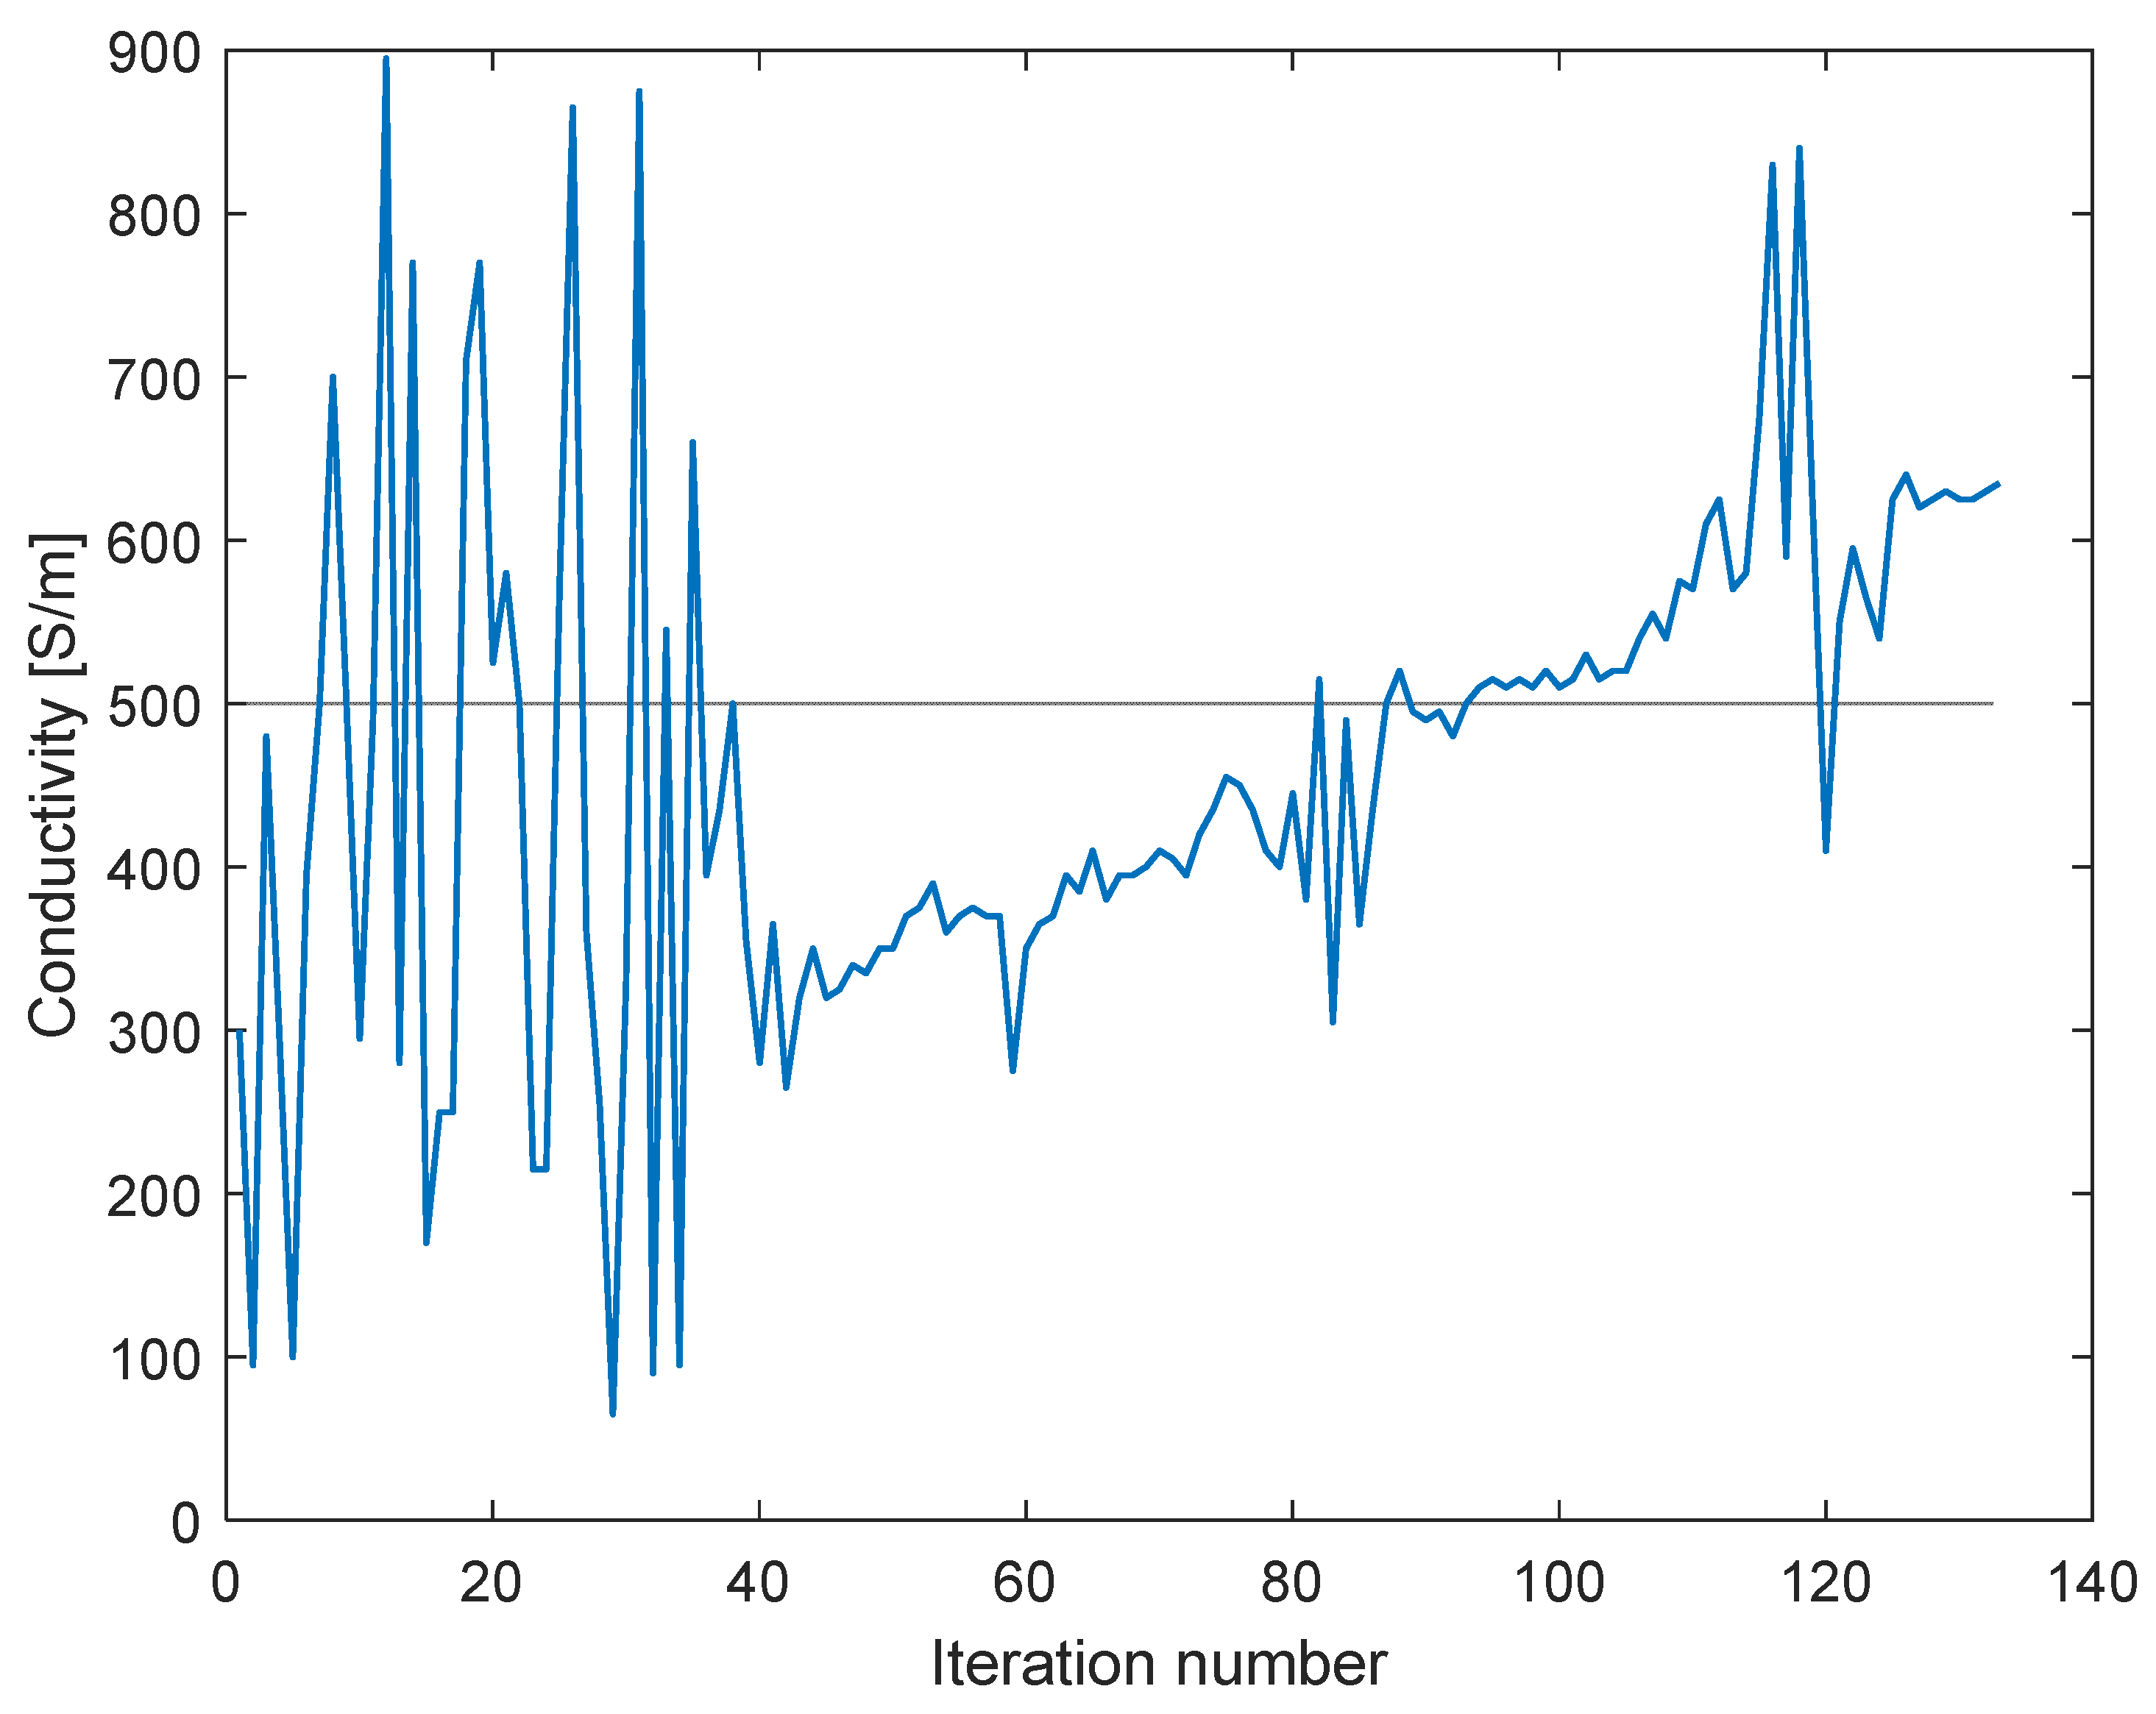
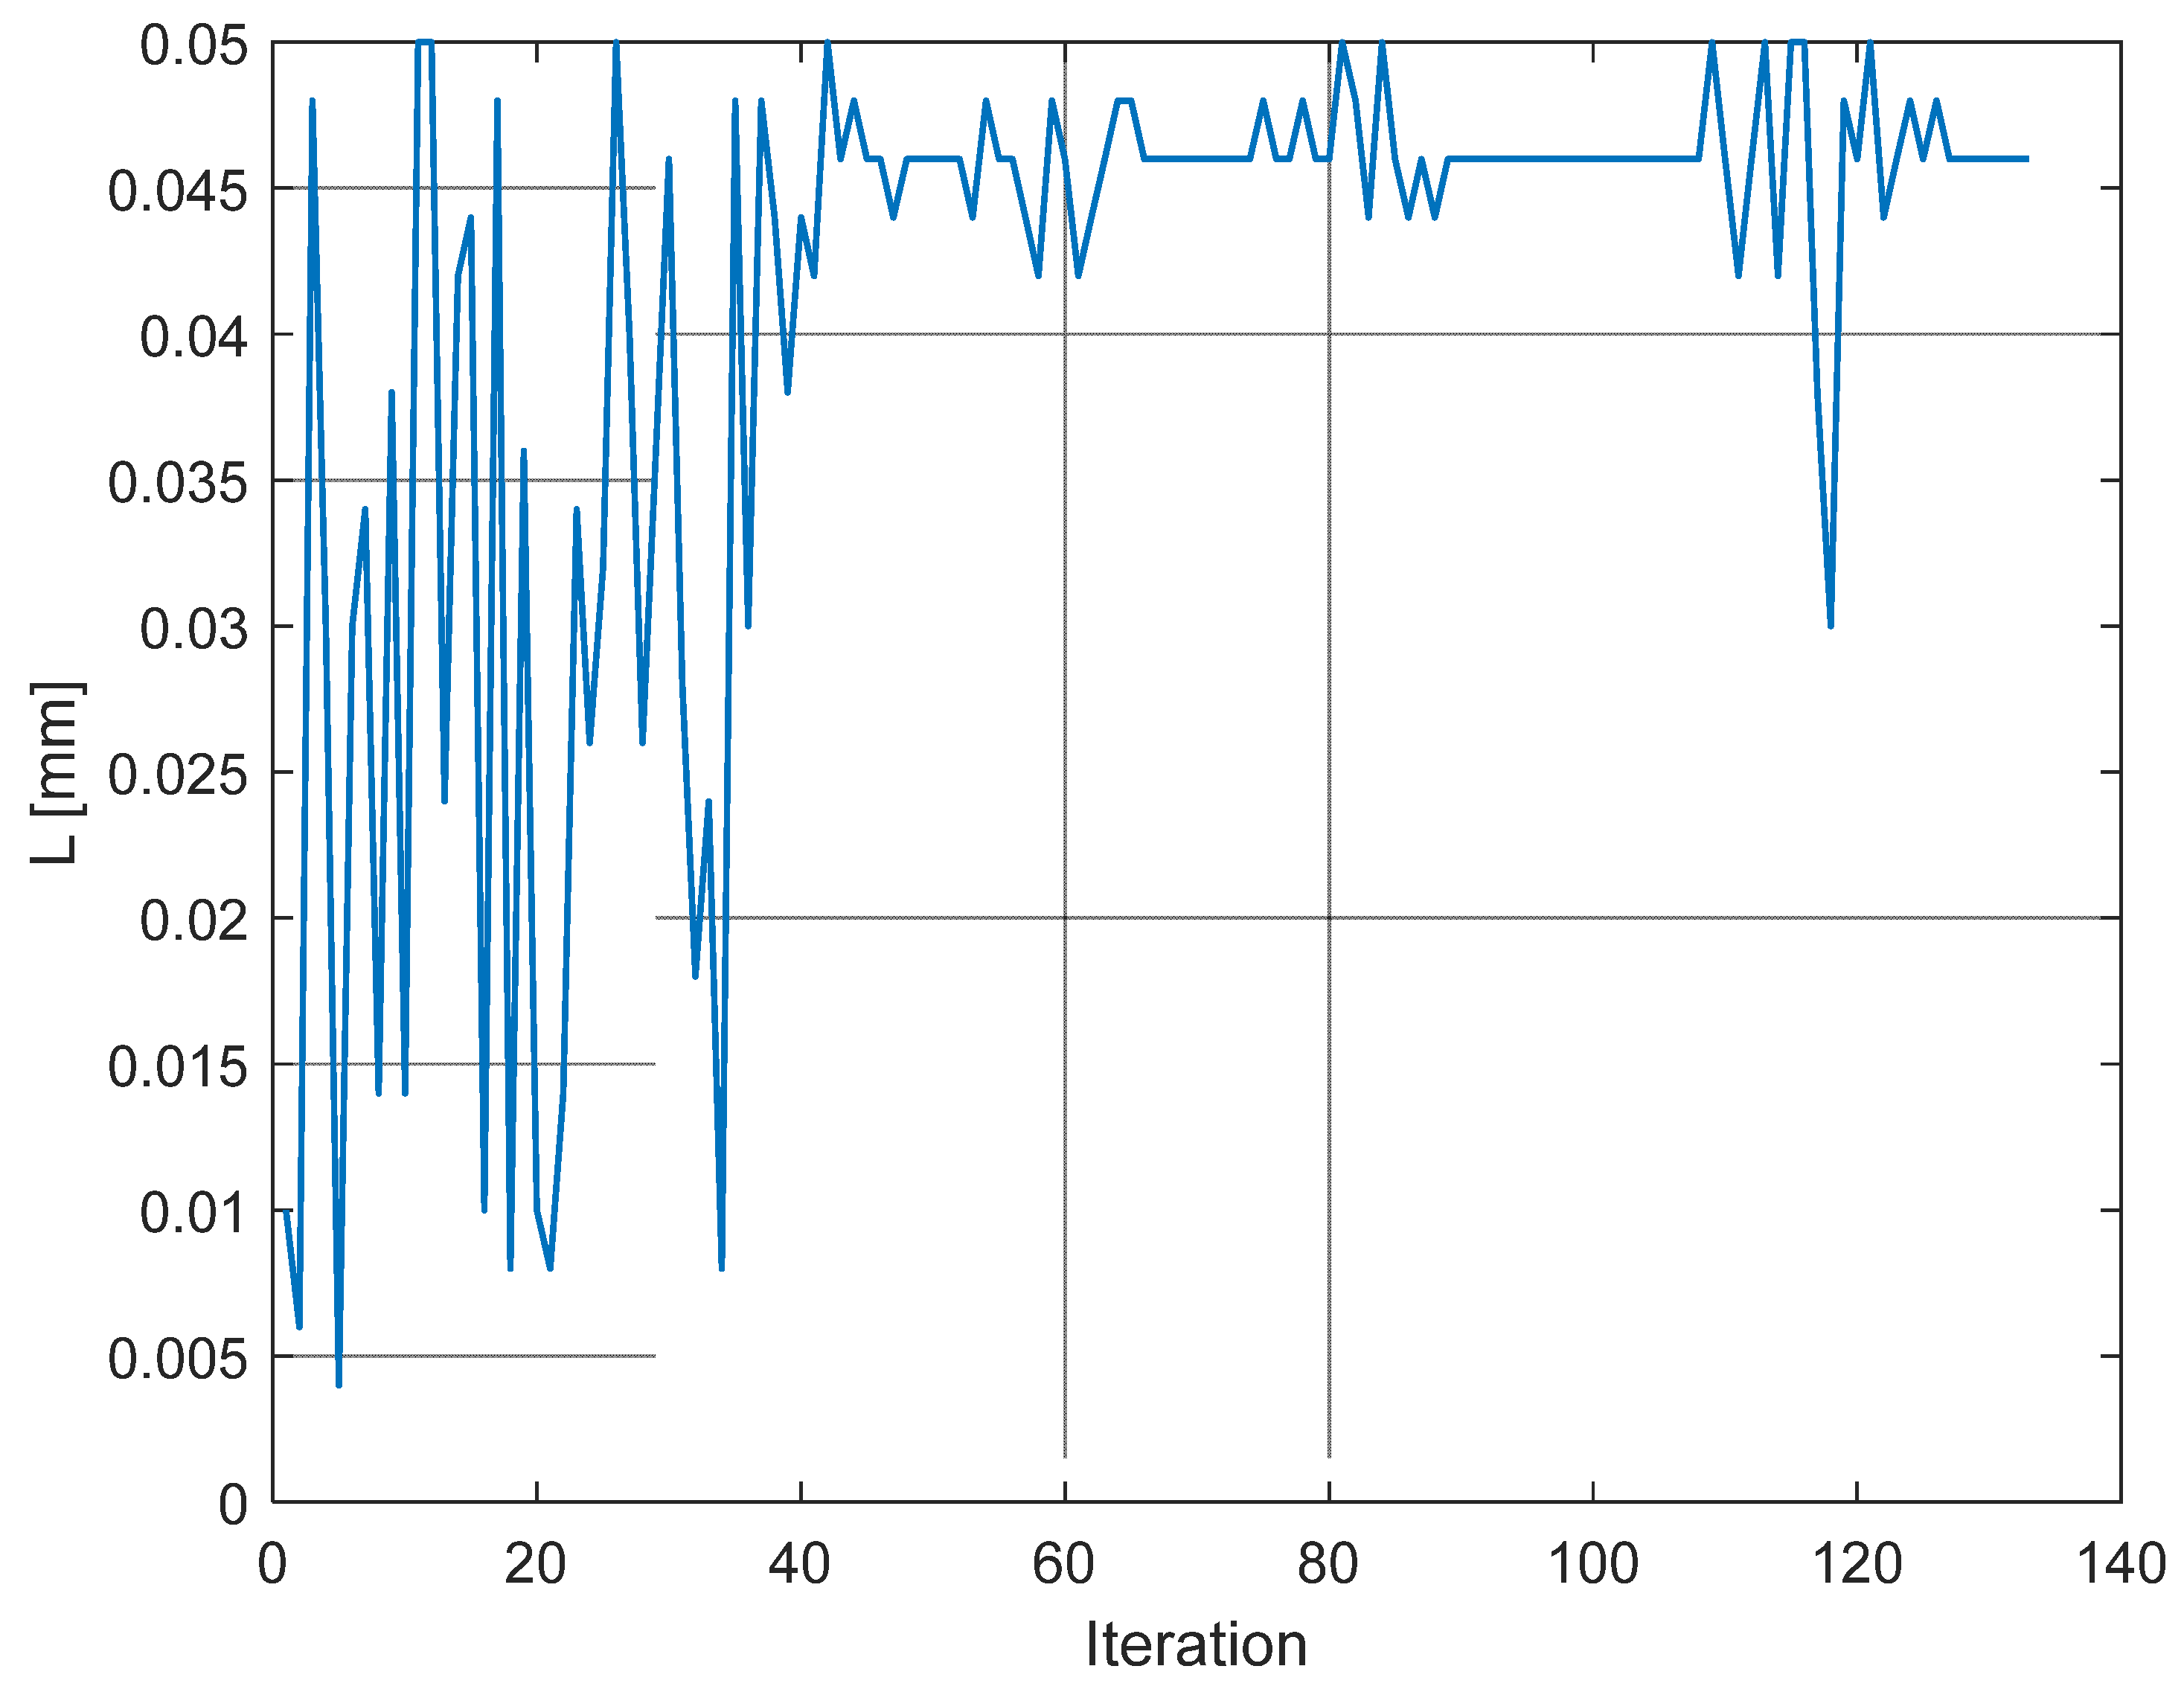
The optimization algorithm used the following initial values of the design parameters: Lstart = 10 mm, L2start = 10 mm, and σstart = 300 S/m, respectively. The initial value of the objective function to minimize was f2start = 20.56 W/m2. As a result of 132 iterations, the value of the objective function was reduced to f2stop = 4.44 W/m2. The optimization process took 10 h and 8 min. The parameters of the optimized structure are presented in Table 5. The history of the optimization process is presented in Figure 9. In Figure 10 and Figure 11, the history of the two design parameters along the optimization procedure is presented, respectively.
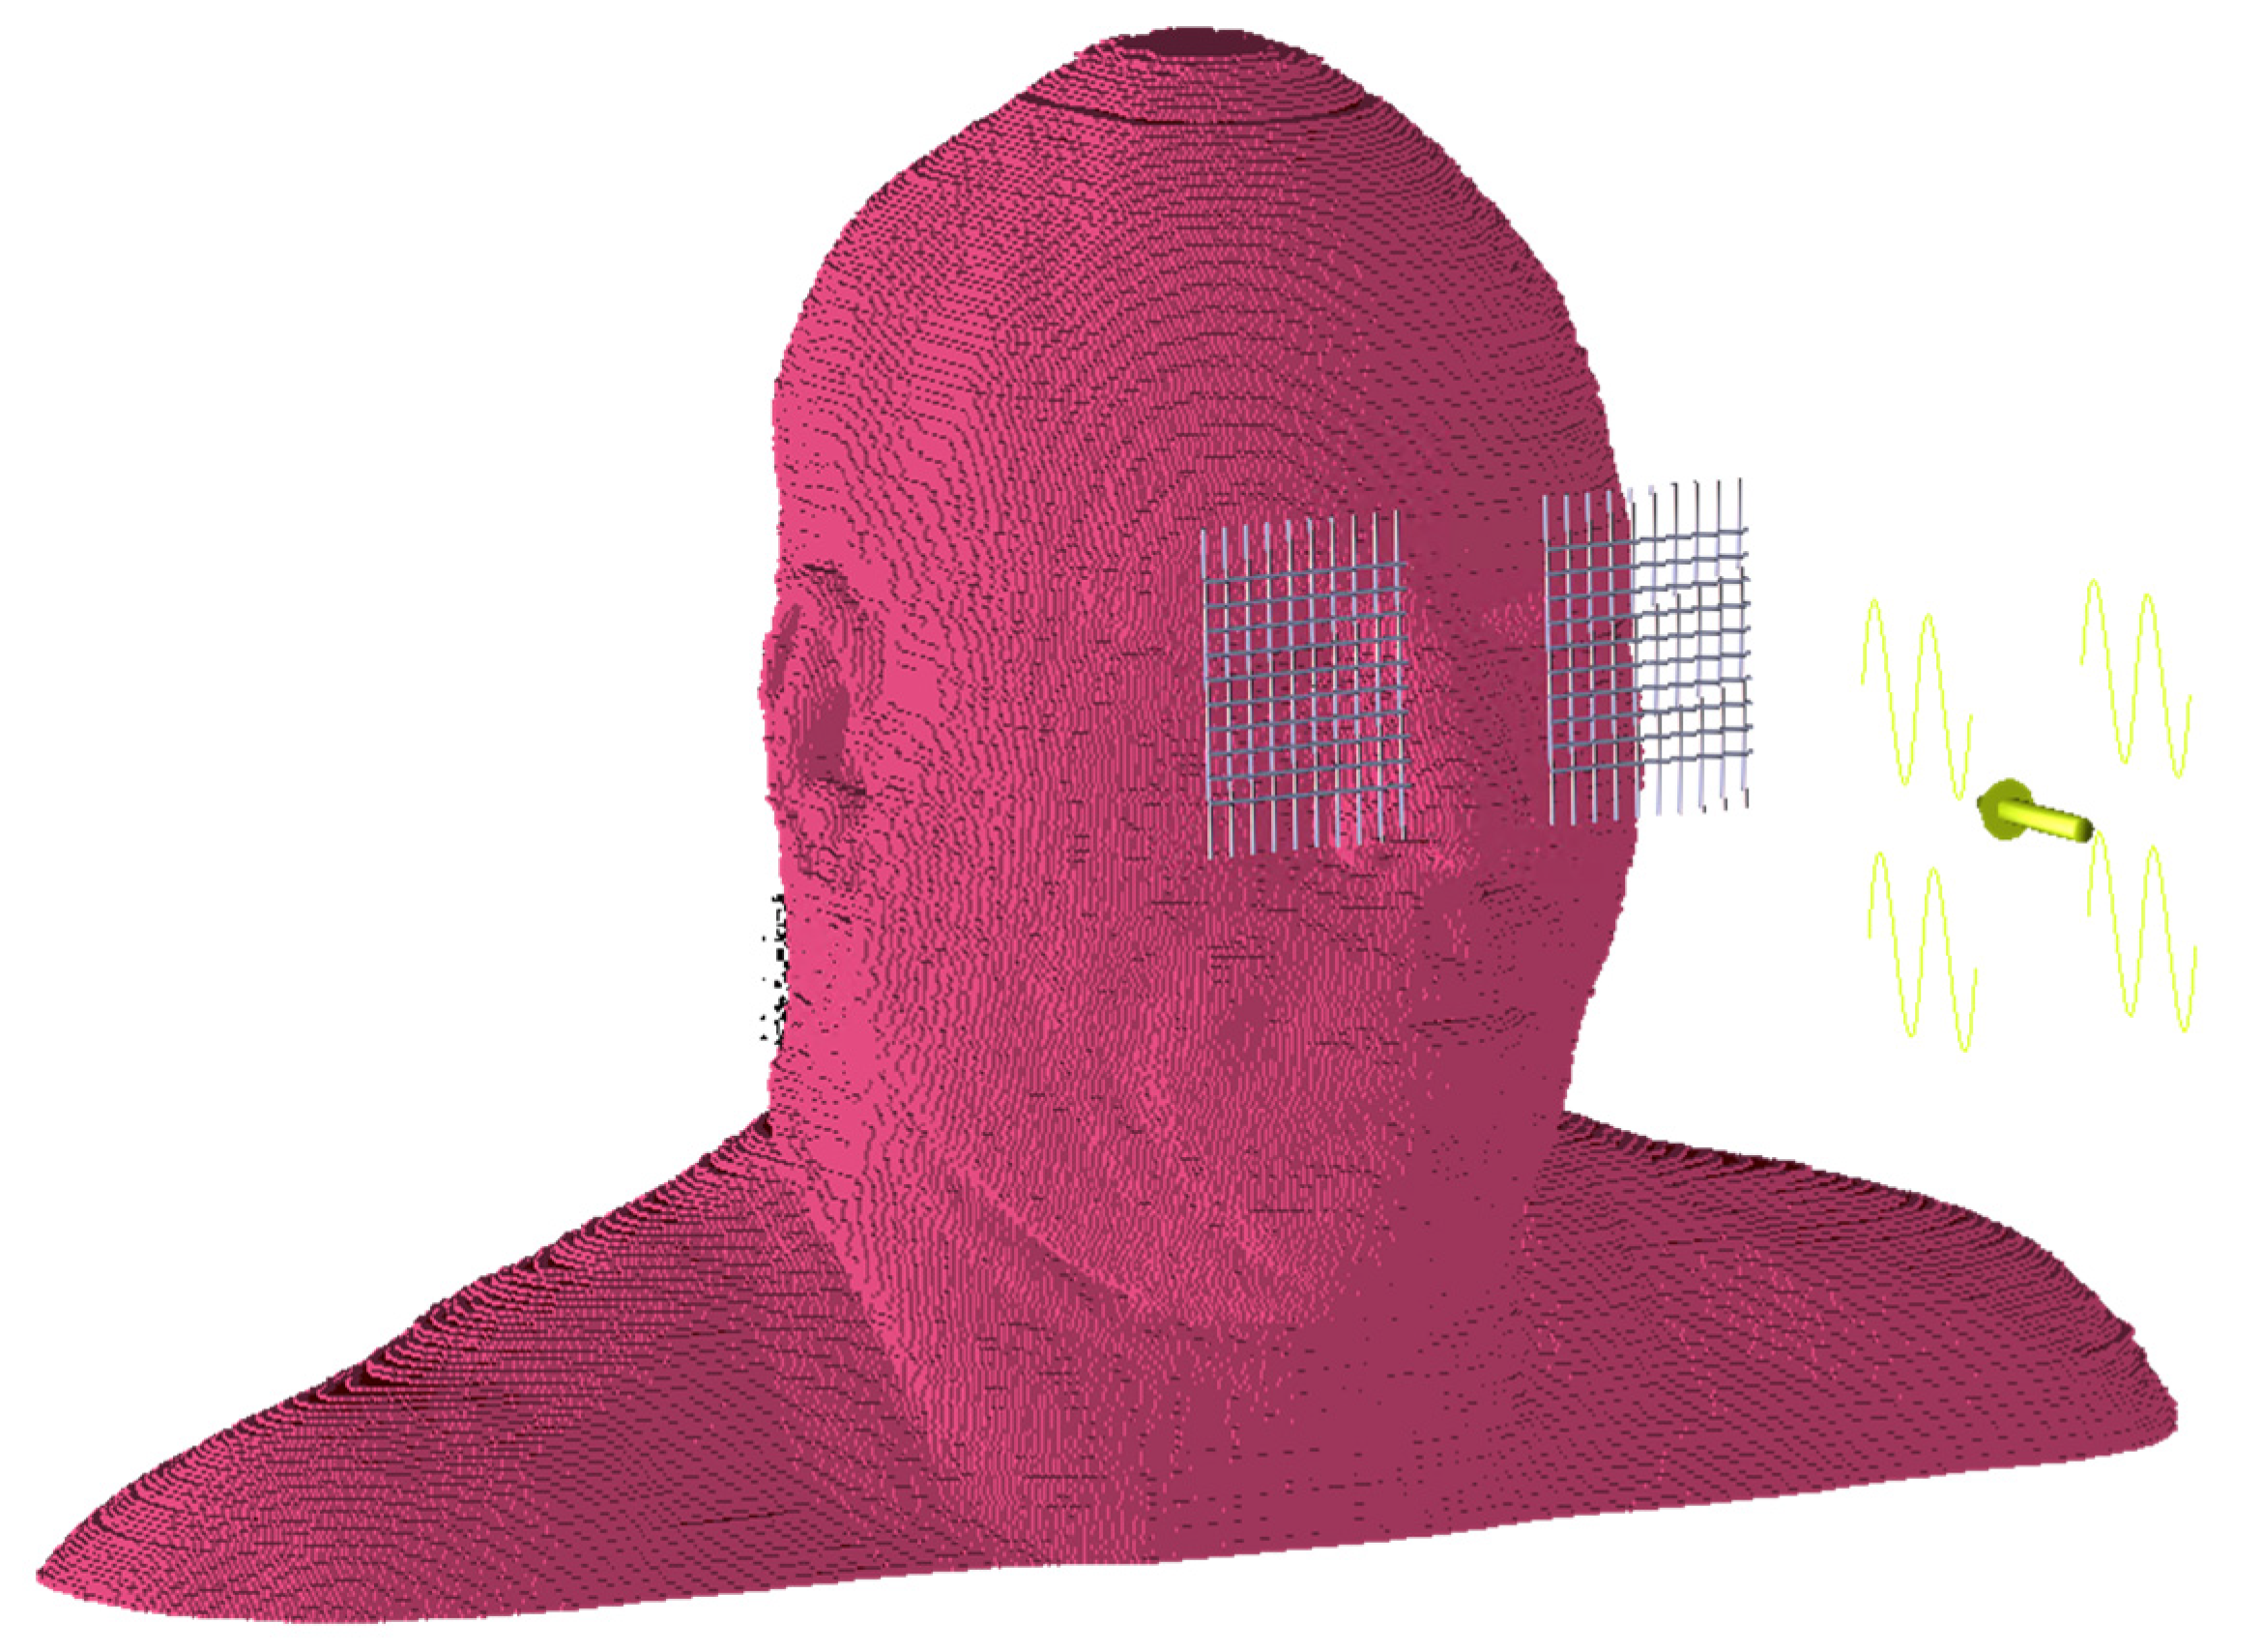
The synthesized shielding structure was verified using a heterogeneous model of the whole head. Figure 12 shows the heterogeneous model with the shielding structure that had the parameters resulting from the optimization process. The maximum value of the power density in the eyeball area without a shielding structure was 12.5 W/m2 for the vertical polarization and 6.5 W/m2 for the horizontal polarization. After applying the synthesized structure, it was reduced to 0.98 W/m2 for the vertical polarization and 0.9 W/m2 for the horizontal polarization. Additionally in this experiment, the assumed amplitude of the electric field intensity of the incident wave was 87 V/m.
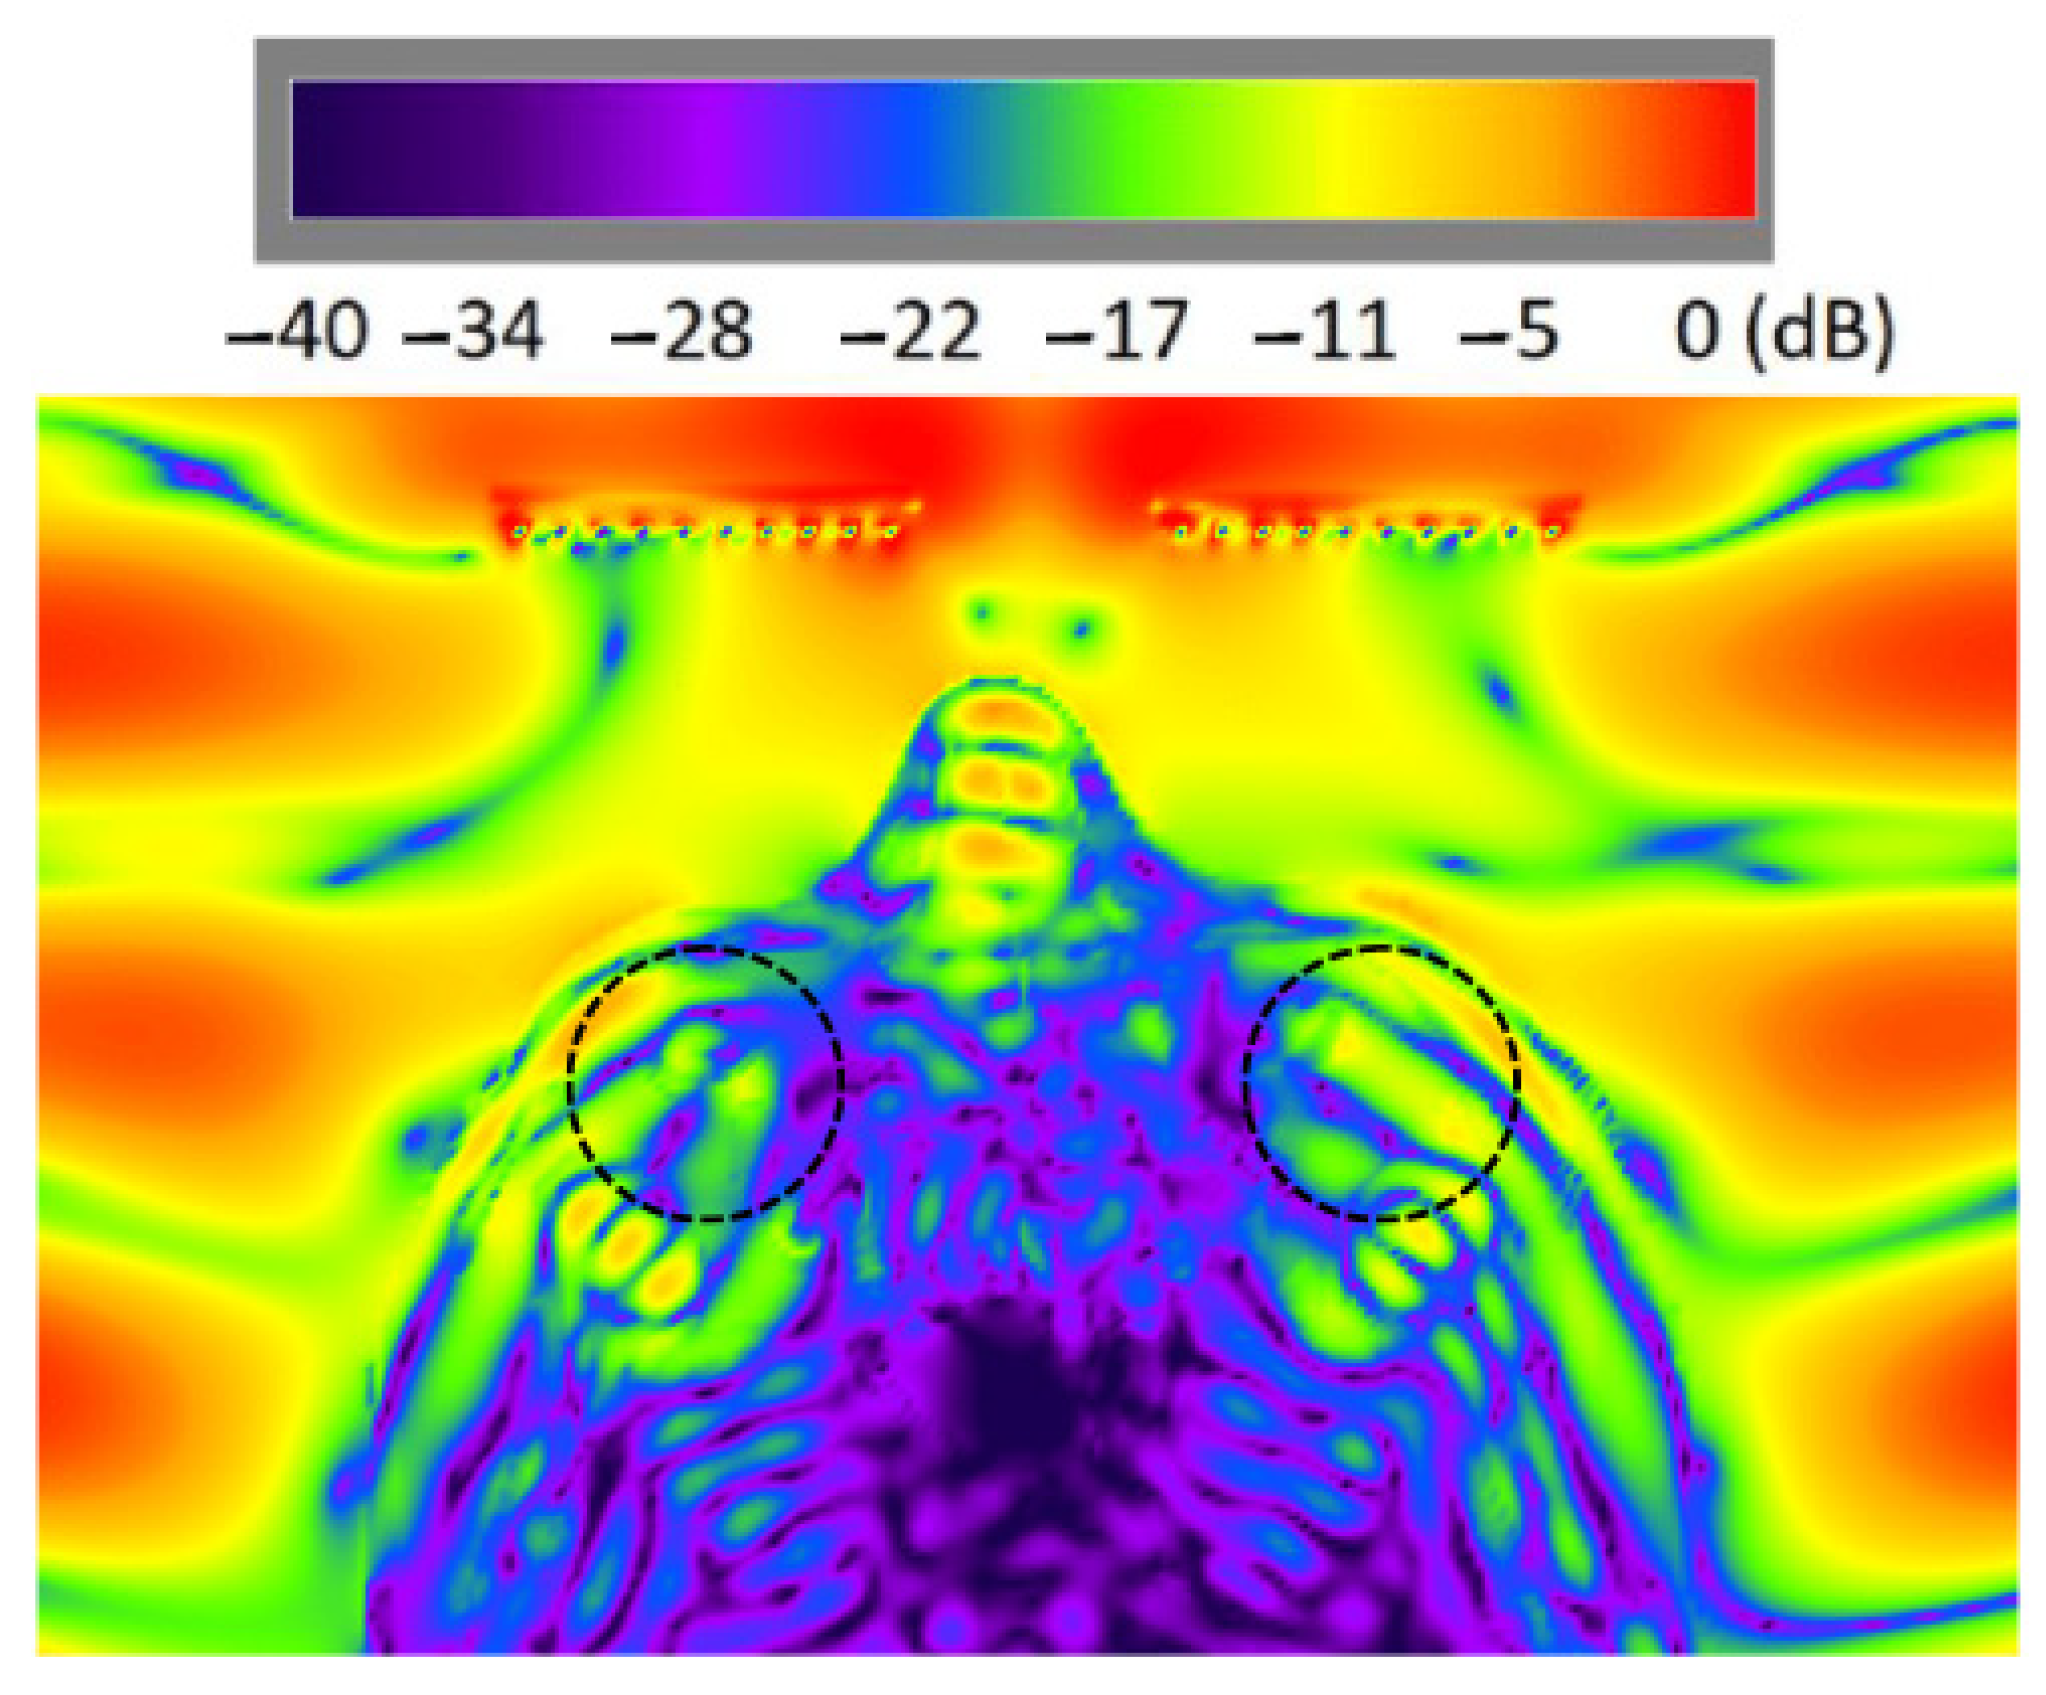
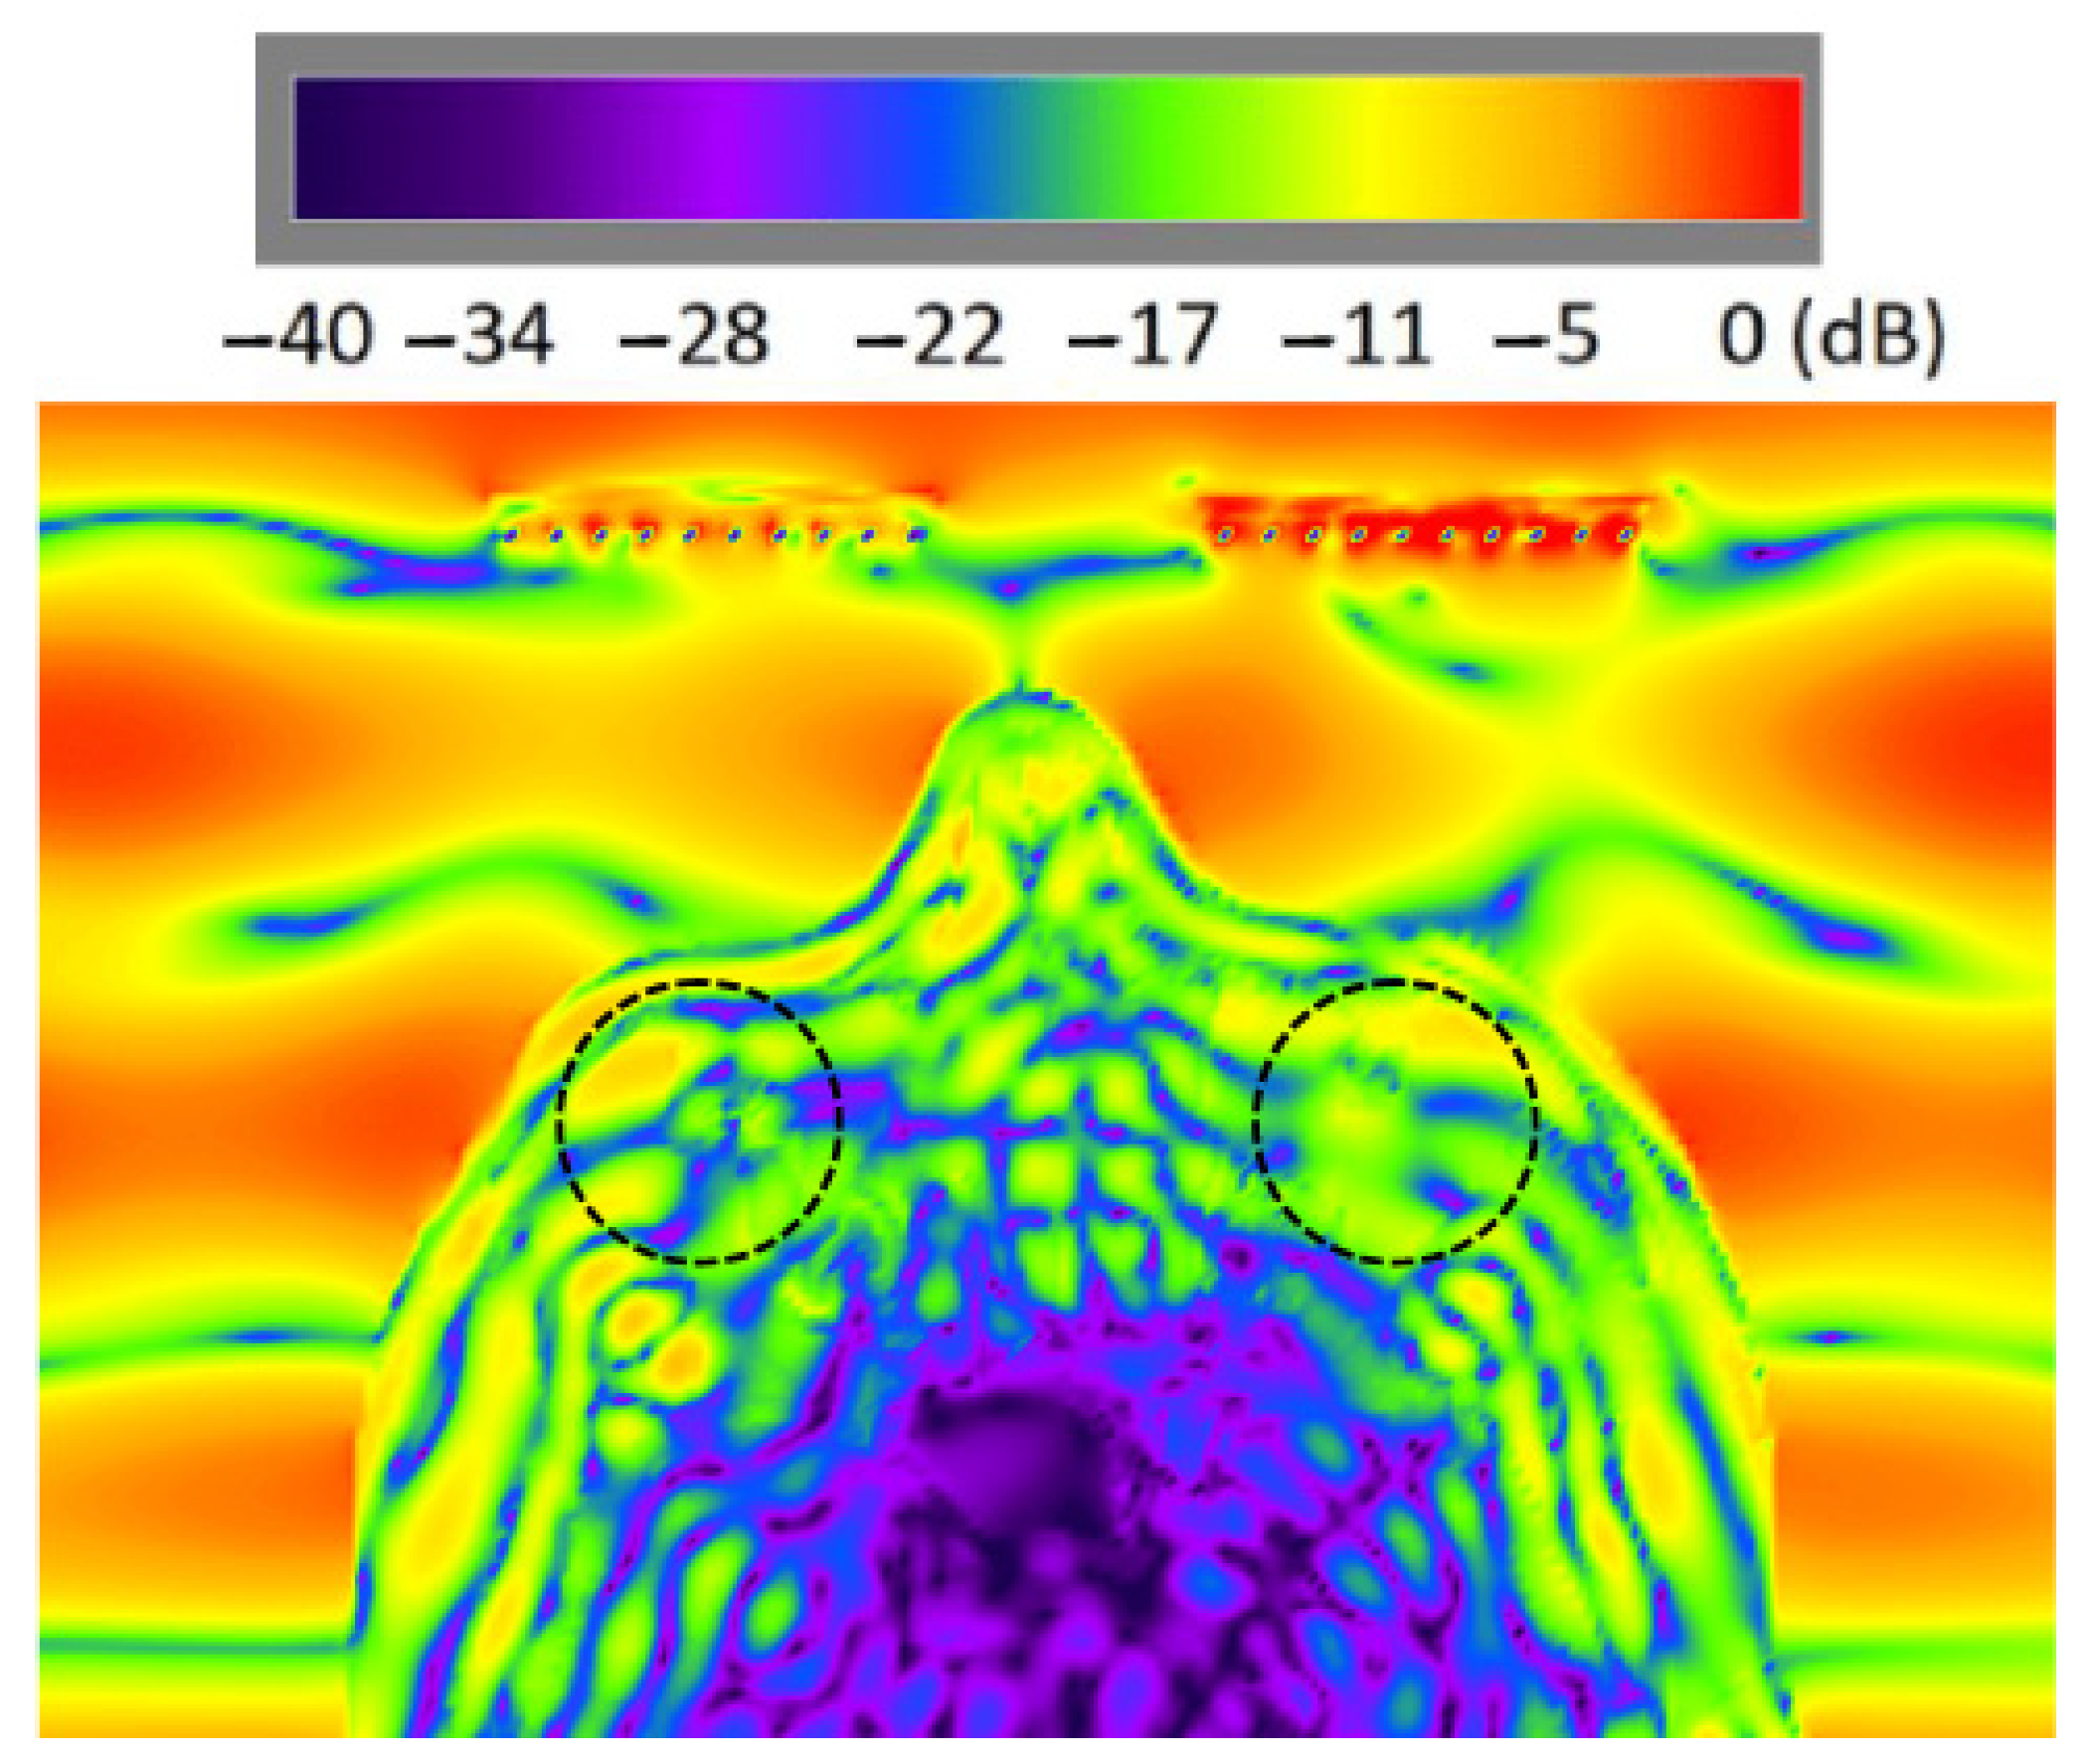
The performance of the shielding structure was further examined with the analysis of power density distribution in the cross-section of the human head in the eye region. The simulations were performed for the model exposed to the EM wave of 3.5 GHz for the case with and without the shielding structure. In the simulations, the reference model that covers the entire head was used (as presented in Figure 12), while results in Figure 13, Figure 14, Figure 15 and Figure 16 are presented only for the region of eyes for clarity. With the dotted lines, the regions of the eyeballs are indicated.
Figure 13 presents the distribution of the power density for the model exposed to EM waves with vertical polarization. No shielding structure was used in this case. Figure 14 shows the results obtained for the model with a shielding structure exposed to an EM wave with vertical polarization. The unshielded case for horizontal polarization is presented in Figure 15. In Figure 16, the power density distribution is presented for the case of a head with a shielding structure that was exposed to horizontal polarization.
The results of the simulations for the test points located in the eye tissues are presented in Table 6. The points were as in previous cases, located in the regions of the eyelid, fat, lens, and eye vitreous tissues. The values of the Poynting vector for the model with and without a shield for the exposure to an EM wave with a vertical polarization are presented in the aforementioned table.

4. Discussion

The results presented in this article concern both the developed numerical model of the head and the eye-shielding structure designed thanks to the model.
As for the head model results, it has been shown that only limiting the number of voxels in the heterogeneous model leads to faster simulation, but the results of the power density estimation significantly differ from the unconstrained model. As shown in Table 1, the estimated power density values can have up to a 30-fold difference. The model proposed by us, simplified by limiting the number of voxels, makes it possible to speed up calculations. Due to the fact that it was made of materials identified by the optimization algorithm, it was possible to compensate for the introduced difference between the reference model and the simplified model. Such a model allows for a good mapping of the power density in the eye area, which can be seen in the final value of the objective function obtained in the model optimization process. The value of this function for the simplified model is 1.58, which corresponds to the maximum difference in power density obtained using the simplified model and the reference model. At the same time, a 50% reduction in the simulation time was obtained. The developed simplified model made it possible to shorten the time of structure optimization by about 7 h on a GPU-based platform.
The results regarding the shielding structure show that even a very simple arrangement of rod elements can limit the power density of the EM wave in the eye area. As presented in Table 6, even eight-fold differences were obtained in the case of the eye area not covered and covered with a shielding structure. Such a simple structure can be made in the form of a thin layer on a transparent plastic substrate, because its conductivity of 635 S/m can be obtained in many ways (e.g., by metal sputtering or graphene oxide technology). The results presented in Figure 13, Figure 14, Figure 15 and Figure 16 indicate that the designed shielding layer limits the wave power density for both vertical and horizontal polarization. This is of great importance when it is used to limit the impact of radiation from the base stations of mobile communication systems, such as 5G systems. In this case, as a result of multipath propagation, the wave emitted by the base station may undergo reflections and diffractions on obstacles, which results in a change in its polarization. The designed structure limits the power density of waves with orthogonal polarizations, and therefore it can be assumed that it will be effective in the application of the considered class of systems.
The results of the optimization of the head model and the optimization of the shielding structure indicate the effectiveness of the applied EStra algorithm based on the evolutionary strategy. In both cases, the algorithm converged and minimized the function in a relatively small number of iterations. As far as the issue of the sensitivity of the proposed solution is concerned, the data presented in Figure 10 and Figure 11 show the history of the two design parameters along the optimization procedure. Firstly, it can be seen that the variation range is substantial at the beginning of the optimization procedure, at least up to iteration 50, whereas it decreases towards convergence. Secondly, after comparing Figure 10 and Figure 11 with Figure 9, one can easily realize that the sensitivity to the design parameters at the convergence is low. In fact, the optimization algorithm substantially perturbed the current solution (blue curve in Figure 9) in the search for a better solution. Despite this, however, the optimum candidate remains stable (current best represented by the red line in Figure 9).

5. Conclusions

The results of the presented research indicate that the described method of developing a numerical head model enables the improvement of simulation computational efficiency while maintaining their accuracy at a sufficient level. The shielding structure designed using the presented simplified model has been positively verified using the reference model. This proves the usefulness of the simplified model for designing similar solutions.
The conducted research also shows how flexible and universal the optimization algorithm based on the evolutionary strategy is; it allowed for both the optimization of the head model and the designing of the shielding structure.
During future research, we plan to carry out optimization for a larger number of parameters, such as the distance between the conductors, in order to obtain an even better quality of shielding structure. We also plan to carry out further works using the developed methodology, the aim of which will be to develop shielding structures for illuminating waves with polarizations different from linear ones. Moreover, the effectiveness of the proposed structure for frequencies corresponding to all channels of the system under consideration will be tested on a laboratory prototype.
This article is more devoted to the methodology of shielding structure design than to the technology of its manufacturing. Nevertheless, in our future research, knowing what the conductivity of elements from the optimization process presented here should be, we will investigate how to fabricate semitransparent elements. A good candidate for this could be graphene oxide technology. The electric conductivity of graphene oxide can be improved by reducing the defects and breaks in the lattice through a process called reduction. In turn, by optimizing the reduction conditions, it is possible to obtain the electric conductivity of thin layers of graphene oxide in the range from 100 S/m to 1000 S/m, depending on the specific application and requirements. Graphene oxide has been used in a wide range of electronic and energy-related applications, including energy storage, sensors, and transparent conductive films.

Author Contributions

Conceptualization, Ł.J., J.K. and P.D.B.; methodology, Ł.J. and P.D.B.; software, J.K. and K.K.; formal analysis, P.D.B. and Ł.J.; investigation, Ł.J., J.K. and P.D.B.; resources, Ł.J. and K.K.; data curation, J.K. and K.K.; writing—original draft preparation, Ł.J., J.K. and P.D.B.; writing—review and editing, Ł.J., J.K. and P.D.B.; visualization, Ł.J. and J.K.; supervision, Ł.J. All authors have read and agreed to the published version of the manuscript.

Funding

This research received no external funding.

Institutional Review Board Statement

Not applicable (research was performed only by means of computer simulations).

Informed Consent Statement

Not applicable (research was performed only by means of computer simulations).

Data Availability Statement

The simulation results are available upon email request.

Conflicts of Interest

The authors declare no conflict of interest.

References

  1. Pretz, K. Will 5G Be Bad for Our Health? IEEE Spectr. Available online: https://spectrum.ieee.org/news-from-around-ieee/the-institute/ieee-member-news/will-5g-be-bad-for-our-health (accessed on 20 February 2021).
  2. Vorst, A.V.; Rosen, A.; Kotsuka, Y. RF/Microwave Interaction with Biological Tissues; John Wiley & Sons: New York, NY, USA, 2006. [Google Scholar]
  3. Pušić, T.; Šaravanja, B.; Malarić, K.; Luburić, M.; Kaurin, T. Electromagnetic Shielding Effectiveness of Woven Fabric with Integrated Conductive Threads after Washing with Liquid and Powder Detergents. Polymers 2022, 14, 2445. [Google Scholar] [CrossRef] [PubMed]
  4. Abu Saleem, A.R.; Abdelal, N.; Alsabbagh, A.; Al-Jarrah, M.; Al-Jawarneh, F. Radiation Shielding of Fiber Reinforced Polymer Composites Incorporating Lead Nanoparticles—An Empirical Approach. Polymers 2021, 13, 3699. [Google Scholar] [CrossRef] [PubMed]
  5. Pušić, T.; Šaravanja, B.; Malarić, K. Electromagnetic Shielding Properties of Knitted Fabric Made from Polyamide Threads Coated with Silver. Materials 2021, 14, 1281. [Google Scholar] [CrossRef] [PubMed]
  6. Tomovski, B.; Gräbner, F.; Hungsberg, A.; Kallmeyer, C.; Linsel, M. Effects of Electromagnetic Field Over a Human Body, Sar Simulation with and Without Nanotextile in the Frequency Range 0.9–1.8 GHZ. J. Electron. Eng. 2011, 62, 349–354. [Google Scholar] [CrossRef]
  7. Li, Y.; Zhang, X.; Yu, J.; Wang, Q.; Tan, B. Simulation of EM Field in Head Model and Shielding Effectiveness for Cellular Handset with PIFA. In Proceedings of the 2008 World Automation Congress, Waikoloa, HI, USA, 25–27 June 2008; pp. 1–4. [Google Scholar]
  8. Dutta, P.K.; Jayasree, P.V.Y.; Baba, V.S.S.N.S. SAR reduction in the modelled human head for the mobile phone using different material shields. Hum. Cent. Comput. Inf. Sci. 2016, 6, 44. [Google Scholar] [CrossRef] [Green Version]
  9. Sivasamy, R.; Kanagasabai, M.; Baisakhiya, S.; Natarajan, R.; Pakkathillam, J.K.; Palaniswamy, S.K. A Novel Shield for GSM 1800 Mhz Band Using Frequency Selective Surface. Prog. Electromagn. Res. Lett. 2013, 38, 193–199. [Google Scholar] [CrossRef] [Green Version]
  10. Farooq, U.; Iftikhar, A.; Shafique, M.; Khan, M.; Fida, A.; Mughal, M.; Anagnostou, D. C-Band and X-Band Switchable Frequency-Selective Surface. Electronics 2021, 10, 476. [Google Scholar] [CrossRef]
  11. Mohamadzade, B.; Hashmi, R.M.; Simorangkir, R.B.V.B.; Gharaei, R.; Rehman, S.; Abbasi, Q.H. Recent Advances in Fabrication Methods for Flexible Antennas in Wearable Devices: State of the Art. Sensors 2019, 19, 2312. [Google Scholar] [CrossRef] [Green Version]
  12. Ali, S.M.; Sovuthy, C.; Imran, M.A.; Socheatra, S.; Abbasi, Q.H.; Abidin, Z.Z. Recent Advances of Wearable Antennas in Materials, Fabrication Methods, Designs, and Their Applications: State-of-the-Art. Micromachines 2020, 11, 888. [Google Scholar] [CrossRef] [PubMed]
  13. IEEE. C95.3-2002, Recommended Practice for Measurements and Computations of Radio Frequency Electromagnetic Fields with Respect to Human Exposure to Such fields, 100 kHz to 300 GHz. In IEEE Standards and Coordinating Committee 28 on Non-Ionizing Radiation Hazards; IEEE: Piscataway, NJ, USA, 2002; pp. 1–126. [Google Scholar]
  14. Reference Manual-XFdtd. Available online: https://support.remcom.com/xfdtd/reference.html (accessed on 20 November 2022).
  15. Di Barba, P. Multiobjective Shape Design in Electricity and Magnetism; Springer: Berlin/Heidelberg, Germany, 2010. [Google Scholar]
  16. Di Barba, P. MEMS: Field Models and Optimal Design; Springer: Berlin/Heidelberg, Germany, 2020. [Google Scholar]
  17. Januszkiewicz, Ł. Analysis of Shielding Properties of Head Covers Made of Conductive Materials in Application to 5G Wireless Systems. Energies 2021, 14, 7004. [Google Scholar] [CrossRef]
Figure 1. The concept of the eye-protective shielding structure.
Electronics 12 00291 g001
Figure 2. Heterogeneous model of head in the XFdtd program: (a) model view; (b) horizontal plane cross-section at the level of the eyeballs.
Electronics 12 00291 g002
Figure 3. The 4 test points located in the layers of the eye for the reference model. Eyelid (A), muscle (B), lens (C), and eye vitreous (D).
Electronics 12 00291 g003
Figure 4. Heterogeneous model of the head fragment (face model).
Electronics 12 00291 g004
Figure 5. Simplified model of a human face. (a) Horizontal plane cross-section at the level of the eyeballs. (b) Front view of the face.
Electronics 12 00291 g005
Figure 6. The procedure of the optimization of the head model.
Electronics 12 00291 g006
Figure 7. Geometric design variables (L, L2) and fixed parameters (R, D) of the shielding structure.
Electronics 12 00291 g007
Figure 8. The procedure of the optimal design of the shielding structure.
Electronics 12 00291 g008
Figure 9. History of the optimization process.
Electronics 12 00291 g009
Figure 10. History of the optimization process. The changes in material conductivity over iterations.
Electronics 12 00291 g010
Figure 11. History of the optimization process. The changes in the L parameter over iterations.
Electronics 12 00291 g011
Figure 12. The heterogeneous model with the synthesized shielding structure.
Electronics 12 00291 g012
Figure 13. Power density distribution without shield (vertical polarization); reference value 0 dB = 40 W/m2. The regions in the circle are the areas of the eye.
Electronics 12 00291 g013
Figure 14. Power density distribution with shield (vertical polarization); reference value 0 dB = 40 W/m2. The regions in the circle are the areas of the eye.
Electronics 12 00291 g014
Figure 15. Power density distribution without shield (horizontal polarization); reference value 0 dB = 40 W/m2. The regions in the circle are the areas of the eye.
Electronics 12 00291 g015
Figure 16. Power density distribution with shield (horizontal polarization); reference value 0 dB = 40 W/m2. The regions in the circle are the areas of the eye.
Electronics 12 00291 g016
Table 1. The comparison of the Poynting vector values [W/m2] at the test points, depending on the angle of the EM wave in the x–y plane.
Test Point LocationEM Wave at
ϕ = 90° (EM from the Front)
EM Wave at
ϕ = 67.5°
EM Wave at
ϕ = 45°
Eyelid (A)12.55.91.37
Muscle (B)8.73.651.31
Lens (C)10.54.842.06
Eye vitreous (D)7.963.460.5
Table 2. The comparison of the reference model and the cutout model.
Reference ModelCutout Model
Number of voxels [mln]40.22.1
Memory required [MB]1500264
Simulation time [s]332109
S(Eyelid) [W/m2]12.566
S(Muscle) [W/m2]8.7179
S(Eye Sclera) [W/m2]10.568
S(Eye Vitreous) [W/m2]7.96351
Table 3. The material properties of the simplified model of the face: initial values and final values.
Skin RegionMuscle RegionEye Sclera Region
Initial values ε 1 = 4; σ 1 = 0.0002 ε 2 = 4; σ 2 = 0.2 ε 3 = 4; σ 3 = 0.5
Final values ε 1 = 8.93; σ 1 = 0.57 ε 2 = 7.09; σ 2 = 0.44 ε 3 = 2.01; σ 3 = 1.59
Table 4. Poynting vector for the reference model and the simplified model.
Test Point LocationPower Density (Reference Model) [ W m 2 ] Power Density (Simplified Model) [ W m 2 ]
Eyelid (A)12.5 11.49
Muscle (B)8.710.49
Lens (C)10.58.97
Eye vitreous (D)7.966.38
Table 5. Parameters of the designed shield.
Parameter NameValue
Vertical length L [mm]66
Horizontal size L2 [mm]46
Conductivity σ [S/m] 635
Table 6. Poynting vector for the model with and without shield, vertical polarization.
Test Point LocationPower Density without Shield [ W m 2 ] Power Density with Shield [ W m 2 ]
Eyelid12.5 0.79
Muscle8.70.78
Lens10.50.98
Eye vitreous7.960.94
Disclaimer/Publisher’s Note: The statements, opinions and data contained in all publications are solely those of the individual author(s) and contributor(s) and not of MDPI and/or the editor(s). MDPI and/or the editor(s) disclaim responsibility for any injury to people or property resulting from any ideas, methods, instructions or products referred to in the content.