Article

Human Factor Interrelationships to Improve Worker Reliability: Implementation of MCDM in the Agri-Food Sector

1
Department of Engineering, University of Palermo, Viale delle Scienze bld. 8, 90128 Palermo, Italy
2
Department of Engineering, University of Messina, Contrada di Dio, 98166 Messina, Italy
*
Author to whom correspondence should be addressed.
Electronics 2023, 12(2), 283; https://doi.org/10.3390/electronics12020283
Submission received: 30 November 2022 / Revised: 29 December 2022 / Accepted: 4 January 2023 / Published: 5 January 2023

Abstract

:
Performance Shaping Factors (PSFs) are contextual, individual, and cognitive factors used in Human Reliability Analysis (HRA) to quantify the worker contribution to errors when performing a generic task. Although the empirical evidence demonstrates the existence of PSF interrelationships, the majority of HRA methods assume their independence. As a consequence, the resulting Human Error Probability (HEP) might be over- or underestimated. To deal with this issue, only a few qualitative guidelines or statistical-based approaches have been proposed so far. While the former are not well structured, the latter require a high computational effort and a proper number of input data. Therefore, the present paper provides an alternative approach to deal with the PSFs interaction issue to facilitate the identification of the most influential human factors on which to take corrective actions. To this purpose, Multi Criteria Decision Making (MCDM) methods may represent a structured, effortless, and easily replicable framework. Owing to their ability to deal with the interdependence of decision factors, DEMATEL and ANP are hence considered and afterwards compared, highlighting their strengths and weaknesses. Both methods are implemented in an agri-food company which produces pistachios in Southern Italy.

1. Introduction

Since the 1970s, Human Reliability Analysis (HRA) techniques [1,2,3,4] have been widely implemented in Nuclear Power Plants (NPPs) to quantify the human error contribution to the occurrence of accidents [5]. Only in recent years, HRA methods have been also extended to other fields [6,7,8,9], owing to the central role played by human behavior to the risk exposure in whatever workplace.
Among HRA methodologies, the second-generation ones aim both to identify the root causes of human errors, which lead to accidents, and to evaluate the Human Error Probability (HEP) when performing a generic task. In particular, these techniques are based on the use of Performance Shaping Factors (PSFs) to consider the dependence of worker performance on personal, contextual, and cognitive factors strictly related to the work environment. Although HRA methods generally disregard the existence of mutual interactions among PSFs, the empirical evidence shows otherwise. As a result, HEP may be over- or underestimated. Therefore, it is important to account for whether some PSFs affect each other, or whether PSFs have different phenomena affected by the same cause [6,10].
To evaluate the degree of interrelationship between PSFs, only a few contributions to the literature propose qualitative guidelines [1,3,4] and/or analytical methodologies [6,10,11,12,13,14,15,16], mainly implementing statistical-based analyses. While qualitative methods do not provide a well-structured approach, the quantitative ones are very challenging to implement, owing to both the computational effort and the sample size (i.e., input data) required to assure the significance of results [10,11,12,13,17,18]. With this recognition, Multi Criteria Decision Making (MCDM) methods may represent a robust, structured, and easier way to assess the mutual influence among PSFs, also owing to the absence of limitations and/or assumptions on the number of involved decision makers (i.e., sample size) [19]. In this regard, authors have recently proposed a DEcision MAking Trial and Evaluation Laboratory (DEMATEL)-based approach [20] to deal with the SPARH PSFs interrelationship issue in the agri-food sector. Developed by Gabus and Fontela [21], DEMATEL allows both the cause-and-effect scheme among factors of a complex decision problem and their relative importance (i.e., weights) to be obtained [22,23,24,25]. In addition, the method may be easily implemented and supplies a clear representation of results [23]. Among MCDM methodologies, the Analytic Network Process (ANP) [26] is an alternative approach which also allows the interdependence among decision factors to be considered. Therefore, a comparison analysis between DEMATEL and ANP is performed in the present paper in the attempt to highlight the main advantages and disadvantages of applying both methods within HRA. To this purpose, the analysis is performed in relation to the agri-food company involved in the prior work of the authors [20], where the generic tasks carried out by workers during the pistachio’s production process are considered to evaluate the dependence among PSFs of the SPARH method. As a result, the most central PSFs on which corrective measures are needed with priority to improve the overall human reliability are found.
The remainder of the paper is organized as follows. The literature review is presented in Section 2, while a short overview of the two MCDM methods is given in Section 3. The case study is presented and discussed in Section 4 and Section 5, respectively, whilst conclusions are given in Section 6.

2. Literature Review

HRA methods propose similar PSF taxonomies—even if differently named—to consider the contribution of personal, cognitive, and environmental factors to worker reliability when performing tasks. In this regard, the Technique for Human Error Rate Prediction (THERP) [1] takes into account a group of sixty-seven PSFs organized in external, internal, and stress factors. Their evaluation is aimed to compute an error factor, which allows to adjust the nominal HEP already provided by THERP for a listed set of human errors. The Human Error Assessment and Reduction Technique (HEART) [27] proposes a set of thirty-eight Error Producing Conditions (EPCs) (e.g., distraction, tiredness, and cramped conditions), whose qualitative evaluation is used to compute their effect on HEP. The Cognitive Reliability and Error Analysis Method (CREAM) [3] provides a list of nine Common Performance Conditions (CPCs), whose qualitative evaluation of their effect on human reliability (i.e., “improved”, “reduced”, or “not significant”) leads to a control mode (i.e., “Scrambled”, “Opportunistic”, “Tactical”, and “Strategic”) which corresponds to a specific HEP range. On the other hand, the Standardized Plant Analysis Risk-Human reliability analysis (SPARH) [4] is based on eight PSFs which are semi-quantitatively assessed to adjust the nominal HEP of a generic task.
Nevertheless, the traditional HRA methods disregard the interdependence among PSFs when computing the human reliability, although the empirical evidence demonstrates that overlapping and mutual influences may exist in some circumstances [10,15]. As a consequence, HEP may be over- or underestimated [12]. In the literature, little attention has been paid to the PSF interdependence issue so far, and only few qualitative guidelines or analytical methodologies have been provided to assess its effect on HEP. In this regard, CREAM simply mentions that CPCs may affect one another, but no guidelines about the way to quantify these interactions are provided. SPARH suggests a procedure to prevent analysts from the double counting of PSFs, based on the use of linguistic variables (i.e., zero, low, medium, high, and complete) to assign a qualitative correlation degree between PSFs. Groth [11] proposes a hybrid statistical method which combines correlation and factor analyses to determine PSF interrelationships. After analyzing the reports of eighty-two nuclear incidents, Boring [12] performs a correlation analysis to quantify the mutual relation degree among PSFs of SPARH. With relation to the Air Traffic Control (ATC) room operation field, De Ambroggi and Trucco [6] propose an ANP-based method, while Groth and Swiler [13] deal with the PSF interdependence issue by Bayesian Networks (BNs). After interviewing fifty-two workers of the railway staff, Kyriakidis et al. [28] combine ANP and Success Likelihood Index Methodology (SLIM) techniques on a customized PSF taxonomy. Based on a review performed on 224 events from 2002 to 2017 in Korean NPPs, Park et al. [10] suggest a statistical methodology combining correlation and factor analyses to quantify the mutual dependence between PSFs in NPPs control room operations. According to the opinion of 432 civil flight pilots, Wang et al. [18] implement statistical moderating and mediating effect analyses to determine the mutual dependence degree among PSFs which affect crew operations. Liu et al. [15] assess the interdependence between PSFs of SPARH through a system-dynamics-based approach, while La Fata et al. [16] combine HEART and SPARH methods to compute the HEP, taking into account PSFs correlations based on Boring’s results [12]. Finally, Adelfio et al. [20] implement DEMATEL in the agro-food sector to evaluate the mutual relation of PSFs of the SPARH method.

3. MCDM Methods

3.1. DEMATEL Method

Developed in 1973 [21] at the Geneva Research Centre of the Battelle Memorial Institute, DEMATEL is an MCDM method that addresses the assessment of both the influence degree among decision criteria and their relative importance. With Ci (with i = 1, …, n) being the ith criterion, the implementation of the method comprises the following steps:
(a)
Development of the direct-relation matrix Z, whose generic element zij represents the influence degree of Ci on Cj expressed by the decision maker based on the five-point linguistic scale of Table 1.
(b)
Development of the normalized direct-relation matrix X, whose generic element xij is calculated by Equation (1).
x i j = z i j max ( j = 1 n z i j )
(c)
Computation of the total-relation matrix T by Equation (2), where I stands for the identity matrix. The generic element tij of T synthetizes both the direct and indirect influence caused by the criterion Ci on Cj.
T = X ( I X ) 1
(d)
Computation of vectors (D + R) and (DR), whose Di and Rj values arise from Equations (3) and (4), respectively.
D i = j = 1 n t i j         i = 1 , 2 , , n
R j = i = 1 n t i j         j = 1 , 2 , , n
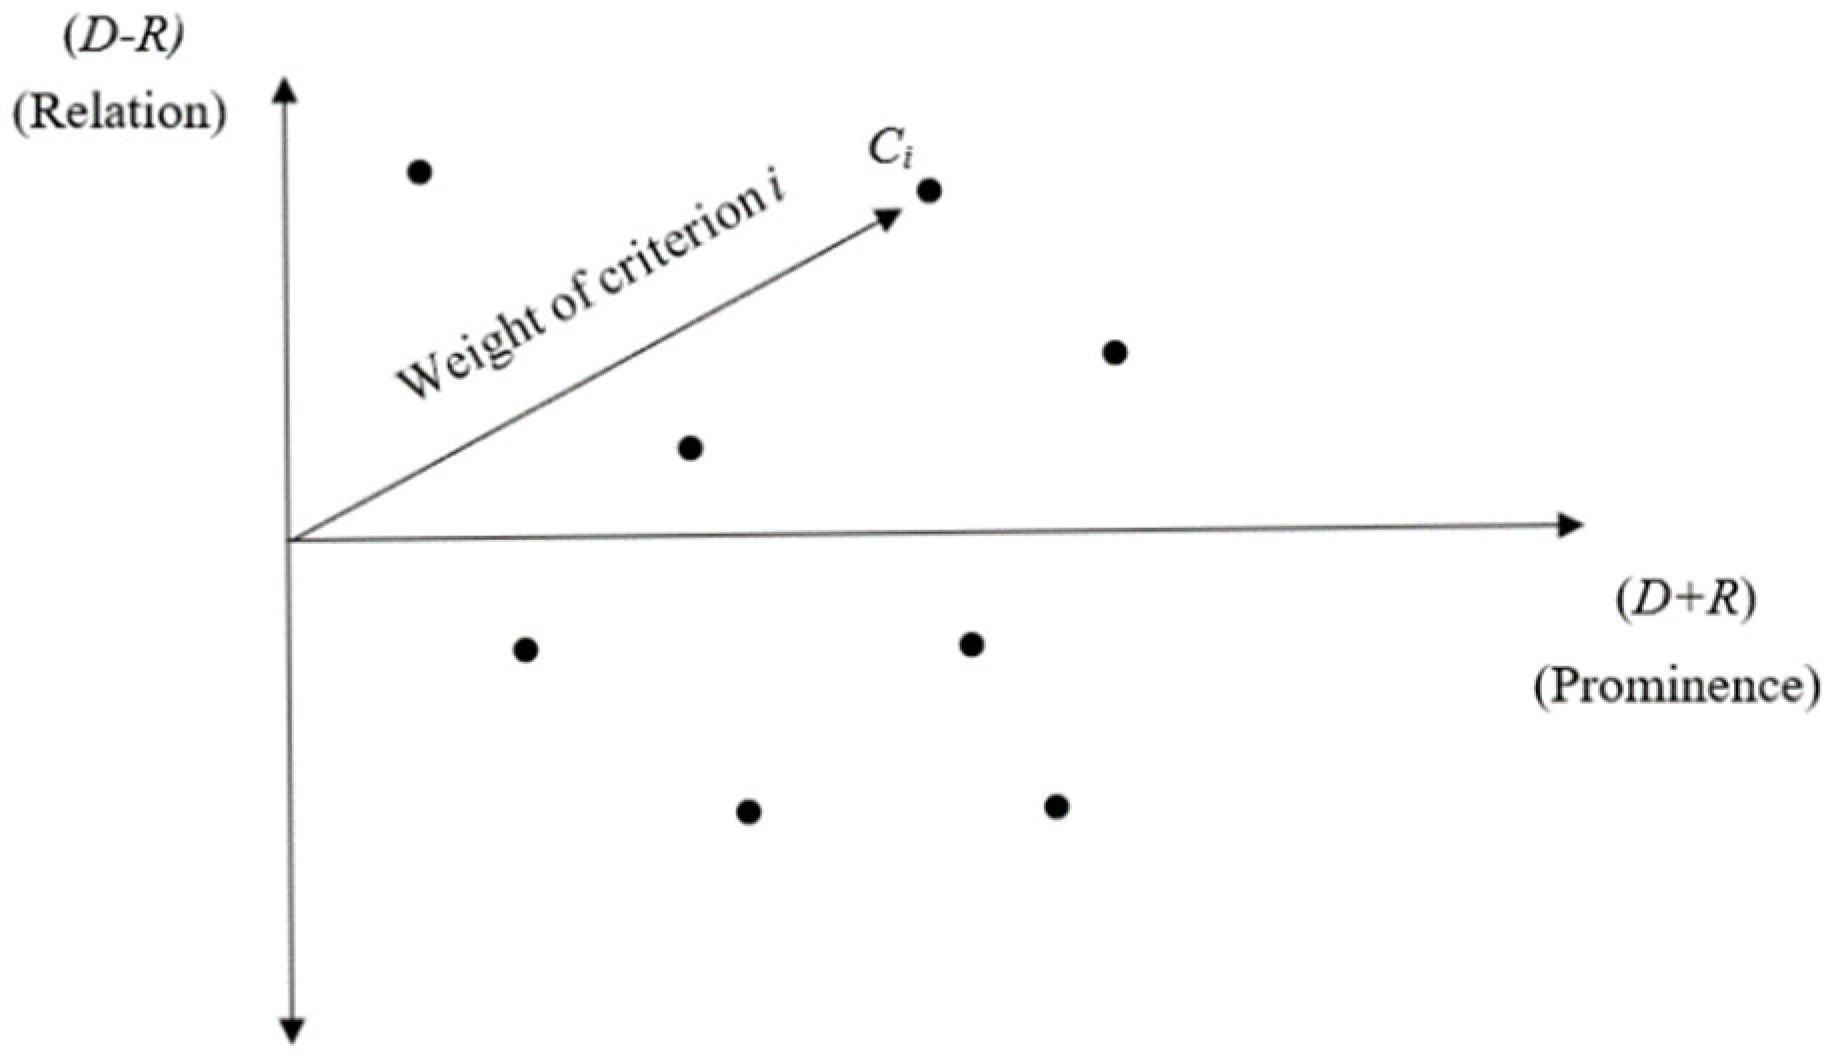
(D + R) and (DR) vectors are named “prominence” and “relation”, respectively. The first one provides information about the relation degree of a criterion against the others, while the second one offers information about the type of relationship among the criteria. Namely, criteria having positive relation values mainly cause influence on the others and are named “net causer in the system”. Instead, criteria with negative relation values mainly receive influence by the others, so belong to the “net receiver in the system” group. (D + R) and (DR) are usually represented by a causal diagram (Figure 1), which allows the predominant directions of influence to be easily visualized [29].
(e)
Computation of the weight wi and normalized weight qi of every criterion i by Equations (5) and (6), respectively.
w i = ( D i + R i ) 2 + ( D i R i ) 2               i = 1 , 2 , , n
q i = w i i = 1 n w i               i = 1 , 2 , , n
For every criterion i, wi may be represented by a vector in the causal diagram of Figure 1.

3.2. ANP Method

ANP is an MCDM method proposed by Saaty [26,30] to deal with the dependence among criteria and/or alternatives. ANP represents the evolution of the Analytic Hierarchy Process (AHP) method [31], which models the decision problem by a hierarchical structure where only the lower-level elements depend on the higher-level ones, and no dependence among elements of the same level may exist [32]. On the other hand, ANP organizes the decision problem as a network structure where similar elements are grouped into clusters, and every element may affect the others of any level (i.e., connections may exist among criteria, sub-criteria, and alternatives) [33]. The implementation of ANP involves the following steps [34]:
(a)
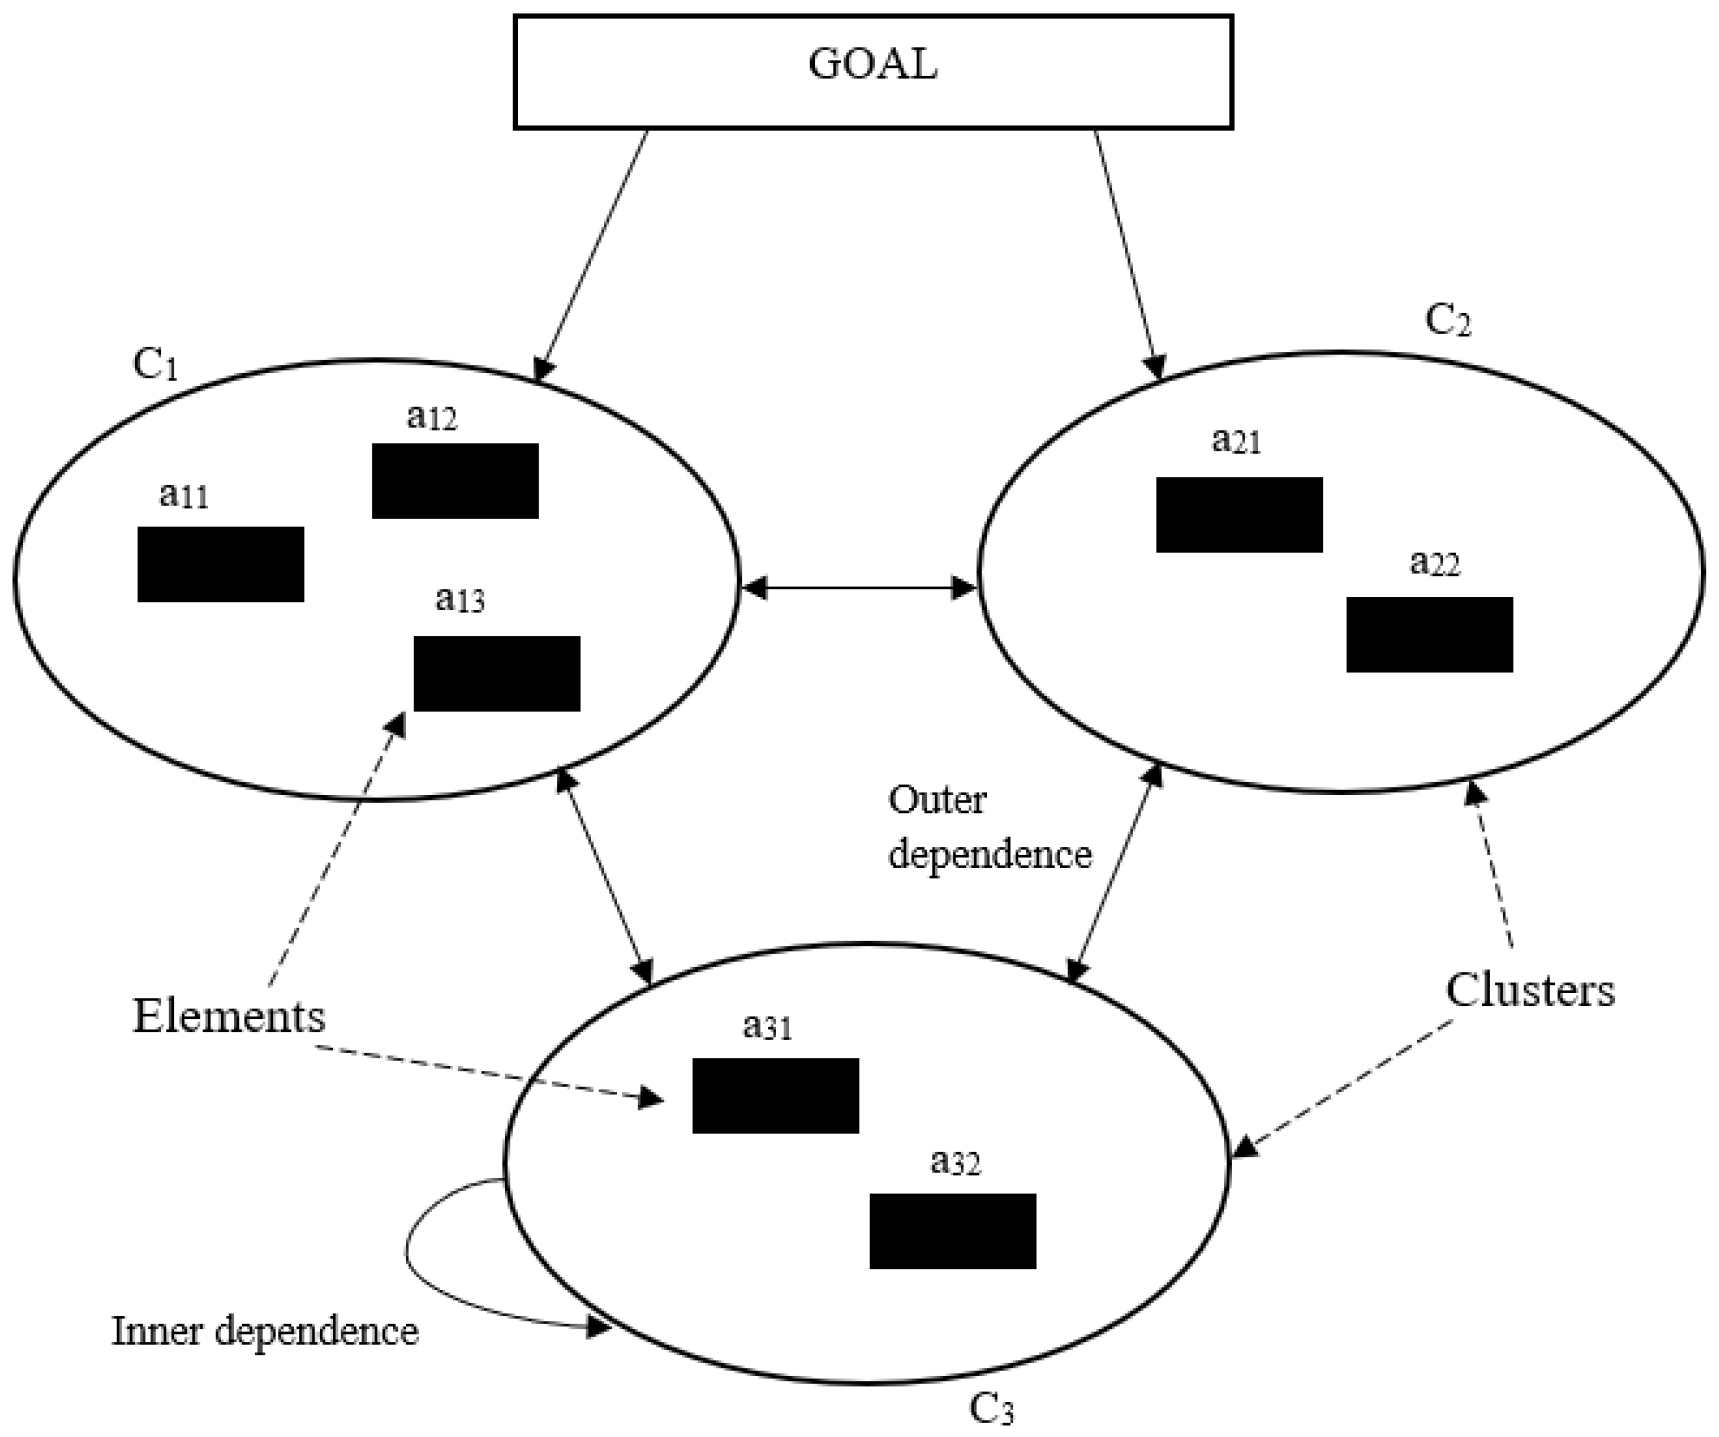
Decomposition of the decision problem into its elements (i.e., goal, criteria, sub-criteria, and alternatives) and organization of decision elements aij|j = 1, 2, …, m by a network structure, grouping the similar ones into clusters Ci|i = 1, 2, …, n. Figure 2 shows an example of network structure with three clusters (i.e., n = 3). All interactions and feedbacks within the clusters are called inner dependencies, whereas the ones between the clusters are called outer dependencies [26].
(b)
Development of pairwise comparison matrices and computation of relative importance (i.e., weights). Decision makers express pairwise comparison judgments between network elements, answering the question “How much is the element aij of the cluster Ci more dominant than the element aiz of the same cluster in influencing a third element of the network?”. Elicited judgements (i.e., sijz) are based on the nine-point linguistic scale suggested by Saaty (Table 2).
Referring to the network structure of Figure 2, the pairwise comparison matrix between the elements of the cluster C1 in respect to the element a21 of the cluster C2 is reported in Table 3. For instance, the element s112 of Table 3 is elicited from the decision maker, asking the question “How much is the element a11 of C1 more dominant than the element a12 of the same cluster in influencing the third element a21 of C2?”.
Once all pairwise comparison matrices have been developed, the subsequent weights are computed by the eigenvector method [26].
(c)
Consistency check. Similar to AHP, the inconsistency degree of every pairwise comparison matrix needs to be verified by the computation of the Consistency Ratio (CR) (Equation (7)). In (7), CI is the Consistency Index (Equation (8)), and RI is the Random Index, whereas in (8) λmax and n are the maximum eigenvalue and the matrix size, respectively. As suggested by Saaty [26], the consistency ratio must not exceed 0.1 [16].
C R = C I R I
C I = λ max n n 1
(d)
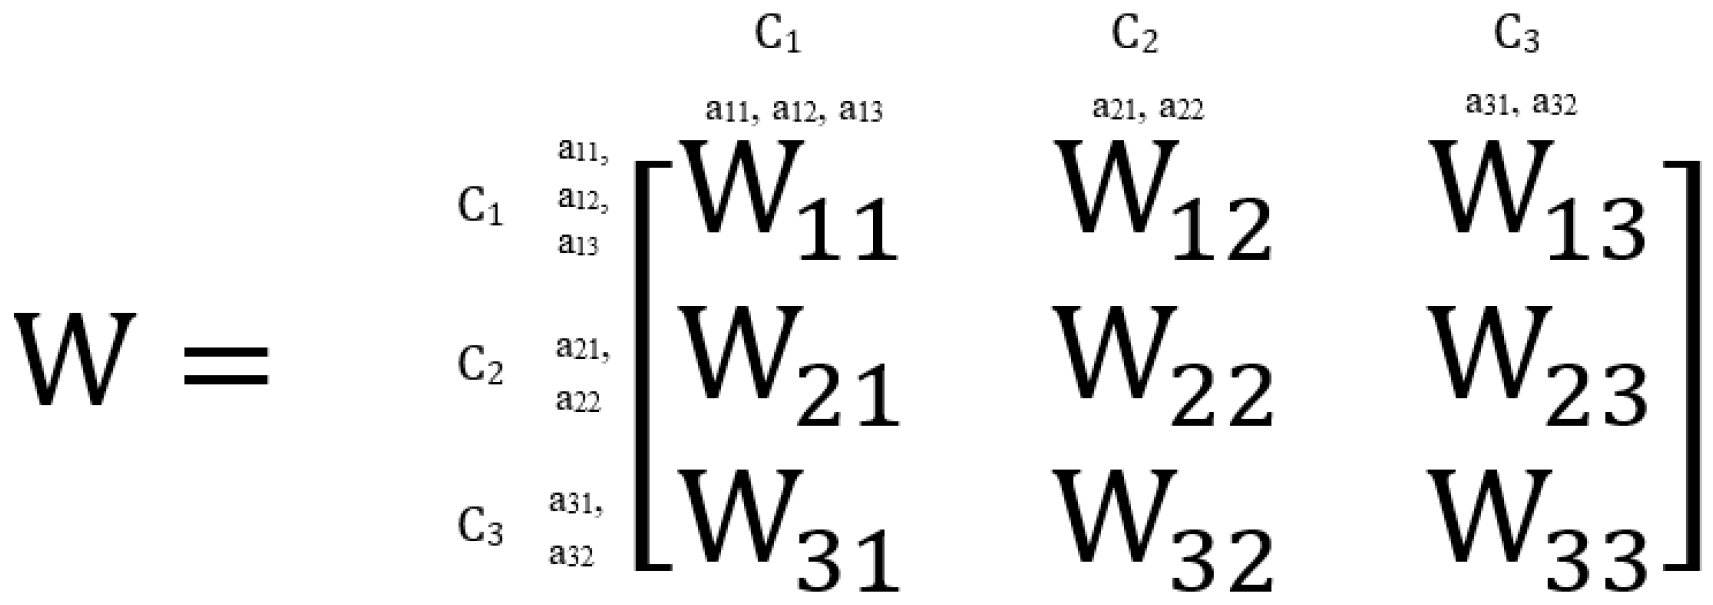
Development of the unweighted and weighted super matrices. The eigenvector of every pairwise comparison matrix obtained in step (b) is used to develop the unweighted super matrix (Figure 3), where Wij is the generic eigenvector.
Afterwards, the weighted super matrix is computed, performing the pairwise comparisons between clusters. With relation to Figure 2, the corresponding weighted super matrix is the one of Figure 4, where every element’s wif is the relative importance of the clusters. For example, the vector {w1,1; w2,1; w3,1} in Figure 4 is the eigenvector of the relative importance of the three clusters in respect to the cluster C1. Similar to the previous step, it arises from the pairwise comparison judgments obtained by asking the question “How much is the cluster Ci|i = 1, 2, 3 more dominant than the cluster Cf|f = 1, 2, 3 in influencing the cluster C1?”. The other pairwise comparison values are obtained accordingly.
(e)
Computation of the super limit matrix, obtained by raising the weighted super matrix to increasing powers until all values are stable (i.e., values in every row are equal) [35]. The column or row values represent the final weights vector of relative importance of every element.

4. Case Study: Input Data and Results

Referring to an agri-food company operating in Southern Italy, DEMATEL and ANP are used in the present paper to assess the interdependence degree among PSFs influencing the workers’ reliability. In the MCDM perspective, PSFs are hence considered as dependent criteria whose mutual influences have to be properly identified and computed. In this regard, the SPARH list of PSFs [4,7,8,16] is here taken into account (Table 4).
The company involved in the study deals with the pistachio production chain, including cultivation, harvesting, and product processing. The assessment of the PSFs interdependence is carried out on activities performed at the production plant, owing to their criticality as stated by the company’s owner. The production process is completely automated, and activities performed by workers mainly concern quality checks and the setting of process parameters. In detail, the production process tasks are described in the following.
(a)
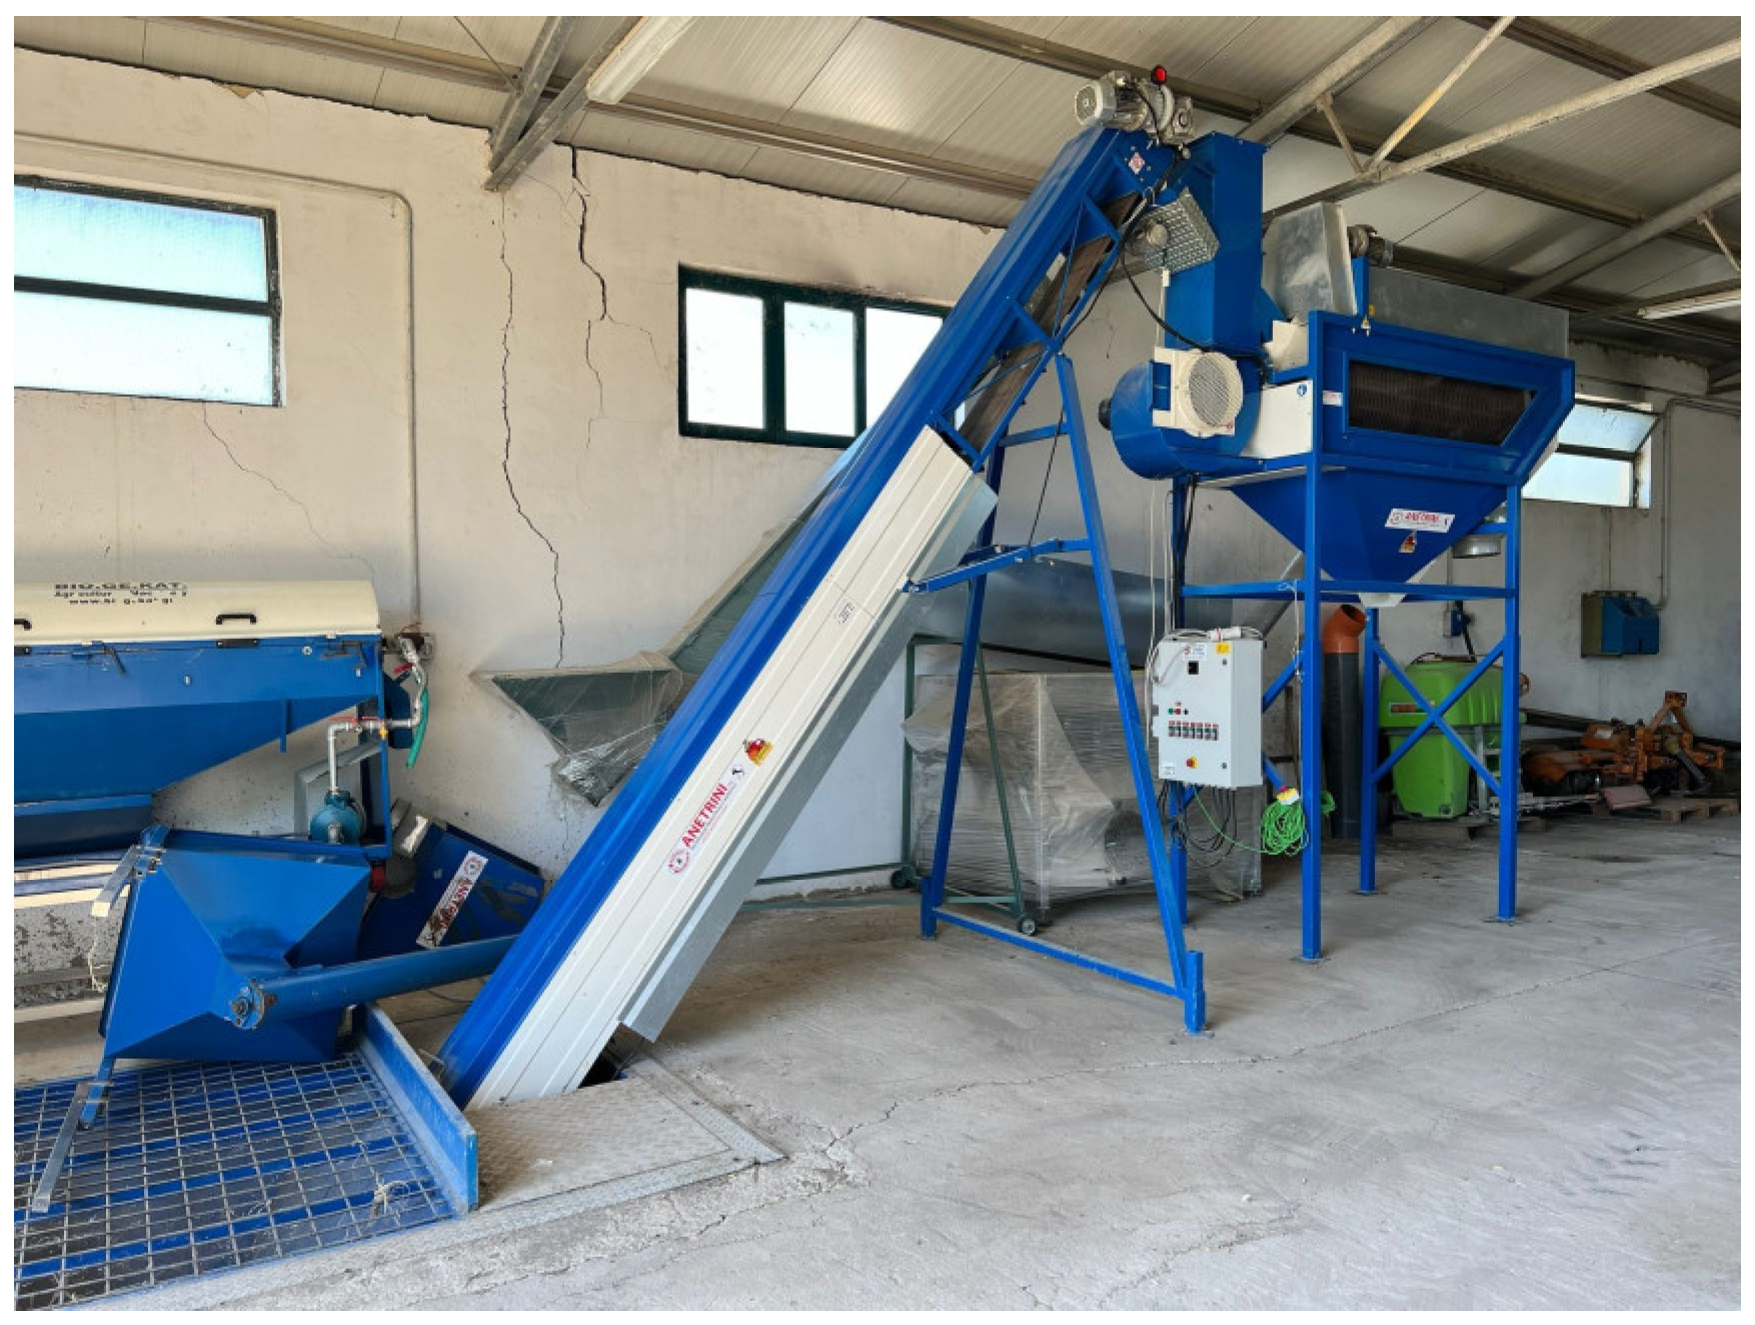
Waste separation: pistachios are loaded onto a hopper (Figure 5) and sent to a gravity separator machine and to a rotary drum sorter through a cochlea, in order to remove harvesting wastes (e.g., leaves and stones). In this phase, two operators supervise the pistachio flow, avoiding blockage and modifying the process parameters if required (i.e., rotation speed of the cochlea and flow rate of the air jet of the gravity separator machine).
(b)
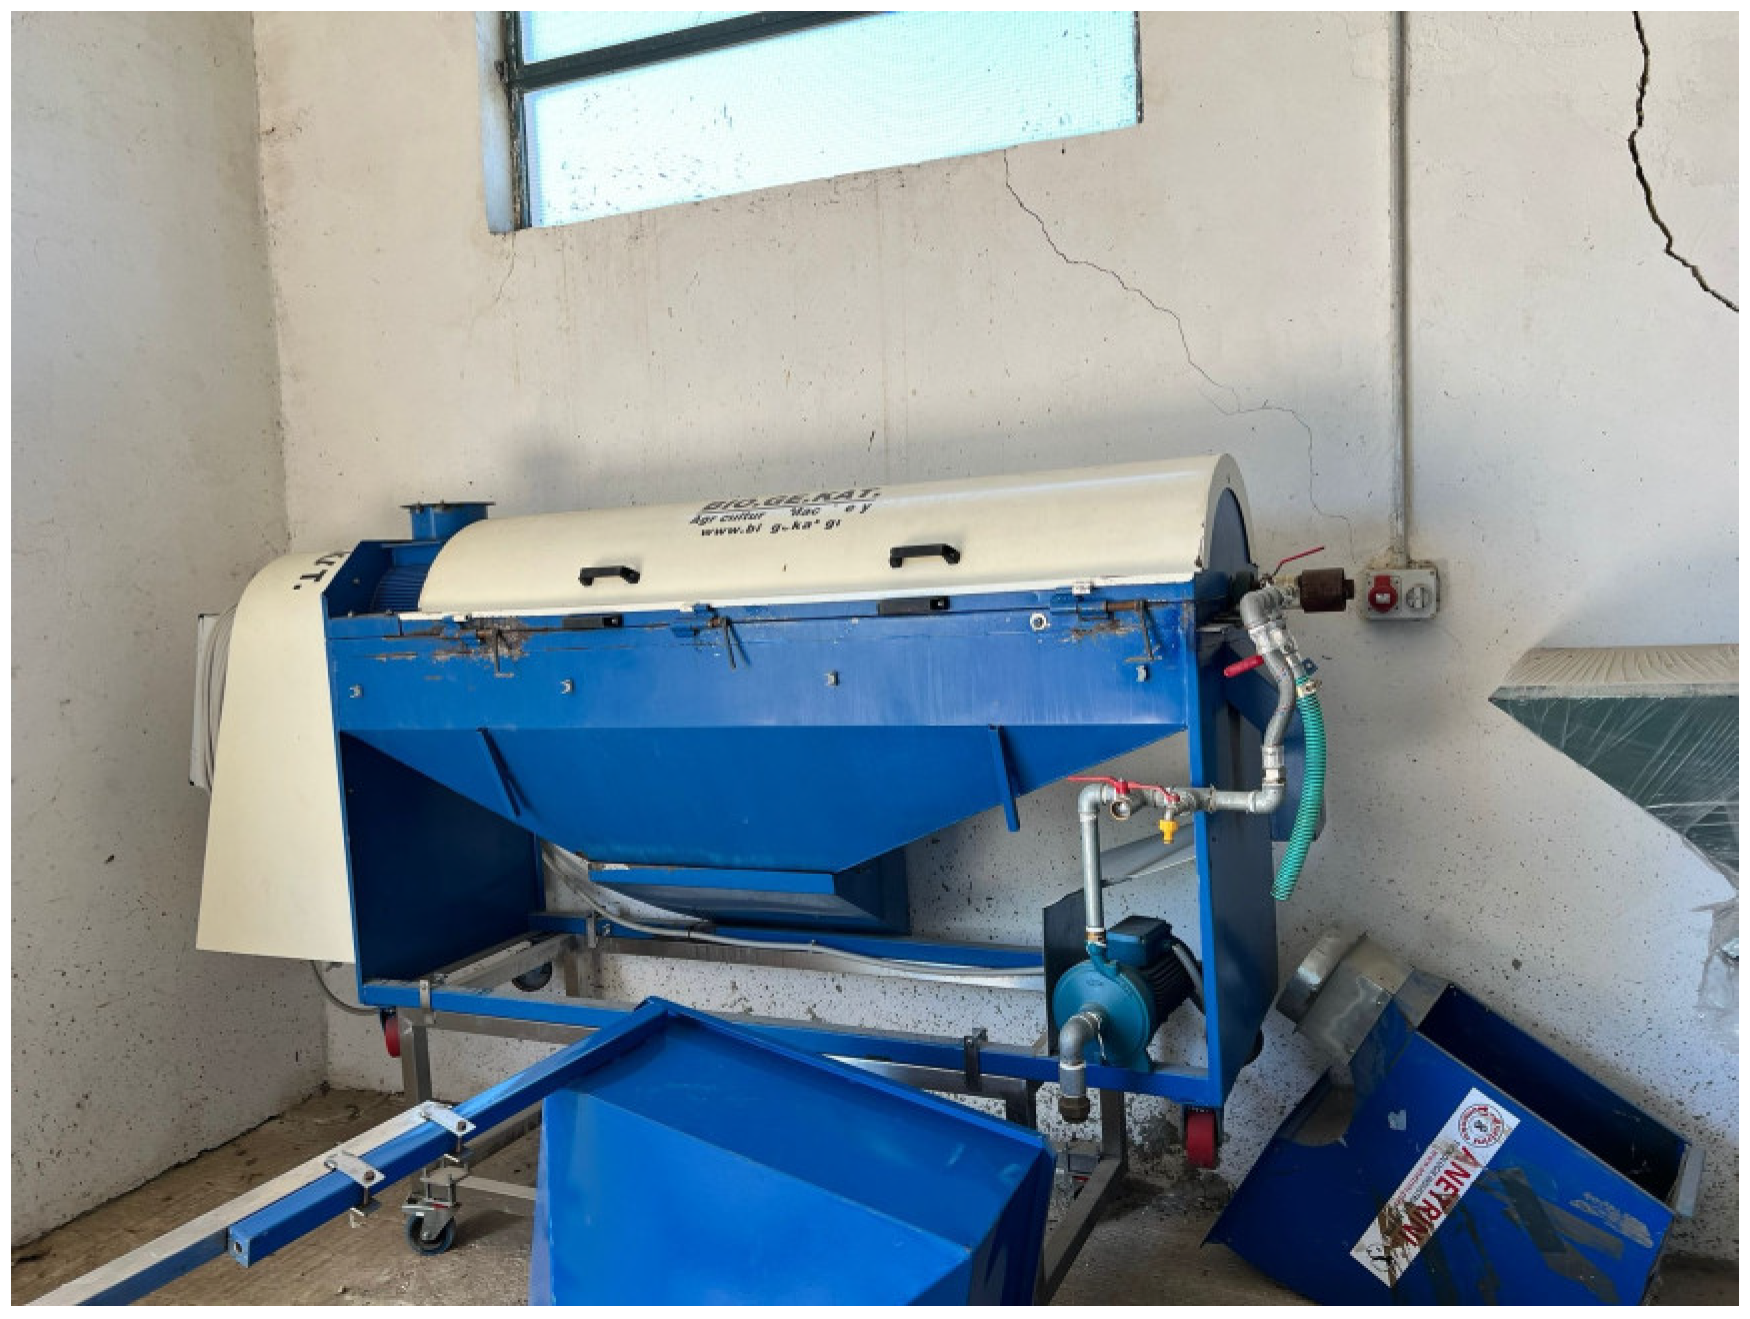
Husking process: pistachios are cleaned and separated from the husk through a hulling machine (Figure 6). In this phase, the operators have to set the rotation speed of the hulling machine and the flow rate of the cleaning water, which allows them to take away the husk from the pistachios.
(c)
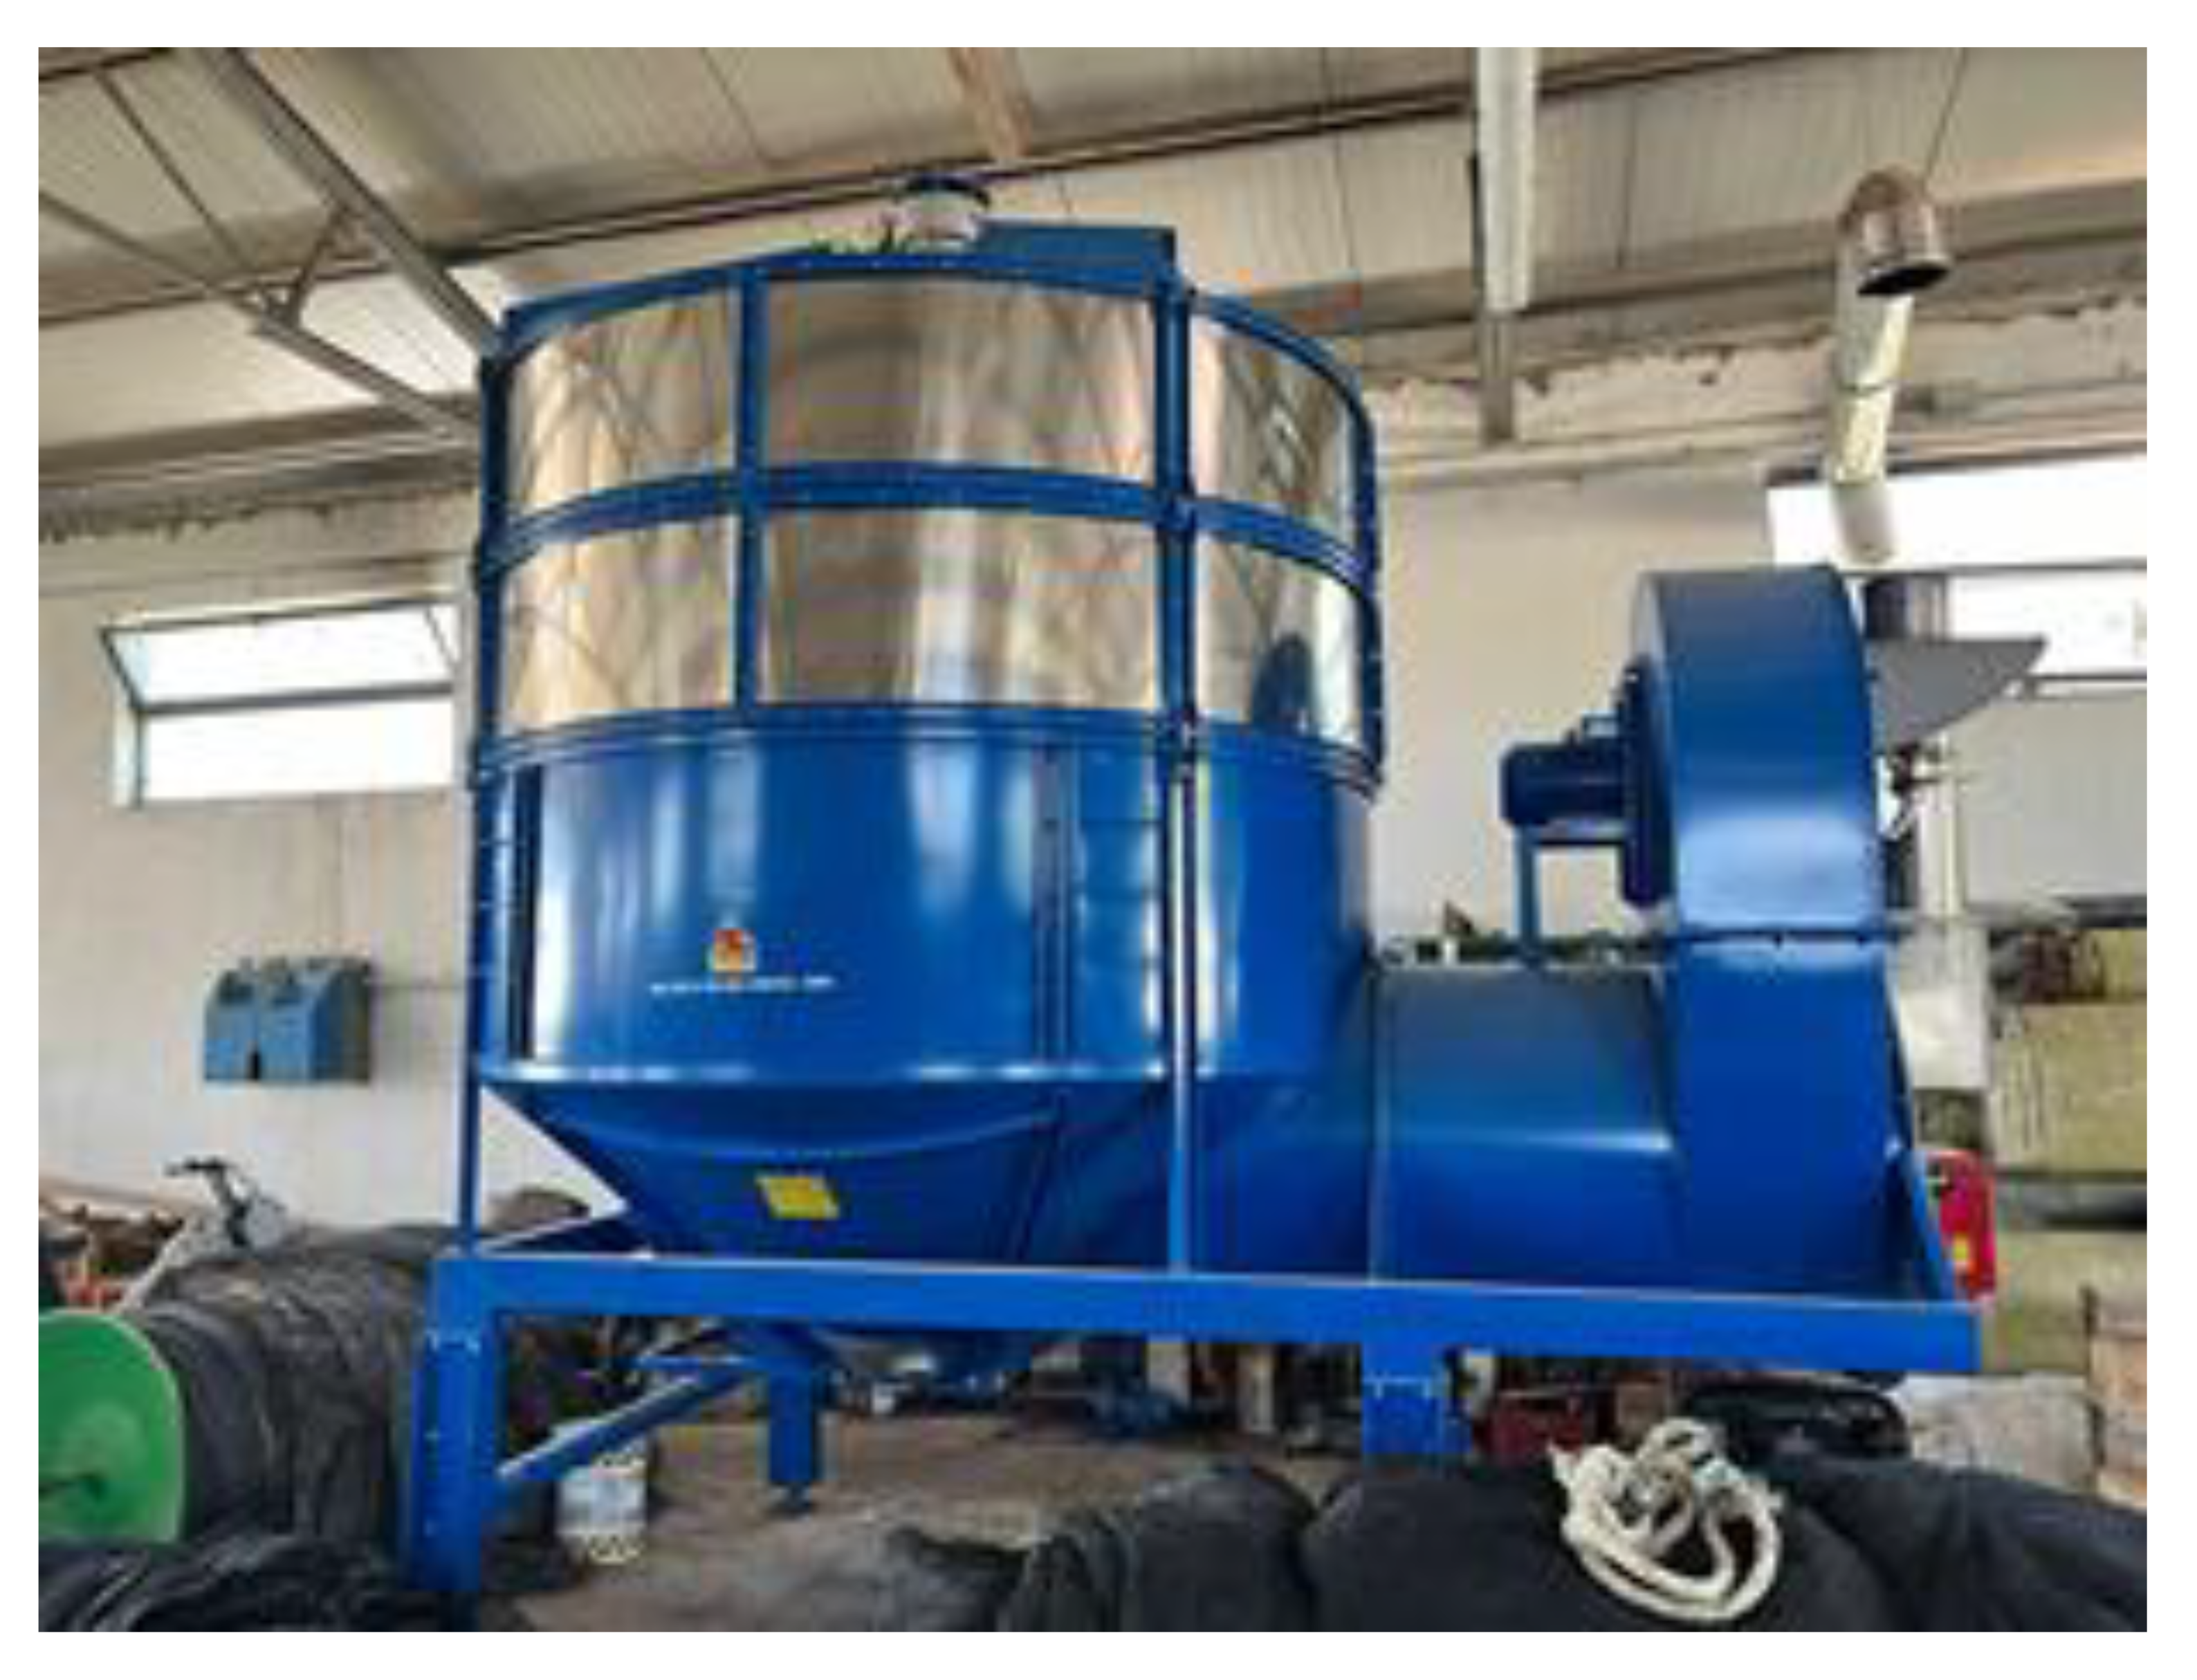
Drying process: pistachios are finally sent to a dryer (Figure 7) powered by a diesel burner, where the moisture content of the products is reduced up to 4–6 wt% through streams of heated air. The main parameters to be set are the drying time, the temperature of the hot air, and the product temperature, which must not exceed 45 °C.
With relation to the PSFs dependence, input data required by the two MCDM methods were elicited from the company’s owner (i.e., decision maker), owing to his/her expertise in the field under investigation. Regarding DEMATEL, the decision maker was asked to answer the question “How much does the PSFi affect the PSFj?”. Based on the five-point linguistic scale of Table 1, the pairwise comparison matrix (i.e., direct-relation matrix Z) of Table 5 is obtained.
Once the normalized-relation matrix is computed according to Equation (1), the total-relation matrix T (Table 6) is obtained by Equation (2), where every element tij represents both the direct and indirect influence of the PSFi on the PSFj.
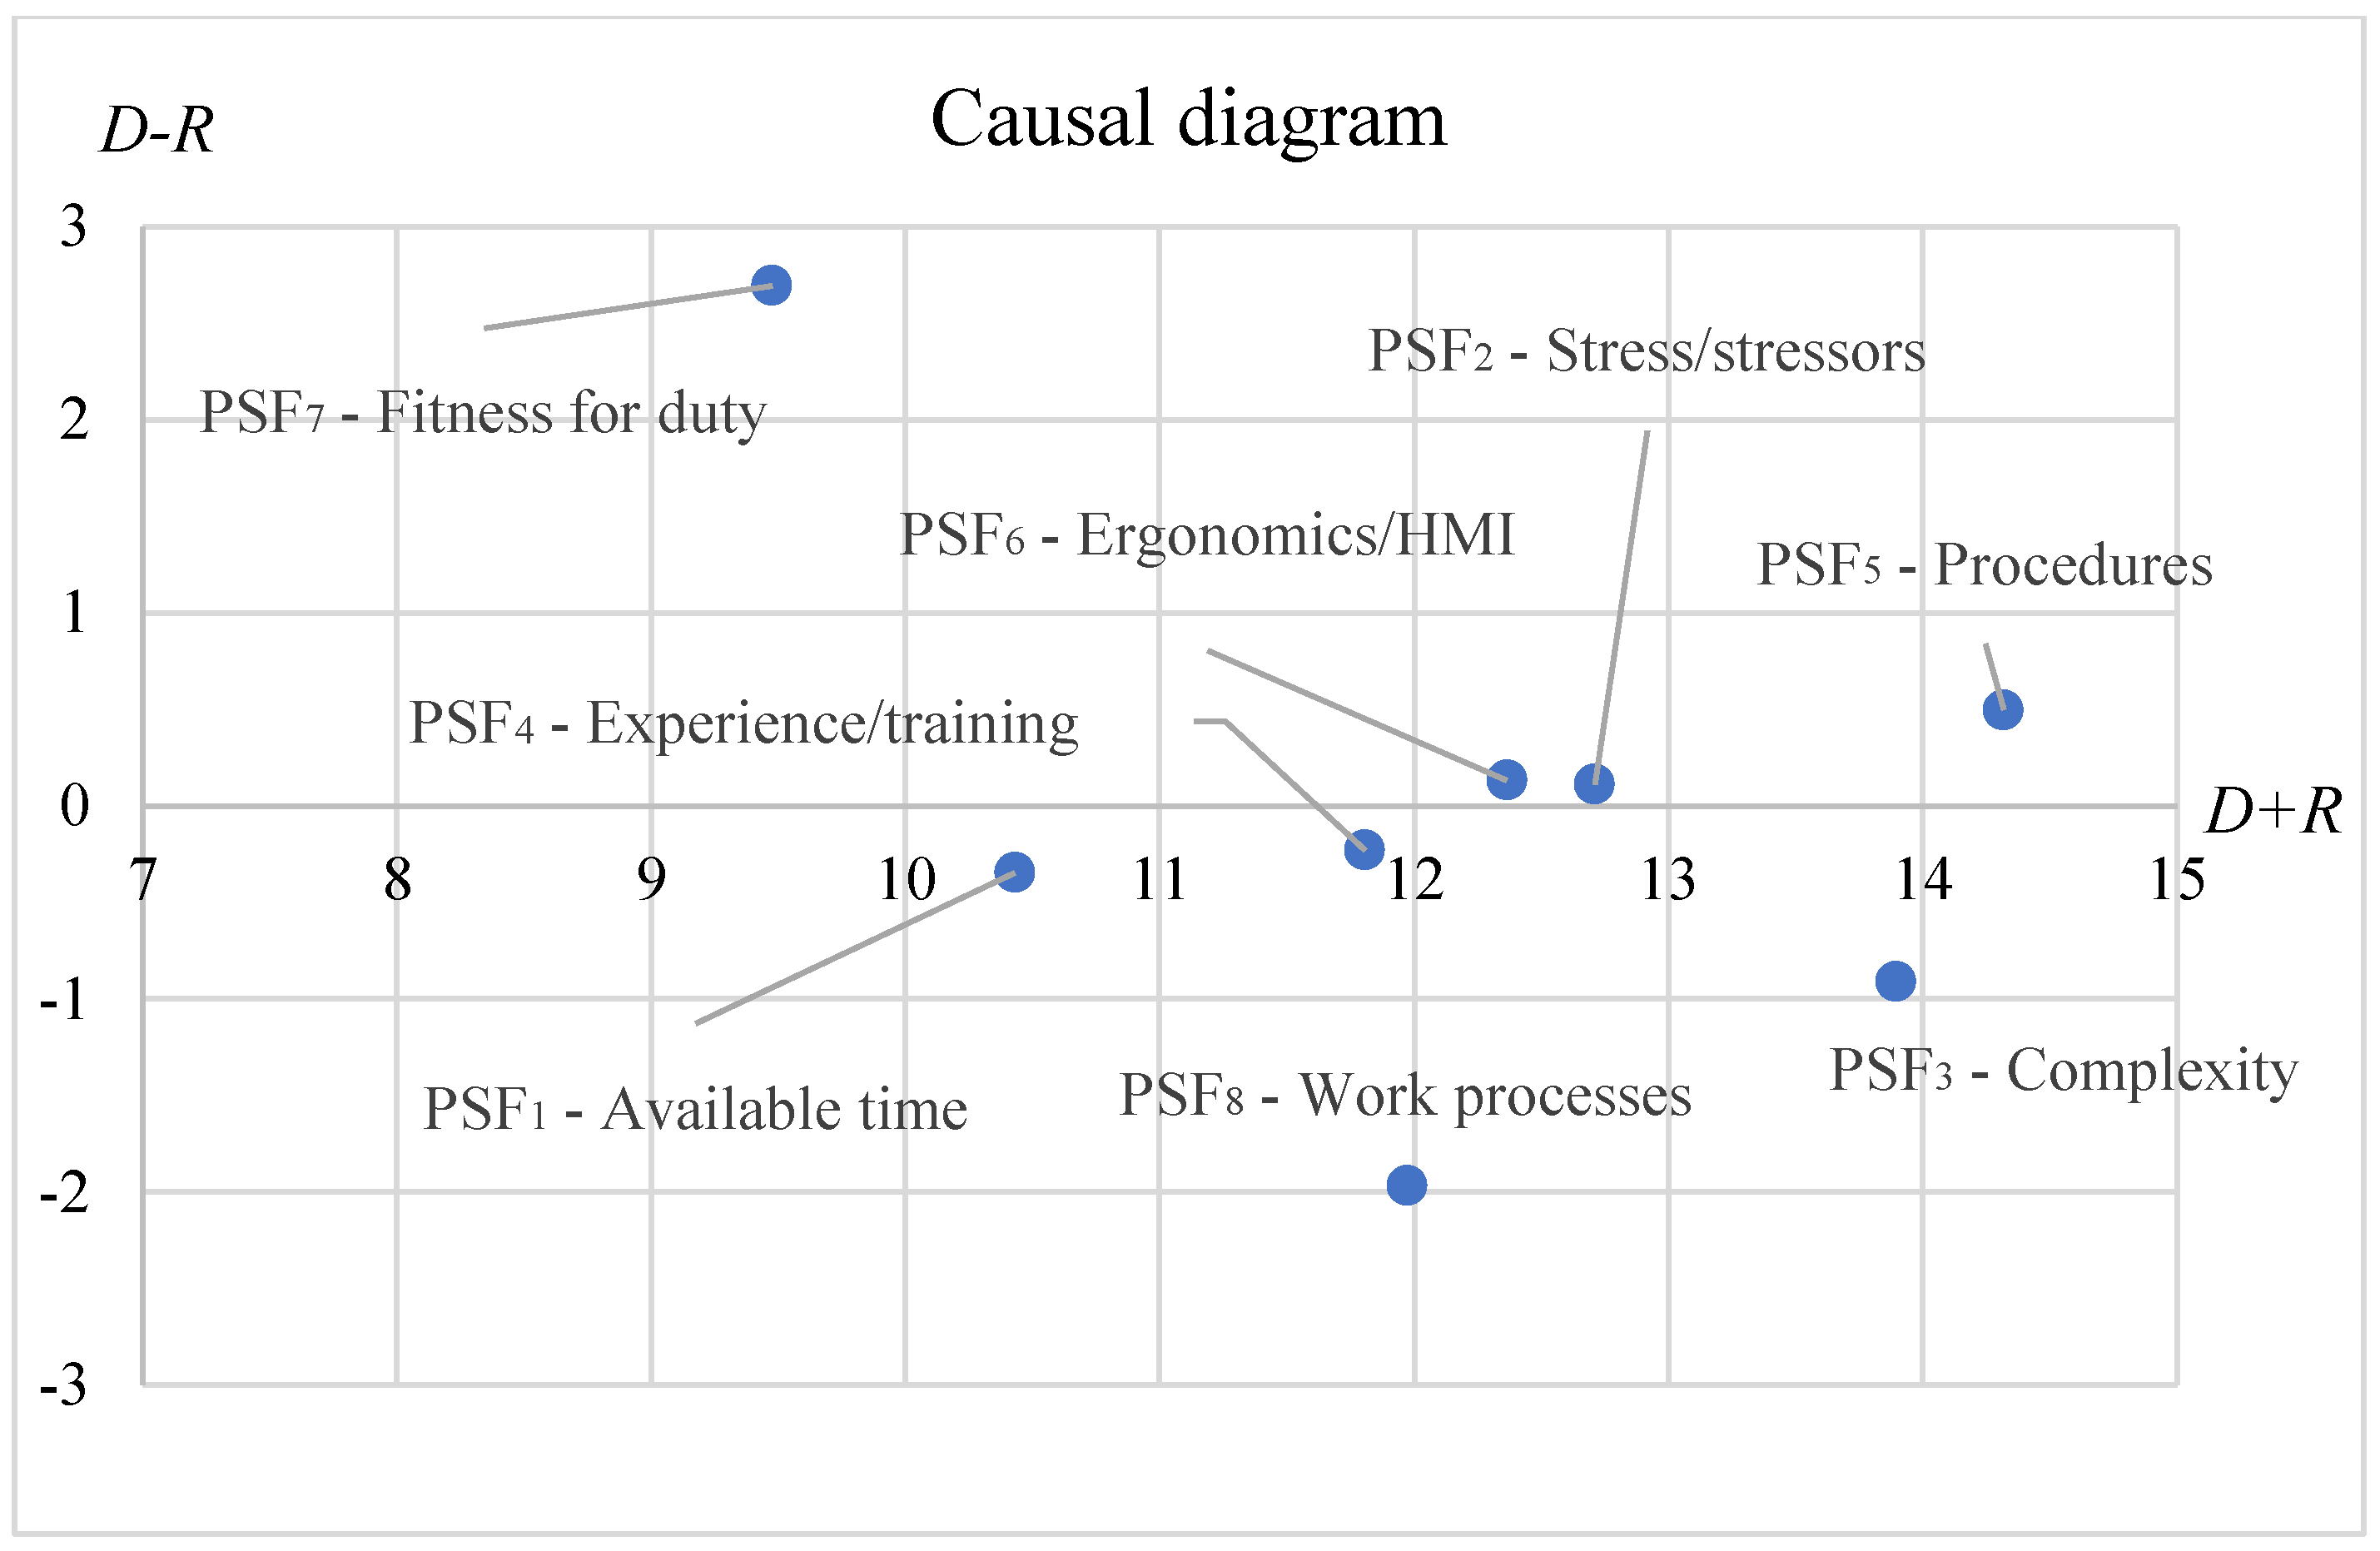
The resulting values of prominence (D + R), relation (DR), weights, and normalized weights are computed by Equations (3)–(6) and summarized in Table 7, while the causal diagram is reported in Figure 8.
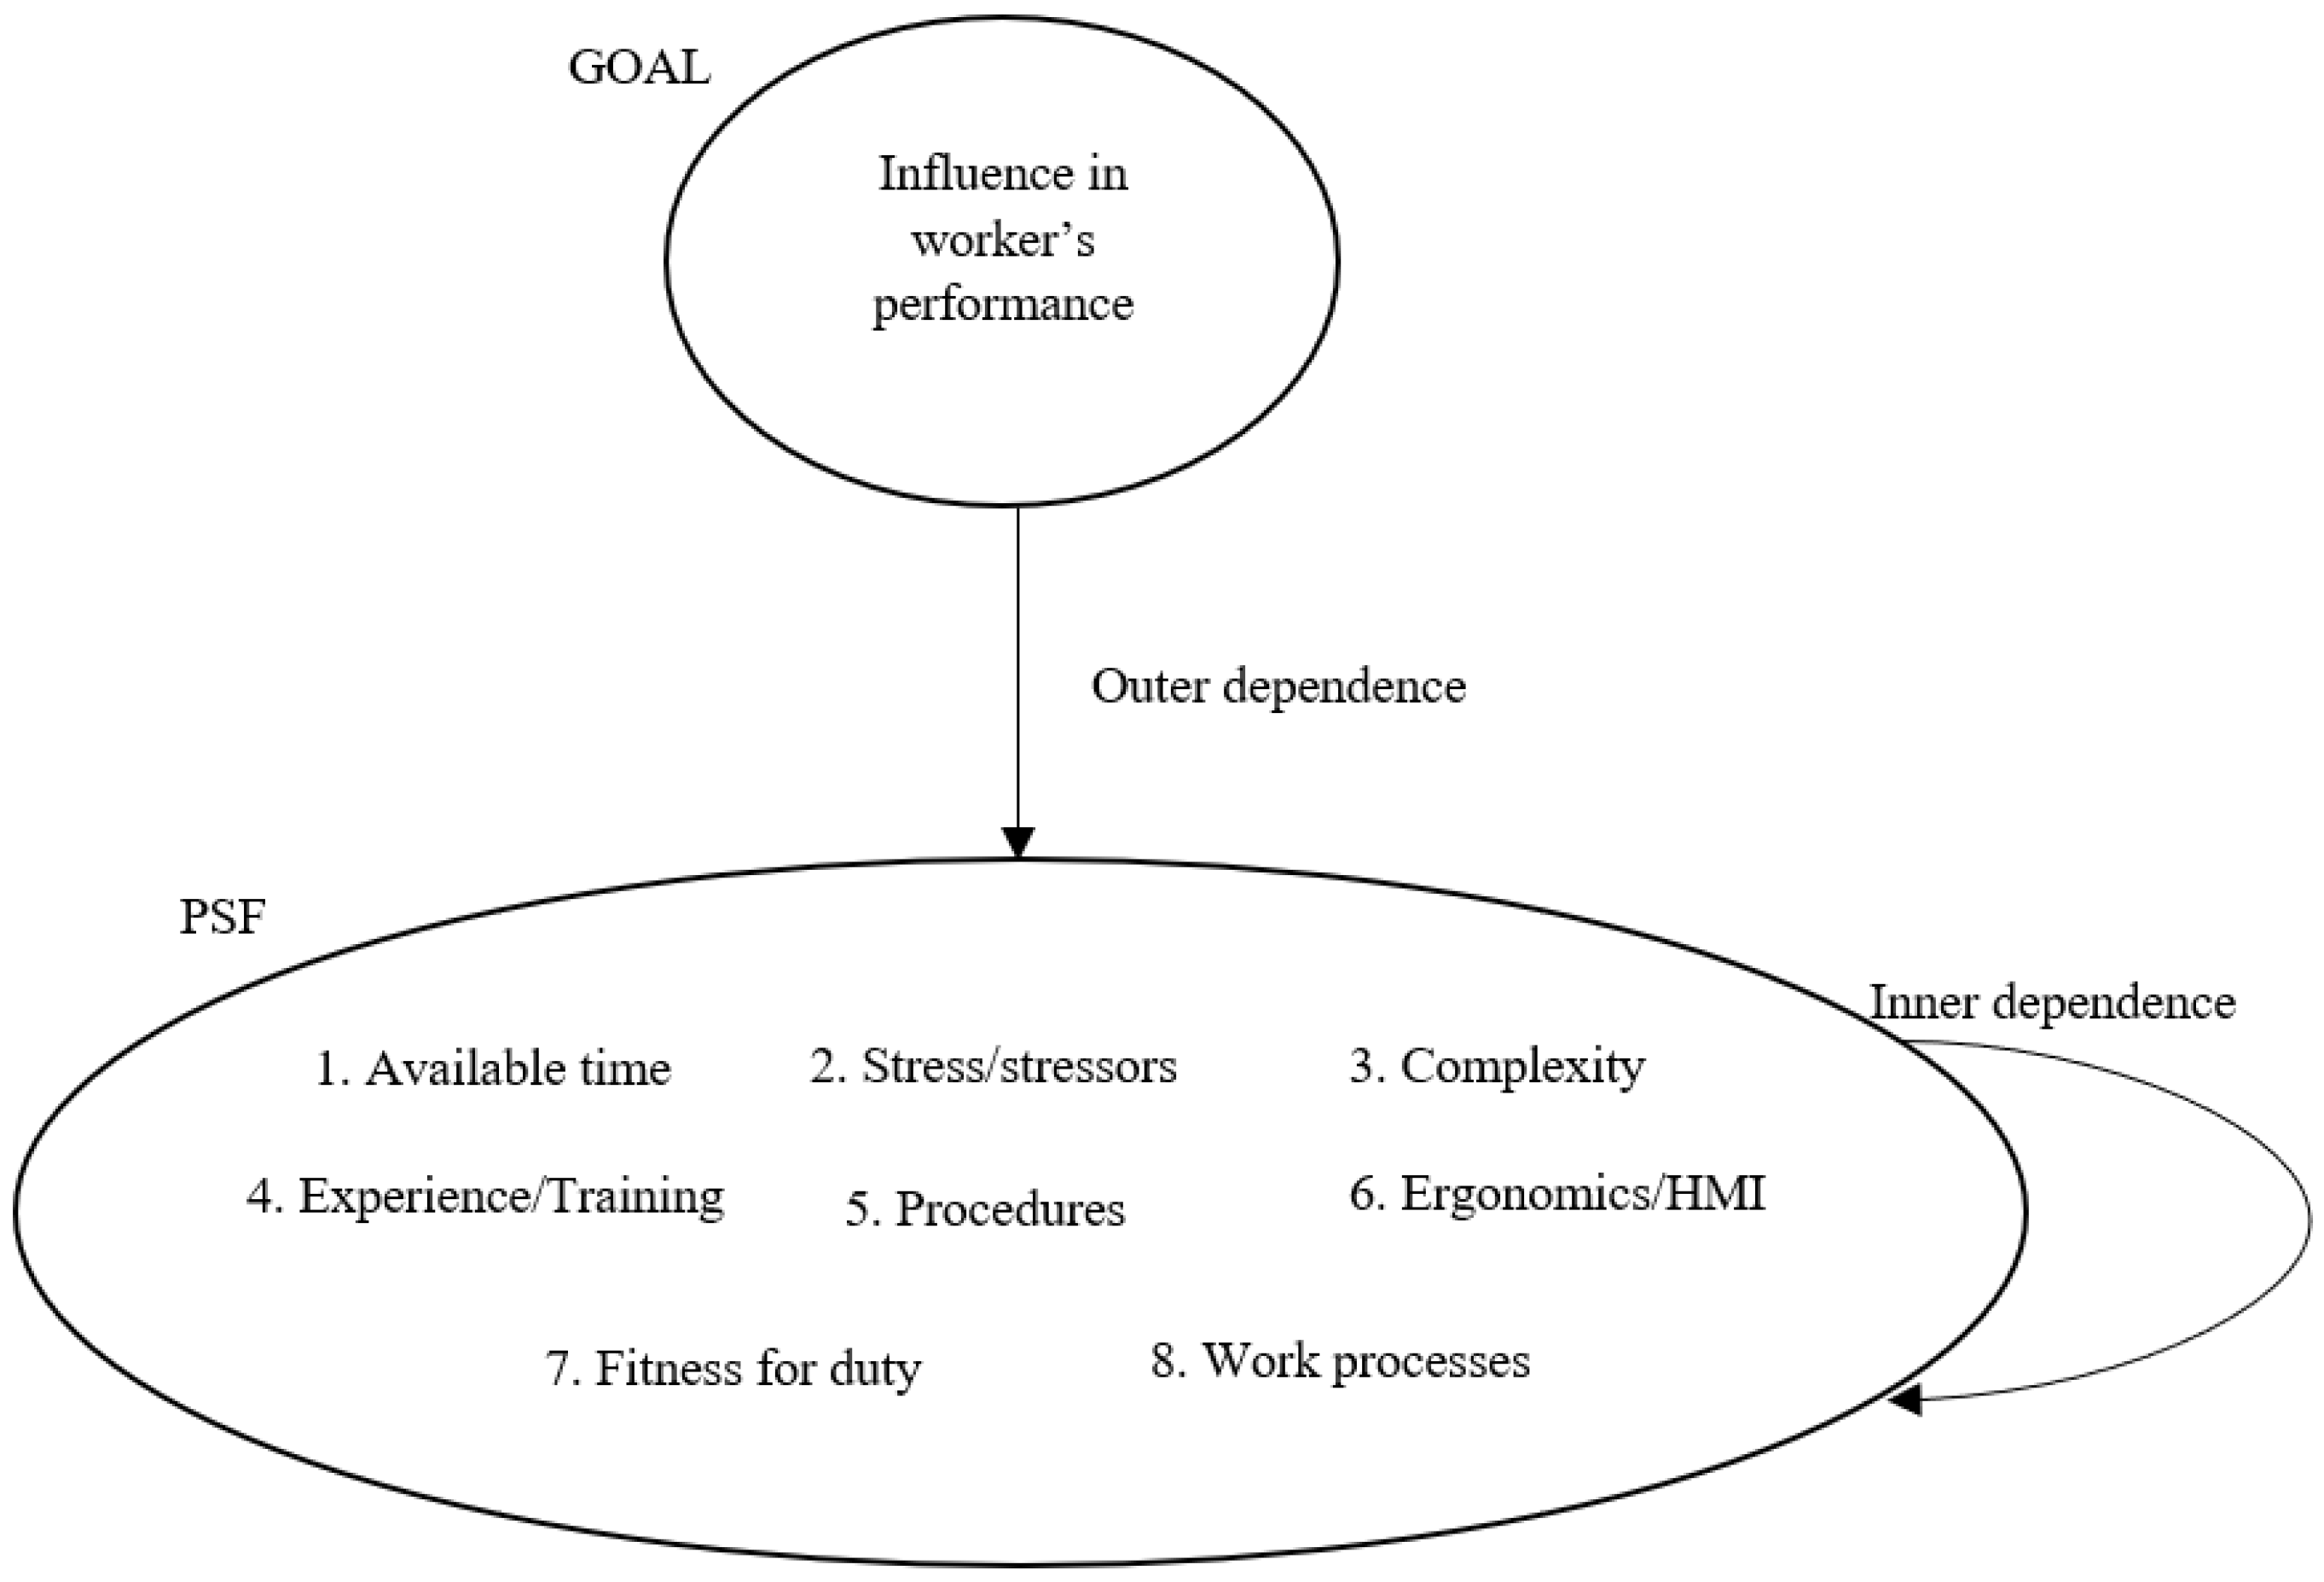
Regarding the implementation of ANP, the decision problem network was firstly developed (Figure 9), and all PSFs were grouped into a single cluster. Afterwards, the SuperDecisions software (https://www.superdecisions.com/, accessed on 25 October 2022) was used to evaluate the relative importance of PSFs. To this aim, the decision maker was asked to provide pairwise comparison judgements, answering the question “How much is the PSFi more dominant than the PSFj in influencing the PSFk?”. Table 8 shows one of the pairwise comparison matrices as example.
Once pairwise comparisons were uploaded in the SuperDecisions software, the inconsistency degree of pairwise comparison matrices were computed. Since some pairwise comparison matrices obtained a degree of inconsistency higher than 0.1, the decision maker was asked to reformulate some of his/her judgements in order to obtain all matrices with an inconsistency degree lower than 0.1. Afterwards, the software returned the super limit matrix, providing the relative priority values (i.e., weights) of PSFs (Table 9).
Table 10 synthetizes PSF weights obtained by ANP and DEMATEL, whereas rankings are shown in Table 11.

5. Discussion

Based on the causal diagram of Figure 8 related to the implementation of DEMATEL, “Fitness for duty” (i.e., PSF7) and “Procedures” (i.e., PSF5) belong to the “net causer in the system” group, with a clear positive relation value. Instead, “Complexity” (i.e., PSF3) and “Work processes” (i.e., PSF8) belong to the “net receiver in the system” group, as they have a negative relation value. The other factors are close to the x-axis, namely they tend to cause and receive influence equally. As stated in Section 3.1, particular attention should be paid to net causer factors, because taking corrective actions on them indirectly improves the PFSs on which they exert their influence. Among the net causers, “Procedures” represents the most influencing one, with the highest prominence value (i.e., 14.317) and a positive relation value equal to 0.499. As a result, the company’s owner should primarily implement corrective actions on “Procedures” to increase worker reliability, simultaneously improving the other factors. Despite having the highest relation value (i.e., 2.696), “Fitness for duty” has the lowest prominence (i.e., 9.473), so it may be neglected by the company’s owner when deciding corrective measures to be implemented with priority. In addition, the total-relation matrix (Table 6) shows that “Stress/stressors” (PSF2) and “Ergonomics/HMI” (PSF6) have a high influence on “Complexity” (PSF3), “Procedures” (PSF5), and “Work processes” (PSF8). Hence, the company’s owner should limit workplace stress/stressors and assure a more comfortable interaction with equipment to improve PSF3, PSF5, and PSF8. Among the net receiver factors, “Complexity” (PSF3) has a high prominence value (i.e., 13.894) and a relation value equal to (-0.908). Based on Table 6, “Complexity” is strongly influenced by “Procedures” (PSF5), “Stress/stressors” (PSF2), “Fitness for duty” (PSF7), and “Ergonomics/HMI” (PSF6). As concerns “Work processes” (PSF8), it receives a very high influence from all the other factors except for PSF1. Regarding PSF1 and PSF4, they are characterized by low prominence values and receive a very strong influence from “Procedures” (i.e., PSF5) (Table 6).
The ANP results show that “Procedures” (i.e., PSF5) takes the first position, followed by “Complexity” (i.e., PSF3) and “Stress/Stressor” (i.e., PSF2). The weight obtained by “Procedures” is justified by the high automation level of the production line. On the other hand, “Fitness for duty” (i.e., PSF7) and “Available time” (i.e., PSF1) take the last two positions, owing to the absence of tight time constraints when performing tasks, as well as quality checks and parameter setting not requiring any physical workers’ fitness.
Both rankings (Table 11) are discussed with the company’s owner, who agrees with the first four positions, equal for both methods. In particular, “Procedures” and “Complexity” (i.e., PSF5 and PSF3, respectively) are placed in the first two positions in both cases, representing the most influencing factors on the worker performance. As confirmed by the company’s owner, the first and fourth positions, of “Procedures” and “Ergonomics/HMI”, respectively, are justified by the high automation level of the production line, which requires clear operating procedures and a comfortable interaction with equipment. As concerns “Complexity”, its importance depends on the high experience and training required to perform the quality check of products and to set the technological parameters of the process. Finally, the position of “Stress/stressors” (PSF2) is strictly related to the uncomfortable environmental conditions of the workplace, characterized by a high level of noise. As concerns the remaining four PSFs, the decision maker is not able to choose between the two rankings, owing to the meaninglessness of PSFs which take these positions. In particular, “Fitness for duty” (PSF7) and “Available time” (PSF1) are almost negligible factors because the activities performed by workers (i.e., quality check and parameters setting) do not require any particular physical workers’ fitness or tight time constraints.
Comparing the two MCDM methods, the different qualitative scales used to express the pairwise comparisons provide a different width of the weights range of PSFs, even if two similar rankings are obtained, owing to the reliability of the decision maker judgments. As concerns the input data, DEMATEL requires only one pairwise comparison matrix, while ANP needs a higher number of pairwise comparison matrices. Therefore, DEMATEL allows for saving time and labor in data collection. As regards the computational complexity, DEMATEL is certainly simpler to understand—also by nonpractitioners—and easier to implement than ANP. In fact, the ANP procedure becomes prohibitive as the number of the network elements increases. This is the reason why ANP needs the support of a proper software to avoid even more decision-maker efforts to understand the method [36]. On the other hand, ANP allows the inconsistency degree of pairwise comparison matrices to be evaluated [37], while DEMATEL neglects this aspect. In this regard, the ANP method involves a more rigorous methodological approach, improving the management understanding and the transparency of the procedure [37]. With relation to the implementation of DEMATEL and ANP in the case study presented here, both methods lead to the quantification of PSF weights, also taking into account the effect of mutual dependencies among them. However, only DEMATEL provides information about the direction and intensity of these influences, also facilitating their visualization by means of the causal diagram. As a result, the decision maker may easily identify those PSFs on which to prioritize attention to improve the overall worker reliability. Afterwards, the influence degree of these PSFs on the others may be observed by the total-relation matrix, and the effects of corrective actions directed at to their improvement may be also predicted.

6. Conclusions

Over the last decades, HRA methodologies have been widely used to compute the HEP in different fields, owing to the fundamental role played by the human factor in the occurrence of industrial accidents. Although the existence of the interrelationship among PSFs has been widely recognized in the literature, the majority of HRA methods assume their independence when computing HEP. In this regard, only few contributions suggest qualitative guidelines or quantitative approaches. While qualitative approaches do not have any theoretical basis, the majority of quantitative ones are statistically based, so they require a high computational effort and proper sample size (i.e., input data) to assure the significance of the results. Therefore, the present paper deals with the PSFs interdependence issue by two different MCDM methods (i.e., DEMATEL and ANP), aiming to overcome the main drawbacks of the literature in the field. The two methods were compared in an attempt to highlight the main advantages and disadvantages of applying both of them within HRA. To this aim, a case study was presented, related to an agri-food company which produces pistachios in Southern Italy. The input data required by the two methods were obtained from the company’s owner, who was asked to pairwise compare PSFs based on specific evaluation scales. The obtained results show that both methods are able to deal with the PSFs dependence within HRA and return the same PSFs ranking with regards to the first four positions. The company’s owner agrees with the PSFs hierarchies, arguing that “Procedures”, “Complexity”, “Stress/stressors”, and “Ergonomics/HMI” are playing a prominent role in influencing worker performance in the investigated workplace. However, only DEMATEL provides detailed information about the direction and intensity of influences, offering a clear representation of results by the causal diagram. As a result, the company’s owner may qualitatively predict the effect of a corrective measure through the mutual influence degree expressed by the total-relation matrix. On the other hand, the implementation of ANP is very challenging due to the high number of pairwise comparison judgements required, despite using the SuperDecisions software. However, ANP allows us to evaluate the inconsistency degree of the judgements and to decompose the decision problem into its elements, contrarily to DEMATEL.
Compared with the aforementioned qualitative guidelines or statistically based methodologies, DEMATEL and ANP require lesser computational effort and allow for making use of the available information, without any constraint on the sample size. They actually represent a structured, effortless, and replicable decision-aiding support tool for the risk analyst, both to assess the PSF interrelationships and to identify the most central factors on which corrective measures have to be primarily taken. Owing to the limited availability of (e.g., financial) resources, the latter perfectly meets the need of a company’s management to firstly focus on a few central factors to improve worker reliability, while initially disregarding the less-important PSFs. However, PSFs might depend on the specific work environment under investigation, so they should be properly selected and/or customized. Therefore, a possible future line of research could deal with this issue, also in a multi-group and uncertain decision context.
Author Contributions

Conceptualization, R.M. and G.L.S.; methodology, R.M. and L.A.; software, L.A.; validation, A.G. and C.M.L.F.; formal analysis, L.A.; data curation, A.G. and R.M.; writing—original draft preparation, L.A. and A.G.; writing—review and editing, G.L.S. and C.M.L.F.; supervision, G.L.S., R.M. and C.M.L.F. All authors have read and agreed to the published version of the manuscript.

Funding

This research received no external funding.

Institutional Review Board Statement

Not Applicable.

Informed Consent Statement

Not Applicable.

Data Availability Statement

Not applicable.

Conflicts of Interest

The authors declare no conflict of interest.

References

  1. Swain, A.D.; Guttmann, H.E. Handbook of Human Reliability Analysis with Emphasis on Nuclear Power Plant Applications; NUREG/CR-1278; US Nuclear Regulatory Commission: Washington, DC, USA, 1983.
  2. Embrey, D.E.; Humphreys, P.; Rosa, E.A.; Kirwan, B.; Rea, K. SLIM-MADUD: An Approach to Assessing Human Error Probabilities Using Structured Expert Judgment; NUREG/CR-3518; US Nuclear Regulatory Publication: Washington, DC, USA, 1984.
  3. Hollnagel, E. Cognitive Reliability and Error Analysis Method (CREAM); Elsevier: London, UK, 1998. [Google Scholar]
  4. Gertman, D.I.; Blackman, H.S.; Marble, J.L.; Smith, C.; Boring, R.L. The SPAR-H Human Reliability Analysis Method; US Nuclear Regulatory Commission: Rockville, MD, USA, 2005.
  5. French, S.; Bedford, T.; Pollard, S.J.T.; Soane, E. Human reliability analysis: A critique and review for managers. Saf. Sci. 2011, 49, 753–763. [Google Scholar] [CrossRef] [Green Version]
  6. De Ambroggi, M.; Trucco, P. Modelling and assessment of dependent performance shaping factors through Analytic Network Process. Reliab. Eng. Syst. Saf. 2011, 96, 849–860. [Google Scholar] [CrossRef]
  7. Aalipour, M.; Ayele, Y.Z.; Barabadi, A. Human reliability assessment (HRA) in maintenance of production process: A case study. Int. J. Syst. Assur. Eng. Manag. 2016, 7, 229–238. [Google Scholar] [CrossRef] [Green Version]
  8. Burns, K.; Bonaceto, C. An empirically benchmarked human reliability analysis of general aviation. Reliab. Eng. Syst. Saf. 2018, 194, 106227. [Google Scholar] [CrossRef]
  9. Franciosi, C.; Di Pasquale, V.; Iannone, R.; Miranda, S. A taxonomy of performance shaping factors for human reliability analysis in industrial maintenance. J. Ind. Eng. Manag. 2019, 12, 115. [Google Scholar] [CrossRef] [Green Version]
  10. Park, J.; Jung, W.; Kim, J. Inter-relationships between performance shaping factors for human reliability analysis of nuclear power plants. Nucl. Eng. Technol. 2020, 52, 87–100. [Google Scholar] [CrossRef]
  11. Groth, K.M. A Data-Informed Model of Performance Shaping Factors for Use in Human Reliability Analysis. Ph.D. Thesis, University of Maryland, College Park, MD, USA, 2009. [Google Scholar]
  12. Boring, R.L. How Many Performance Shaping Factors are Necessary for Human Reliability Analysis US Nuclear Regulatory Commission; Idaho National Laboratory: Idaho Falls, ID, USA, 2010. [Google Scholar]
  13. Groth, K.M.; Swiler, L.P. Bridging the gap between HRA research and HRA practice: A Bayesian network version of SPAR-H. Reliab. Eng. Syst. Saf. 2013, 115, 33–42. [Google Scholar] [CrossRef]
  14. Xi, Y.T.; Yang, Z.L.; Fang, Q.G.; Chen, W.J.; Wang, J. A new hybrid approach to human error probability quantification—Applications in maritime operations. Ocean Eng. 2017, 138, 45–54. [Google Scholar] [CrossRef]
  15. Liu, J.; Zou, Y.; Wang, W.; Zhang, L.; Liu, X.; Ding, Q.; Qin, Z.; Čepin, M. Analysis of dependencies among performance shaping factors in human reliability analysis based on a system dynamics approach. Reliab. Eng. Syst. Saf. 2021, 215, 107890. [Google Scholar] [CrossRef]
  16. La Fata, C.M.; Giallanza, A.; Micale, R.; La Scalia, G. Ranking of occupational health and safety risks by a multi-criteria perspective: Inclusion of human factors and application of VIKOR. Saf. Sci. 2021, 138, 105234. [Google Scholar] [CrossRef]
  17. La Fata, C.M.; Giallanza, A.; Micale, R.; La Scalia, G. A structured methodology for the Safety Key Performance indicator prioritization: A case study. In Proceedings of the 5th International Conference on System Reliability and Safety (ICSRS 2021), Palermo, Italy, 24–26 November 2021; pp. 143–147, ISBN 978-6654-0048-0. [Google Scholar]
  18. Wang, L.; Wang, Y.; Chen, Y.; Pan, X.; Zhang, W. Performance shaping factors dependence assessment through moderating and mediating effect analysis. Reliab. Eng. Syst. Saf. 2020, 202, 107034. [Google Scholar] [CrossRef]
  19. Tsyganok, V.V.; Kadenko, S.V.; Andriichuk, O.V. Significance of expert competence consideration in group decision making using AHP. Int. J. Prod. Res. 2012, 50, 4785–4792. [Google Scholar] [CrossRef]
  20. Adelfio, L.; La Scalia, G.; La Fata, C.M.; Giallanza, A.; Micale, R. A MCDM-based methodology to evaluate the mutual influence among performance shaping factors. In Proceedings of the XXVII Summer School “Francesco Turco”—Industrial Systems Engineering, Sanremo, Italy, 6–9 September 2022. [Google Scholar]
  21. Gabus, A.; Fontela, E. Perceptions of the World Problematique: Communication Procedure, Communicating with Those Bearing Collective Responsibility; DEMATEL Report No. 1; Battelle Geneva Research Centre: Geneva, Switzerland, 1973. [Google Scholar]
  22. Dalalah, D.; Hayajneh, M.; Batieha, F. A fuzzy multi-criteria decision making model for supplier selection. Expert Syst. Appl. 2011, 38, 8384–8391. [Google Scholar] [CrossRef]
  23. Baykasoğlu, A.; Kaplanoğlu, V.; Durmuşoğlu, Z.D.U.; Şahin, C. Integrating fuzzy DEMATEL and fuzzy hierarchical TOPSIS methods for truck selection. Expert Syst. Appl. 2013, 40, 899–907. [Google Scholar] [CrossRef]
  24. Attarmoghaddam, N.; Khorakian, A.; Saghih, A.M.F. Employing system dynamic and DEMATEL for improving the new product development time in knowledge-based companies. J. Ind. Prod. Eng. 2022, 39, 521–534. [Google Scholar] [CrossRef]
  25. Tseng, M.L.; Li, S.X.; Lin, C.W.R.; Chiu, A.S.F. Validating green building social sustainability indicators in China using the fuzzy delphi method. J. Ind. Prod. Eng. 2022, 40, 35–53. [Google Scholar] [CrossRef]
  26. Saaty, T.L. The Analytic Network Process: Decision Making With Dependence and Feedback; RWS Publications: Pittsburgh, PA, USA, 2001. [Google Scholar]
  27. Williams, J.C. A data-based method for assessing and reducing human error to improve operational performance. In Proceedings of the IEEE Fourth Conference on Human Factors and Power Plants, Monterey, CA, USA, 5–9 June 1988; pp. 436–450. [Google Scholar]
  28. Kyriakidis, M.; Majumdar, A.; Ochieng, W.Y. The human performance railway operational index—A novel approach to assess human performance for railway operations. Reliab. Eng. Syst. Saf. 2018, 170, 226–243. [Google Scholar] [CrossRef]
  29. Barrios, M.A.O.; De Felice, F.; Negrete, K.P.; Romero, B.A.; Arenas, A.Y.; Petrillo, A. An AHP-topsis integrated model for selecting the most appropriate tomography equipment. Int. J. Inf. Technol. Decis. Mak. 2016, 15, 861–885. [Google Scholar] [CrossRef]
  30. Saaty, T.L.; Vargas, L.G. Diagnosis with Dependent Symptoms: Bayes Theorem and the Analytic Hierarchy Process. Oper. Res. 1998, 46, 433–604. [Google Scholar] [CrossRef]
  31. Saaty, T.L. Axiomatization of the analytic hierarchy process. Manag. Sci. 1986, 32, 841–855. [Google Scholar] [CrossRef]
  32. Asadabadi, M.R.; Chang, E.; Saberi, M. Are MCDM methods useful? A critical review of Analytic Hierarchy Process (AHP) and Analytic Network Process (ANP). Cogent Eng. 2019, 6, 1623153. [Google Scholar] [CrossRef]
  33. Gorener, A. Comparing AHP and ANP: An application of strategic decisions making in a manufacturing company. Int. J. Bus. Soc. Sci. 2012, 3, 194–208. [Google Scholar]
  34. Magableh, M.G.; Mistarihi, M.Z. Applications of MCDM approach (ANP-TOPSIS) to evaluate supply chain solutions in the context of COVID-19. Heliyon 2022, 8, e09062. [Google Scholar] [CrossRef]
  35. Certa, A.; Enea, M.; Galante, G.; La Fata, C.M. Multi-objective human resources allocation in R&D projects planning. Int. J. Prod. Res. 2009, 47, 3503–3523. [Google Scholar]
  36. Zhu, Q.; Dou, Y.; Sarkis, J. A portfolio-based analysis for green supplier management using the analytical network process. Supply Chain Manag. 2010, 15, 4306–4319. [Google Scholar] [CrossRef]
  37. Kheybari, S.; Rezaie, F.M.; Farazmand, H. Analytic network process: An overview of applications. Appl. Math. Comput. 2020, 367, 124780. [Google Scholar] [CrossRef]
Figure 1. Causal diagram.
Electronics 12 00283 g001
Figure 2. Network structure of the ANP method.
Electronics 12 00283 g002
Figure 3. Unweighted super matrix.
Electronics 12 00283 g003
Figure 4. Weighted super matrix.
Electronics 12 00283 g004
Figure 5. Hopper.
Figure 5. Hopper.
Electronics 12 00283 g005
Figure 6. Hulling machine.
Electronics 12 00283 g006
Figure 7. Dryer.
Figure 7. Dryer.
Electronics 12 00283 g007
Figure 8. Causal diagram.
Electronics 12 00283 g008
Figure 9. Network structure of the decision problem.
Electronics 12 00283 g009
Table 1. Five-point scale of DEMATEL.
Linguistic VariableNumerical Value
No influence (No)0
Very low influence (VL)1
Low influence (L)2
High influence (H)3
Very high influence (VH)4
Table 2. Nine-point scale for pairwise comparison judgements.
Scale of ImportanceDefinitionExplanation
1Equal importanceThe two elements have the same importance with respect to the third element.
3Moderate importanceOne element is moderately more dominant than the other in influencing the third element.
5Strong importanceOne element is strongly dominant compared to the other in influencing the third element.
7Very strong importanceOne element is very strongly dominant compared to the other in influencing the third element.
9Extreme importanceOne element is extremely dominant compared to the other in influencing the third element.
2, 4, 6, 8Intermediate valuesIntermediate values between one level and another.
Table 3. Example of pairwise comparison matrix between elements of the first cluster in respect to a21.
a21a11a12a13
a11s111s112s113
a12s121s122s123
a13s131s132s133
Table 4. PSFs of the SPARH method.
PSFDefinitionDescription
PSF1Available timeTime available to complete a task
PSF2Stress/StressorsPersonal factors or environmental conditions that can affect worker performance
PSF3ComplexityComplexity of the work to be performed
PSF4Experience/TrainingLevel of experience and knowledge regarding the task to be performed
PSF5ProceduresExistence of operational procedures for the tasks under consideration
PSF6Ergonomics/HMIQuality of the equipment, displays and controls, layout quality, and quantity of information available from instrumentation
PSF7Fitness for dutyLevel of mental and physical adequacy of the operator for the task under consideration
PSF8Work processesFactor related to work organization, communication, management of the work team
Table 5. Direct-relation matrix Z.
PSF1PSF2PSF3PSF4PSF5PSF6PSF7PSF8
PSF10LVHVLVHHVLL
PSF2VH0HVHVHHVLVH
PSF3VLVH0VHHVHHVH
PSF4VLHVH0VHHVLVH
PSF5VHVHVHVH0VHHVH
PSF6HHVHVHVH0VLH
PSF7HHVHHVLVH0VH
PSF8HHVHVLVHVLVL0
Table 6. Total-relation matrix T.
PSF1PSF1PSF2PSF3PSF4PSF5PSF6PSF7PSF8
PSF10.4850.6510.7880.5750.7230.6460.3140.686
PSF20.7250.6660.8970.7760.8540.7540.3680.878
PSF30.6120.7850.7650.7630.9170.7660.4240.861
PSF40.5670.7060.8450.5780.7760.6880.3370.807
PSF50.7690.9790.9900.8270.7680.8380.5580.936
PSF60.6740.7550.9050.7630.8310.6320.3610.828
PSF70.6940.7700.9220.7380.7480.7810.3260.872
PSF80.5650.6260.7500.5400.6890.5490.2990.576
Table 7. Prominence values, relation values, weights, and normalized weights of PSFs.
PSF(D + R)(DR)WeightNormalized Weight
PSF110.429−0.34410.4340.107
PSF212.7100.11312.7110.130
PSF313.894−0.90813.9240.143
PSF411.806−0.22711.8080.121
PSF514.3170.49914.3260.147
PSF612.3630.13412.3640.127
PSF79.4732.6969.8500.101
PSF811.971−1.96312.1300.124
Table 8. Pairwise comparison matrix with respect PSF1—available time.
PSF1PSF2PSF3PSF4PSF5PSF6PSF7PSF8
PSF211/451/2231
PSF34121/71/31/21/3
PSF41/51/211/61/41/21/4
PSF52761343
PSF61/2341/3121
PSF71/3221/41/211/2
PSF81341/3121
Table 9. ANP weights.
PSFANP Weight
PSF1—Available time0.061
PSF2—Stress/stressor0.128
PSF3—Complexity0.188
PSF4—Experience/Training0.106
PSF5—Procedures0.227
PSF6—Ergonomics/HMI0.126
PSF7—Fitness for duty0.063
PSF8—Work processes0.098
Table 10. Comparison between ANP and DEMATEL weights.
PSFANP WeightDEMATEL Weight
PSF1—Available time0.0610.107
PSF2—Stress/stressor0.1280.130
PSF3—Complexity0.1880.143
PSF4—Experience/Training0.1060.121
PSF5—Procedures0.2270.147
PSF6—Ergonomics/HMI0.1260.127
PSF7—Fitness for duty0.0630.101
PSF8—Work processes0.0980.124
Table 11. Ranking of PSFs.
ANP RankingDEMATEL Ranking
PSF50.227PSF50.147
PSF30.188PSF30.143
PSF20.128PSF20.130
PSF60.126PSF60.127
PSF40.106PSF80.124
PSF80.098PSF40.121
PSF70.063PSF10.107
PSF10.061PSF70.101
Disclaimer/Publisher’s Note: The statements, opinions and data contained in all publications are solely those of the individual author(s) and contributor(s) and not of MDPI and/or the editor(s). MDPI and/or the editor(s) disclaim responsibility for any injury to people or property resulting from any ideas, methods, instructions or products referred to in the content.