Abstract
Bus transportation system has become the primary mode of traffic for urban residents. Every day, thousands of buses provide services for millions of passengers. Efficiently monitoring bus trajectories is essential for evaluating service quality and ensuring public safety. In this study, we propose a Flink-based solution to detect anomalies for bus trajectories in real time. Specifically, it can identify two types of anomalies. The first type is when a bus deviates from its designated route during a trip. The second type is when a bus arrives at a scheduled stop along its route but fails to stop. This solution employs CEP (Complex Event Processing) to determine bus arrival events and control the detection process. In this process, it utilizes the state management mechanism to save and update a bus’s actual trajectory, which is derived from the raw GPS trajectory and maintained as a stop sequence. Subsequently, it uses LCSS (Longest Common Subsequence) to measure the trajectory similarity between the actual bus trajectory and the scheduled route. We validate the solution using a large-scale real dataset in a Flink cluster with six virtual machines. The experimental results show that (1) each core can handle anomaly detection on 12.5 buses simultaneously and (2) the detection accuracies of the two anomalies are 90.5% and 89.3%, respectively.
1. Introduction
With the development of urban public transport system, buses have become one of the main travel modes for urban residents, serving millions of urban residents every day. The GPS positioning devices deployed on buses continuously generate real-time GPS positioning information. Through a dedicated network, these GPS positioning records are transmitted to the traffic big data platform in a real- time way. Many existing studies have focused on mining massive GPS trajectory data and passenger ticket records to support applications such as passenger flow analysis, scheduling, and bus service quality evaluation. Among these studies, the anomaly detection of bus trajectories is a foundation for evaluating the service quality, as well as for emergency management and public safety.
With the continuous increase in urban population and scale, the bus network is also increasing. This change brings new challenges to the anomaly detection of bus trajectories. Taking Shenzhen as an example, as of February 2019, there were 3658 bus routes, 14,560 bus stops, and 17,270 buses. Every day, this bus system serves 1.37 million passengers on average. Assuming that each bus generates a GPS record every 20 s, these buses generate 98 million GPS records per day. In summary, the challenges are based on two aspects. On the one hand, the time sensitivity of trajectory anomaly detection is insufficient to support real-time applications. For example, if a bus deviated from the designated route during a trip, the existing solution typically becomes aware about this anomaly within a few minutes. On the other hand, the current solutions [,,,] fail to handle a large-scale bus transportation system.
Currently, many existing works have been conducted on abnormal detection for vehicle GPS trajectories [,,,]. These methods conduct anomaly detection on historical GPS trajectories in the batch mode. They can effectively perform anomaly detection on their own business scenarios. However, the time sensitivity of batching mode is not enough to meet the need of real-time anomaly detection. Although Mao et al. [] achieved real-time anomaly detection of trajectories, the solution they proposed was implemented using C++ programming language and was limited to running in a single process mode. Therefore, for real-time anomaly detection, the solution can only meet the needs of small-scale scenarios. Fortunately, the emergence of streaming computing engine makes it possible to meet large-scale and real-time detection requirements simultaneously.
To address this issue, we propose a streaming-based solution for real-time detection of abnormal situations. It is designed to detect two types of trajectory anomalies. The first is a bus trajectory deviates its designated route during the trip. The second is the bus arrives at a scheduled stop along its route but fails to stop. This solution consists of two big data components, a message middleware called Kafka [] and a streaming computing engine called Flink []. Kafka receives GPS positioning records transmitted from all buses and notifies tasks launched by Flink to retrieve these records. These long-time running tasks are designed to implement anomaly detection in a parallel way.
The detecting process is composed of two steps: (1) The first step is to transform the raw GPS trajectory. In this step, it detects the bus arrival event based on the raw GPS trajectory, then converts the GPS trajectory into a stop sequence, and finally employs the state management mechanism to save and update the stop sequence. (2) The second is to measure the similarity. In this step, it employs the LCSS (Longest Common Subsequence) [] to measure the similarity between the actual bus trajectory and the scheduled route. The similarity score is used to determine whether the trajectory is abnormal or not.
This solution facilitates seamless integration of the detection algorithms with the distributed streaming environment, providing the capability to handle large-scale continuous GPS trajectories in a real-time way. Specifically, the main contributions of this paper can be summarized in the following three points:
- (1)
- We propose a streaming-based solution to detect anomalies of bus trajectories in a real-time way. This solution consists of two famous big data components, Kafka and Flink. It facilitates seamless integration of the detection algorithms with the distributed streaming environment, providing the capability to handle large-scale continuous GPS trajectories in a real-time way.
- (2)
- We implement two types of anomaly detection algorithms. The first is a bus deviates from its designated route during the trip, and the second is a bus arrives at a scheduled stop but fails to stop. In detail, it firstly transforms a raw GPS trajectory into an actual stop sequence, then measures the similarity between the stop sequence and scheduled routes using LCSS. Finally, it determines anomaly according to the similarity score.
- (3)
- We validate this solution on a Flink cluster with six virtual machines using a real large-scale dataset. The experimental results showed that (1) each core can perform anomaly detect on 12.5 buses simultaneously and (2) the detection accuracies of the two types are 90.5% and 89.3%, respectively.
The organizational structure of this paper is as follows: Section 2 introduces the related research works. Section 3 provides the definition of trajectory anomaly detection problem. Section 4 introduces a solution based on the streaming computing engine Flink. Section 5 describes the dataset and experimental environment. Section 6 analyzes the experimental results. Finally, Section 7 draws a conclusion based on the entire paper.
2. Related Work
This section will discuss existing related works on three aspects: GPS anomaly detection algorithms, streaming-based traffic applications, and trajectory prediction.
2.1. GPS Trajectory Anomaly Detection
There are many existing studies related to GPS trajectory anomaly detection. Chen et al. [] used Spark to detect trajectory outlier. They mainly focused on three aspects: first, trajectory data management; second, trajectory data pre-processing; and third, the parallel strategy of trajectory outlier detection from a global perspective. Barucija et al. [] calculated the average speed of the vehicle based on continuous GPS points; then, they compared the average speed with the instantaneous speed of the vehicle’s GPS points; finally, they used the comparison result to analyze the possible abnormal conditions that may occur. Fu et al. [] validated the spatial auto-correlation of five taxi over-speed events with taxi GPS data. Cruz et al. [] used the spatio-temporal characteristics of GPS points to predict the degree of spatial or temporal anomaly in bus trajectories.
Han et al. [] used vehicle trajectory data to identify abnormal situations and then took urgent action to address them. Hu et al. [] proposed a method of extracting the real state sequence of the trajectory, and designed an AFSM (Adaptive Finite State Machine) to judge whether there is any abnormality in the internal transport operation or not. Danda et al. [] used hidden Markov methods for prediction based outlier detection and pattern mining to identify outliers or fragments in trajectory data. Aoki et al. [] utilized the continuous trajectories of periodic vehicles to provide real-time traffic flow and speed and then achieved early event detection. Refs. [,] considered time and space dimensions simultaneously. Ref. [] used DTW (Dynamic Time Warping) to extract key points from the raw GPS trajectory and perform anomaly detection. Xia et al. [] introduced a fully connected neural network and extracted spatial features, such as trajectory offset and driving distance, to detect abnormal vehicle trajectories. Refs. [,,] worked on outlier detection and Ref. [] worked on time series anomaly detection.
Although these methods can effectively satisfy the needs of trajectory anomaly detection in their own scenarios, they are limited to running in a single node in batch mode [,,,]. Therefore, their capacities are not enough to meet the requirements of large-scale detection. In addition, the time sensitivity of batch mode is not enough to satisfy the real-time requirement.
2.2. Flink-Based Traffic Applications
Agrawal et al. [] used Flink to design and implement visualization for online taxi services and then predicted several important services, such as popular geographical locations among all transportation locations, famous travel spots between two cities, etc. Chen et al. [] proposed a Flink-based framework to detect common motion pattern in a real-time way to study taxi trajectories.
Hu et al. [] first used the scan line algorithm, which is based on Flink, to convert vector data into raster data with a specific resolution ratio; second, they made the raster data as the initial map image; finally, according to the pyramid hierarchy, they cut the data into tiles to quickly visualize the arrived spatial data. Using traffic GPS data, Fang et al. [] proposed a Spark-based hybrid efficient framework. This framework supports offline and online large-scale trajectory management and analysis, such as trajectory similarity calculation.
Shaikh et al. [] proposed GeoFlink. It extends the support of Flink for supporting spatial objects and indexes. At the same time, it also implemented spatio-temporal partitioning and several classic spatio-temporal queries. Based on Flink, Pan et al. [] introduced a state reuse mechanism and an index-based pruning method to achieve continuous top-k trajectory similarity search. This move greatly reduces the computational cost of trajectory similarity search.
Mao et al. [] utilized algorithms, which are based on Markov decision processes, to perform GPS map matching. The model is trained in offline mode and deployed in online mode. In the online detection stage, the trained model detects and calculates the anomaly degree of the trajectory in real time according to a predefined threshold, and whether the trajectory is abnormal or not is judged by the user-specified anomaly threshold. Although this solution has achieved accurate judgment in a high efficient way, it still has one obvious limitation in handling a large-scale trajectory detection. It is implemented using the C++ programming language and can only be deployed on a single node, suffering from the scalability issues.
This paper utilizes Flink, a streaming processing engine, to detect anomaly detection of bus GPS trajectories. This solution can detect two types of anomalies: no-stop at the station and deviation from the route. It employs LCSS to measure similarity between an actual bus trajectory and the corresponding scheduled route.
2.3. Trajectory Prediction
Refs. [,] are representative works in trajectory prediction of moving objects. Ref. [] developed a multi-view machine (MVM) method, incorporating context information from Point of Interest (POI) data and human mobility data into destination prediction. This method aims to address the chaotic parking problem for a bike-sharing system called Mobike. Reference [] explored predictive learning techniques in urban computing using STGNN (Spatio-Temporal Graph Neural Network). Trajectory prediction is one of the predictive learning tasks. The study initially constructs spatio-temporal graphs, capturing relationships among various agents within a group. Once these spatio-temporal graphs are formed, STGNN models are designed to forecast future coordinates that agents might reach. These predictions are based on the historical traversal coordinates of the agents, facilitating the prediction of future trajectories.
3. Problem Definition
This paper studies the anomaly detection of a bus trajectory during its trip, focusing on two types of anomalies. The first is a bus deviates from its designated route, and the second is a bus arrives at a scheduled stop along its route but fails to stop. In order to clearly describe the research problems, four aspects consisting of relevant definitions, concepts, and expression forms are explained here.
Definition 1.
GPS points
In Formula (1), t represents the timestamp, and lat and lon represent the latitude and longitude, respectively.
Definition 2.
Bus stops
In Formula (2), id is the identity of a bus stop, and lat and lon represent the latitude and longitude of a bus stop, respectively.
Definition 3.
Bus GPS trajectory
In Formula (3), id represents the identity of a bus, P represents a GPS point, and n stands for the number of points in a trajectory.
Definition 4.
Bus stop sequence
In Formula (4), S is a bus stop, and n represents the length of bus stop sequence. A group of bus stops in the sequence are ordered in a scheduled route. Actually, a bus stop sequence is attached to a specific route.
Definition 5.
Bus trajectory represented by a stop sequence
In Formula (5), id is the identity of a bus. t represents the timestamp. S is a bus stop, and it satisfies the condition that the bus has arrived at this designated stop and has come to a complete halt. n represents the length of the bus stop sequence. stopTR is a stop sequence transformed from a bus GPS trajectory.
Definition 6.
Bus Route
In Formula (6), id represents the bus route number. dir represents the direction of the route (1 represents upward, 2 represents downward). stopSeq represents a stop sequence, which is designated for the route.
Definition 7.
Trajectory similarity measurement function.
The trajectory similarity measurement function is used to measure the similarity between two different trajectories. The measurement function is as follows:
In Formula (7), stopTR is a stop sequence transformed from a bus GPS trajectory. It means that a bus arrived at each stop of this sequence and has come to a complete halt. stopSeq is a stop sequence designated to a specific bus route. trSimilarity is a similarity score, with values ranging from 0 to 1. A value of 0 means that there is no spatio-temporal intersection between these two sequences. A value of 1 means that the two sequences are completely identical.
Definition 8.
LCSS (Longest Common Subsequence)
The Longest Common Subsequence is a method commonly used to measure the similarity between two different strings. It calculates the longest subsequence shared by two different trajectories to determine their similarity degree. Assuming that there is trajectory A with n points and trajectory B with m points, the length of the Longest Common Subsequence shared by A and B can be defined as follows:
In the Longest Common Subsequence, is the distance threshold that meets the matching condition. If the distance between point a and point b is less than the threshold, then it can be assumed that point a and point b are identical, a or b is a common point shared by trajectory A and B. Otherwise, they are not identical. Note that we should simultaneously consider the time and space distances when comparing different points.
Definition 9.
Trajectory similarity
In Formula (9), is the i-th stop that is matched in the established trajectory. The result of this formula is between 0 and 1, and this formula is essential to detect anomaly for bus trajectory.
4. Research Methods and Technical Routes
4.1. Technology Roadmap
Figure 1 depicts the technology roadmap in this paper. This roadmap consists of three stages: data pre-processing, trajectory transformation, and anomaly detection. In the first stage, it introduces how we collect data from the bus transportation system and perform data cleaning and integration. In the second stage, it describes how we transform a raw GPS trajectory into a stop sequence and maintain the sequence. In the third stage, it shows how we measure trajectory similarity and conduct real-time anomaly detection.
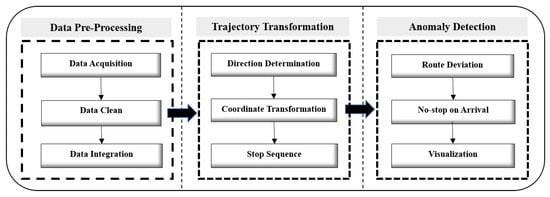
Figure 1.
Proposed pipeline of the trajectory transformation and anomaly detection solution.
Note that “real time” in the context of this research means a few seconds, such as 1 to 5 s. It measures the difference between two timestamps in the pipeline. For example, the first is the timestamp when a GPS record is submitted to Kafka, and the second is the timestamp when that GPS record is detected by Flink.
4.2. Data Pre-Processing
The experiments in this paper include the following five datasets: bus stop data, route information, route/stop data, bus schedule data, and bus GPS trajectory data. A detailed introduction to the dataset can be found in Section 5. In the experiments, it is necessary to integrate and pre-process the data. Through joining bus route data, route/stop data, and bus stop data, we can obtain each bus’s information such as route, a stop sequence, direction, and GPS trajectory. In the actual acquisition and transmission processes, due to sensor error, network instability and other reasons, each dataset may contain error information, such as outlier, duplicate value, missing data, etc., so before using these datasets, it is necessary to perform data pre-processing to handle outlier, blank value, and duplicate value. It is a necessary step to ensure data quality (such as accuracy and reliability) for subsequent tasks.
4.3. Path Generation
4.3.1. Running Direction Judgment
For each specific bus route, there are two directions: up and down. The uplink and downlink correspond to a set of stop sequences, respectively, and the two sets of sequences appear in opposite directions. Generally speaking, there are two standards for dividing uplink and downlink. First, starting from the city center area is uplink, and returning is downlink. Second, the starting point has a fixed parking lot, starting from the fixed parking lot is uplink and returning is downlink. To detect abnormal bus trajectory, the first step is to determine the current driving direction based on the bus GPS trajectory.
The process of determining the bus direction is as follows: It firstly use the GPS trajectory points of a bus to match to the nearest bus stop. If there are multiple GPS trajectory points that are matched to the same bus station at the same time, just retain the first point. Thus, two adjacent retained points form a direction vector of the bus. Meanwhile, the two corresponding stops form the direction vector of the stop. Then, it calculates the angle between the direction vector of the bus and the direction vector of the stop. Thirdly, it determines the direction according to the value of the aforementioned angle. If the angle between the two vectors is within the threshold range, it can be concluded that the direction of bus operation is consistent with the direction of the matched stops.
Figure 2 and Figure 3 show two examples to illuminate how we determine the direction of a running bus. In these two figures, the red dots represent bus stops, the yellow dots represent GPS points, and the direction from left to right is uplink. It can be seen that the vector angle of the bus GPS and the stop pair in Figure 2 is within the threshold range. Thus, it can be determined that the bus running direction is the same as the stop direction, and is uplink. Different from Figure 2, the vector angle between the bus GPS and the stop pair in Figure 3 is not within the threshold range. Thus, it can be determined that the direction of the bus is opposite to the direction of the stop pair, and is downlink.

Figure 2.
Same directions as the site.

Figure 3.
Opposite direction to the station.
In Formula (10), is a threshold. It has two ranges, the first is from 0 to 90 and the second is from 270 to 360.
4.3.2. Coordinate System Conversion
In the original dataset, the geographic coordinate systems used for bus stop location and bus GPS trajectory are different. They use WGS 84 and GCJ-02 coordinate systems, respectively. WGS 84 is the reference coordinate system of the Global Positioning System (GPS) and is widely used for global positioning and navigation. It uses decimal degrees to represent longitude and latitude. GCJ-02 is an encrypted coordinate system used in China, also known as the Mars coordinate system, with encrypted offsets to WGS 84 coordinates.
In order to detect trajectory anomaly of buses, we need to perform coordinate transformation and keep a consistent coordinate system between two datasets. In this paper, we transform a stop’s geographic coordinate system to WGS84. The conditions before and after the transformation are shown in Figure 4.

Figure 4.
Before and after coordinates’ conversion.
In Figure 4, the green dots represent bus stops, and the black dots stand for a GPS trajectory. From Figure 4, it is obvious that before performing coordinate transformation, the offset of the bus stops on the road network is significant. Thus, it is hard to detect anomaly of a bus trajectory if we do not perform coordinate transformation.
4.4. Abnormal State Detection
4.4.1. Detection Framework
Figure 5 shows the detection framework, which consists of two big data components, the message middleware called Kafka, and the streaming processing engine named Flink. Kafka receives GPS positioning records transmitted from buses and notifies a group of tasks launched by Flink to retrieve these records. Flink is in charge of a group of long-time running tasks to implement anomaly detection for continuously generated GPS trajectories.
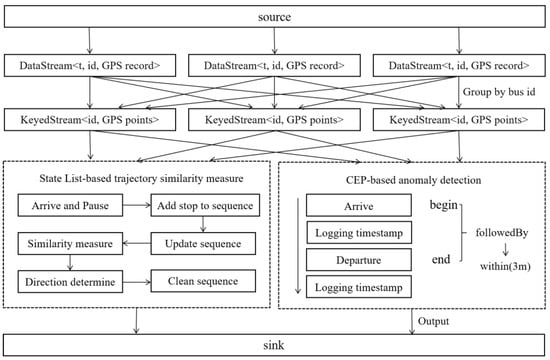
Figure 5.
A Flink-based framework for bus trajectory anomaly detection.
In detail, the workflow of anomaly detection consists of three steps. These steps are streaming pre-processing, trajectory transformation, and trajectory anomaly detection.
In the first step, it firstly divides all received GPS records into different groups according to the bus identity. Within each group, it sorts all GPS points by time and generates a trajectory for each bus. In the second stage, it transforms a GPS trajectory into a stop sequence. Each stop in this sequence must satisfy one condition that the bus arrives at this stop and has come to a complete halt. Then, it measures the similarity between the stop sequence of the bus and the designated route. In the third step, it determines whether there is an outlier in this GPS trajectory according to the similarity score.
In this workflow, two key technical points need to be further discussed, the first is the state management mechanism (SMM) and the second is the Complex Event Processing (CEP). SMM is used to save and update a bus’s actual trajectory, which deviated from the raw GPS trajectory and was maintained as a stop sequence. CEP is used to detect bus arrival, departure, and pattern events. As a bus is running on the trip, the stop represented trajectory changes over time. When the CEP determines to add a stop to the sequence, it obtains the sequence from SMM according to the bus identity, adds the stop to the sequence, and saves the new stop sequence to SMM. SMM and CEP cooperate with each other, jointly, completing the major steps. In addition, a group of long-time running tasks is used to implement the pipeline of anomaly detection in a parallel way.
4.4.2. Arrival Non-Stop Detection
When a bus arrives at a designated stop but does not come to a halt, we call this situation arrival non-stop anomaly. This subsection will introduce how we detect this kind of anomaly from the raw GPS trajectory.
The specific steps are as follows:
Step 1: A group of tasks simultaneously retrieve GPS records from Kafka, and then the operator keyBy() is applied to divide all points into different groups according to the bus identity. Within each group, it sorts points by time and generates a trajectory for each bus.
Step 2: Given the arrival and departure events, it uses the operator followedBy() to watch the upcoming departure event. If the departure event is captured, the operator where() is used to measure the latency between the arrival and departure events. Finally, it uses the operator within() to define the size of the event window. If the latency is larger than or equal to a predefined time threshold, then it can be determined that the bus has stopped at this station and there is no anomaly. Otherwise, an anomaly is captured.
Step 3: It uses the operator select() to match the input event stream, identify the arrival but non-stop events that meet the definition, and output the matched events for next processing, such as activating an alarm to remind the supervisor of bus transportation system.
Details about this anomaly detection are listed in Algorithm 1.
| Algorithm 1 Arrival without stopping detection algorithm | |
| Input: segTR.//A GPS trajectory segment. Output: pattern.//A event object. | |
| 1 | procedure AWSDetect(segTR) |
| 2 | |
| 3 | //Get a bus’s recent direction. |
| 4 | |
| 5 | //Get the last stop of a bus trajectory. |
| 6 | //Calculate the current direction |
| 7 | while then |
| 8 | //Determining whether a bus is approaching a new bus stop. |
| 9 | |
| 10 | |
| 11 | //Calculate the new stop |
| 12 | if then |
| 13 | //Catch the arrival event |
| 14 | |
| 15 | //Add the current station to the stop sequence. |
| 16 | end if |
| 17 | |
| 18 | do |
| 19 | //Watch the departure event |
| 20 | end while |
| 21 | |
| 22 | //Catch the departure event |
| 23 | |
| 24 | end procedure |
4.4.3. Route Offset Detection
This subsection will introduce how we detect the route deviation anomaly via the LCSS algorithm. Before we delve into the details, we first discuss the data pre-processing for the raw GPS positioning records.
The GPS positioning records are continuously generated by the running buses, and all GPS records are collected and transmitted to the pub/sub system Kafka via different channels. In addition, a group of long-time running tasks retrieve GPS records from different partitions in Kafka. These conditions cause data issues such as incomplete data and data out-of-order. For example, a set of GPS points produced by a specific bus would be received by different tasks. Even worse, points produced by the same bus and received by a task are disordered. These data quality issues prevent us to implement anomaly detection for bus trajectory. Thus, it is necessary to perform pre-processing for the subsequent stages.
Figure 6 depicts the pre-processing process of GPS positioning records. It consists of two steps. Firstly, it applies the operator keyBy() on the DataStream, which holds the received GPS records. This operator divides all points into different groups according to the bus identity. Secondly, within each group, it orders the points by time and generates trajectory segment for the corresponding bus. With the state management mechanism, each bus trajectory is updated by adding a segment to the original one.
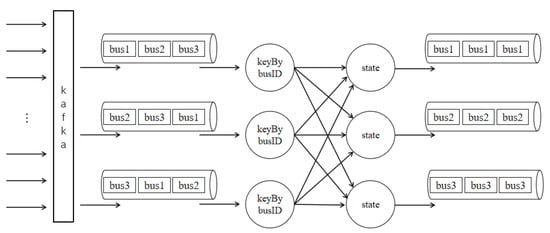
Figure 6.
Partitioning of data streams by keystroke.
For anomaly detection, the complement steps are as follows:
Step 1: Data pre-processing. A group of tasks simultaneously retrieves GPS records from Kafka, then reorganizes these points and generates an incremental trajectory for each bus. Further details are listed in Figure 6.
Step 2: Update the actual bus trajectory. If the CEP captures the pattern event that a bus arrived at a stop and came to a halt, the task will update the bus’s stop sequence. It firstly obtains the original stop sequence from SMM by the bus identity, and adds the stop to this sequence, generating a new sequence. Then, puts the new one back into the SMM.
Step 3: Direction determination. It uses the methods described in Figure 2 and Figure 3 to detect the driving direction of a running bus. It will clear the corresponding stop sequence of a bus if the event of direction change is detected.
Step 4: Similarity measurement. It employs LCSS algorithm to measure the similarity between the stop sequence of a bus and the stop sequence of a route, generating a similarity score.
Step 5: Make a judgement. If the similarity score is greater than the predefined threshold, it indicates that the actual bus trajectory is similar to the designated route, and we can draw a conclusion that the bus is running strictly according to the designated route. Otherwise, it can be determined that the bus did not follow the designated route. An anomaly of the bus’s trajectory is detected.
Details about this anomaly detection workflow are listed in Algorithm 2.
| Algorithm 2 Detection algorithm of deviating from the designated route | |
| Input: segTR.//Bus traveling GPS trajectory. Output: resList.//Real-time no-stopping bus stops. | |
| 1 | / |
| 2 | |
| 3 | |
| 4 | //Get a bus’s recent direction. |
| 5 | |
| 6 | //Get the last stop of a bus trajectory. |
| 7 | //Calculate the current direction. |
| 8 | while then |
| 9 | //Determining whether a bus is approaching a new bus stop. |
| 10 | |
| 11 | //Get the stop sequence for a bus. |
| 12 | |
| 13 | //Get the designated route. |
| 14 | //Calculate similarity. |
| 15 | |
| 16 | |
| 17 | if then//Determining whether the direction is changed. |
| 18 | //Clear the current stop sequence for a bus. |
| 19 | |
| 20 | end if |
| 21 | |
| 22 | end procedure |
In the workflow of anomaly detection, how we maintain a group of stop sequences is worth a further discussion. The sequences are frequently updated because all buses are running their trips and these pattern events are continuously triggered. State management mechanism (SMM) provides the capability to hold a large amount of different variables in the distributed and pipeline environment []. Figure 7 depicts how a task update a stop sequence for a bus trajectory.
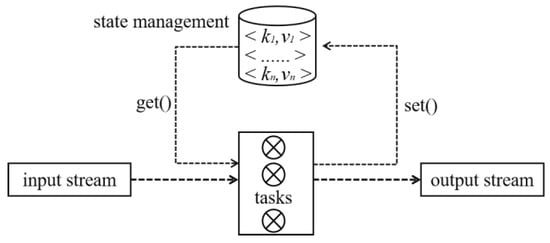
Figure 7.
Task model with state.
5. Data Introduction and Experimental Environment
5.1. Data Introduction
The experiments in this paper involve two real datasets, the first was collected from Shenzhen bus transportation system on 2 January 2019, and the second was collected from Guangzhou bus transportation system on 1 October 2021. These two real datasets are used to simulate real-time detection of deviation from the route and arrival without stopping. A GPS record includes many different fields, such as the timestamp, bus identity, longitude, latitude, instantaneous speed, direction, and route number. The number of GPS records in Shenzhen dataset is 107.4 million, which are generated from 16,800 buses. The number of GPS records in Guangzhou dataset is near 1.0 million, and these GPS records are collected from 121 buses.
There is a difference between these two datasets. In Guangzhou bus transportation system, when the bus enter and exit a bus stop, the driver will trigger a device, which reads the instantaneous spatial–temporal information, to form and transmit a record to the big data platform. In contrast, Shenzhen dataset does not include the entry and exit information. However, this difference does not affect the workflow of anomaly detection. Details about datasets, such as table name, the number of records, and data size are listed in Table 1.

Table 1.
Dataset description.
5.2. Establishment of Experimental Environment
We build a streaming environment to simulate a real-world production system for bus transportation system. This environment consists of a data-source simulator, a Kafka cluster, and a Flink cluster. The simulator is deployed in a single node, and it submits GPS records to Kafka. The Kafka cluster consists of five nodes. It works as a pub/sub system. On the one hand, it receives GPS records from the simulator and organizes these messages in memory. On the other hand, it notifies tasks in Flink to retrieve these messages. The Flink cluster consists of six nodes. It continuously retrieves GPS records from Kafka and automates the workflow of anomaly detection for bus trajectory. The big data components are Hadoop-3.3.4, Spark-2.4.0, Flink-1.14.6, Kafka-3.3.1, etc.
Each node is a virtual machine (VM), and all VMs are equipped with the same hardware and software. Each VM has four cores, 8 GB memory, and 500 GB disk. The underlying physical machine equipped with two 8-core Intel Xeon processors (Silver 4110 CPUs @ 2.10 GHz) and 32 GB memory (DDR 4)
Figure 8 depicts a pipeline-based architecture for detecting trajectory anomalies in real time. This architecture consists of four components: the GPS terminals, Kafka (the message middleware), Flink (the streaming processing engine), and the storage system (which may include Redis, Mysql, and HBase). In our experiments, we employ a node to simulate 300 GPS terminals deployed on buses.

Figure 8.
A pipeline-based architecture for trajectory anomaly detection.
6. Experimental Results and Analysis
In this section, we first present the results about the route deviation and the no-stop anomalies. We than conduct comprehensive performance analysis on different components in the pipeline-based solution. We finally provide a case study about how to apply such solution.
6.1. Deviation from the Route
This subsection provides two examples, one is about Guangzhou and the other is about Shenzhen.
Figure 9 depicts the result of the detection for a Guangzhou bus, and the bus’s identity is xxx672 (we replaced the partial identity with xxx to protect data privacy). In this figure, the background layer is the urban road network, the green circles represent bus stops, and the red circles stand for an actual bus trajectory.
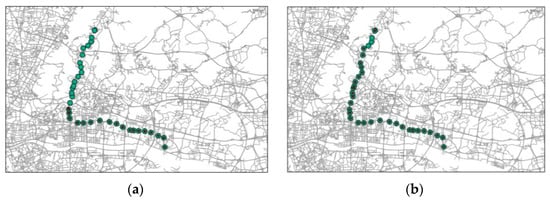
Figure 9.
A bus (xxx672) in Guangzhou deviated from its route versus driving on the route: (a) abnormal trajectory and (b) normal trajectory.
In Figure 9, the left side describes an abnormal trajectory, and the right side describes a normal trajectory. Both of them are generated by the same bus but in different trips. On the right side, the actual stop sequence generated by the bus is a part of the designated route. It means the bus did not drive strictly according to the designated route. On the left side, the actual stop sequence generated by the bus is equal to the scheduled route. Thus, it is a normal trajectory. In the abnormal trajectory, the bus changed its direction in the middle route and head back to the original stop in this trip.
Figure 10 depicts the result of the detection for a Shenzhen bus, and the bus’s identity is BS0***62D (we replaced the partial identity with *** to protect data privacy). In this figure, the background layer is the road network, the green circle represents a designated bus stop, and the red circle stands for the GPS point.
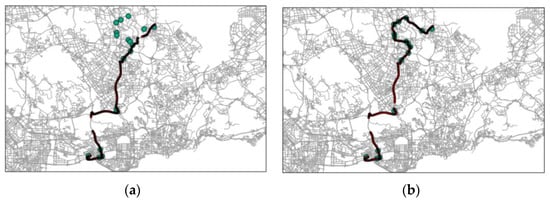
Figure 10.
A bus (BS0***62D) in Shenzhen deviated from its route versus driving on the route: (a) abnormal trajectory and (b) normal trajectory.
The left side describes an abnormal trajectory, and the right side describes a normal trajectory. Both of them are generated by the same bus in different trips. We can clearly see from the upper part of the subfigures that the actual stop sequence generated by the bus is obviously different from the designated stop sequence. It means the bus did not drive strictly according to the designated route, and the bus chose a different route in this area.
In the right side, the actual stop sequence generated by the bus is equal to the designated stop sequence. Thus, it is a normal trajectory. An observation needs to be pointed out is that both the normal and abnormal trajectories have a missing segment. In fact, this results from a tunnel passing through the mountain. The GPS device fails to read and transmit the positioning information.
Figure 11 and Figure 12 also show two additional abnormal trajectories for bus BS***91D and BS***70D, respectively. According to Figure 11, the abnormal trajectory is totally different from the designated route. Meanwhile, half of the abnormal trajectory in Figure 12 is the same as the designated route. In summary, the events of route deviation are diverse.
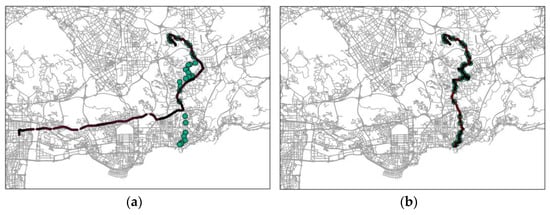
Figure 11.
A bus (BS***91D) in Shenzhen deviated from its route versus driving on the route: (a) abnormal trajectory and (b) normal trajectory.
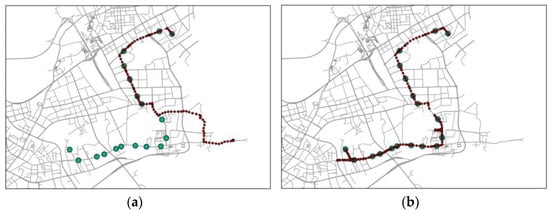
Figure 12.
A bus (BS***70D) in Shenzhen deviated from its route versus driving on the route: (a) abnormal trajectory and (b) normal trajectory.
In addition, we perform a group of experiments to validate the detection accuracy. Primary steps of each experiment are as follows: we firstly randomly selected 200 buses and a time range (one hour), and abstracted the corresponding GPS trajectory dataset. Secondly, we adopted the aforementioned simulators, Kafka and Flink, to detect these GPS trajectories in an online manner and collected the results. After ten repeats, we performed a statistical analysis on the result set for bus deviation from the route. The statistical results show that (1) the average proportion of deviating from the route is 8%, the minimum proportion is 5%, and the maximum proportion is 12% and (2) the average accuracy ratio of anomaly determination is 90.5%.
6.2. No-Stop upon Arrival
In this subsection, we analyzed other anomaly detection of bus trajectory. The anomaly is that a bus arrived at a designated stop but did not come to a halt. It depends on the stay time, which measures the time cost from the bus arrival time to departure time.
Figure 13 shows the stay times for all stops in a designated route. There are two trips produced by the same bus with identity BS350xxx. The red curve represents tripA, and the blue curve represents tripB. The green horizontal line stands for the time threshold with a value of six seconds. The x-axis stands for the stop sequence of the designated route, each label in x-axis is a bus stop. The y-axis is time cost, which represents the time it takes for a bus to pass a stop.
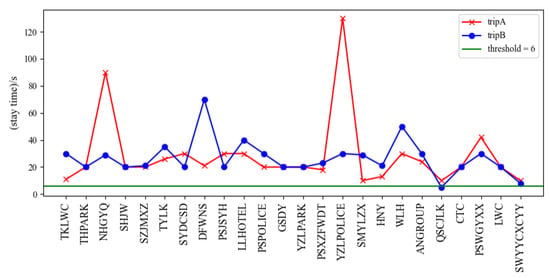
Figure 13.
Stay times of the stop sequence for different trips.
We determine the anomaly according to the value of the threshold. It is determined that the bus came to a halt at this stop if the corresponding stay time is larger than the threshold. Otherwise, it is determined that the bus did not come to a halt at this stop. Taking the tripB as an example, the stay time in stop QSCJLK is less than six seconds. Thus, we concluded that the bus BS350xxx arrived at but has not come to a complete halt at stop QSCJLK.
In addition, we perform a group of experiments to validate the detection accuracy. Steps of each experiment are as follows: we firstly randomly selected 200 buses and a time range (one hour), and abstracted the corresponding GPS trajectory dataset. Secondly, we adopted the aforementioned simulators, Kafka and Flink, to detect these GPS trajectories in an online manner and collected the results. After ten repeats, we performed a statistical analysis on the result set for bus deviation from the route. The statistical results show that (1) the average proportion of deviating from the route is 17.7%, the minimum proportion is 12.7%, and the maximum proportion is 22% and (2) the average accuracy ratio of anomaly determination is 89.3%.
It is obvious that the anomaly ratio of non-stop arrival is higher than that of other anomaly. The reason is that the bus driver realizes that there are neither passenger boarding nor alighting at stop A, so the bus driver decides not to halt at stop A.
6.3. Performance Analysis
In this subsection, we firstly introduce the interactions among different components in the pipeline-based solution. We secondly quantitatively analyze the sampling frequency of GPS records generated by 300 buses. We thirdly introduce the performance of Kafka and Flink, respectively.
Figure 8 depicts the interactions among different components in the pipeline-based solution. The data-source simulator works as a producer and submits GPS points to the pub/sub system Kafka. Kafka receives GPS records, saves them in memory, and notifies a group of long-time tasks launched by Flink to retrieve these GPS records. These long-time running tasks are designed to implement anomaly detection in a parallel way. They submit the anomaly events to the storage system. Two aspects in this workflow need to be further discuss. Firstly, Flink controls its own throughput, by which it measures how many GPS points Flink fetches from Kafka in a unit time. In detail, a task in Flink retrieves the next GPS point if it finished anomaly detection on the current GPS point. Thus, Flink’s throughput is not determined by Kafka’s workload. Secondly, the storage system provides services for a light-weight workload generated by Flink since anomalous event is very sparse in a complete bus trip. For example, there are only 25.7 anomalous events in all trips generated by 200 buses in one hour. Thus, the storage system is not the bottleneck in the pipeline-based solution.
In our experiments, we selected a GPS dataset produced by 300 buses in one hour to count how many GPS points were generated in one minute. Experimental result shows that the maximum, average, and minimum GPS points generated per minute are 1814, 1670, and 1204, respectively.
We conducted performance evaluation of the Kafka cluster with five nodes. The simulator continuously submits GPS points to Kafka cluster and we used throughput to measure the performance of Kafka. Experimental result shows that the maximum, average, and minimum GPS points Kafka can receive are 4.56 million/minute, 4.25 million/minute, and 3.96 million/minute, respectively. It means each core can receive 0.21 million GPS records per minute or 3540 GPS records per second on average.
We also analyzed the performance of Flink cluster with six nodes. We discuss its performance in two aspects. The first is the performance that how many GPS points does Flink retrieve from Kafka in a unit time. Experimental result shows that the maximum, average, and minimum GPS points Flink can retrieve from Kafka are 13,404 per minute, 11,115 per minute, and 10,405 per minute, respectively. It means each core can receive 520 GPS records per minute on average. The second is the time cost for a single anomaly detection, which employ LCSS algorithm to measure the similarity between the actual bus trajectory and the scheduled route. Experimental result shows that time costs of the 50%, 75%, and 95% percentile are 89 ms, 95 ms, and 103 ms, respectively.
In summary, the performance of Kafka cluster is much higher than the actual data transmitting requirement. Similarity, the performance of Flink cluster is higher than the actual data processing requirement.
6.4. A Case Study
The primary steps for deploying this solution are as follows:
Step 1: Setting up the solution. The first task is to establish the storage system, Flink cluster, and Kafka cluster. Next, configurable parameters like IP address and port are determined to ensure seamless connectivity between each component in the distributed environment.
Step 2: Initializing the clusters. The process involves setting up tables in the storage system to save anomaly events, configuring parallelization in Flink, creating a Kafka topic, and deciding the number of partitions within the topic to establish a message channel.
Step 3: Deploying the algorithms. A collection of algorithms is coded using Java and saved as a Java executable file called *.jar. Using a command line tool, the file is uploaded to the Flink cluster. Subsequently, a series of tasks start executing the workflow for detecting anomalies in continuous GPS trajectories.
Step 4: GPS redirection. It re-configures the original data collecting system to submit GPS records to the Kafka cluster.
Thus, this solution can perform real-time anomaly detection in bus trajectories and store the detected events in the system. It serves as the basis for decision-making applications downstream. For instance, if a deviation event occurs, it can promptly remind the driver to adhere strictly to the designated route or provide an explanation to avoid potential passenger complaints. The operator can optimize the bus scheduling strategy if many non-stop events are detected on a designed route and there are no passengers waiting for buses.
7. Conclusions and Future Works
7.1. Conclusions
This article proposes a streaming-based solution to perform anomaly detection for real-time bus trajectory. The solution utilizes the message middleware Kafka and the stream computing engine Flink to simulate real production environments. It can detect two types of anomalies for bus trajectories. The first is a bus deviates from the scheduled route during its trip, and the second is a bus arrives at a designated stop in its route but does not come to a halt. The detection process for abnormal trajectories is controlled by using Complex Event Processing (CEP) mechanisms to identify bus arrival events. The method employs state management to store the sequences of bus stoppages and utilizes the Longest Common Subsequence (LCSS) algorithm to measure trajectory similarity between the actual bus trajectory and the designated route. The similarity score is used to determine whether the trajectory is abnormal or not. This solution facilitates seamless integration of the detection algorithms with the distributed streaming environment, providing the capability to handle large-scale continuous GPS trajectories in a real-time way.
We validated this solution on Flink with six virtual machines using a large-scale real dataset. The experimental results show that (1) each core can handle anomaly detection on 12.5 buses simultaneously and (2) the detection accuracies of the two anomalies are 90.5% and 89.3%, respectively. Considering Flink was designed with good scalability and the tasks being executed in a parallel way. We can utilize more CPU cores and memory to achieve higher capacity.
7.2. Future Works
Although this approach provides validated solution to perform anomaly detection for bus trajectory in a real-time way, there are still two limitations that need to be improved. The first is the performance, and the second is the detection accuracy.
On the one hand, each core can currently handle 12.5 buses simultaneously. There is still room to improve the performance. We will utilize spatial–temporal partitioning and indexing to efficiently organize trajectories. Additionally, we will implement an incremental algorithm for similarity measurement. On the other hand, the current method for identifying non-stop arrivals is a rule-based algorithm. The next step is to train and deploy classification model to enhance the accuracy.
By addressing these limitations, we will obtain a higher performance/cost solution than that of current version.
Author Contributions
Conceptualization, W.X. and X.W.; methodology, Q.Z., W.X. and X.W.; software, Q.Z.; validation; investigation, W.X.; writing—original draft preparation, Q.Z., W.X. and W.X.; writing—review and editing, Q.Z., W.X. and X.W.; visualization, Q.Z. and F.Q. All authors have read and agreed to the published version of the manuscript.
Funding
This research was funded by the National Natural Science Foundation of China (NSFC) (number: 61862066).
Institutional Review Board Statement
Not applicable.
Informed Consent Statement
Not applicable.
Data Availability Statement
The data presented in this study are available on request from the corresponding author.
Conflicts of Interest
The authors declare no conflict of interest.
References
- Taniarza, N.; Akbar, S. Anomalous trajectory detection from taxi GPS traces using combination of iBAT and DTW. In Proceedings of the 2017 6th International Conference on Electrical Engineering and Informatics (ICEEI), Kedah, Malaysia, 25–27 November 2017; pp. 1–5. [Google Scholar]
- Barucija, E.; Mujcinovic, A.; Muhovic, B.; Zunic, E.; Donko, D. Data-driven approach for anomaly detection of real GPS trajectory data. In Proceedings of the 2019 XXVII International Conference on Information, Communication and Automation Technologies (ICAT), Sarajevo, Bosnia and Herzegovina, 20–23 October 2019; pp. 1–6. [Google Scholar]
- Fu, C.; Zhou, Y.; Xu, C.; Cui, H. Spatial analysis of taxi speeding event using GPS trajectory data. In Proceedings of the 2019 IEEE Intelligent Transportation Systems Conference (ITSC), Auckland, New Zealand, 27–30 October 2019; pp. 122–127. [Google Scholar]
- Cruz, M.; Barbosa, L. Learning GPS Point Representations to Detect Anomalous Bus Trajectories. IEEE Access 2020, 8, 229006–229017. [Google Scholar] [CrossRef]
- Mao, J.Y.; Wu, H.; Sun, W.W. Vehicle Trajectory Anomaly Detection in Road Network via Markov Decision Process. Chin. J. Comput. 2018, 41, 1928–1942. [Google Scholar]
- Kreps, J.; Narkhede, N.; Rao, J. Kafka: A distributed messaging system for log processing. Proc. NetDB 2011, 11, 1–7. [Google Scholar]
- Carbone, P.; Katsifodimos, A.; Ewen, S.; Markl, V.; Haridi, S.; Tzoumas, K. Apache flink: Stream and batch processing in a single engine. Bull. Tech. Comm. Data Eng. 2015, 36, 28–38. [Google Scholar]
- Zheng, Y. Trajectory data mining: An overview. ACM Trans. Intell. Syst. Technol. 2015, 6, 1–41. [Google Scholar] [CrossRef]
- Chen, Y.; Yu, J.; Gao, Y. Detecting trajectory outliers based on spark. In Proceedings of the 2018 25th International Conference on Geoinformatic, Buffalo, NY, USA, 2–4 August 2017; pp. 1–5. [Google Scholar]
- Han, X.; Grubenmann, T.; Cheng, R.; Wong, S.C.; Li, X.; Sun, W. Traffic incident detection: A trajectory-based approach. In Proceedings of the 2020 IEEE 36th International Conference on Data Engineering (ICDE), Dallas, TX, USA, 20–24 April 2020; pp. 1866–1869. [Google Scholar]
- Hu, J.Y.; Li, Y.H.; Tang, C. Anomaly detection of operation trajectory of vehicles in port. Comput. Appl. Softw. 2022, 39, 71–78, 125. [Google Scholar]
- Danda, S.; Zhang, J.; Tao, X.; Chun-Wei, J.; Zhang, W. Context-aware adaptive outlier detection in trajectory data. In Proceedings of the 2020 IEEE International Conference on Big Data (Big Data), Atlanta, GA, USA, 10–13 December 2020; pp. 5655–5657. [Google Scholar]
- Aoki, S.; Sezaki, K.; Yuan, N.J.; Xie, X. Busbeat: Early event detection with real-time bus GPS trajectories. IEEE Trans. Big Data 2018, 7, 371–382. [Google Scholar] [CrossRef]
- Qian, S.; Cheng, B.; Cao, J.; Xue, G.; Zhu, Y.; Yu, J.; Li, M.; Zhang, T. Detecting taxi trajectory anomaly based on spatio-temporal relations. IEEE Trans. Intell. Transp. Syst. 2021, 23, 6883–6894. [Google Scholar] [CrossRef]
- Belhadi, A.; Djenouri, Y.; Srivastava, G.; Cano, A.; Lin, J.C. Hybrid group anomaly detection for sequence data: Application to trajectory data analytics. IEEE Trans. Intell. Transp. Syst. 2021, 23, 9346–9357. [Google Scholar] [CrossRef]
- Zhao, J.; Sartipi, M. Automatic Identification of Anomalous Driving Events from Trajectory Data. In Proceedings of the 2022 IEEE 25th International Conference on Intelligent Transportation Systems (ITSC), Macau, China, 8–12 October 2022; pp. 851–856. [Google Scholar]
- Xia, Y.; Zhang, A. Vehicle abnormal trajectory detection method based on fusing temporal and spatial features. J. Chongging Univ. Posts Telecommun. 2023, 35, 202–209. [Google Scholar]
- Zhang, T.; Zhao, S.; Chen, J. Ship trajectory outlier detection service system based on collaborative computing. In Proceedings of the 2018 IEEE World Congress on Services (SERVICES), San Francisco, CA, USA, 2–7 July 2018; pp. 15–16. [Google Scholar]
- Lu, H.; Liu, Y.; Fei, Z.; Guan, C. An outlier detection algorithm based on cross-correlation analysis for time series dataset. IEEE Access 2018, 6, 53593–53610. [Google Scholar] [CrossRef]
- Gharaei, R.H.; Nezamabadi-Pour, H. RDOD: A Robust Distance-based Technique for Outlier Detection. In Proceedings of the 2022 30th International Conference on Electrical Engineering (ICEE), Seoul, Republic of Korea, 17–19 May 2022; pp. 885–890. [Google Scholar]
- Flanagan, K.; Fallon, E.; Connolly, P.; Awad, A. Network anomaly detection in time series using distance based outlier detection with cluster density analysis. In Proceedings of the 2017 Internet Technologies and Applications (ITA), Wrexham, UK, 12–15 September 2017; pp. 116–121. [Google Scholar]
- Agrawal, S.; Sonbhadra, S.K.; Agarwal, S. Favour prediction of Taxi services using real-time visualization. In Proceedings of the 2018 International Conference on Advances in Computing, Communications and Informatics (ICACCI), Bangalore, India, 19–22 September 2018; pp. 2276–2282. [Google Scholar]
- Chen, L.; Gao, Y.; Fang, Z.; Miao, X.; Jensen, C.S.; Guo, C. Real-time distributed co-movement pattern detection on streaming trajectories. Proc. VLDB Endow. 2019, 12, 1208–1220. [Google Scholar] [CrossRef]
- Hu, L.; Zhang, F.; Qin, M.; Fu, Z.; Chen, Z.; Du, Z.; Liu, R. A dynamic pyramid tilling method for traffic data stream based on Flink. IEEE Trans. Intell. Transp. Syst. 2021, 23, 6679–6688. [Google Scholar] [CrossRef]
- Fang, Z.; Chen, L.; Gao, Y.; Pan, L.; Jensen, C.S. Dragoon: A hybrid and efficient big trajectory management system for offline and online analytics. VLDB J. 2021, 30, 287–310. [Google Scholar] [CrossRef]
- Shaikh, S.A.; Kitagawa, H.; Matono, A.; Mariam, K.; Kim, K.S. GeoFlink: An Efficient and Scalable Spatial Data Stream Management System. IEEE Access 2022, 10, 24909–24935. [Google Scholar] [CrossRef]
- Pan, Z.; Chao, P.; Fang, J.; Chen, W.; Xu, J.; Zhao, L. Garden: A real-time processing framework for continuous top-k trajectory similarity search. Knowl. Inf. Syst. 2023, 65, 3777–3805. [Google Scholar] [CrossRef]
- Liu, K.; Wang, P.; Zhang, J.; Fu, Y.; Das, S.K. Modeling the Interaction Coupling of Multi-View Spatiotemporal Contexts for Destination Prediction. In Proceedings of the 2018 SIAM International Conference on Data Mining (SDM), San Diego, CA, USA, 3–5 May 2018. [Google Scholar] [CrossRef][Green Version]
- Jin, G.Y.; Liang, Y.X.; Fang, Y.C.; Huang, J.C.; Zhang, J.B.; Zheng, Y. Spatio-Temporal Graph Neural Networks for Predictive Learning in Urban Computing: A Survey. arXiv 2023, arXiv:2303.14483. [Google Scholar]
- Wang, Q.; Yan, B.; Su, H.; Zheng, H. Anomaly detection for time series data stream. In Proceedings of the 2021 IEEE 6th International Conference on Big Data Analytics (ICBDA), Xiamen, China, 5–8 March 2021; pp. 118–122. [Google Scholar]
Disclaimer/Publisher’s Note: The statements, opinions and data contained in all publications are solely those of the individual author(s) and contributor(s) and not of MDPI and/or the editor(s). MDPI and/or the editor(s) disclaim responsibility for any injury to people or property resulting from any ideas, methods, instructions or products referred to in the content. |
© 2023 by the authors. Licensee MDPI, Basel, Switzerland. This article is an open access article distributed under the terms and conditions of the Creative Commons Attribution (CC BY) license (https://creativecommons.org/licenses/by/4.0/).